
COVID-19 Lockdown and Implications for Household Food Security in Zambia: Quality of Diet or Economic Vulnerability?


Abstract
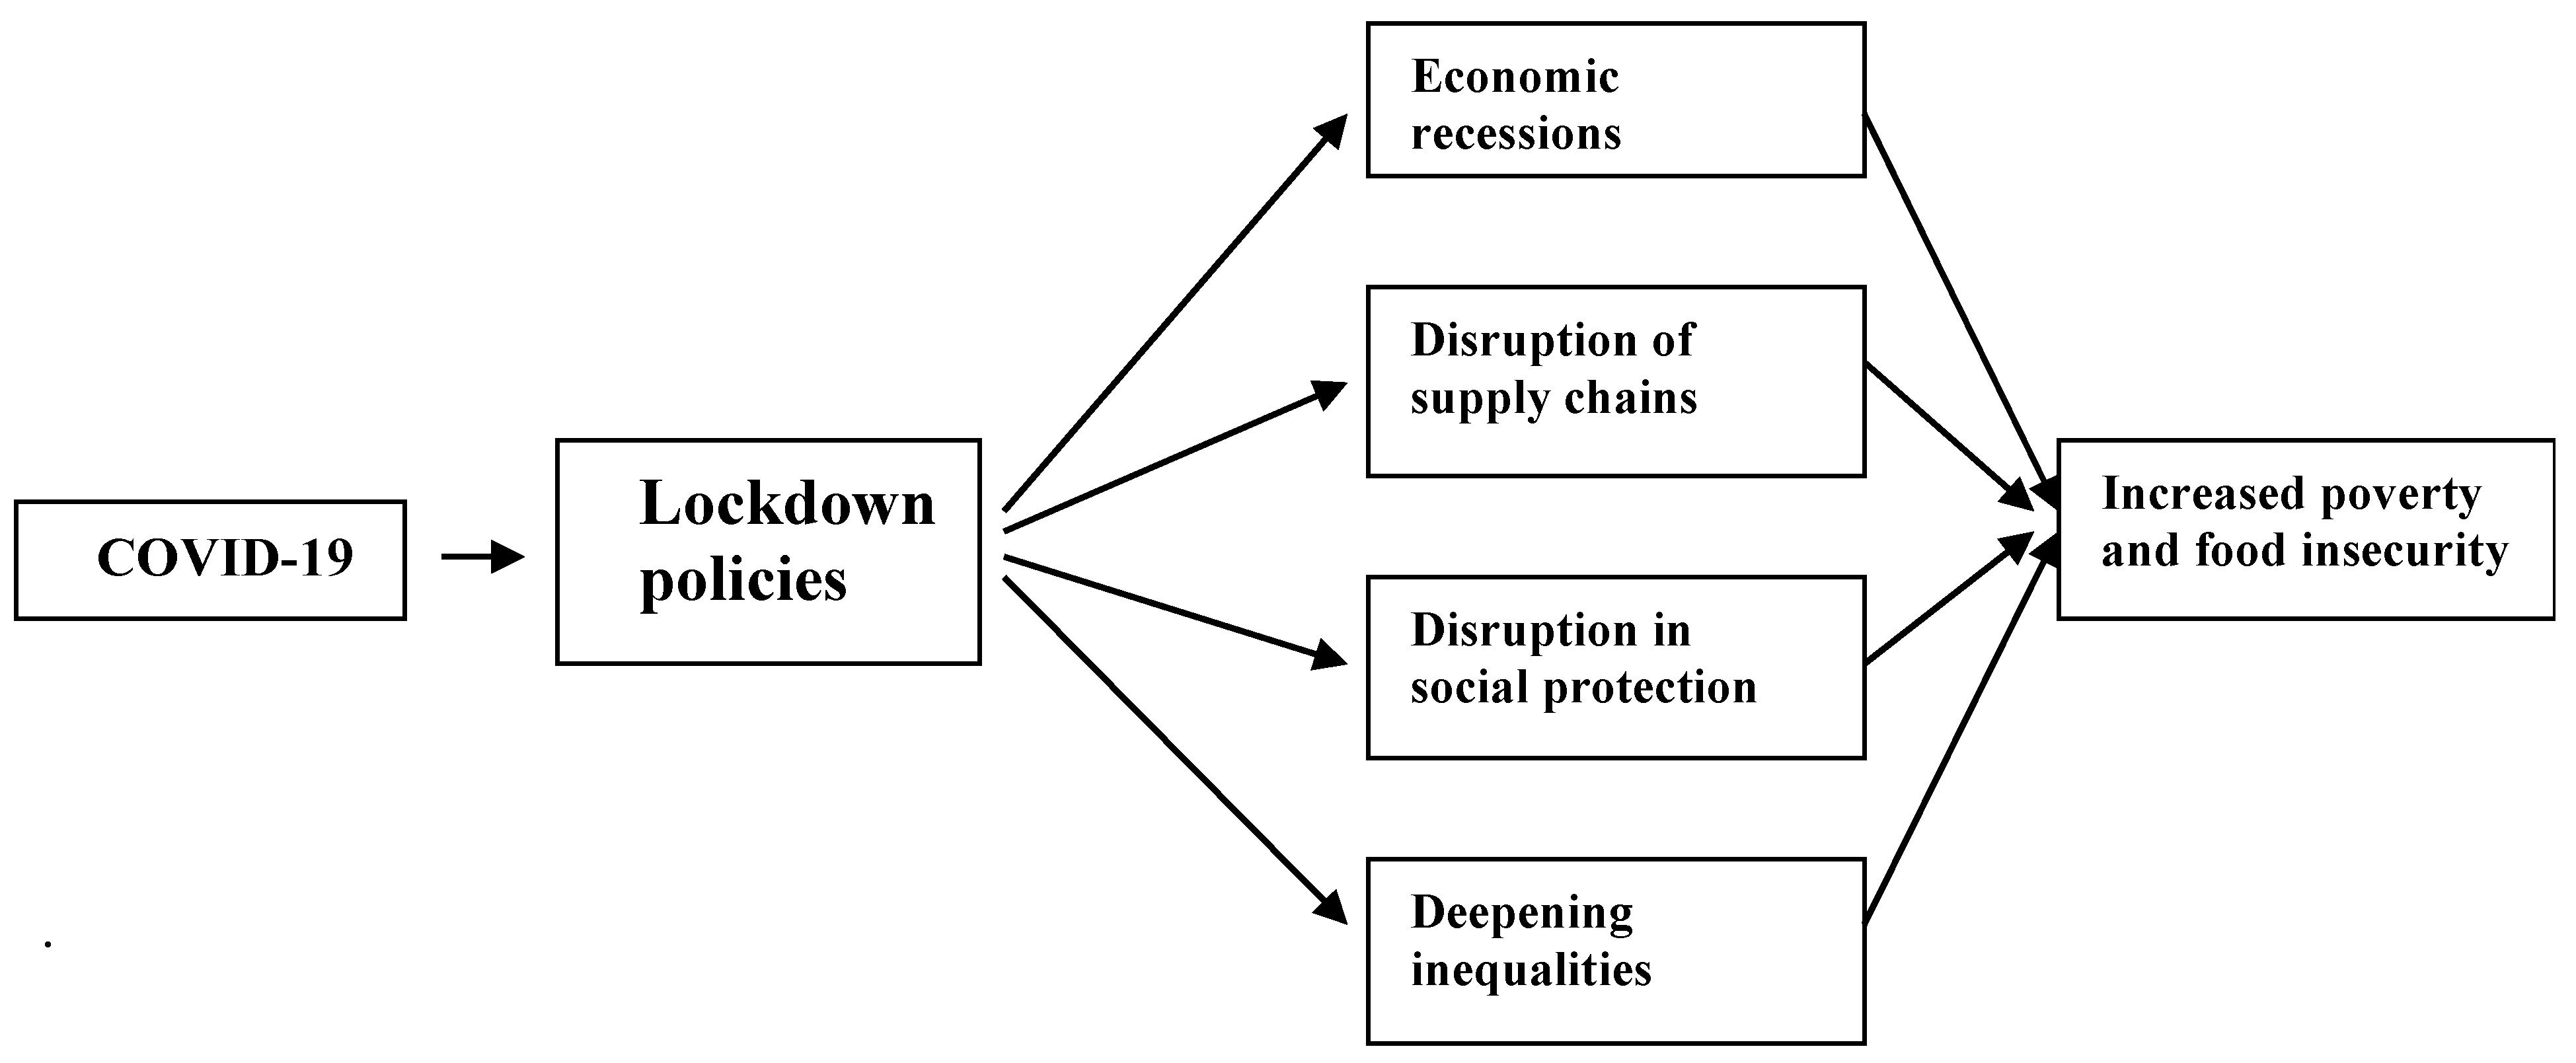
1. Introduction
1.1. Conceptual Framework and Related Literature
2. Methodology
2.1. Data
- ≥75% = very vulnerable and consequently food insecure.
- 65–74.9% = high food insecurity.
- 50–64.9% = medium food insecurity.
- ≤49.9% = low food insecurity.
- ≤3 food groups: low dietary diversity.
- 4–5 food groups: medium dietary diversity.
- 6–12 groups: high dietary diversity.
2.2. Models for Assessing Changes in and Determinants of Food Security
2.2.1. Coarsened Exact Matching Approach
2.2.2. Mean Difference Tests
2.2.3. Multinomial Logistic Regression
3. Results and Discussion
3.1. Descriptive Statistics
3.2. COVID-19 Lockdowns and Household Food Insecurity
4. Conclusions
Author Contributions
Funding
Institutional Review Board Statement
Informed Consent Statement
Data Availability Statement
Acknowledgments
Conflicts of Interest
Abbreviations
| AERC | African Economic Research Consortium |
| AGRA | Alliance for a Green Revolution in Africa |
| BMJ | British Medical Journal |
| CEM | Coarsened Exact Matching |
| COVID-19 | Coronavirus Disease-19 |
| CUTS | Consumer Unity & Trust Society |
| DC | District Commissioner |
| FAO | Food and Agriculture Organization |
| GHI | Global Hunger Index |
| GRZ | Government of the Republic of Zambia |
| HDDS | Household Dietary Diversity Score |
| HFPS | High-Frequency Phone Surveys |
| HHFES | Household Food Expenditure Share |
| HLPE | High-Level Panel of Experts on Food Security and Nutrition |
| IAPRI | Indaba Agricultural Policy Research Institute |
| IFAD | International Fund for Agricultural Development |
| IFPRI | International Food Policy Research Institute |
| IJSEI | International Journal of Social Economics and Inequality |
| JEL | Journal of Economic Literature |
| LCMS | Living Conditions Monitoring Survey |
| MA | Ministry of Agriculture |
| MIT | Massachusetts Institute of Technology |
| SEIA | Socio-economic Impact Assessment |
| SPSS | Statistical Package for the Social Sciences |
| SSRN | Social Science Research Network |
| STATA | Data Analysis and Statistical Software |
| UNDP | United Nations Development Programme |
| USA | United States of America |
| WFP | World Food Programme |
| WHO | World Health Organization |
| ZNPHI | Zambia National Public Health Institute |
Appendix A

| Imbalance Test (Pre-Match) | L1 | Mean Difference | Min | 25% | 50% | 75% | Max |
|---|---|---|---|---|---|---|---|
| Univariate imbalance: | |||||||
| Household head age | 0.02694 | −0.04248 | 0 | 0 | 0 | 0 | 0 |
| Sex of household head | 0.05391 | −0.05391 | 0 | −1 | 0 | 0 | 0 |
| Marital status | 0.03726 | −0.01645 | 0 | 0 | 0 | 0 | 0 |
| Household head education | 0.07068 | −0.15877 | 0 | 0 | 0 | 0 | 0 |
| Region | 0.03837 | 0.03837 | 0 | 0 | 0 | 0 | 0 |
| Radio | 0.02201 | 0.02201 | 0 | 1 | 0 | 0 | 0 |
| Bicycle | 0.00374 | 0.00374 | 0 | 0 | 0 | 0 | 0 |
| Multivariate L1 distance: | 0.16607897 | ||||||
| CEM * | |||||||
| Univariate imbalance: | |||||||
| Household head age | 0 | 0 | 0 | 0 | 0 | 0 | 0 |
| Sex of household head | 0 | 0 | 0 | 0 | 0 | 0 | 0 |
| Marital status | 0 | 0 | 0 | 0 | 0 | 0 | 0 |
| Household head education | 0 | 0 | 0 | 0 | 0 | 0 | 0 |
| Region | 0 | 0 | 0 | 0 | 0 | 0 | 0 |
| Radio | 0 | 0 | 0 | 0 | 0 | 0 | 0 |
| Bicycle | 0 | 0 | 0 | 0 | 0 | 0 | 0 |
| Multivariate L1 distance: | 0 |
| 0 | 1 | |
|---|---|---|
| All | 11,810 | 10,200 |
| Matched | 8968 | 8968 |
| Unmatched | 2842 | 1232 |
References
- Aaron, A., Baidya, A., Wang, J., Chan, C., Wetzler, E., & Kang, Y. (2021). The early impacts of COVID-19 on food security and livelihood in Vietnam. Frontiers in Sustainable Food Systems, 5, 739140. [Google Scholar]
- Abay, K. A., Berhane, G., Hoddinott, J., & Tafere, K. (2023). COVID-19 and food security in Ethiopia: Do social protection programs protect? Economic Development and Cultural Change, 71(2), 373–402. [Google Scholar]
- Akbar, A., Darma, R., Fahmid, I. M., & Irawan, A. (2023). Determinants of household food security during the COVID-19 pandemic in Indonesia. Sustainability, 15(5), 4131. [Google Scholar] [CrossRef]
- Allen, L. H., Black, A. K., Backstrand, J. R., Pelto, G. H., Ely, R. D., Molina, E., & Chávez, A. (1991). An analytical approach for exploring the importance of dietary quality versus quantity in the growth of Mexican children. Food and Nutrition Bulletin, 13(2), 1–9. [Google Scholar]
- Ashford, N. A., Hall, R. P., Arango-Quiroga, J., Metaxas, K. A., & Showalter, A. L. (2020). Addressing inequality: The first step beyond COVID-19 and towards sustainability. Sustainability, 12(13), 5404. [Google Scholar] [CrossRef]
- Barrett, C. B. (2020). Actions now can curb food systems fallout from COVID-19. Nature Food, 1(6), 319–320. [Google Scholar] [PubMed]
- Béné, C., Bakker, D., Chavarro, M. J., Even, B., Melo, J., & Sonneveld, A. (2021). Global assessment of the impacts of COVID-19 on food security. Global Food Security, 31, 100575. [Google Scholar]
- Blackwell, M., Iacus, S., King, G., & Porro, G. (2009). Cem: Coarsened exact matching in Stata. The Stata Journal, 9(4), 524–546. [Google Scholar]
- Clapp, J., & Moseley, W. G. (2020). This food crisis is different: COVID-19 and the fragility of the neoliberal food security order. The Journal of Peasant Studies, 47(7), 1393–1417. [Google Scholar]
- Data4Diets. (2023). Building blocks for diet-related food security analysis, Version 2.0. Tufts University. Available online: https://inddex.nutrition.tufts.edu/data4diets (accessed on 1 January 2024).
- Devereux, S., Béné, C., & Hoddinott, J. (2020). Conceptualising COVID-19’s impacts on household food security. Food Security, 12(4), 769–772. [Google Scholar]
- Diao, X., Rosenbach, G., Spielman, D. J., & Aragie, E. (2021). Assessing the impacts of COVID-19 on household incomes and poverty in Rwanda: A microsimulation approach (Vol. 2). Intl Food Policy Res Inst. [Google Scholar]
- FAO. (1996). Rome declaration on world food security and World Food Summit plan of action. FAO. [Google Scholar]
- FAO. (2013). Proceedings of the international scientific symposium on food and nutrition security information: From valid measurement to effective decision making. FAO. [Google Scholar]
- FAO. (2020). Gendered impacts of COVID-19 and equitable policy responses in agriculture, food security and nutrition. FAO. [Google Scholar]
- FAO, IFAD, UNICEF, WHO & WFP. (2019). The state of food security and nutrition in the world 2019. Safeguarding against economic slowdowns and downturns. FAO. [Google Scholar]
- FAO & WFP. (2020). FAO-WFP early warning analysis of acute food insecurity hotspots. FAO & WFP. [Google Scholar]
- Finn, A., & Zadel, A. (2020). Monitoring COVID-19 impacts on households in Zambia (Report No. 1). World Bank Group. [Google Scholar]
- Ghosh-Jerath, S., Dhasmana, A., Nair, S. C., & Kapoor, R. (2024). Impact of the second wave of COVID-19 pandemic on food security among Ho indigenous community of Jharkhand, India. Agriculture & food security, 13(1), 17. [Google Scholar]
- Giacoman, C., Herrera, M. S., & Arancibia, P. A. (2021). Household food insecurity before and during the COVID-19 pandemic in Chile. Public Health, 198, 332–339. [Google Scholar]
- Greifer, N., & Stuart, E. A. (2021). Matching methods for confounder adjustment: An addition to the epidemiologist’s toolbox. Epidemiologic Reviews, 43(1), 118–129. [Google Scholar]
- GRZ. (2020). Business survey report the impact of COVID-19 on Zambian enterprises. Available online: https://www.undp.org/sites/g/files/zskgke326/files/migration/zm/UNDP-Revised-Business-Survey-Report-03-07-2020-CLEAN.pdf (accessed on 1 January 2024).
- Hamadani, J. D., Hasan, M. I., Baldi, A. J., Hossain, S. J., Shiraji, S., Bhuiyan, M. S. A., Mehrin, S. F., Fisher, J., Tofail, F., & Tipu, S. M. M. U. (2020). Immediate impact of stay-at-home orders to control COVID-19 transmission on socioeconomic conditions, food insecurity, mental health, and intimate partner violence in Bangladeshi women and their families: An interrupted time series. The Lancet Global Health, 8(11), e1380–e1389. [Google Scholar] [PubMed]
- Hangoma, P., Hachhethu, K., Passeri, S., Norheim, O. F., Rivers, J., & Mæstad, O. (2024). Short- and long-term food insecurity and policy responses in pandemics: Panel data evidence from COVID-19 in low- and middle-income countries. World Development, 175, 106479. [Google Scholar] [CrossRef]
- Hatløy, A., Hallund, J., Diarra, M. M., & Oshaug, A. (2000). Food variety, socioeconomic status and nutritional status in urban and rural areas in Koutiala (Mali). Public Health Nutrition, 3(1), 57–65. [Google Scholar]
- Headey, D., Heidkamp, R., Osendarp, S., Ruel, M., Scott, N., Black, R., Shekar, M., Bouis, H., Flory, A., & Haddad, L. (2020). Impacts of COVID-19 on childhood malnutrition and nutrition-related mortality. The Lancet, 396(10250), 519–521. [Google Scholar]
- HLPE. (2020). Food security and nutrition: Building a global narrative towards 2030. HLPE. [Google Scholar]
- Hughes, K. A., Priyadarshini, P., Sharma, H., Lissah, S., Chorran, T., Meinzen-Dick, R., Dogra, A., Cook, N., & Andersson, K. (2022). Can restoration of the commons reduce rural vulnerability? A Quasi-experimental comparison of COVID-19 livelihood-based coping strategies among rural households in three Indian States. International Journal of the Commons, 16(1), 189–208. [Google Scholar]
- Huynh, N., Nguyen, D., & Dao, A. (2021). Sectoral performance and the government interventions during COVID-19 pandemic: Australian evidence. Journal of Risk and Financial Management, 14(4), 178. [Google Scholar]
- Iacus, S. M., King, G., & Porro, G. (2012). Causal inference without balance checking: Coarsened exact matching. Political Analysis, 20(1), 1–24. [Google Scholar]
- Kabisa, M., Subakanya, M., Malambo, M., Chapoto, A., Maredia, M., & Tschirley, D. (2021). Impact of COVID-19 on household incomes and food consumption—The Zambian case. Michigan State University. Available online: https://ageconsearch.umn.edu/record/320703 (accessed on 1 January 2023).
- Kansiime, M. K., Tambo, J. A., Mugambi, I., Bundi, M., Kara, A., & Owuor, C. (2021). COVID-19 implications on household income and food security in Kenya and Uganda: Findings from a rapid assessment. World Development, 137, 105199. [Google Scholar]
- Kennedy, E. (2002). The new faces of food insecurity and hunger. Nutrition Today, 37(4), 154. [Google Scholar] [PubMed]
- Kent, K., Murray, S., Penrose, B., Auckland, S., Visentin, D., Godrich, S., & Lester, E. (2020). Prevalence and socio-demographic predictors of food insecurity in Australia during the COVID-19 pandemic. Nutrients, 12(9), 2682. [Google Scholar] [CrossRef]
- Klassen, S., & Murphy, S. (2020). Equity as both a means and an end: Lessons for resilient food systems from COVID-19. World Development, 136, 105104. [Google Scholar] [PubMed]
- Laborde Debucquet, D., Martin, W., & Vos, R. (2020). Poverty and food insecurity could grow dramatically as COVID-19 spreads. International Food Policy Research Institute (IFPRI). [Google Scholar]
- Malambo, M., Singogo, F., Kabisa, M., & Ngoma, H. (2020). Balancing health and economic livelihoods: Policy responses to the COVID-19 pandemic in Zambia. International Food Policy Research Institute (IFPRI). [Google Scholar]
- Matenga, C., & Hichaambwa, M. (2021). A multi-phase assessment of the effects of COVID-19 on food systems and rural livelihoods in Zambia. Available online: https://hdl.handle.net/20.500.12413/16990 (accessed on 1 June 2023).
- Menard, S. W. (2010). Logistic regression: From introductory to advanced concepts and applications. Sage. [Google Scholar]
- Mofya, R., Mulako, K., Thelma, N.-K., Bangwe, N., & Fwasa, S. (2020). Monitoring of the effect of COVID-19 on food security and nutrition, 1st bi-monthly phone survey report, scaling up nutrition learning and evaluation. Indaba Agricultural Policy Research Institute (IAPRI). [Google Scholar]
- Nicola, M., Alsafi, Z., Sohrabi, C., Kerwan, A., Al-Jabir, A., Iosifidis, C., Agha, M., & Agha, R. (2020). The socio-economic implications of the coronavirus pandemic (COVID-19): A review. International Journal of Surgery, 78, 185–193. [Google Scholar] [PubMed]
- Obi, S. E., Yunusa, T., Ezeogueri-Oyewole, A. N., Sekpe, S. S., Egwemi, E., & Isiaka, A. S. (2020). The socio-economic impact of COVID-19 on the economic activities of selected states in Nigeria. Indonesian Journal of Social and Environmental Issues (IJSEI), 1(2), 39–47. [Google Scholar]
- Onyango, E. O., Crush, J., & Owuor, S. (2021). Preparing for COVID-19: Household food insecurity and vulnerability to shocks in Nairobi, Kenya. PLoS ONE, 16(11), e0259139. [Google Scholar]
- Pan, K., & Yue, X.-G. (2022). Multidimensional effect of COVID-19 on the economy: Evidence from survey data. Economic Research-Ekonomska Istraživanja, 35(1), 1658–1685. [Google Scholar]
- Pérez-Escamilla, R., Cunningham, K., & Moran, V. H. (2020). COVID-19 and maternal and child food and nutrition insecurity: A complex syndemic. In Maternal & child nutrition (Vol. 16, Issue 3, p. e13036). Wiley Online Library. [Google Scholar]
- Picchioni, F., Goulao, L. F., & Roberfroid, D. (2022). The impact of COVID-19 on diet quality, food security and nutrition in low and middle income countries: A systematic review of the evidence. Clinical Nutrition, 41(12), 2955–2964. [Google Scholar]
- Rao, S., Yajnik, C. S., Kanade, A., Fall, C. H. D., Margetts, B. M., Jackson, A. A., Shier, R., Joshi, S., Rege, S., & Lubree, H. (2001). Intake of micronutrient-rich foods in rural Indian mothers is associated with the size of their babies at birth: Pune Maternal Nutrition Study. The Journal of Nutrition, 131(4), 1217–1224. [Google Scholar]
- Reimold, A. E., Grummon, A. H., Taillie, L. S., Brewer, N. T., Rimm, E. B., & Hall, M. G. (2021). Barriers and facilitators to achieving food security during the COVID-19 pandemic. Preventive Medicine Reports, 23, 101500. [Google Scholar]
- Samuel, F. O., Eyinla, T. E., Oluwaseun, A., Leshi, O. O., Brai, B. I. C., & Afolabi, W. A. O. (2021). Food access and experience of food insecurity in Nigerian households during the COVID-19 lockdown. Food and Nutrition Sciences, 12(11), 1062–1072. [Google Scholar]
- Savary, S., Akter, S., Almekinders, C., Harris, J., Korsten, L., Rötter, R., Waddington, S., & Watson, D. (2020). Mapping disruption and resilience mechanisms in food systems. Food Security, 12, 695–717. [Google Scholar]
- Shahzad, M. A., Razzaq, A., Wang, L., Zhou, Y., & Qin, S. (2024). Impact of COVID-19 on dietary diversity and food security in Pakistan: A comprehensive analysis. International Journal of Disaster Risk Reduction, 110, 104642. [Google Scholar] [CrossRef]
- Siche, R. (2020). What is the impact of COVID-19 disease on agriculture? Scientia Agropecuaria, 11(1), 3–6. [Google Scholar]
- Sohel, M. S., Shi, G., Zaman, N. T., Hossain, B., Halimuzzaman, M., Akintunde, T. Y., & Liu, H. (2022). Understanding the food insecurity and coping strategies of indigenous households during COVID-19 crisis in Chittagong hill tracts, Bangladesh: A qualitative study. Foods, 11(19), 3103. [Google Scholar] [CrossRef]
- Swindale, A., & Bilinsky, P. (2006). Development of a universally applicable household food insecurity measurement tool: Process, current status, and outstanding issues. The Journal of Nutrition, 136(5), 1449S–1452S. [Google Scholar]
- Syafiq, A., Fikawati, S., & Gemily, S. C. (2022). Household food security during the COVID-19 pandemic in urban and semi-urban areas in Indonesia. Journal of Health, Population and Nutrition, 41(1), 4. [Google Scholar]
- Torero, M. (2020). Prepare food systems for a long-haul fight against COVID-19. In COVID-19 and global food security (Chapter 27, pp. 118–121). International Food Policy Research Institute. Available online: https://ideas.repec.org/h/fpr/ifpric/133816.html (accessed on 1 January 2023).
- Von Grebmer, K., Bernstein, J., Hammond, L., Patterson, F., Klaus, L., Fahlbusch, J., Towey, O., Foley, S. G. C., Eckstrom, K., & Fritschel, H. (2018). 2018 global hunger index: Forced migration and hunger. Concern Worldwide. [Google Scholar]
- WHO. (2020). Gender and COVID-19: Advocacy brief. WHO. [Google Scholar]
- Wooldridge, J. M. (2002). Econometric analysis of cross section and panel data (Vol. 108, Issue 2, pp. 245–254). MIT Press. [Google Scholar]
- World Bank. (2020). Global economic prospects, June 2020. World Bank. [Google Scholar]
| Variables | 2015 (n = 8968) Pre-COVID-19 Period | 2021 (n = 8650) Within COVID-19 Period | ||||
|---|---|---|---|---|---|---|
| Mean/(%) | St. Dev | Mean/(%) | St. Dev | Difference | S.E | |
| Food expenditure share | 53.9 | 19.5 | 61.5 | 13.4 | 7.6 *** | 0.250 |
| Food expenditure share categories | ||||||
| 16.4 | 37.1 | 16.8 | 37.5 | 0.3 | 0.006 |
| 15.7 | 36.4 | 23.9 | 42.6 | 8.1 *** | 0.006 |
| 25.9 | 43.8 | 40.7 | 49.1 | 14.7 *** | 0.007 |
| 41.8 | 49.3 | 18.7 | 39.0 | −23.2 *** | 0.007 |
| Household dietary diversity score | 7.1 | 2.5 | 8.2 | 2.3 | 1.1 *** | 0.036 |
| Household dietary diversity score (categories) | ||||||
| 8.0 | 27.0 | 2.8 | 16.5 | −5.1 *** | 0.003 |
| 18.6 | 38.9 | 10.4 | 30.5 | −8.2 *** | 0.005 |
| 73.3 | 44.2 | 86.8 | 33.8 | 13.3 *** | 0.006 |
| Sex of household head (male = 1) | 75.0 | 43.3 | 75.0 | 43.30 | 0.0 | 0.007 |
| Household head’s age | 43.0 | 14.5 | 43.0 | 14.8 | 0.0 | 0.219 |
| Household size | 5.1 | 2.6 | 4.9 | 2.4 | 0.3 *** | 0.038 |
| Household head’s highest level of education | ||||||
| 9.4 | 28.7 | 9.1 | 28.7 | 0.0 | 0.004 |
| 37.3 | 48.3 | 37.4 | 48.3 | 0.0 | 0.007 |
| 42.4 | 49.4 | 42.4 | 49.4 | 0.0 | 0.008 |
| 11.1 | 31.4 | 11.1 | 31.4 | 0.0 | 0.005 |
| Marital status | ||||||
| 6.1 | 24.0 | 6.1 | 24.0 | 0.0 | 0.004 |
| 71.7 | 45.0 | 71.7 | 45.0 | 0.0 | 0.007 |
| 22.2 | 41.5 | 22.2 | 41.5 | 0.0 | 0.006 |
| Region (Rural = 1) | 58.0 | 49.4 | 58.0 | 49.4 | 0.0 | 0.008 |
| Expenditure quintiles | ||||||
| 31.8 | 46.8 | 8.7 | 28.2 | −23.1 *** | 0.006 |
| 24.0 | 42.5 | 17.6 | 38.1 | −6.1 *** | 0.006 |
| 17.9 | 38.3 | 23.6 | 42.4 | 5.7 *** | 0.006 |
| 15.6 | 36.3 | 24.3 | 42.9 | 8.7 *** | 0.006 |
| 11.0 | 31.2 | 25.8 | 43.8 | 14.9 *** | 0.006 |
| Employment status | ||||||
| 24.4 | 42.9 | 24.4 | 43.0 | 0.0 | 0.007 |
| 46.1 | 49.9 | 43.4 | 49.6 | 0.0 | 0.008 |
| 17.5 | 38.0 | 23.0 | 42.0 | 0.0 | 0.006 |
| 12.0 | 32.4 | 9.6 | 28.9 | 0.0 | 0.004 |
| COVID-19 perceived as a considerable problem in community (Yes = 1) | 36.9 | 48.3 | ||||
| How COVID-19 pandemic affected household income | ||||||
| Income: not affected | 43.8 | 49.6 | ||||
| Income: increased | 4.4 | 20.6 | ||||
| Income: reduced | 47.7 | 50.0 | ||||
| Income: complete loss of income | 4.0 | 19.5 | ||||
| Household has carried out anything to compensate for COVID-19 (Yes = 1) | 5.7 | 23.1 | ||||
| Decision-making power regarding expenses changed (Yes = 1) | 16.1 | 36.8 | ||||
| Main source of food for household | ||||||
| 42.3 | 49.4 | ||||
| 55.7 | 49.7 | ||||
| 2.0 | 14.0 | ||||
| How have changes in food prices affected the quantities purchased? | ||||||
| 18.3 | 38.7 | ||||
| 8.8 | 28.3 | ||||
| 72.9 | 44.4 | ||||
| Any household member has access to social protection (Yes = 1) | 13.9 | 34.5 | ||||
| Food Types | 2015 (n = 8650) | 2021 (n = 8650) | Difference | |||
|---|---|---|---|---|---|---|
| Mean | St. Dev | Mean | St. Dev | Mean | SE | |
| Cereals | 0.863 | 0.344 | 0.965 | 0.185 | 0.102 *** | 0.004 |
| Tubers | 0.538 | 0.499 | 0.489 | 0.500 | −0.049 ** | 0.008 |
| Vegetables | 0.981 | 0.136 | 0.977 | 0.149 | −0.004 | 0.002 |
| Fruits | 0.305 | 0.461 | 0.305 | 0.460 | 0.000 | 0.007 |
| Meat | 0.634 | 0.482 | 0.647 | 0.478 | 0.013 * | 0.007 |
| Eggs | 0.453 | 0.498 | 0.463 | 0.499 | 0.010 | 0.008 |
| Fish | 0.825 | 0.380 | 0.728 | 0.445 | −0.097 *** | 0.006 |
| Beans | 0.579 | 0.494 | 0.805 | 0.396 | 0.226 *** | 0.007 |
| Dairy products | 0.232 | 0.422 | 0.268 | 0.443 | 0.036 *** | 0.007 |
| Fats/Oils | 0.168 | 0.374 | 0.901 | 0.299 | 0.733 *** | 0.005 |
| Sugar and honey | 0.692 | 0.462 | 0.740 | 0.439 | 0.048 *** | 0.007 |
| Condiments | 0.884 | 0.321 | 0.932 | 0.252 | 0.048 *** | 0.004 |
| 1. Very Vulnerable and Food Insecure | 2. High Food Insecurity | 3. Medium Food Insecurity | 4. Low Food Insecurity | |||||
|---|---|---|---|---|---|---|---|---|
| 2015 | 2021 | 2015 | 2021 | 2015 | 2021 | 2015 | 2021 | |
| Sex of household head | ||||||||
| −0.027 ** | −0.023 * | 0.004 | 0.007 | 0.014 | 0.001 | 0.009 | 0.015 |
| (0.013) | (0.013) | (0.014) | (0.017) | (0.017) | (0.019) | (0.016) | (0.015) |
| Household head’s age | −0.001 *** | −0.000 | −0.000 | −0.000 | −0.001 ** | 0.000 | 0.002 *** | 0.000 |
| (0.000) | (0.000) | (0.000) | (0.000) | (0.000) | (0.000) | (0.000) | (0.000) | |
| Household size | −0.007 *** | −0.008*** | −0.000 | 0.003 | 0.003 | 0.005 * | 0.004 ** | 0.001 |
| (0.002) | (0.002) | (0.002) | (0.002) | (0.002) | (0.002) | (0.002) | (0.002) | |
| H/head’s highest level of education | ||||||||
| −0.034 *** | −0.058 *** | 0.009 | −0.013 | 0.005 | 0.065 *** | 0.020 | 0.005 |
| (0.011) | (0.011) | (0.013) | (0.016) | (0.017) | (0.023) | (0.017) | (0.020) | |
| −0.070 *** | −0.094 *** | −0.006 | −0.023 | 0.015 | 0.087 *** | 0.062 *** | 0.029 |
| (0.012) | (0.013) | (0.014) | (0.017) | (0.018) | (0.023) | (0.018) | (0.020) | |
| −0.290 *** | −0.200 *** | −0.059 | −0.045 | 0.096 ** | 0.133 *** | 0.253 *** | 0.113 *** |
| (0.087) | (0.038) | (0.044) | (0.032) | (0.045) | (0.033) | (0.035) | (0.022) | |
| Ref | |||||||
| Marital status | ||||||||
| 0.049 ** | −0.011 | −0.004 | 0.038 | −0.003 | 0.013 | −0.043 ** | −0.040 ** |
| (0.021) | (0.019) | (0.019) | (0.023) | (0.022) | (0.025) | (0.020) | (0.016) | |
| 0.017 | −0.042 ** | 0.003 | 0.033 | 0.005 | 0.040 | −0.024 | −0.032 * |
| (0.022) | (0.020) | (0.021) | (0.024) | (0.024) | (0.027) | (0.021) | (0.018) | |
| Ref | |||||||
| Region | ||||||||
| 0.111*** | 0.087 *** | 0.043 *** | 0.048 *** | −0.031 ** | −0.087 *** | −0.123 *** | −0.048 *** |
| (0.013) | (0.012) | (0.011) | (0.012) | (0.012) | (0.013) | (0.011) | (0.009) | |
| Ref | |||||||
| Expenditure quintiles | ||||||||
| −0.017 ** | 0.040 *** | −0.001 | 0.003 | −0.017 | −0.002 | 0.035 *** | −0.041 * |
| (0.008) | (0.012) | (0.009) | (0.017) | (0.012) | (0.025) | (0.012) | (0.023) | |
| −0.078 *** | 0.013 | −0.044 *** | −0.004 | −0.006 | 0.017 | 0.128 *** | −0.026 |
| (0.012) | (0.013) | (0.012) | (0.016) | (0.014) | (0.024) | (0.013) | (0.022) | |
| −0.139 *** | −0.053 *** | −0.075 *** | −0.048 *** | −0.036 * | 0.060 ** | 0.249 *** | 0.041 ** |
| (0.023) | (0.014) | (0.018) | (0.017) | (0.019) | (0.024) | (0.015) | (0.021) | |
| −0.180 ** | −0.104 *** | −0.155 *** | −0.156 *** | −0.178 *** | 0.080 *** | 0.512 *** | 0.179 *** |
| (0.071) | (0.020) | (0.050) | (0.022) | (0.045) | (0.026) | (0.031) | (0.021) | |
| Ref | |||||||
| Employment status | ||||||||
| 0.115 *** | 0.093 *** | −0.010 | 0.001 | −0.025 | −0.062 *** | −0.079 *** | −0.031 ** |
| (0.016) | (0.015) | (0.013) | (0.015) | (0.015) | (0.017) | (0.014) | (0.013) | |
| 0.066 *** | 0.042 *** | −0.009 | −0.012 | −0.024 | −0.021 | −0.033 ** | −0.009 |
| (0.019) | (0.016) | (0.015) | (0.015) | (0.016) | (0.016) | (0.014) | (0.010) | |
| 0.072 *** | 0.050 *** | −0.023 | −0.037 * | −0.001 | −0.031 | −0.048 *** | 0.017 |
| (0.019) | (0.019) | (0.016) | (0.020) | (0.018) | (0.021) | (0.016) | (0.014) | |
| Ref | |||||||
| Observations | 8968 | 8764 | 8968 | 8764 | 8968 | 8764 | 8968 | 8764 |
| 1. Very Vulnerable and Food Insecure | 2. High Food Insecurity | 3. Medium Food Insecurity | 4. Low Food Insecurity | |||||
|---|---|---|---|---|---|---|---|---|
| Is COVID-19 perceived as a big problem in the community? | (1) | (2) | (1) | (2) | (1) | (2) | (1) | (2) |
| −0.015 * (0.009) | −0.014 * (0.009) | 0.005 (0.010) | 0.005 (0.010) | −0.002 (0.011) | −0.002 (0.011) | 0.011 (0.008) | 0.011 (0.008) |
| Ref | |||||||
| How has the COVID-19 pandemic affected HH income? | ||||||||
| −0.016 (0.020) | −0.015 (0.020) | 0.018 (0.022) | 0.018 (0.022) | 0.009 (0.026) | 0.010 (0.026) | −0.012 (0.020) | −0.012 (0.020) |
| −0.021 ** (0.008) | −0.021 ** (0.008) | −0.004 (0.010) | −0.004 (0.010) | 0.027 ** (0.012) | 0.026 ** (0.012) | −0.002 (0.009) | −0.002 (0.009) |
| −0.045 ** (0.021) | −0.044 ** (0.021) | −0.025 (0.026) | −0.025 (0.026) | 0.027 (0.028) | 0.027 (0.028) | 0.043 ** (0.019) | 0.043 ** (0.019) |
| Ref | |||||||
| How did COVID-19 affect decision-making power in HH? | ||||||||
| 0.018 * (0.011) | 0.017 * (0.011) | 0.012 (0.013) | 0.012 (0.013) | −0.026 * (0.015) | −0.026 * (0.015) | −0.003 (0.011) | −0.003 (0.011) |
| Ref | |||||||
| Main source of food for the household | ||||||||
| −0.027 *** (0.010) | −0.027 *** (0.010) | −0.022 * (0.013) | −0.022 * (0.013) | 0.051 *** (0.016) | 0.050 *** (0.016) | −0.002 (0.013) | −0.001 (0.013) |
| −0.009 (0.026) | −0.011 (0.026) | −0.036 (0.033) | −0.034 (0.033) | 0.087 ** (0.041) | 0.085 ** (0.041) | −0.042 (0.034) | −0.040 (0.034) |
| Ref | |||||||
| How have changes in food prices affected the quantities purchased? | ||||||||
| 0.031 ** (0.015) | 0.031 ** (0.015) | −0.011 (0.018) | −0.011 (0.018) | 0.016 (0.023) | 0.016 (0.023) | −0.036 ** (0.018) | −0.035 ** (0.018) |
| −0.014 (0.010) | −0.014 (0.010) | −0.012 (0.012) | −0.012 (0.012) | 0.013 (0.014) | 0.013 (0.014) | 0.012 (0.011) | 0.012 (0.011) |
| Ref | |||||||
| Has household has carried out anything to compensate for COVID-19? | ||||||||
| −0.008 (0.023) | −0.008 (0.023) | 0.001 (0.023) | 0.001 (0.023) | -0.004 (0.024) | −0.003 (0.024) | 0.011 (0.016) | 0.011 (0.016) |
| Ref | |||||||
| Has any household member has access to social protection? | ||||||||
| 0.018 * (0.010) | 0.078 *** (0.027) | −0.005 (0.013) | −0.036 (0.035) | −0.016 (0.016) | −0.010 (0.037) | 0.003 (0.013) | −0.033 (0.028) |
| Ref | |||||||
| Interaction: gender * social protection | −0.020 (0.020) | 0.019 (0.026) | −0.030 (0.034) | 0.031 (0.028) | ||||
| Interaction: region * social protection | −0.054 *** (0.027) | 0.019 (0.033) | 0.015 (0.035) | 0.020 (0.026) | ||||
| Controls ** | YES | YES | YES | YES | YES | YES | YES | YES |
| Interaction terms | NO | YES | NO | YES | NO | YES | NO | YES |
| Observations | 8718 | 8718 | 8591 | 8591 | ||||
| Low HDDS | Medium HDDS | High HDDS | ||||
|---|---|---|---|---|---|---|
| 2015 | 2021 | 2015 | 2021 | 2015 | 2021 | |
| Sex of household head | ||||||
| −0.002 (0.009) | −0.001 (0.006) | 0.012 (0.014) | 0.004 (0.010) | −0.009 (0.014) | −0.003 (0.010) |
| Ref | |||||
| Household head’s age | 0.000 (0.000) | 0.000 * (0.000) | 0.001 *** (0.000) | 0.001 *** (0.000) | −0.001 *** (0.000) | −0.001 *** (0.000) |
| Household size | 0.002 (0.001) | 0.002 ** (0.001) | 0.010 *** (0.002) | 0.002 * (0.001) | −0.012 *** (0.002) | −0.004 *** (0.001) |
| H/head’s highest level of education | ||||||
| −0.024 *** (0.007) | −0.010 ** (0.004) | −0.018 (0.011) | 0.018 ** (0.009) | 0.042 *** (0.012) | −0.008 (0.009) |
| −0.035 *** (0.009) | −0.019 *** (0.006) | −0.034 *** (0.013) | −0.005 (0.010) | 0.069 *** (0.013) | 0.024 *** (0.011) |
| 0.037 (0.028) | −0.001 (0.014) | 0.011 (0.030) | 0.027 (0.024) | −0.048 (0.029) | −0.026 (0.024) |
| Ref | |||||
| Marital status | ||||||
| −0.002 (0.014) | −0.012 (0.007) | −0.014 (0.021) | −0.007 (0.016) | 0.016 (0.021) | 0.020 (0.016) |
| −0.001 (0.014) | −0.017*** (0.007) | −0.001 (0.022) | −0.015 (0.017) | 0.002 (0.021) | 0.033 ** (0.017) |
| Ref | |||||
| Region | ||||||
| 0.030 *** (0.009) | 0.002 (0.005) | 0.019 * (0.011) | 0.012 (0.009) | −0.049 *** (0.011) | −0.014 (0.009) |
| Ref | |||||
| Expenditure quintiles | ||||||
| −0.128 *** (0.009) | −0.040 *** (0.004) | −0.107 *** (0.009) | −0.084 *** (0.007) | 0.236 *** (0.008) | 0.124 *** (0.007) |
| −0.160 *** (0.019) | −0.057 *** (0.005) | −0.220 *** (0.016) | −0.167 *** (0.008) | 0.380 *** (0.013) | 0.224 *** (0.008) |
| −0.249 *** (0.031) | −0.079 *** (0.009) | −0.276 *** (0.027) | −0.214 *** (0.011) | 0.523 *** (0.024) | 0.294 *** (0.011) |
| −0.219 *** (0.039) | −0.084 *** (0.015) | −0.403 *** (0.043) | −0.268 *** (0.020) | 0.623 *** (0.037) | 0.352 *** (0.019) |
| Ref | |||||
| Employment status | ||||||
| 0.009 (0.012) | 0.009 (0.008) | 0.012 (0.015) | 0.036 * (0.013) | −0.021 (0.014) | −0.045 *** (0.013) |
| −0.035 ** (0.014) | 0.002 (0.010) | 0.020 (0.016) | 0.018 (0.014) | 0.015 (0.016) | −0.020 (0.015) |
| −0.003 (0.014) | 0.020 *** (0.009) | 0.006 (0.018) | 0.039 ** (0.015) | −0.003 (0.018) | −0.059 *** (0.015) |
| Observations | 8968 | 8772 | 8968 | 8772 | 8968 | 8772 |
| Low HDDS | Medium HDDS | High HDDS | ||||
|---|---|---|---|---|---|---|
| (1) | (2) | (1) | (2) | (1) | (2) | |
| Is COVID-19 perceived as a big problem in the community? | ||||||
| 0.006 (0.004) | 0.006 (0.004) | −0.015 ** (0.007) | −0.015 ** (0.007) | 0.009 (0.007) | 0.009 (0.007) |
| Ref | |||||
| How has the COVID-19 pandemic affected household income? | ||||||
| −0.014 (0.011) | −0.014 (0.011) | 0.008 (0.018) | 0.009 (0.018) | 0.006 (0.019) | 0.006 (0.019) |
| −0.004 (0.004) | −0.004 (0.004) | 0.015 *** (0.007) | 0.015 *** (0.007) | −0.011 (0.007) | −0.011 (0.007) |
| 0.011 (0.008) | 0.010 (0.008) | 0.009 (0.017) | 0.009 (0.017) | −0.020 (0.018) | −0.020 (0.018) |
| Ref | |||||
| Has decision-making power regarding expenses changed? | ||||||
| 0.001 (0.005) | 0.001 (0.005) | 0.007 (0.009) | 0.007 (0.009) | −0.008(0.009) | −0.008 (0.009) |
| Ref | |||||
| Main source of food for the household | ||||||
| −0.002 (0.004) | −0.001 (0.004) | −0.009 (0.008) | −0.010 (0.008) | 0.011 (0.009) | 0.011 (0.009) |
| 0.017 * (0.008) | 0.018 ** (0.008) | −0.024 (0.020) | −0.025 (0.020) | 0.007 (0.021) | 0.008 (0.021) |
| Ref | |||||
| How have changes in food prices affected the quantities purchased? | ||||||
| 0.000 (0.006) | 0.001 (0.006) | 0.006 (0.013) | 0.006 (0.013) | −0.006 (0.013) | −0.006 (0.013) |
| −0.007 * (0.004) | −0.007 * (0.004) | 0.004 (0.008) | 0.004 (0.008) | 0.003 (0.008) | 0.003 (0.008) |
| Ref | |||||
| Household has carried out anything to compensate for COVID-19 | ||||||
| −0.017(0.010) | −0.018 (0.010) | 0.015 (0.017) | 0.016 (0.017) | 0.002 (0.018) | 0.002 (0.018) |
| Ref | |||||
| Has any household member has access to social protection? | ||||||
| −0.002 (0.005) | −0.003 (0.013) | 0.001 (0.008) | 0.018 (0.023) | 0.000 (0.009) | −0.015 (0.024) |
| Ref | |||||
| Has any household member has access to social protection? | ||||||
| −0.015 (0.013) | 0.025 (0.023) | −0.010 (0.024) | |||
| Ref | |||||
| Gender | ||||||
| −0.004 (0.006) | 0.006 (0.010) | −0.001 (0.011) | |||
| Ref | |||||
| Region | ||||||
| 0.002 (0.005) | 0.012 (0.010) | −0.014 (0.010) | |||
| Ref | |||||
| Interaction: gender * social protection | 0.015 * (0.009) | −0.016 (0.016) | 0.001 (0.017) | |||
| Interaction: region * social protection | −0.009 (0.012) | −0.008 (0.023) | 0.017 (0.023) | |||
| Controls | YES | YES | YES | YES | YES | YES |
| Interaction terms | NO | YES | NO | YES | NO | YES |
| Observations | 8718 | 8718 | 8718 | |||
Disclaimer/Publisher’s Note: The statements, opinions and data contained in all publications are solely those of the individual author(s) and contributor(s) and not of MDPI and/or the editor(s). MDPI and/or the editor(s) disclaim responsibility for any injury to people or property resulting from any ideas, methods, instructions or products referred to in the content. |
© 2025 by the authors. Licensee MDPI, Basel, Switzerland. This article is an open access article distributed under the terms and conditions of the Creative Commons Attribution (CC BY) license (https://creativecommons.org/licenses/by/4.0/).
Share and Cite
Bwalya, R.; Chama-Chiliba, C.M. COVID-19 Lockdown and Implications for Household Food Security in Zambia: Quality of Diet or Economic Vulnerability? Economies 2025, 13, 200. https://doi.org/10.3390/economies13070200
Bwalya R, Chama-Chiliba CM. COVID-19 Lockdown and Implications for Household Food Security in Zambia: Quality of Diet or Economic Vulnerability? Economies. 2025; 13(7):200. https://doi.org/10.3390/economies13070200
Chicago/Turabian StyleBwalya, Richard, and Chitalu Miriam Chama-Chiliba. 2025. "COVID-19 Lockdown and Implications for Household Food Security in Zambia: Quality of Diet or Economic Vulnerability?" Economies 13, no. 7: 200. https://doi.org/10.3390/economies13070200
APA StyleBwalya, R., & Chama-Chiliba, C. M. (2025). COVID-19 Lockdown and Implications for Household Food Security in Zambia: Quality of Diet or Economic Vulnerability? Economies, 13(7), 200. https://doi.org/10.3390/economies13070200