Abstract
This study develops a multidimensional classification of Latin American and Caribbean countries based on a multidimensional set of economic, social, technological, and environmental indicators. This study develops a multidimensional assessment of the performance of Latin American and Caribbean countries, taking into account the following indicators for the period 2017–2022: education expenditure (% of GDP), health expenditure (% of GDP), GDP per capita (constant USD), CO2 emissions per capita (metric tons), energy consumption per capita (kWh), internet users (% of population), mobile phone subscriptions (per 100 inhabitants), and the Global Innovation Index (GII). Initially, through the application of principal component analysis (PCA), the objective was to reduce the complexity of the data set and reveal the main structural dimensions. Subsequently, cluster analysis was used to classify countries according to shared development patterns. To achieve this, the average of the indicators for the 2017–2022 period was used as a basis, which enabled the reduction in short-term distortions and the capture of structural trends. The results reveal the existence of distinct groups, with countries with higher levels of digital connectivity, investment in human capital, and economic dynamism experiencing more favorable development conditions.
1. Introduction
To understand the different socioeconomic and environmental dynamics in Latin American countries, comparative analysis of different indicators becomes the tool. This type of comparison constitutes a multidimensional problem. These assessments not only provide a comprehensive perspective on the characteristics and challenges faced by nations but also offer an empirical basis for public policymaking (Pinar, 2019; Barska et al., 2020; Guillén-Fernández, 2024). Several techniques have proven useful in identifying patterns and classifying elements based on multiple indicators, among which the following multivariate analysis techniques stand out: principal component analysis (PCA) and cluster analysis (Kamari & Schultz, 2022; Krzyśko et al., 2022).
The region that includes the countries of Latin America and the Caribbean is characterized by the heterogeneity that occurs in different fields, so in economic, social, and environmental terms, there is a high variability in the respective indicators, which is why the need arises to use methodologies that have the capacity to measure this diversity. The availability of data from international and national organizations offers an opportunity to explore these differences from a quantitative perspective (Santos et al., 2023). Therefore, to extract relevant information that allows structuring results from the complexity of multidimensional data, advanced techniques are required so that this information can be understood by different government entities. (Ray et al., 2021; Guo et al., 2022). Therefore, this study addresses the following research questions: What are the main factors that explain the differences between countries in the region? How are these countries grouped according to shared characteristics? How can these results contribute to strategic decision-making?
For this study, indicators were selected that take into account countries’ development in areas such as education, health, the economy, the environment, and technology. This selection of indicators seeks to answer the previously formulated research questions. In this analysis, the data were examined using principal component analysis (PCA) to identify the main factors explaining variability in the region and cluster analysis to group countries according to common patterns. This proposed methodological approach contributes to better visualization and interpretation of results, facilitating decision-making by those responsible for designing government policies, due to the identification of similarities when considering the existing relationship between multiple indicators (Korir, 2024; Alkhayrat et al., 2020).
2. Literature Review
2.1. Principal Component Analysis (PCA)
Principal component analysis (PCA) is a technique that reduces the number of dimensions when there is a large data set; for this purpose, it transforms the variables that are correlated into a new, smaller set called principal components (Jolliffe, 2002). This facilitates the interpretation and visualization of data in multidimensional studies, since, without losing the most significant variability, the original information can be compressed (Salem & Hussein, 2019; Gewers et al., 2021).
PCA is based on the decomposition of eigenvalues of the variance or correlation matrix of the original data; thus, the first component found tries to explain the greatest variability of the data, while the following components progressively explain less variability. This way, problems of overfitting and multicollinearity are avoided by reducing dimensions, which is key in multivariate data analysis (Jolliffe & Cadima, 2016).
The application of PCA has been widespread in knowledge in various fields, including chemistry, biology, economics, and social sciences (Younes et al., 2021; Abson et al., 2012; Dai et al., 2021; Zhang et al., 2020). PCA is used abundantly in all forms of analysis because it is a simple, nonparametric method of extracting relevant information from confusing data sets. It has also been used to assess countries by analyzing information on various development indicators. For example, through PCA, key factors that explain the differences in economic growth and social well-being have been identified, as evidenced in global competitiveness studies (Kurek et al., 2022; Noman et al., 2024). In the evaluation of the environmental performance of different regions, PCA has facilitated the identification of highly significant components of ecological efficiency, as shown in some environmental sustainability studies (Jiang et al., 2018; Almulhim, 2024).
Additionally, PCA enables the creation of composite indices that capture the overall level, which can be used to compare different countries and regions, allowing policymakers to identify the best practices and areas for improvement. Due to this, the application of PCA has been very important for the construction and development of valuable composite indices such as the Global Competitiveness Index (GCI) and the Human Development Index (HDI) (Asongu & Nwachukwu, 2017; Qazi, 2022).
2.2. Cluster Analysis
Cluster analysis covers statistical techniques to discover patterns within a data set with the objective of grouping the cluster units in such a way that the elements within a cluster have a high degree of relationship or association with each other, while the clusters are different between them (Romesburg, 2004). This method is widely used in various fields, initially in the disciplines of biology and ecology; in recent years, it has also been used in areas such as economics, social sciences, and health sciences (Spoor, 2023; Van Leeuwen & Koole, 2022). In the field of economic and social development, conglomerate analysis has become a key tool for classifying regions and countries, taking into account different indicators of economic, social, and environmental types, allowing for an integrated view from a multidimensional perspective. (Neri et al., 2017; Krishnan & Firoz, 2023).
Clustering methods can be divided into two groups: partitions and hierarchical, each with its advantages and limitations. Partition methods, such as K-means, seek to assign each observation to one of the predefined groups, minimizing the internal variance of the conglomerate. The hierarchical grouping algorithms are based on the representation of the data as a hierarchy of nested clusters through the inclusion of the set of sets (MacQueen, 1967). In the partition approach, its performance depends on the optimal number of conglomerates that is determined by the elbow method or the criteria of the silhouette (Kaufman & Rousseeuw, 2009). Hierarchical methods build an arborized grouping structure, beginning with each data point in its own cluster and successively merging the most similar cluster pairs to form a cluster hierarchy (Ward, 1963). Finally, density-based methods, such as DBSCAN (Ester et al., 1996), have been used to detect patterns in noisy data sets with complex structures.
In the classification of countries, cluster analysis has had different applications within which we can highlight the following: Ahlborn and Schweickert (2019) used a macroconglomerate approach to classify 115 countries according to their economic structures and level of development, which provides an integral perspective of global economic differences and similarities. Similarly, Strielkowski et al. (2024) applied conglomerate analysis to describe the different characteristics of discarding and mitigation policies of climate change in several countries, providing information for policy formulation.
2.3. Integration of PCA and Cluster Analysis
The simultaneous use of PCA and conglomerate analysis has been a valid methodological strategy for multidimensional studies. PCA reduces the dimensionality of the data set through the correlations between variables; this reduction optimizes the quality of group algorithms and thus improves the interpretation of the results (Jolliffe & Cadima, 2016).
This strategy has been applied in various contexts for the analysis of countries and regions, being an efficient technique for the analysis of multidimensional data sets. This is how the simultaneous use of these two multivariate analysis techniques is seen in several studies. Jansson et al. (2022), through PCA and the K-means algorithm, reduced the dimensionality and the grouping of multivariate rock data. Pranata et al. (2023) applied PCA along with group algorithms such as K-means and DBSCAN to companies grouped in the stock market of Indonesia. Krishnan and Firoz (2023) used PCA and conglomerate analysis to evaluate regional environmental quality, identifying patterns that can used for basing public policies and sustainable development strategies. Tripathi et al. (2025) used PCA and K-means to segment the markets of the retail sector, improving the understanding of consumer behavior and optimizing marketing strategies.
Therefore, this study, with the combined use of PCA and conglomerate analysis, is a classification of Latin American and Caribbean countries from a multidimensional point of view, taking into account key indicators of education, health, economy, environment, and technology. With this methodological integration, it is hoped that the classification obtained will be much more robust.
2.4. Recent Overview of Multidimensional Development in Latin America
In light of the most recent studies, Latin American development has been approached from perspectives that transcend traditional macroeconomic metrics to incorporate dimensions of subjective well-being, job quality, gender, aging, and energy sustainability. This methodological evolution responds to the need to capture with greater precision the structural inequalities that persist in the region.
Based on the same idea, Cruz-Martínez (2014) proposed a Multidimensional Welfare Index integrating institutional dimensions of coverage and results, allowing for a better characterization of the welfare state in Latin America through factor analyses that explain more than 75% of the variance. Similarly, Santillán et al. (2020) formulated a Multidimensional Energy Poverty Index (MEPI) for seven Latin American countries, which showed a high Human Development Index (HDI) does not necessarily correlate with low energy deprivation. Hence, demonstrating the need to include energy access parameters in multidimensional indexes.
From the field of gender inequality, Medina-Hernández et al. (2021) employed the HJ-Biplot technique to examine the economic, physical, and political autonomy of women in 17 countries, finding that these dimensions interact in an interdependent manner. Their study not only confirms the usefulness of multivariate approaches but also justifies the inclusion of gender indicators in structural development analyses.
Likewise, Bravo-Sanzana et al. (2023) emphasized, in a systematic review regarding the social climate in Latin America, the absence of appropriate tools to assess inclusion, cohesion, and perceived safety, which underscores the need for multidimensional approaches attentive to varying educational and cultural frameworks.
In the labor sphere, González et al. (2021) proposed a synthetic index of deprivation in employment quality (QoE) for six Central American countries. Using the Alkire–Foster method, their analysis shows that more than 60% of labor deprivation comes from non-monetary factors such as instability, informality, and poor working conditions. This finding reinforces the argument that the quality of employment should be an integral part of development metrics.
Finally, Amarante and Colacce (2022) addressed multidimensional poverty among older adults in five Latin American countries, highlighting the importance of dimensions such as health, social security, and housing. Their study demonstrates that deprivations persist into old age and that an informal work history has lasting effects, reaffirming the need for targeted measures for this population.
Together, these works demonstrate a growing consensus: the Latin American reality cannot be adequately explained through unidimensional indicators. Therefore, this study falls within this integrative paradigm by combining robust statistical techniques with a conceptual framework that recognizes the structural complexity of development in Latin America and the Caribbean.
3. Methodology
This study analyzes the multidimensional performance of Latin American countries using multivariate analysis techniques. Data from official sources such as the World Bank, the Economic Commission for Latin America and the Caribbean (ECLAC), and the World Economic Forum (WEF) were used, ensuring comparability and quality of the information. The selection of variables responds to the need to capture key dimensions of countries’ development, encompassing economic, social, and environmental indicators.
The following variables were analyzed for the period of 2017–2022: education spending (% of GDP), health spending (% of GDP), GDP per capita (constant USD), CO2 emissions per capita (metric tons), energy consumption per capita (kWh), internet users (% of population), mobile phone subscriptions (per 100 inhabitants), and the Global Innovation Index (GII). The average values of each indicator were used for the analysis to minimize the effects of temporal variability.
The set of indicators that were studied in this research is tailored to address the existing gap regarding development measurements in Latin America and the Caribbean, capturing its multi-dimensional progress in both classical and contemporary approaches to well-being. The range includes education expenditure (% of GDP) and health expenditure (%), which indicate the efforts by the government towards human capital formation, which is a fundamental component towards attaining sustainable development. There is vast literature supporting these two indicators as constituents of social productivity and institutional quality (Barska et al., 2020; Al-Worafi, 2024).
GDP per capita is commonly used for income level measurement, serving as a proxy for estimating citizens’ economic well-being in a country. Meanwhile, per capita CO2 emissions and per capita energy consumption are measures of productivity and environmental sustainability, which are important in the context of sustainable development (Jiang et al., 2018; Almulhim, 2024).
The penetration of internet users (% of the population) and mobile subscriptions per 100 inhabitants allow for the evaluation of the level of digital connectivity, associated with technological inclusion and access to information, factors recognized as enablers of modern development (Pick et al., 2021; Pérez-Morote et al., 2020). In the end, the Global Innovation Index (GII) is a composite indicator that shows how well countries can create and use knowledge, which is a key part of economies that rely on innovation (Asongu & Nwachukwu, 2017).
We may obtain a full picture of progress in the area by combining these eight variables. This picture includes economic, social, environmental, and technological aspects. This selection is based not only on their availability and international comparability but also on their empirical and theoretical relevance within the field of multidimensional development studies.
The use of principal component analysis (PCA) and hierarchical clustering was selected after evaluating three criteria: suitability for the objectives, precedents in the literature, and statistical robustness. Firstly, the purpose of identifying latent structures and subsequently segmenting countries requires a technique that reduces collinearity without losing relevant information; PCA meets this requirement by concentrating more than 70% of the variance in a reduced set of components, optimizing the subsequent classification (Jolliffe & Cadima, 2016). Secondly, recent regional studies (Krishnan & Firoz, 2023; Jiménez-Preciado et al., 2024) evidence how clustering directly on original variables tends to create groups sensitive to scaling and noise. By first projecting the data into the factorial space, this risk is reduced and the economic interpretability of the clusters is improved. Finally, alternatives such as K-means cluster analysis on raw data or models based on synthetic indicators—DEA or composite indices—were discarded because, although useful, they impose assumptions of convexity or compensability that could mask key heterogeneities. The Ward hierarchical method, on the other hand, allows for visualizing the nested relationship between countries and relies on distance metrics that maximize internal homogeneity. The Bartlett and KMO tests, as well as validation with the co-do method, support the methodological decision and ensure the replicability and robustness of the findings.
Study Population
Thirty-two countries in Latin America and the Caribbean were included based on data availability. The countries analyzed are Antigua and Barbuda, Argentina, the Bahamas, Barbados, Belize, Bolivia, Brazil, Chile, Colombia, Costa Rica, Cuba, Dominica, the Dominican Republic, Ecuador, El Salvador, Grenada, Guatemala, Guyana, Haiti, Honduras, Jamaica, Mexico, Nicaragua, Panama, Paraguay, Peru, Saint Kitts and Nevis, Saint Vincent and the Grenadines, Saint Lucia, Suriname, Trinidad and Tobago, Uruguay, and Venezuela.
Principal component analysis (PCA) was used to reduce dimensionality and identify the underlying factors that explain the greatest variability across countries. This method transforms the original variables into a set of uncorrelated components, preserving the maximum amount of information possible. Before applying PCA, the data were normalized to eliminate scale effects, using standardization based on the mean and standard deviation. The following criteria were evaluated for principal component selection:
- Kaiser’s Criterion: Components with eigenvalues greater than 1 are retained.
- Explained Variance: Components that explain at least 70% of the total variability are selected.
- Scree Plot: Identification of the inflection point on the eigenvalue curve.
To segment the countries, an agglomerative hierarchical cluster analysis was applied using Ward’s method, which minimizes within-group variance and optimizes classification. The optimal number of clusters was determined using the elbow method, applying Euclidean distance and Ward’s linkage criterion. This strategy allowed for the identification of structural patterns and the grouping of countries according to similar development trajectories.
Various tests were carried out to ensure the robustness of the results:
- Sample Adequacy: Bartlett’s test of sphericity.
- PCA Robustness: Comparison of results with alternative normalizations of the variables.
- Clustering Stability: Assessment by repeating the analysis with different distance metrics.
The combined use of PCA and cluster analysis strengthens the robustness of the classification, as it eliminates redundancies in the original data and improves the interpretation of the resulting groups. By applying clustering to the reduced principal component space, it is ensured that the clusters reflect structural differences rather than simple individual variations in the original variables. This methodology provides a clearer view of the relationships between countries, allowing for the formulation of recommendations based on empirical evidence.
The methodological approach adopted in this study ensures rigorous and replicable analysis, aligned to best practices in empirical research on multidimensional development. The combination of advanced statistical techniques with the use of average data ensures stable results and allows for structured comparisons between countries in the region. Based on this classification, common development patterns can be identified and differentiated strategies established to improve performance in key areas such as education, health, the economy, and environmental sustainability.
4. Results
4.1. Results of Principal Component Analysis
The FactoMineR package (version 2.11) of the R statistical software (Husson et al., 2023) was used to perform the PCA. A. The PCA graphs were generated using the Factoextra package (Kassambara & Mundt, 2016) of the R statistical software (R Core Team, 2024).
Table 1 shows, for the first three components, the associated eigenvalues, the variance explained by each component, and the cumulative percentage of variance explained using principal component analysis (PCA).

Table 1.
Eigenvalue and variability explained.
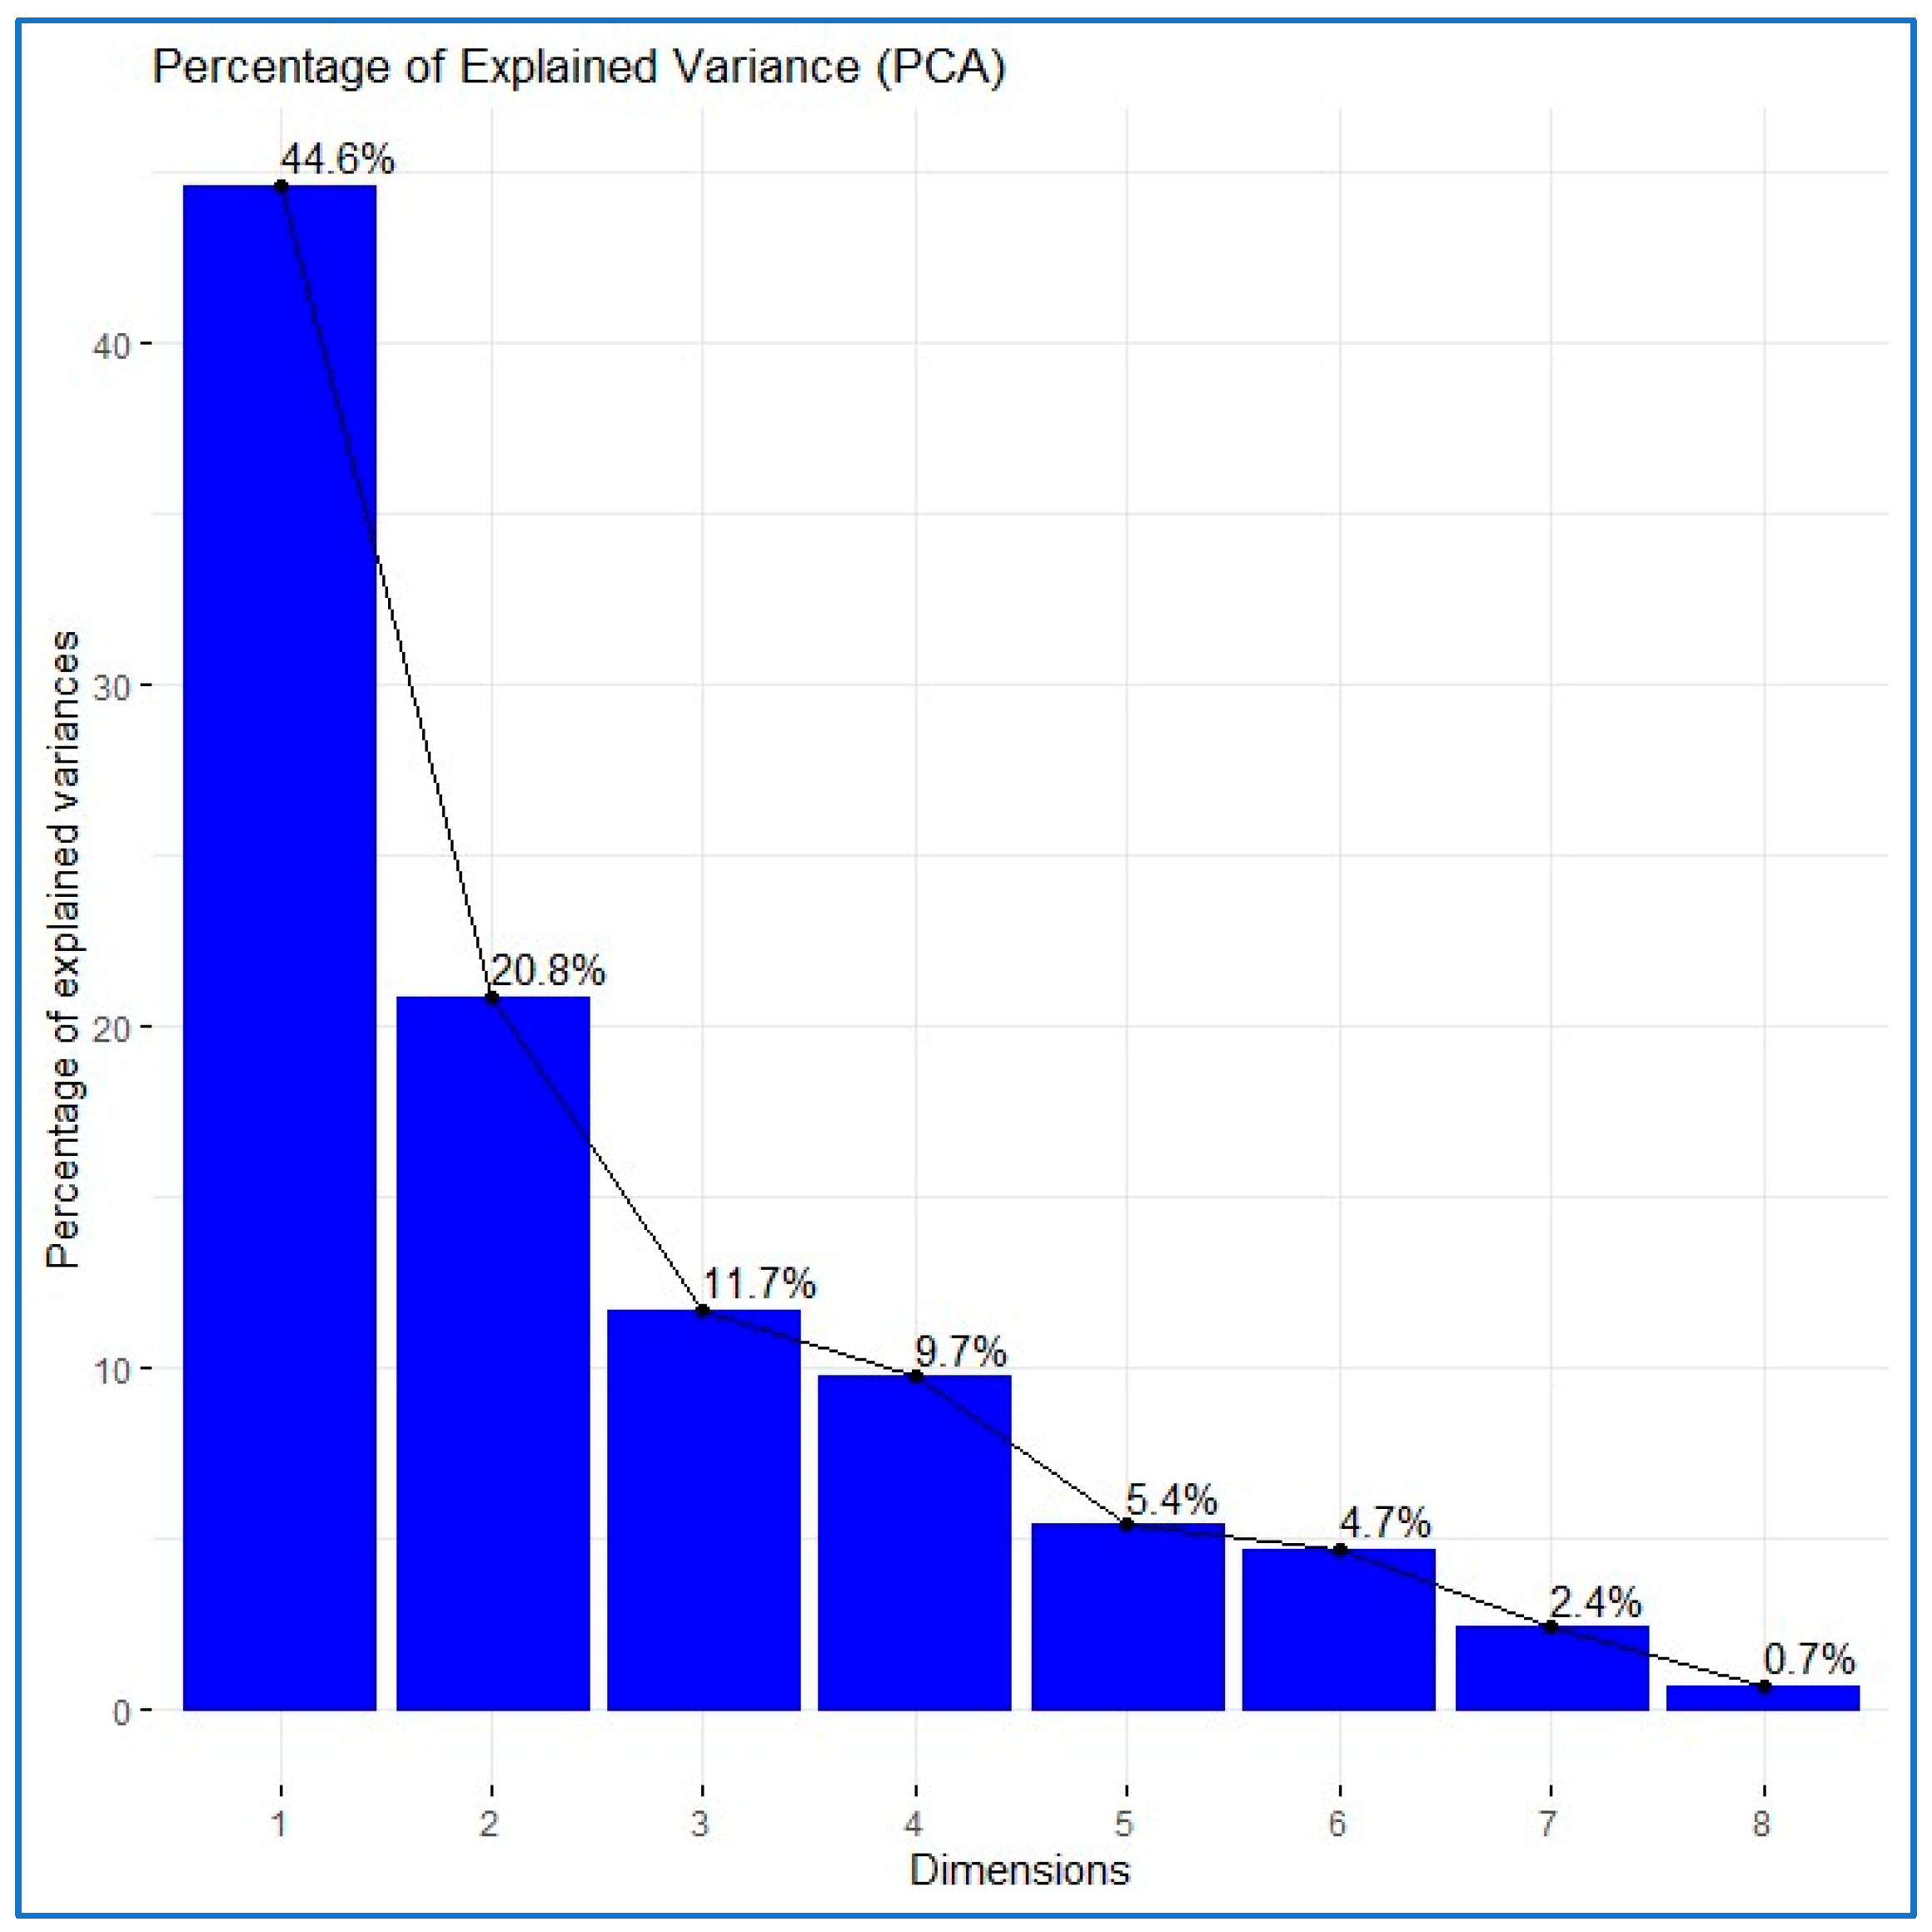
The eigenvalues represent the proportion of information retained by each principal component (see Figure 1). The PCA results show that three factors explain 77.096% of the information contained in the eight original variables. The p-value of Bartlett’s Test of Sphericity is 6.89 × 10⁻¹⁷, so the null hypothesis “Ho: The correlation matrix equals the identity matrix” should be rejected, indicating that principal components analysis is appropriate.

Figure 1.
Eigenvalues and explained variability (PCA).
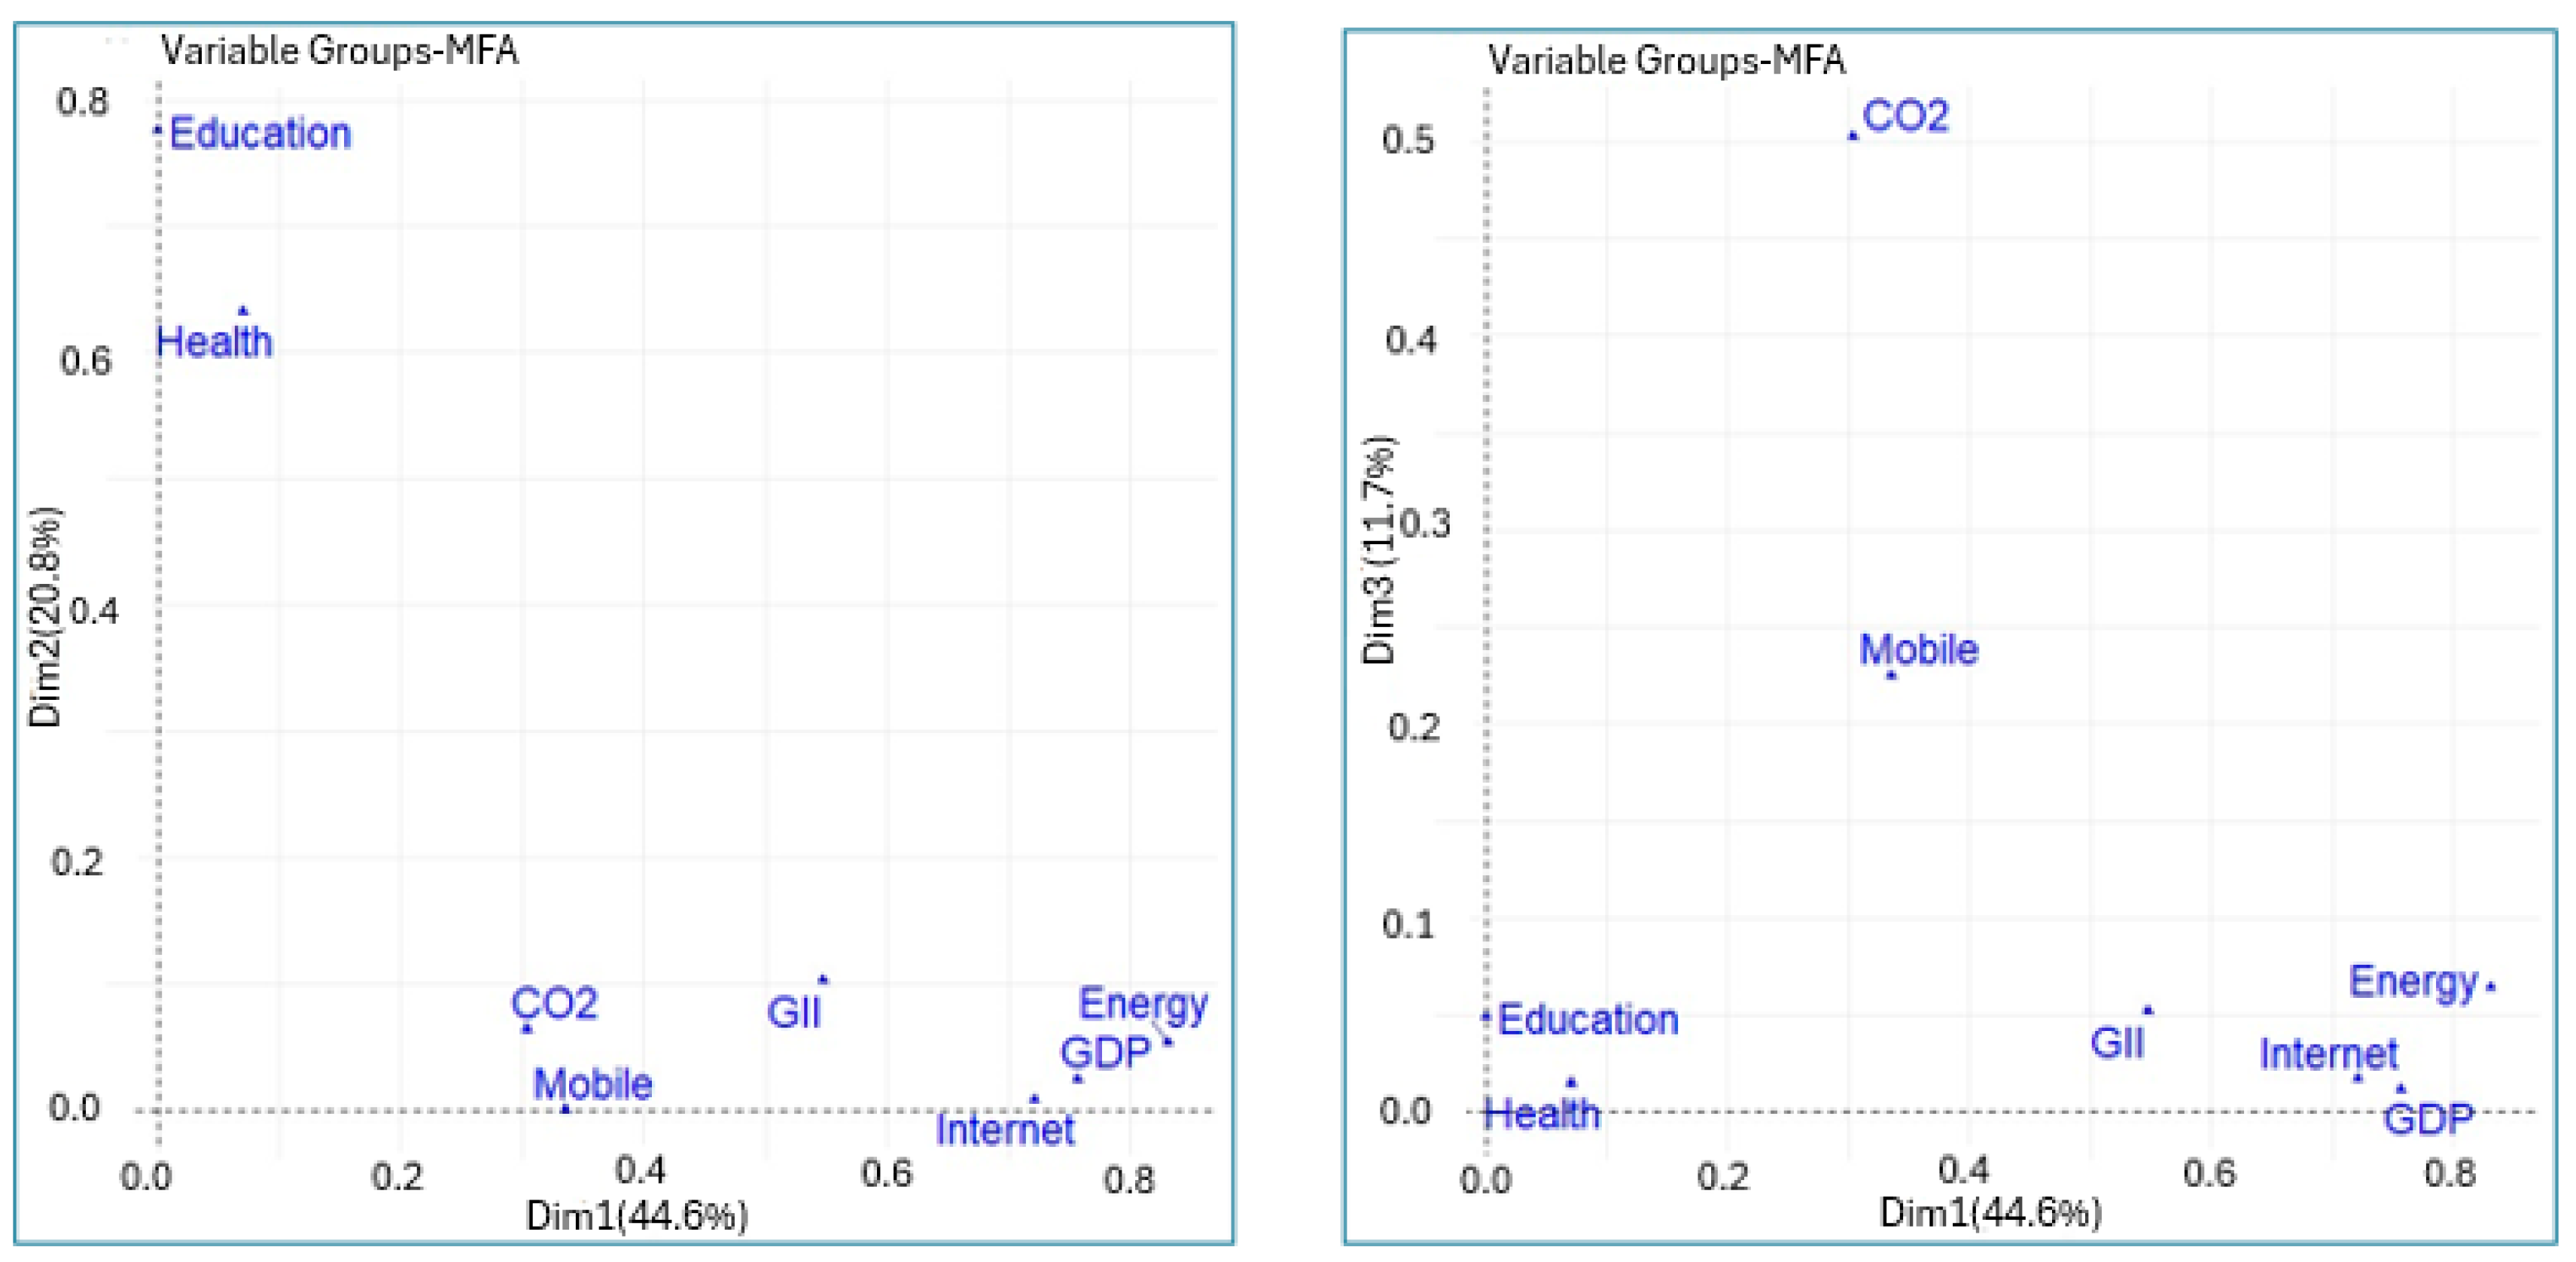
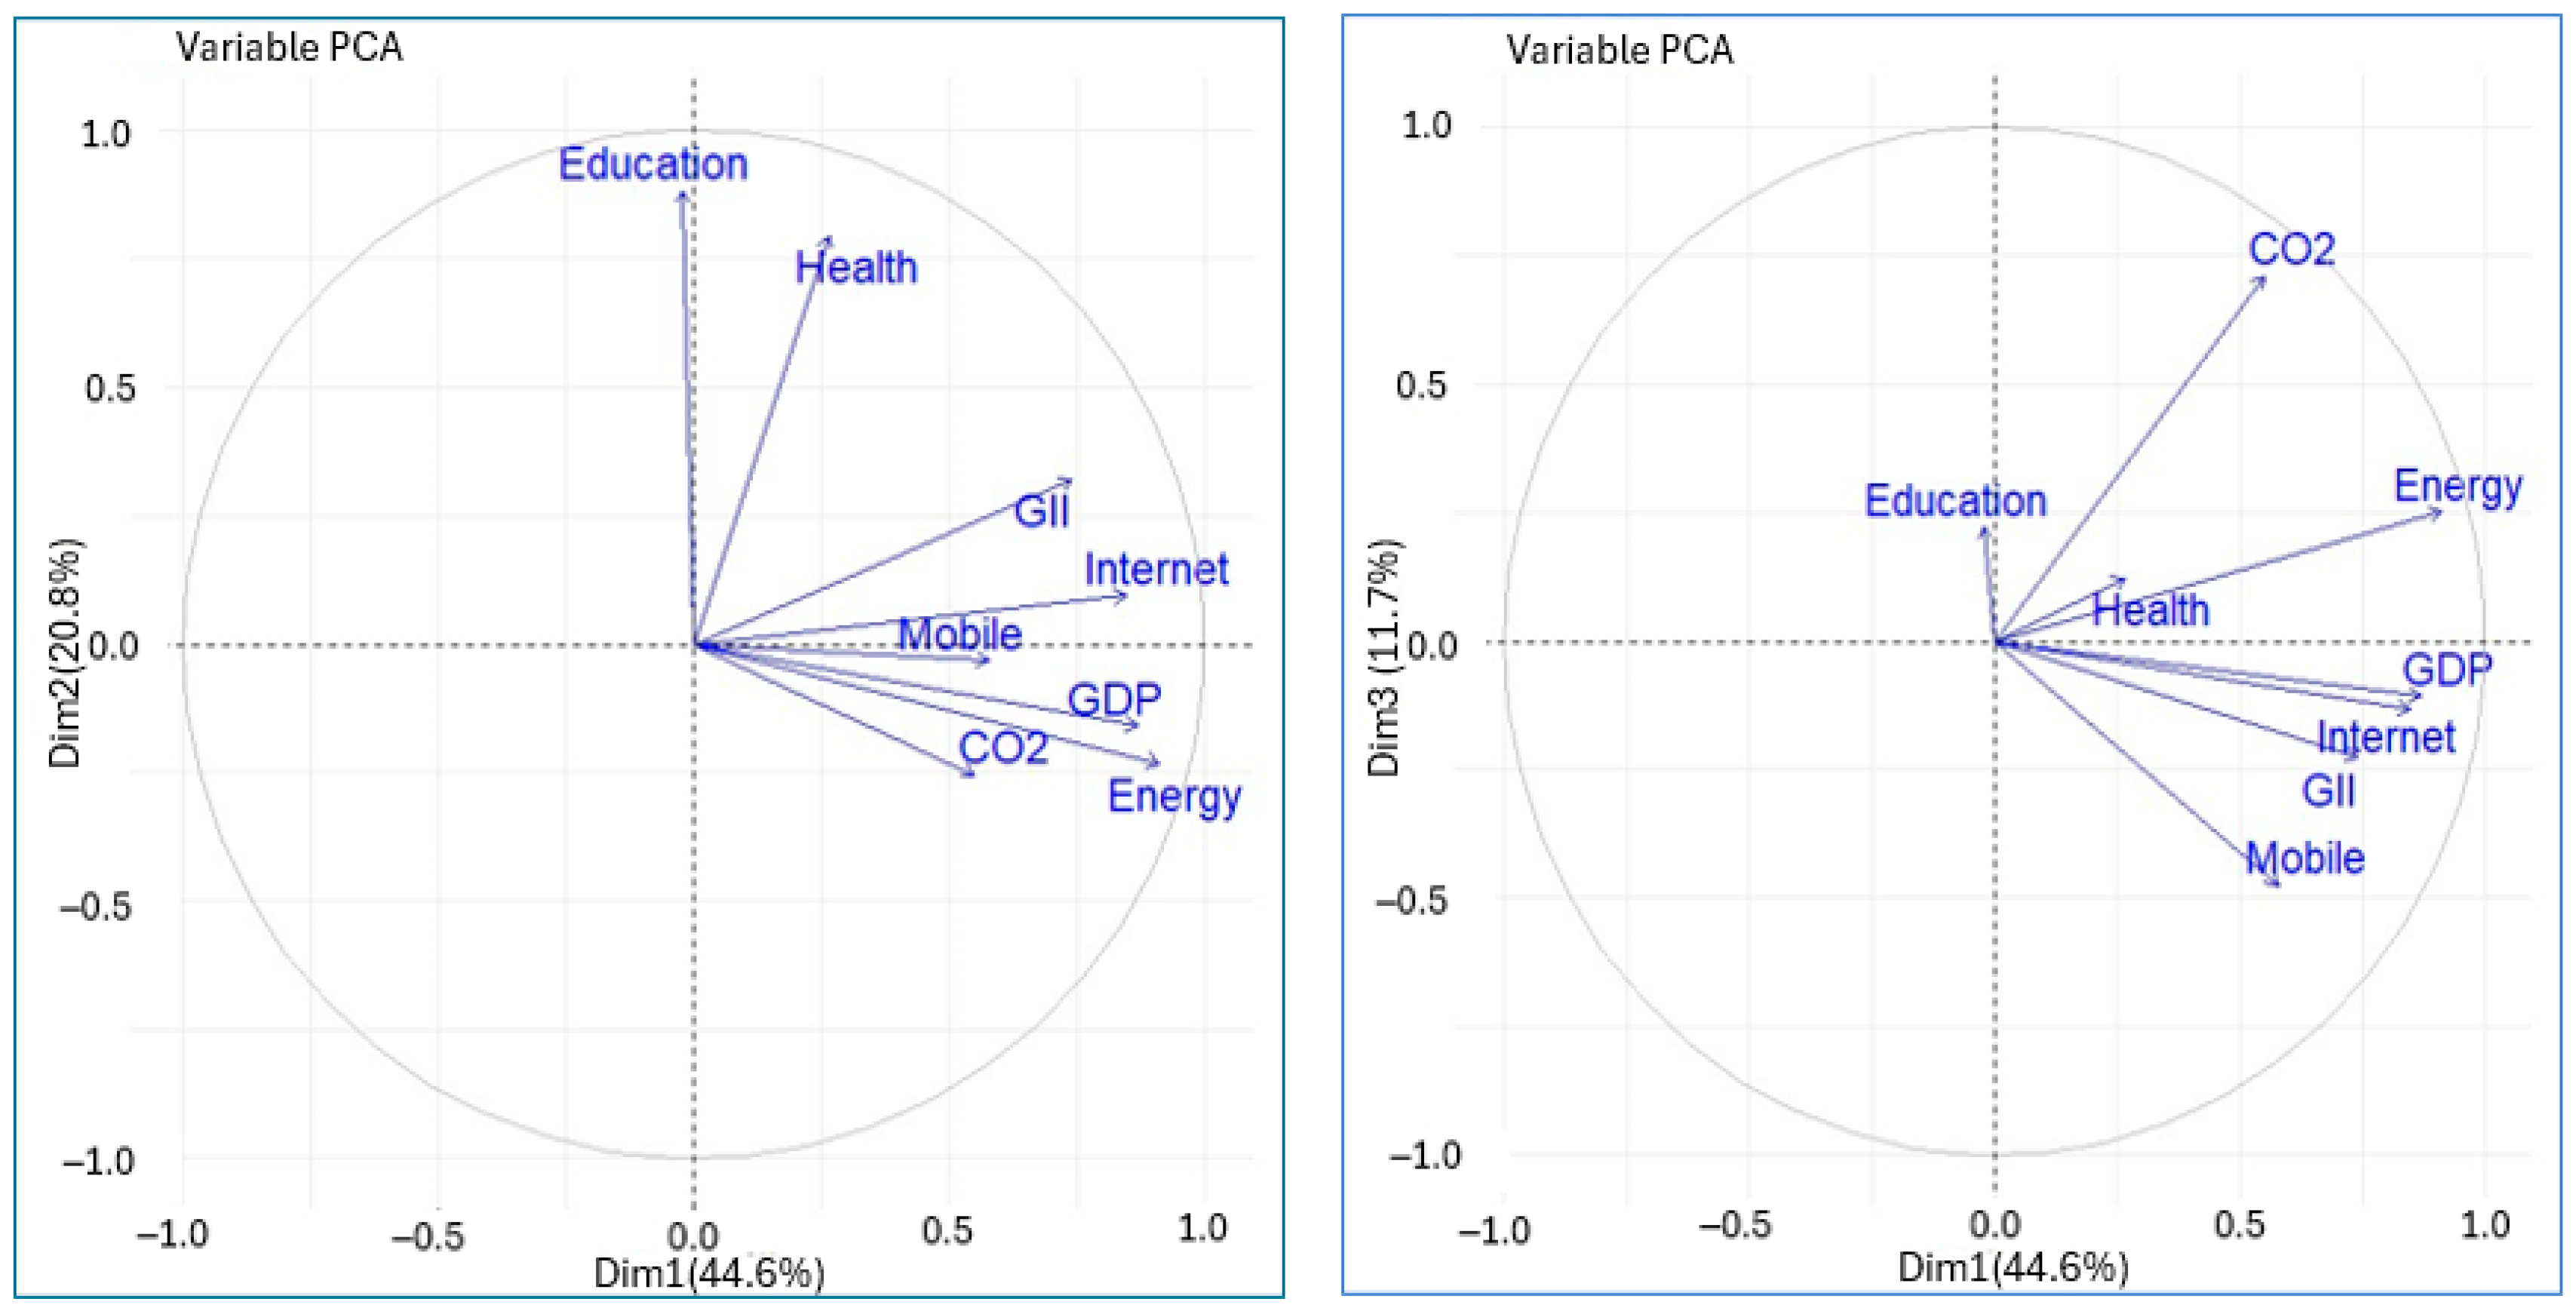
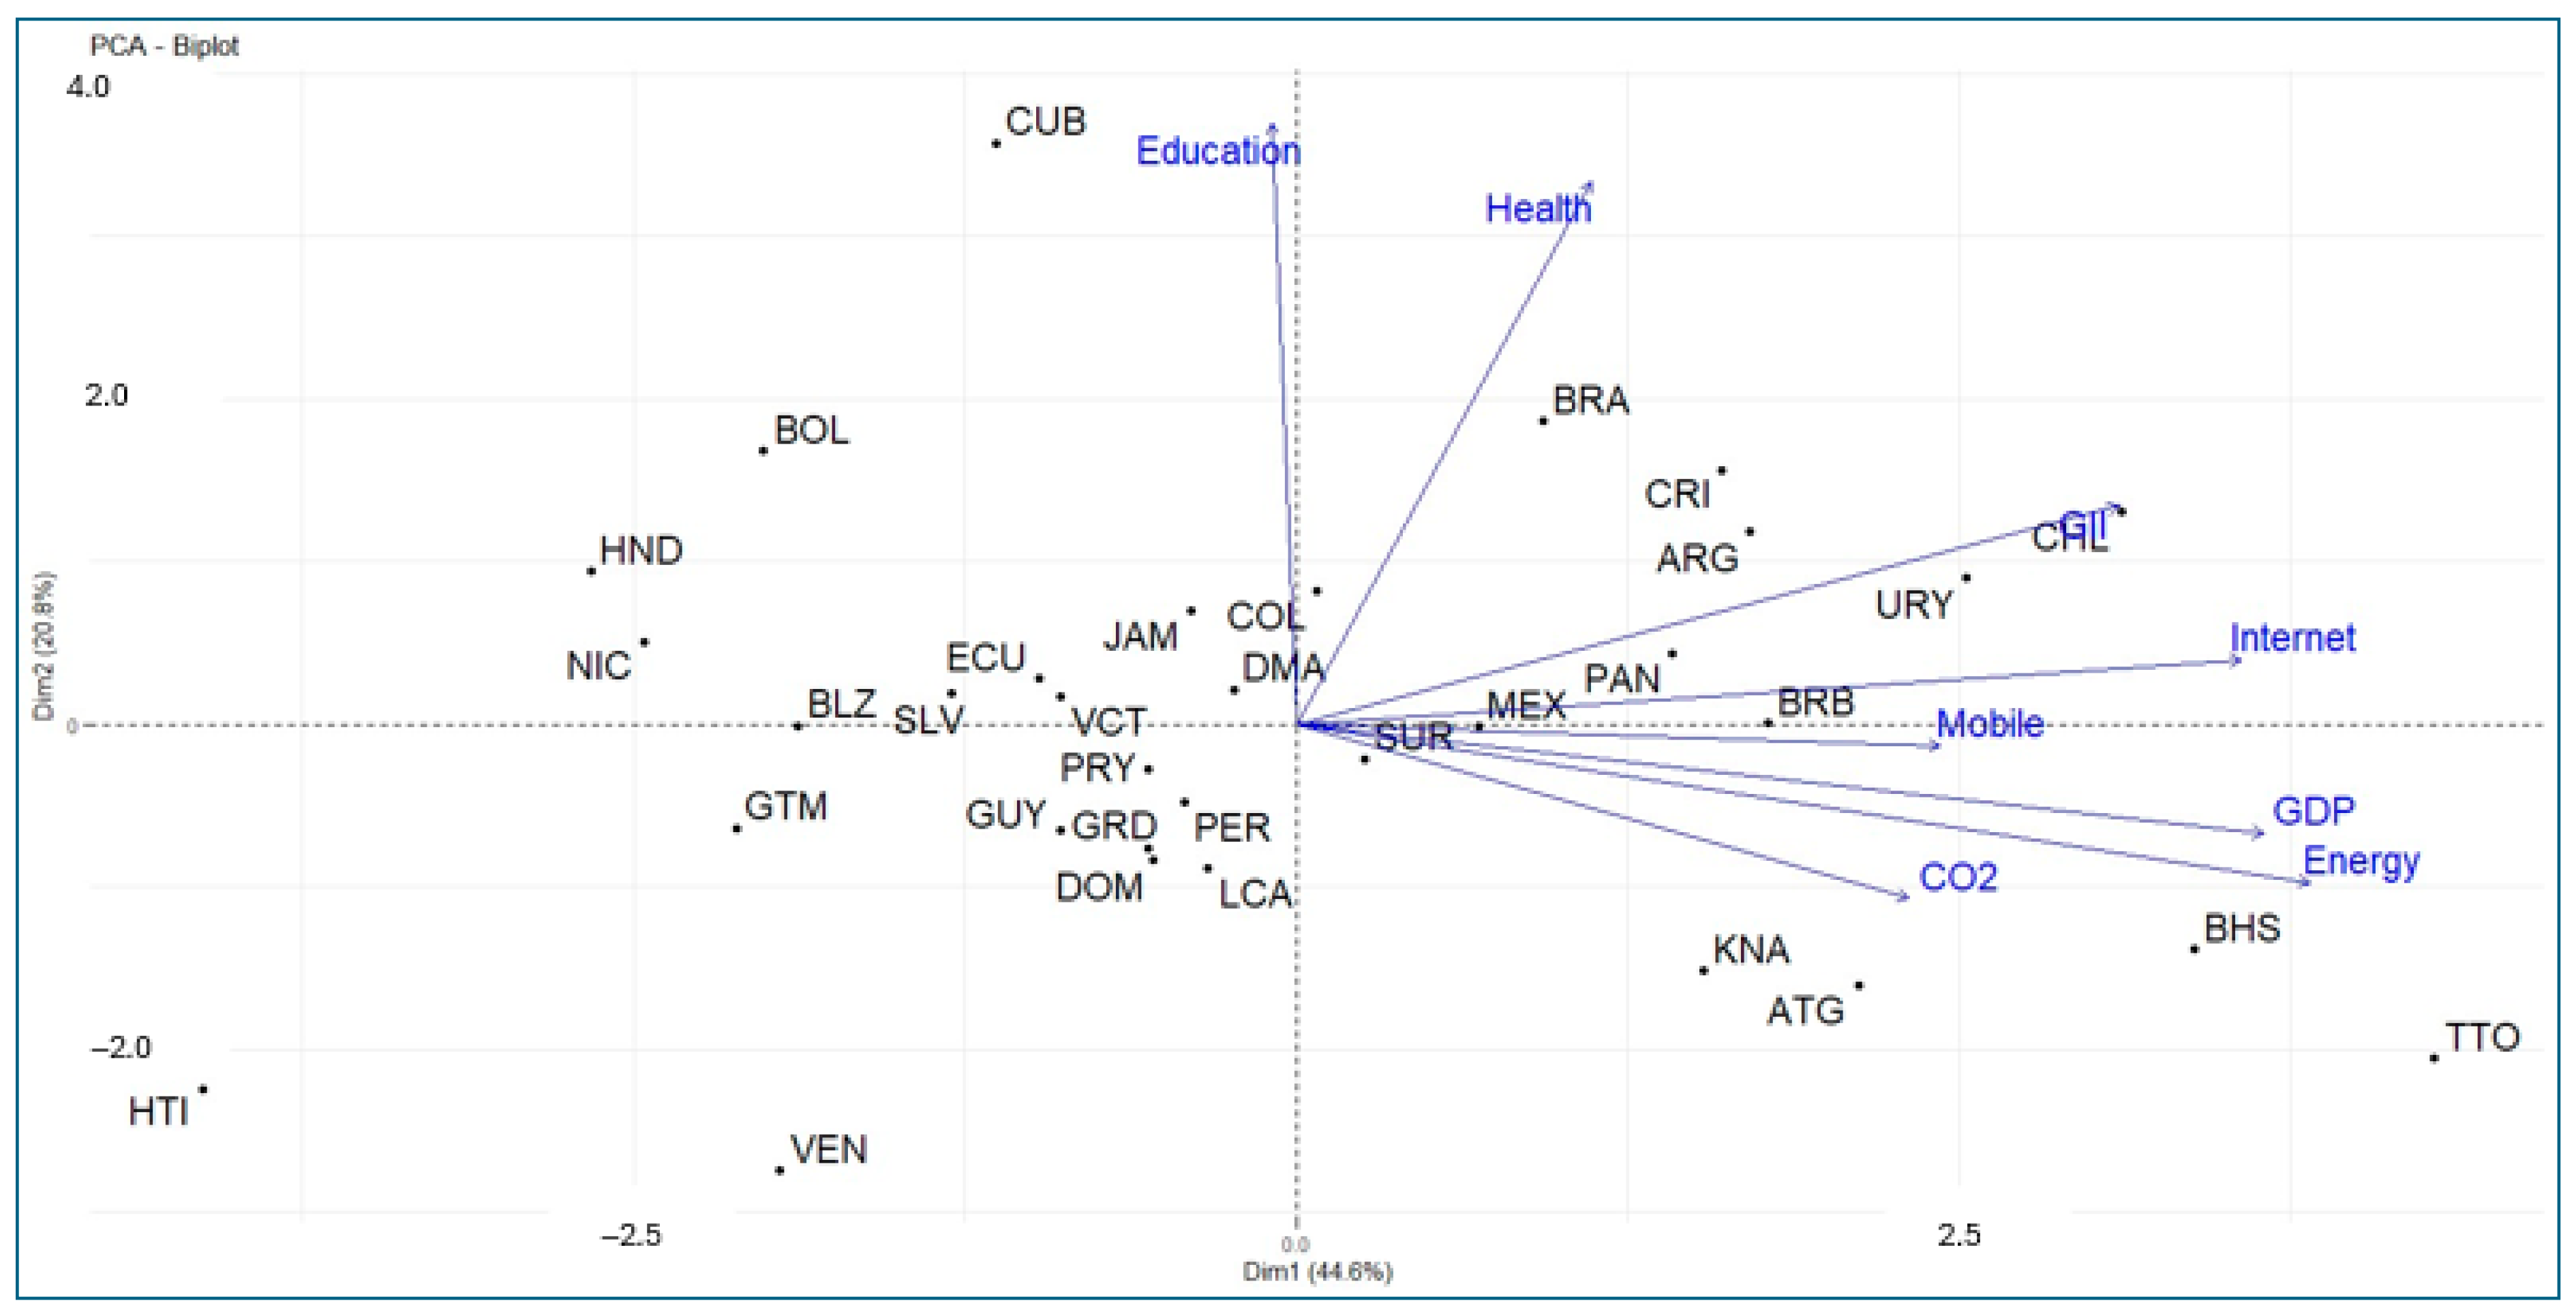
Figure 2 and Figure 3 show the correlations between the variables and the principal components. The correlation circle shown in the figures allows us to visualize the correlations between the quantitative variables and between these and the principal components. It can be seen that the first principal component is strongly associated with the variables energy, GDP, internet users, and GII. On the other hand, the second principal component is strongly correlated with the variables education and health. Similarly, the variables Education and Health are quite correlated with each other, as is the case between the variables energy, GDP, internet, and GII. The mobile phone subscriptions and CO2 variables are associated with the third principal component. This can also be seen in Table 2.
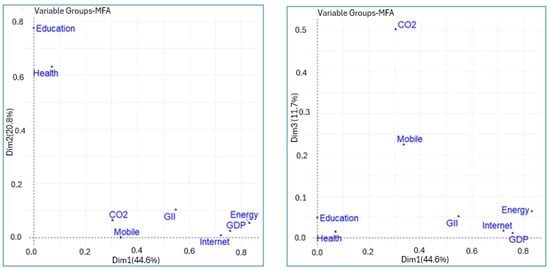
Figure 2.
Coordinates of variable groups with the principal components (MFA).
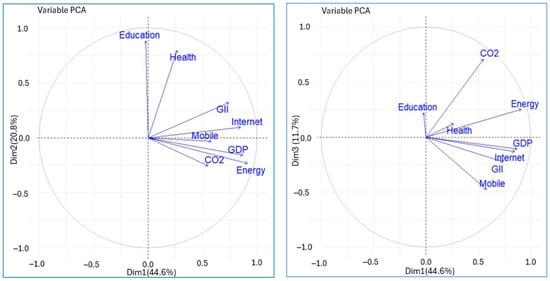
Figure 3.
Correlation between original variables with the principal components (PCA).
Table 2.
Association of the groups of variables with the PCA’s dimensions.
The coordinates of the variables (also referred to as loadings or factor loadings) indicate the strength and direction of the relationship between each original variable and the principal components (dimensions) in PCA. These coordinates reveal how much each variable contributes to a given component, effectively measuring their influence. They are calculated as cosines of the angles between the original variables and the components.
Values close to ±1 signify a strong association—the variable plays a key role in defining that component. Values near zero suggest the variable has negligible impact on the component.
A positive loading means the variable moves in the same direction as the component. A negative loading implies an inverse relationship.
Figure 3 shows the correlation of the variables with the principal components and the correlation between the variables. The angles between variable arrows further clarify their relationships:
A small angle indicates a positive correlation (variables vary together). A 180° angle reflects a negative correlation (one increases as the other decreases). A 90° angle means no correlation—the variables are independent in this component space.
For example, in the principal component space of Dim1 and Dim2, Internet and Mobile are positively correlated. The same interpretation applies to GDP and Energy, as well as Education and Health. On the other hand, in the principal component space of Dim1 and Dim3, CO2 and Mobile are independent in this component space.
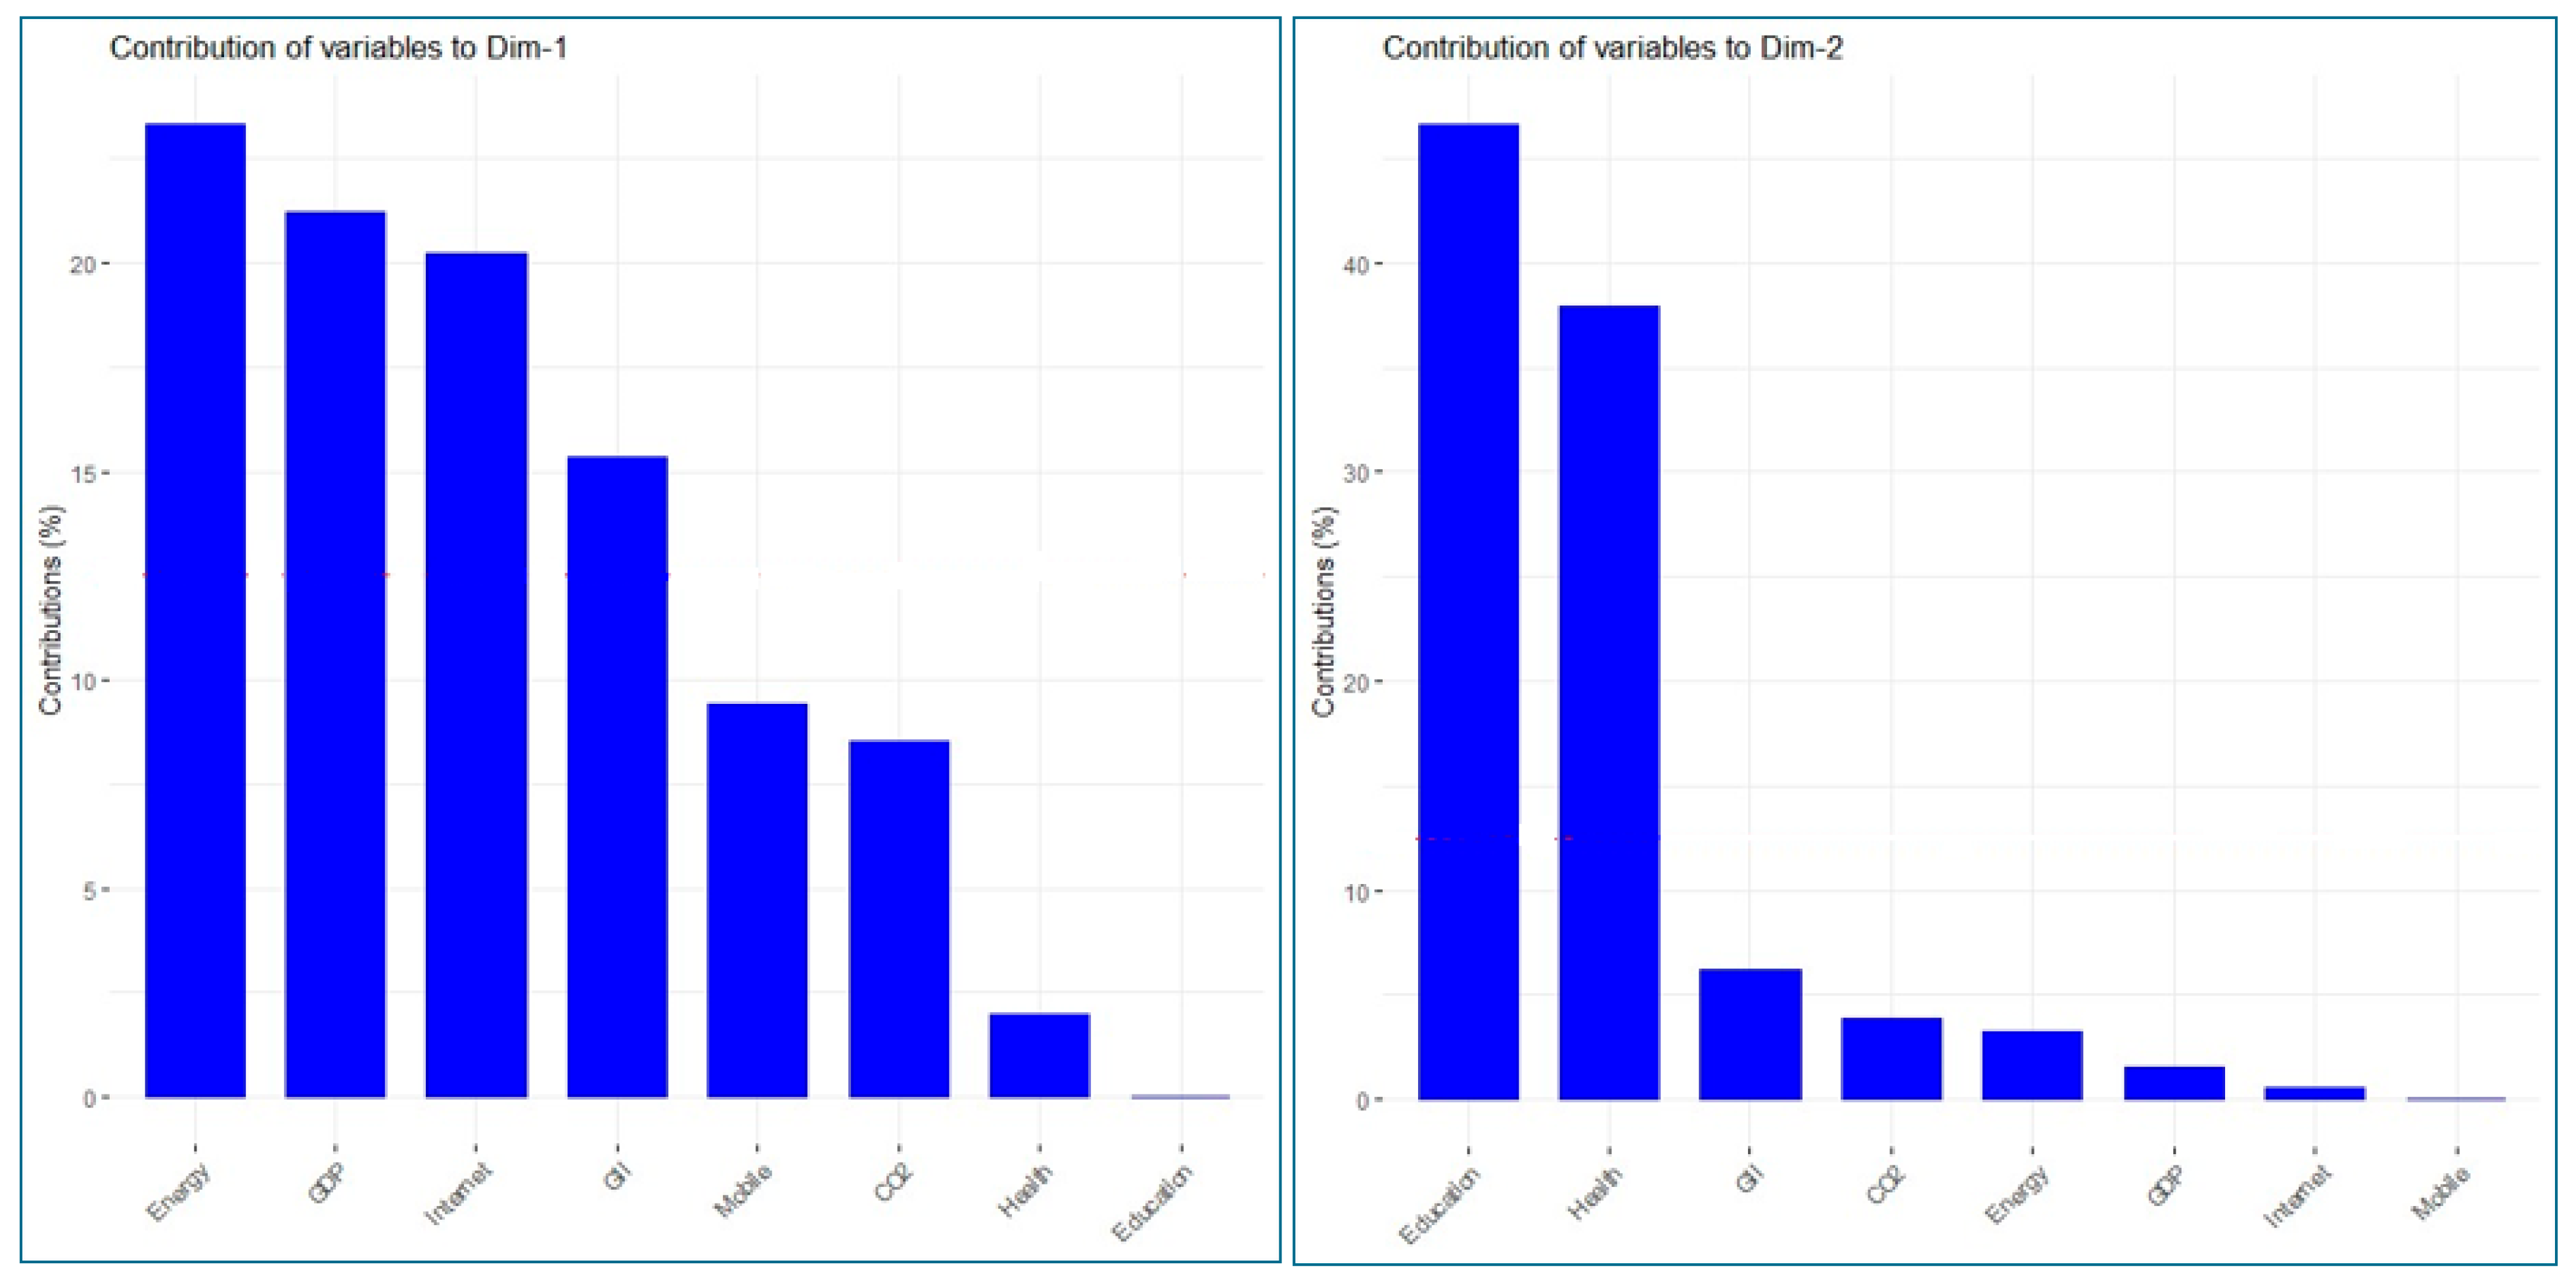
Table 2 shows the association of variables with the principal components. It can be observed how principal component 1 (PC1) is strongly associated with four active variables. Specifically, the Contributions (%) column indicates that 23.31% of the variability captured by the first component is caused by the Energy variable, 21.21% is generated by GDP, 20.23% is produced by the internet, and 15.36% is produced by GII. Therefore, the first factor similarly reflects the information contained in the three groups of variables. On the other hand, the Quality of Representation Cosines Squared column indicates that the first factor explains 75.6% of the dispersion of the GDP variable, 83.10% of the dispersion of energy, 72.1% of the dispersion of the internet, and 54.8% of the variability of the GII. (see Figure 4).

Figure 4.
Contribution of variables to the formation of the principal components.
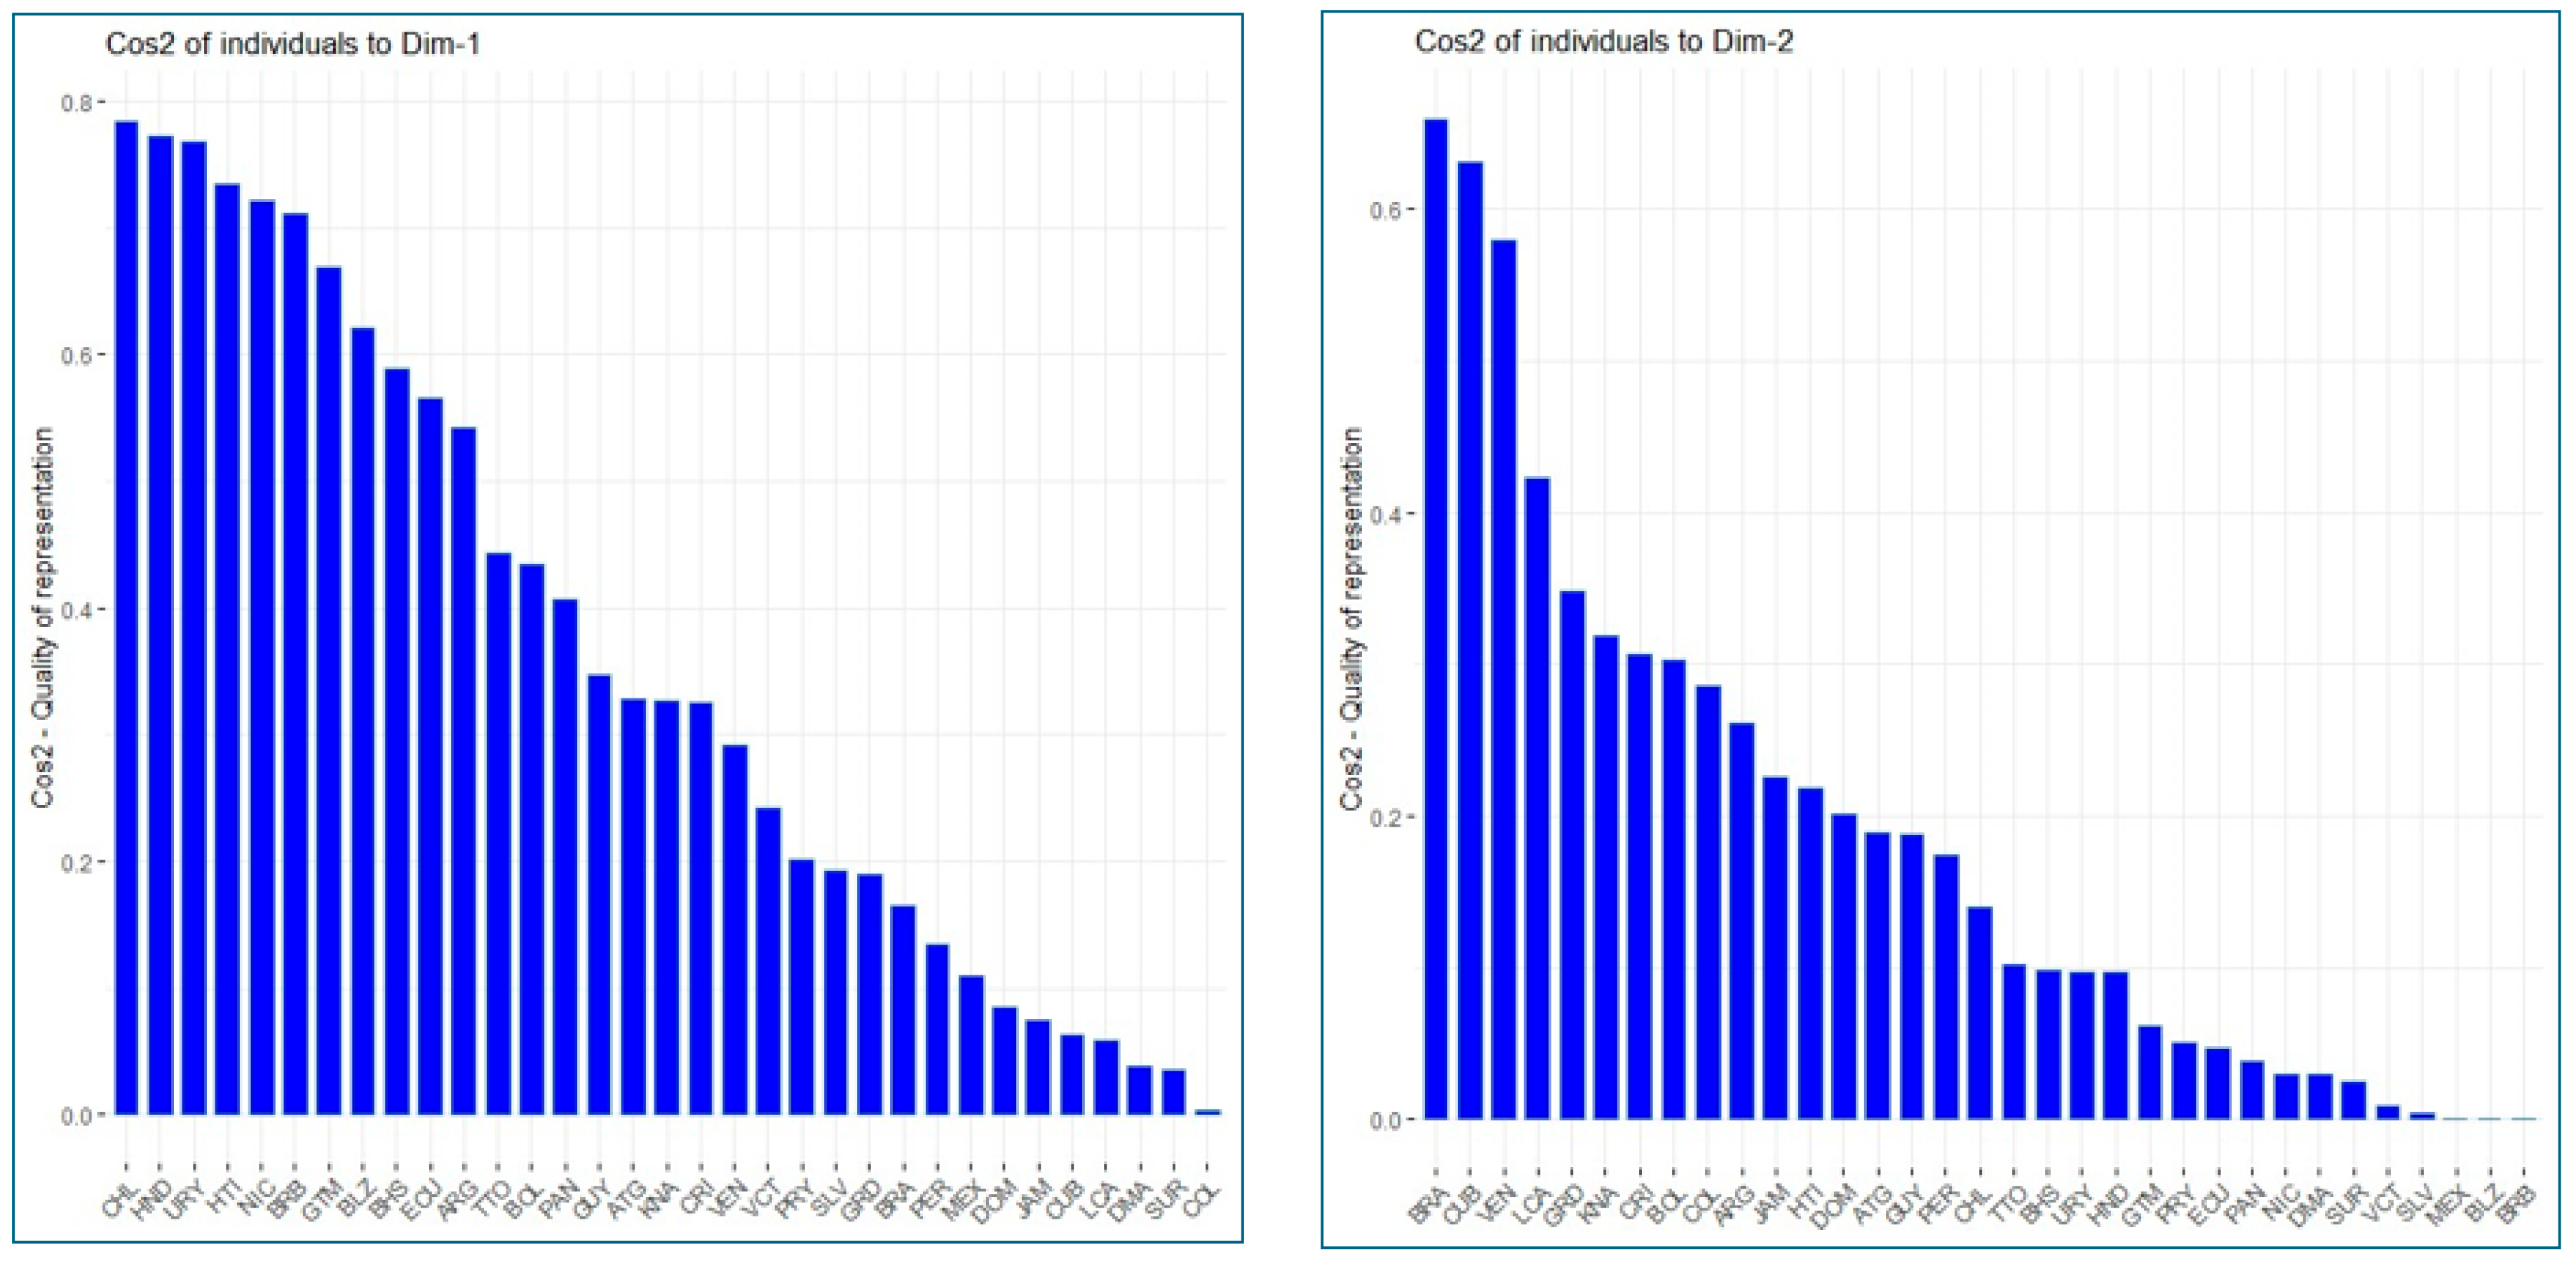
Figure 5 shows the quality of representation of individuals (observations/countries) in the two principal components. Specifically, the first principal component explains 78.42% of the variability in Chile’s variables, followed by 77.21% of the variability in Honduras’ variables and 76.87% in Uruguay’s. On the other hand, the second principal component explains approximately 66% of the variability in Brazil and 63% of the variability in Cuba.

Figure 5.
Quality of representation of observations (countries) in the principal components.
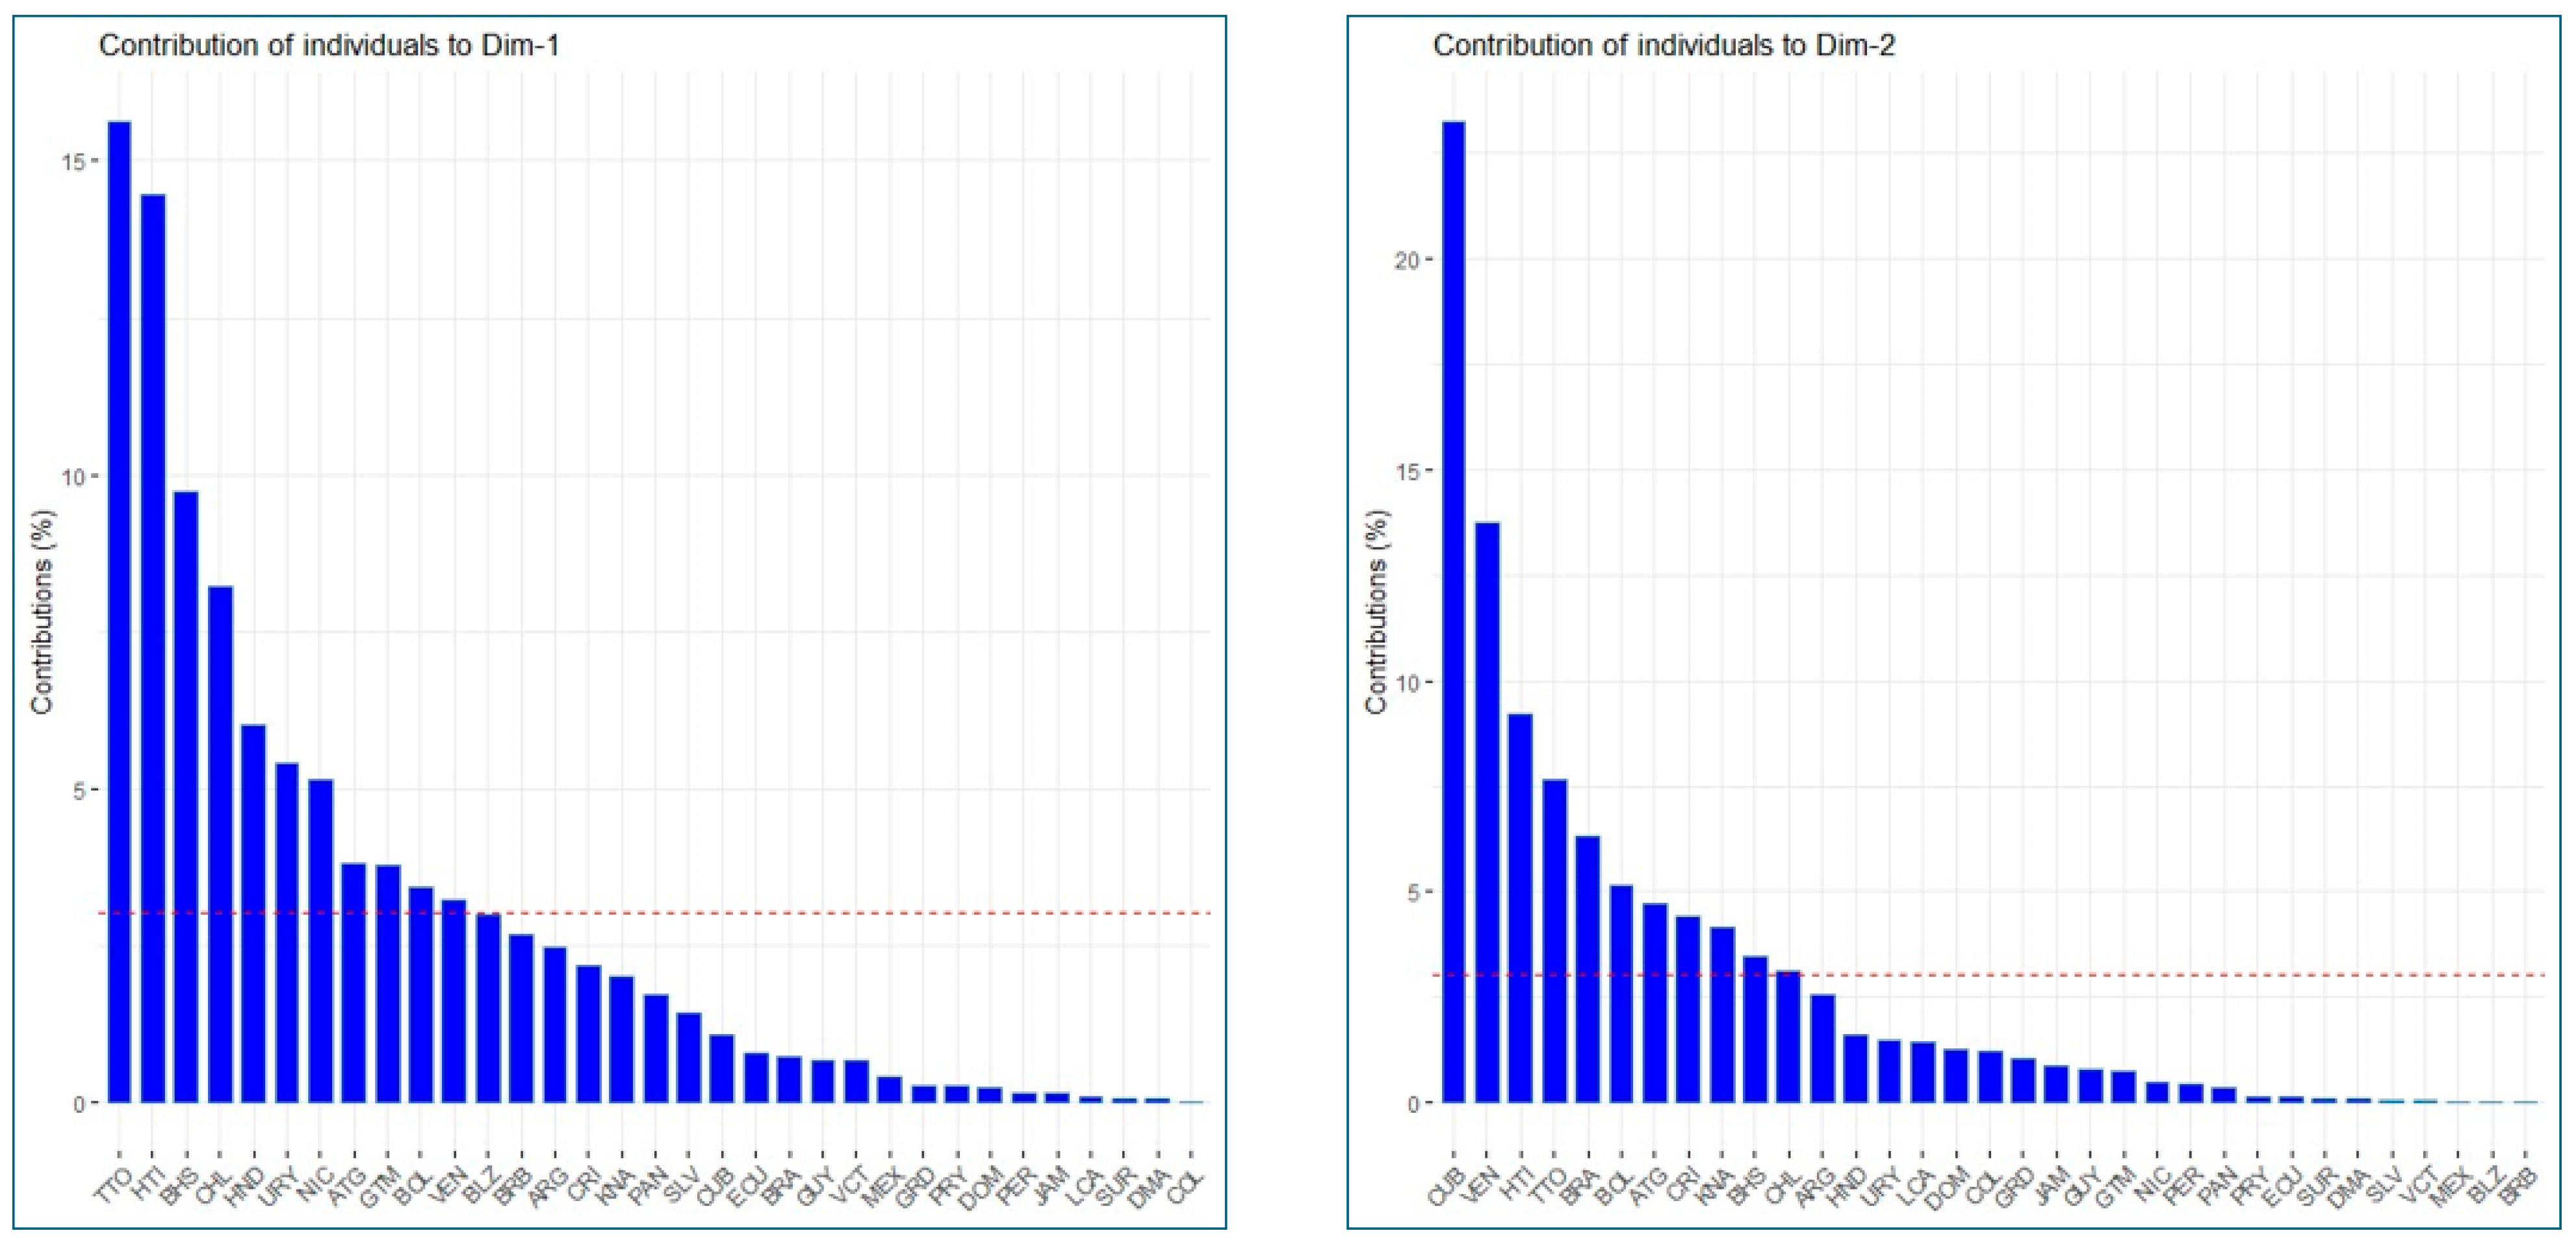
Figure 6 shows the contribution of individuals (countries) in the two principal components. Specifically, Trinidad and Tobago accounts for 15.62% of the first principal component, followed by Haiti with 14.47%. Similarly, Cuba contributes 23.24% of the second principal component, followed by Venezuela with 13.72%.

Figure 6.
Contribution of observations (countries) to the formation of the principal components.
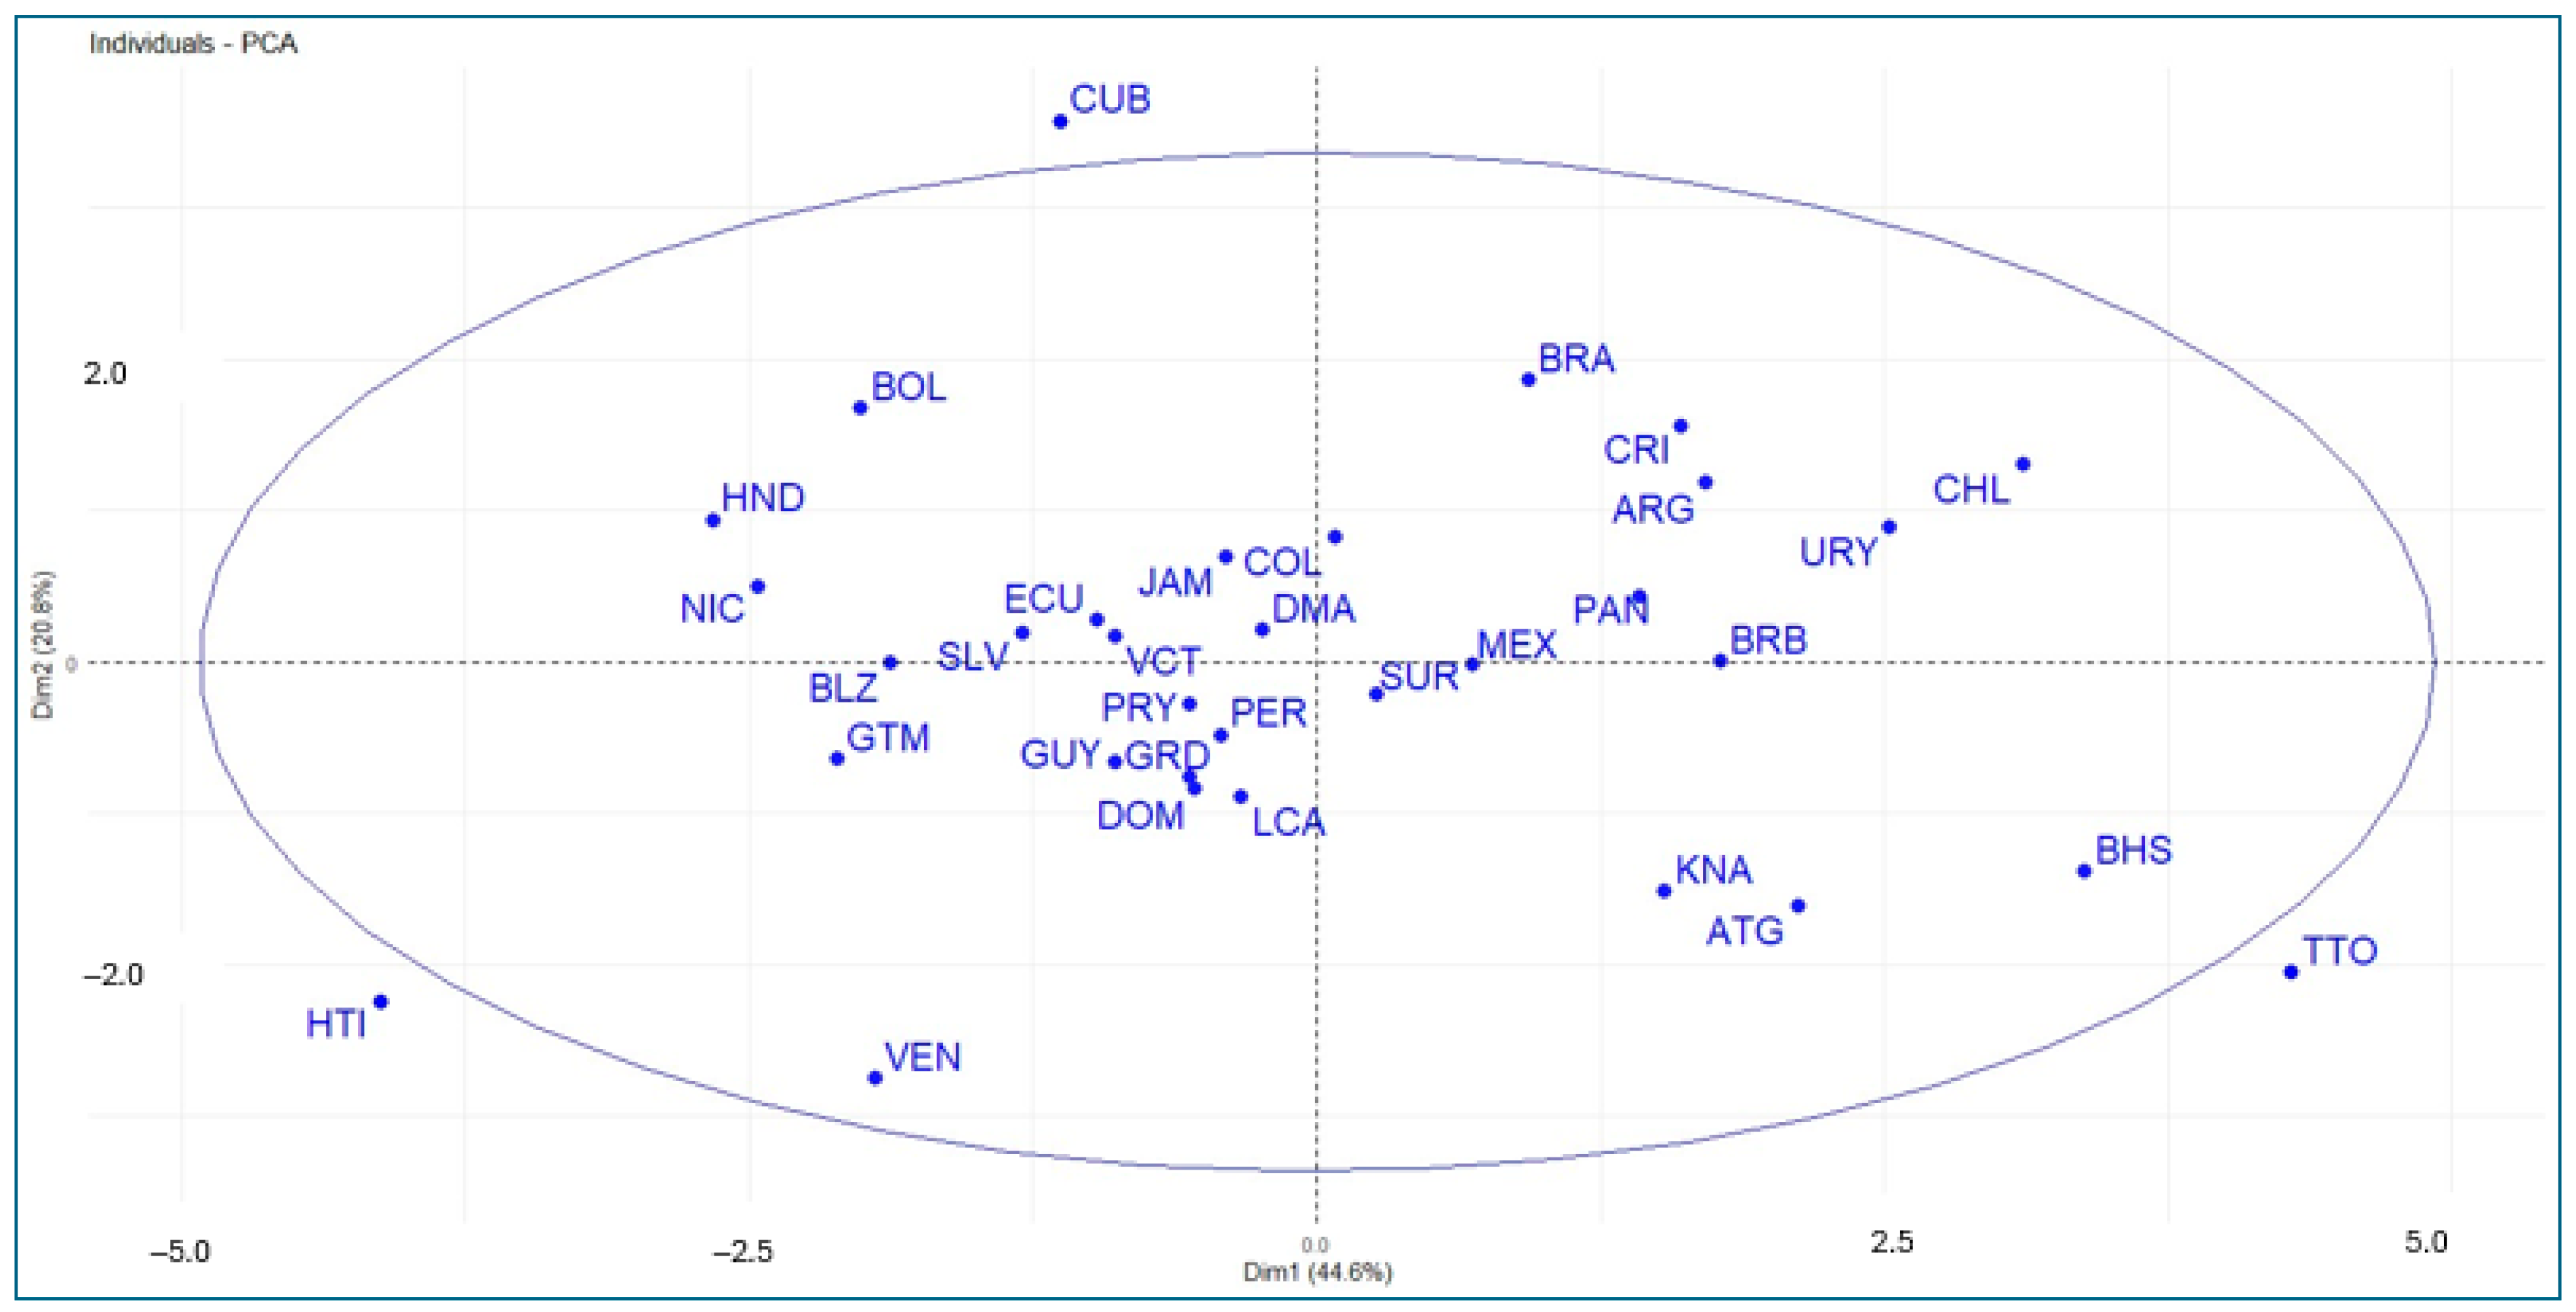
Figure 7 is the projection of the countries onto the factorial plane. This allows us to visualize the behavior of countries according to their scores on the two principal component axes, which helps capture the similarities and differences between the countries considered in the study. It is clear that the countries with the best results (best conditions) are located further to the right of the factorial plane.
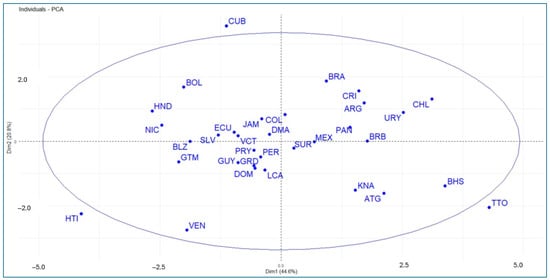
Figure 7.
Representation of the countries on the first two principal components.
In this regard, we find that Trinidad and Tobago show the best score in the first principal component (energy, GDP, internet, and GII), followed by the Bahamas, Chile, and Uruguay. The worst performers are Haiti, Honduras, and Nicaragua. Regarding the second principal component (education and health), Cuba performs best, followed by Brazil, Costa Rica, and Chile. Venezuela performs worst, followed by Haiti and Trinidad and Tobago. Countries located at the vertex of the two axes (e.g., Suriname, Dominica, Peru, Colombia) show average performance. This can be easily interpreted in Figure 8.
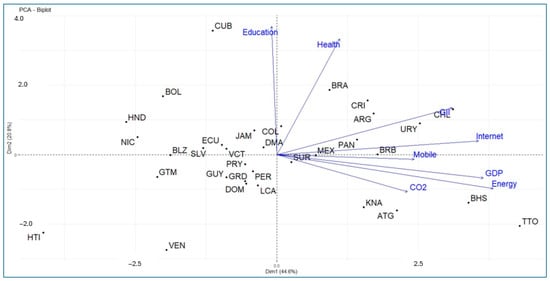
Figure 8.
Representation of the countries and variables on the first two principal components.
4.2. Cluster Analysis Results
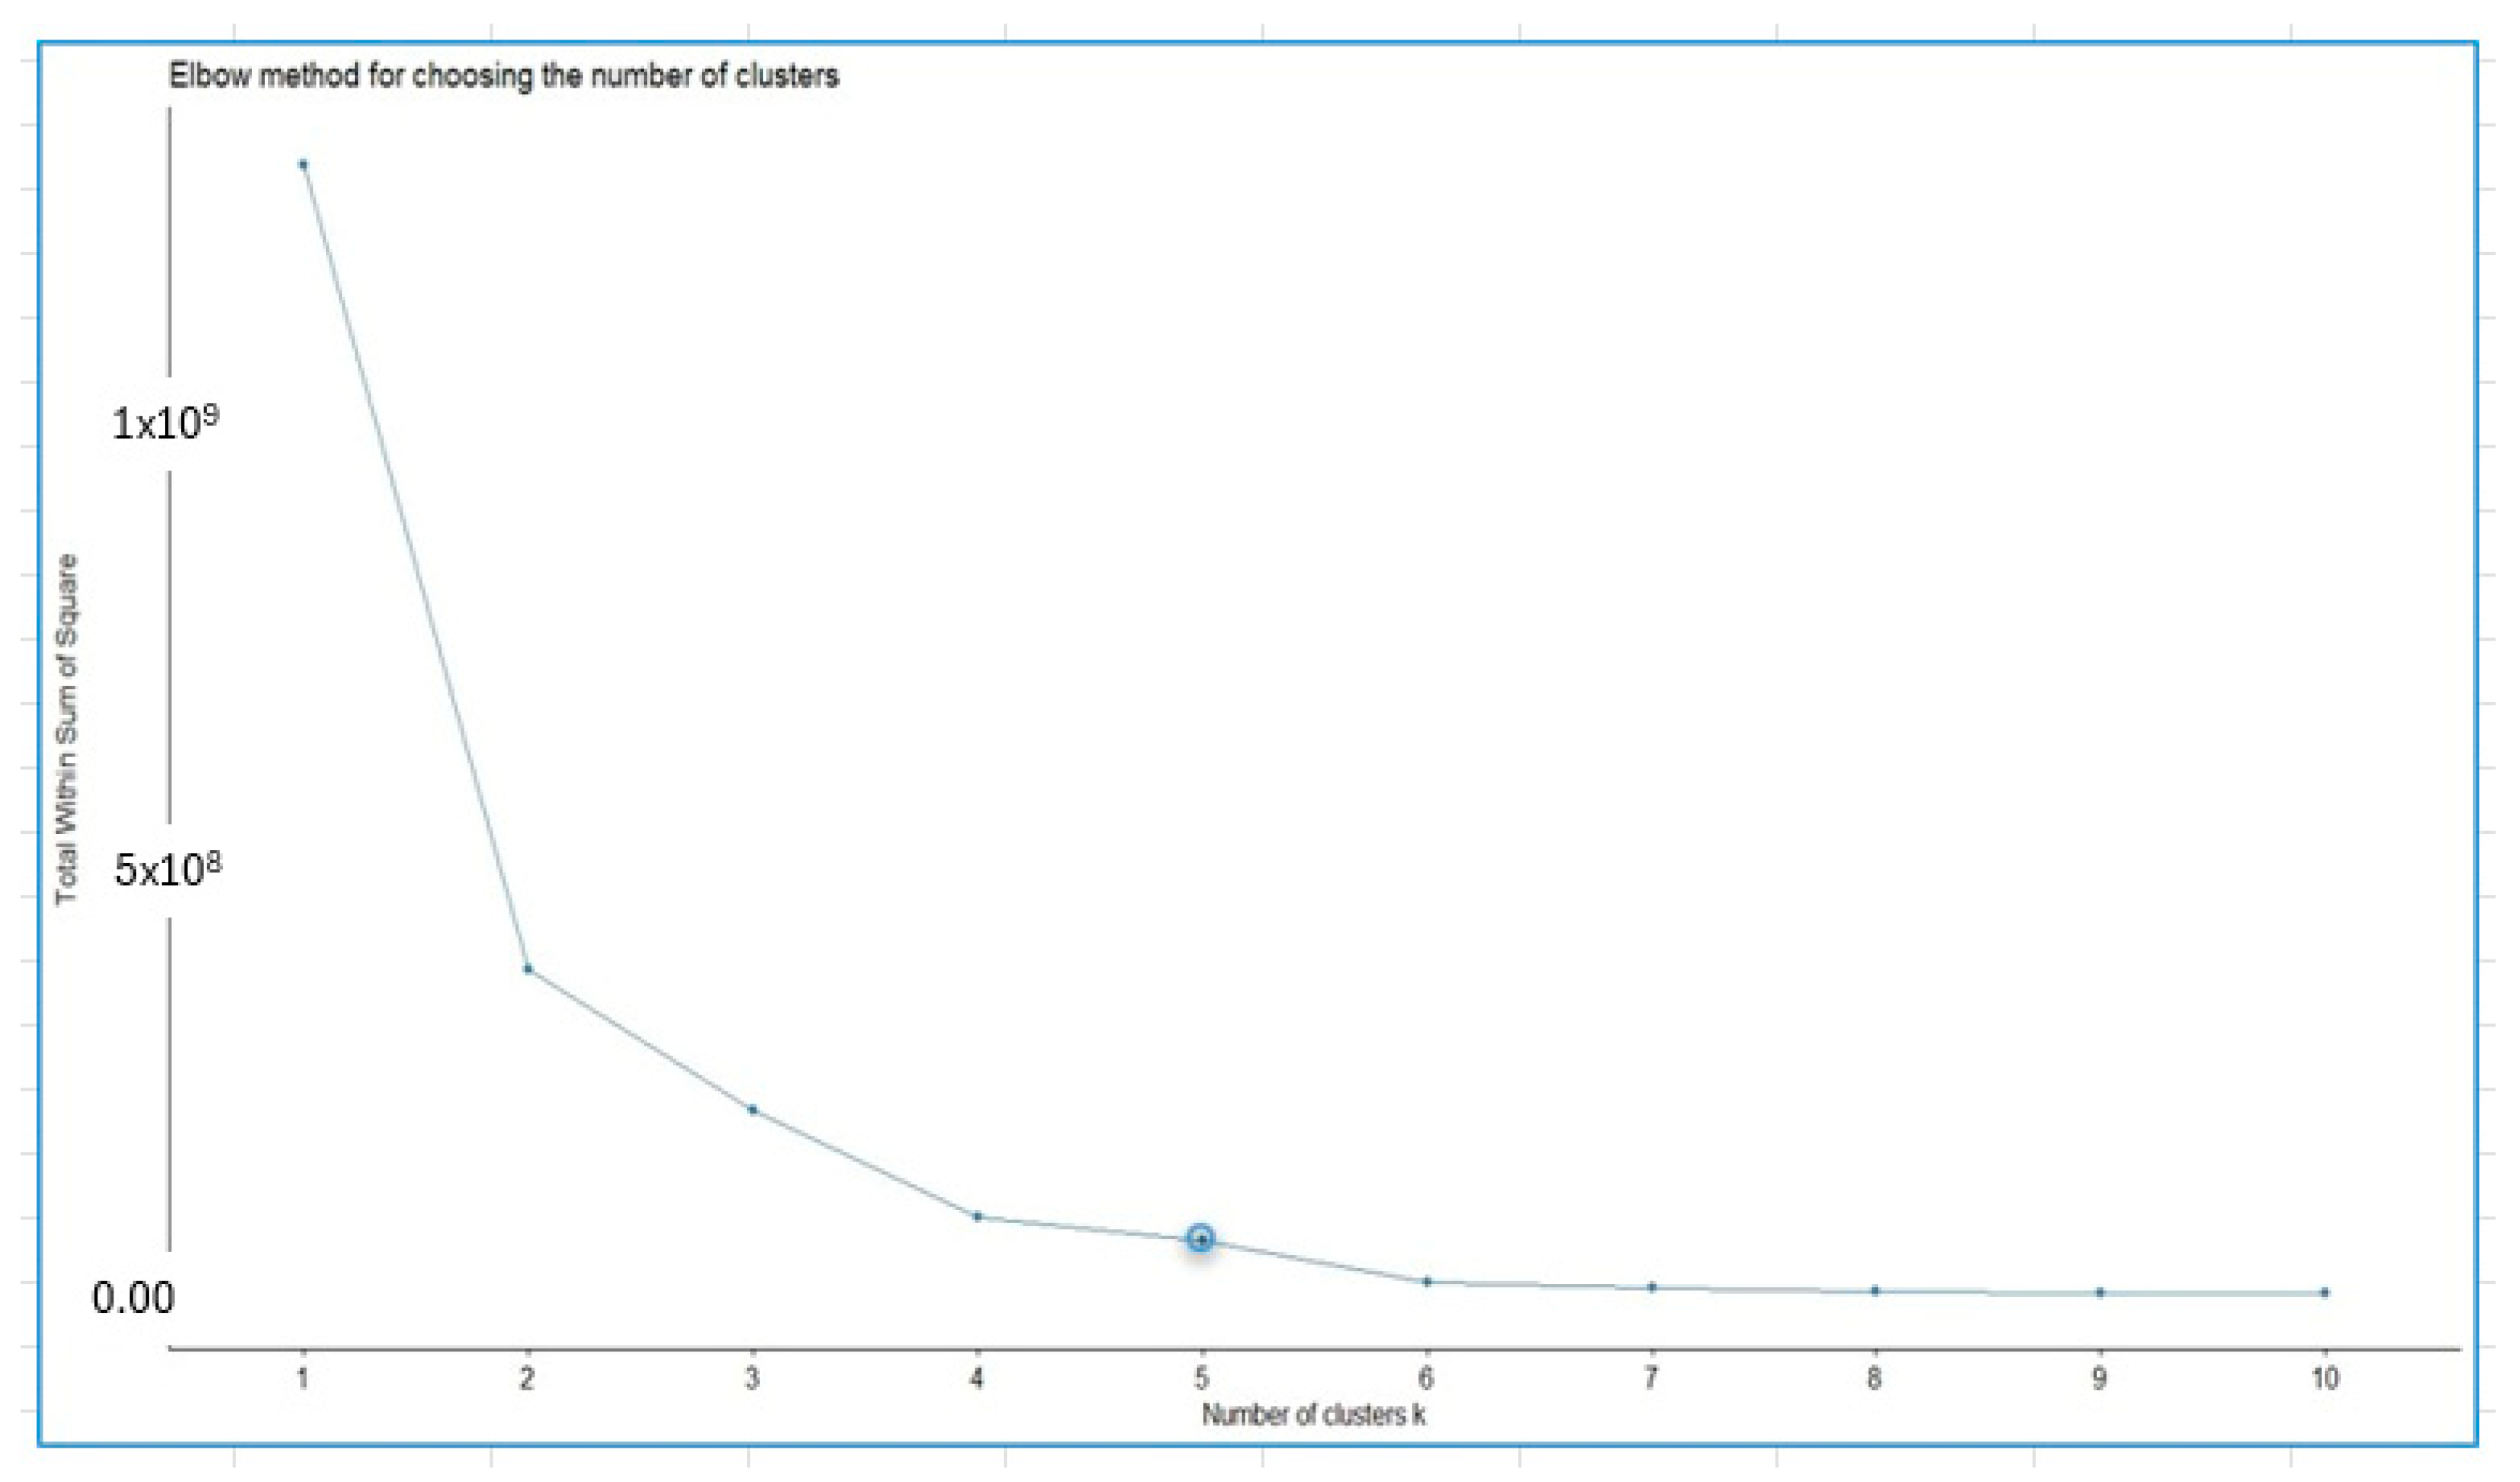
By applying the elbow method, the number of clusters to be used in the hierarchical cluster analysis technique was determined. Figure 9 presents the results of the elbow method for the database studied.
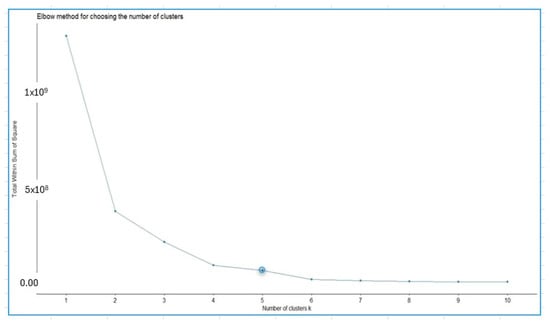
Figure 9.
Elbow method for choosing the number of clusters. The circle indicates the number of clusters.
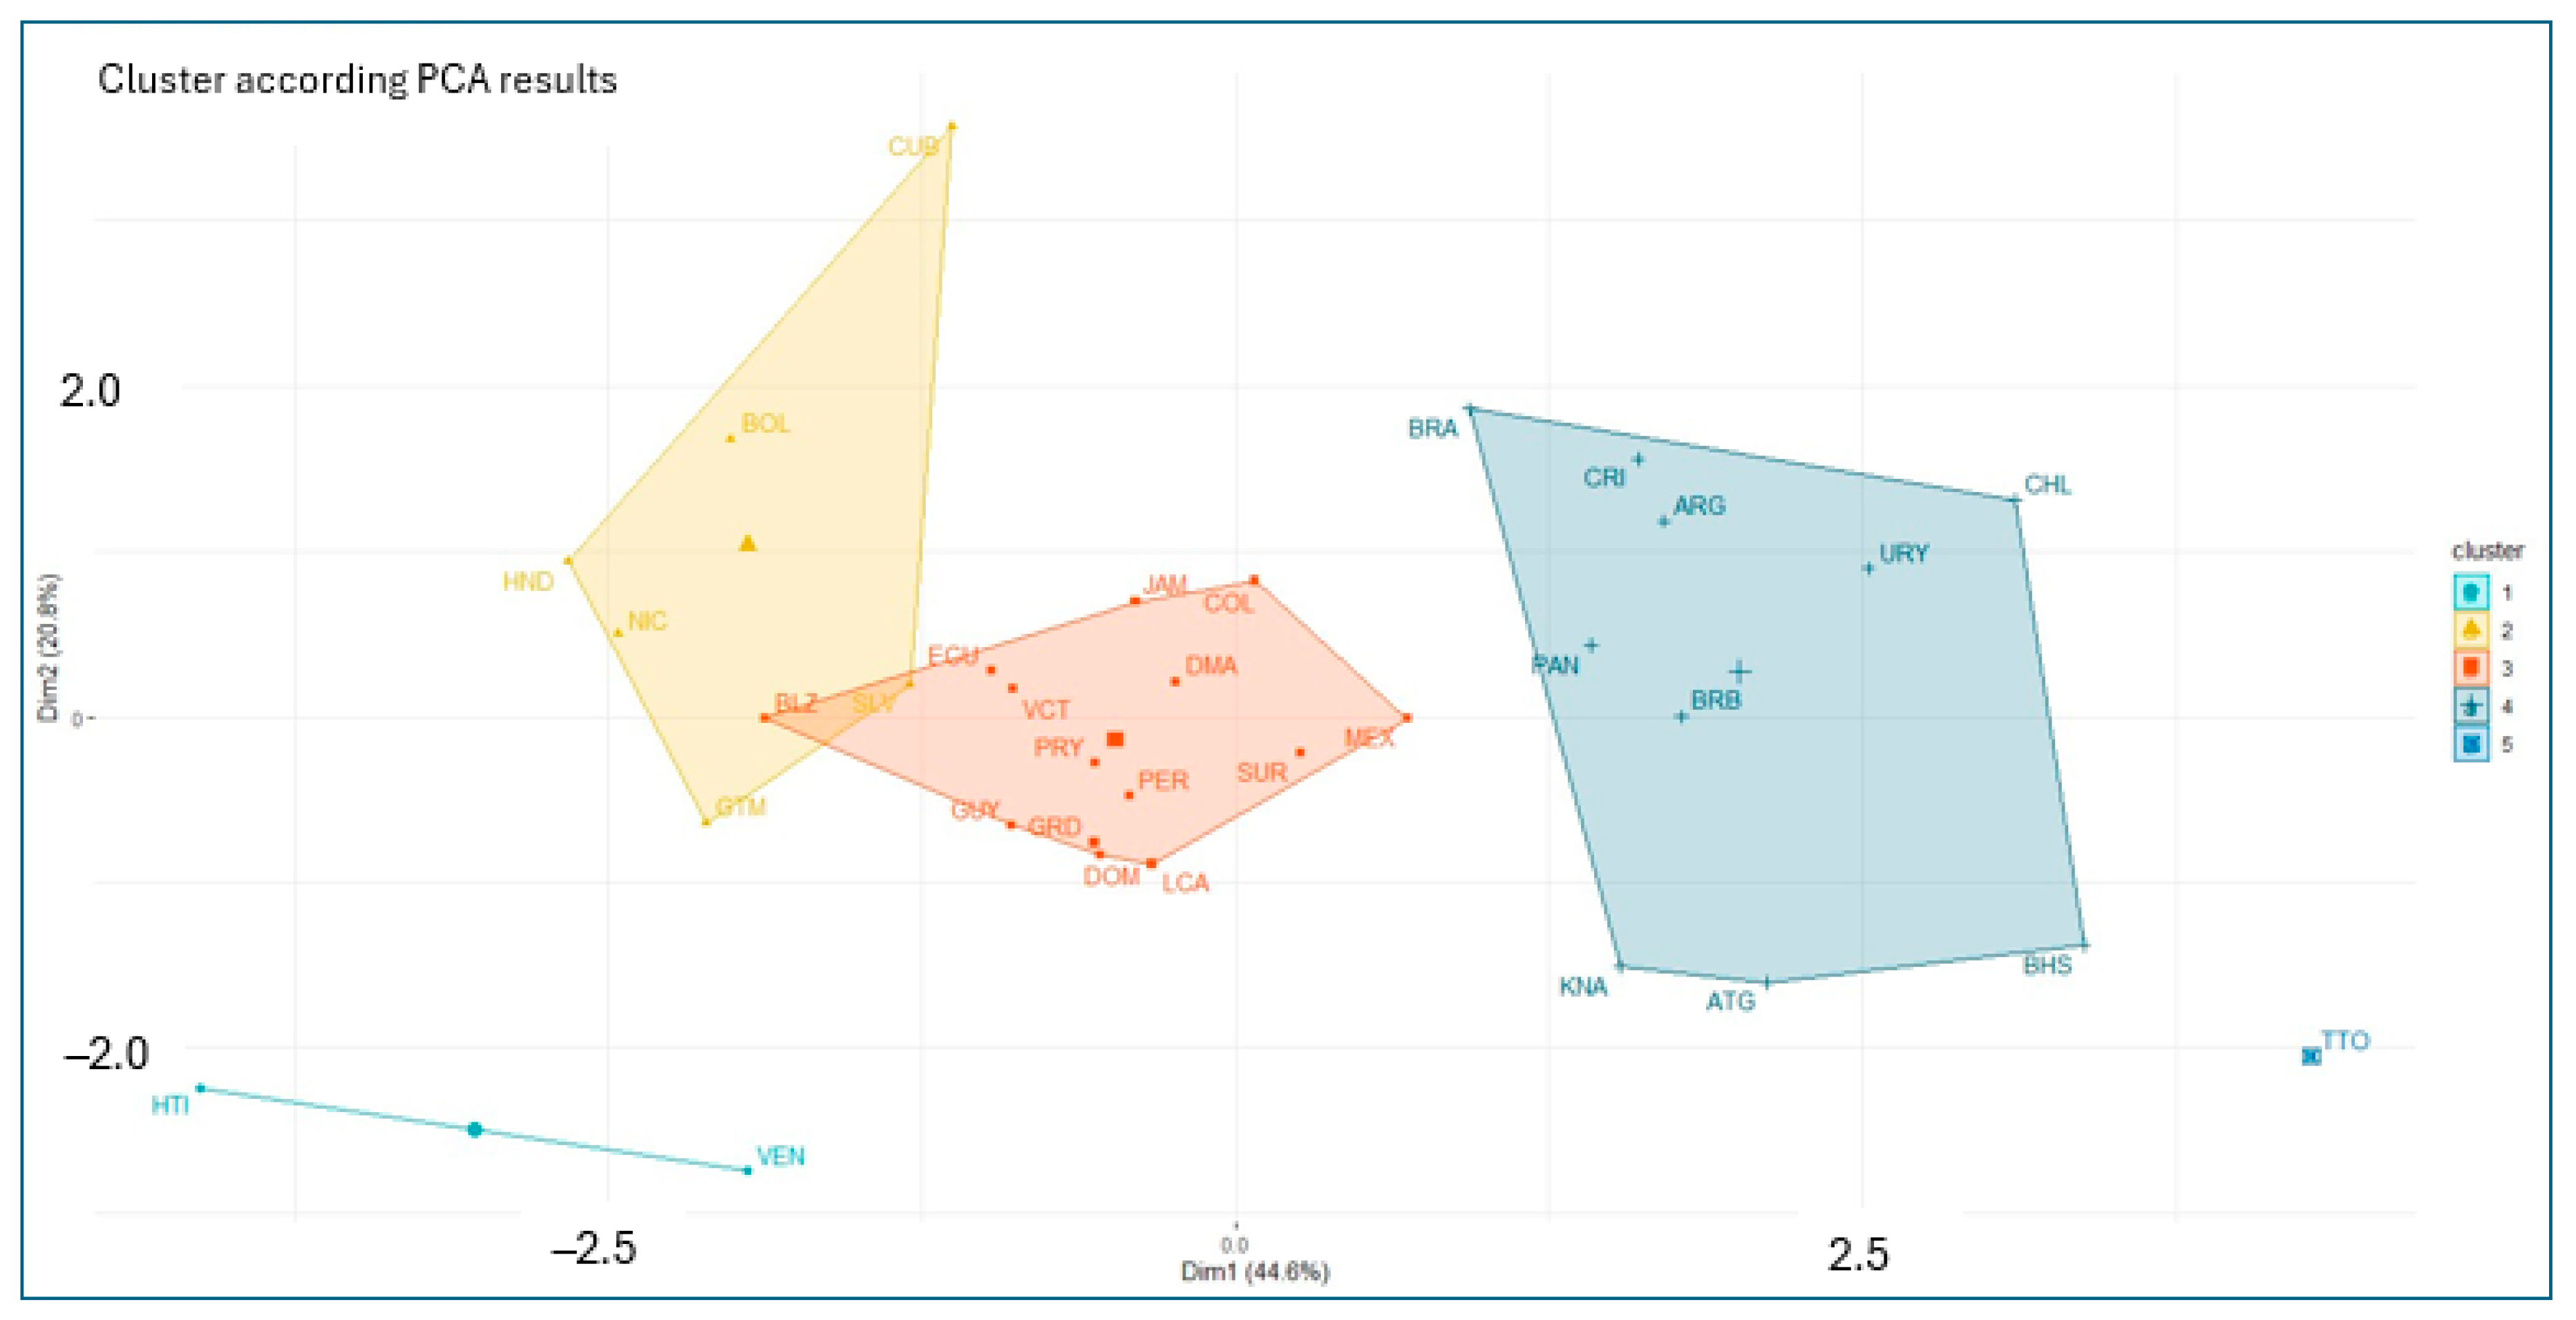
Figure 10 illustrates the results of the agglomerative hierarchical clustering analysis applied to the results of the principal components analysis. The results allow for grouping sets of countries with similar characteristics according to the variables considered in this study.
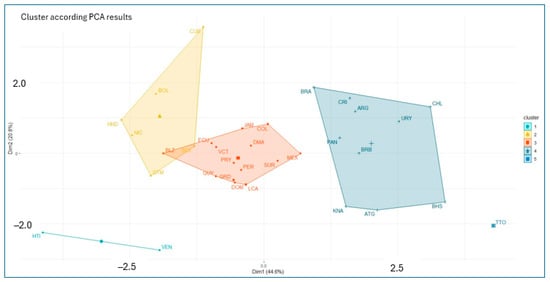
Figure 10.
Cluster on principal component score.
Figure 10 shows three large clusters and two smaller clusters. Haiti and Venezuela form the first cluster (the lowest performer), and Trinidad and Tobago form Cluster 5 (the best performer). Bolivia, Cuba, El Salvador, Guatemala, Honduras, and Nicaragua form Cluster 2 (the second-worst performer); Belize, Colombia, Dominica, Ecuador, Grenada, Guyana, Jamaica, Mexico, Paraguay, Peru, the Dominican Republic, Saint Vincent and the Grenadines, Saint Lucia, and Suriname form the third cluster (the average performer); and Antigua and Barbuda, Argentina, the Bahamas, Barbados, Brazil, Chile, Costa Rica, Panama, Saint Kitts and Nevis, and Uruguay form the fourth cluster (the second-best performer).
Table 3 presents the quantitative variables that best characterize each cluster, revealing the key characteristics that distinguish each group. These variables, ordered by their importance in defining the cluster, allow us to understand the significant differences between the groups. For each variable, the within-cluster mean, the overall mean, the within-cluster standard deviation, and the overall standard deviation are shown. In addition, the p-value associated with the hypothesis test that evaluates whether the mean of each variable within the cluster differs significantly from the overall mean is included. A v-test value greater than 1.96 indicates a significant difference at the 95% confidence level. It is positive if the cluster mean is greater than the overall mean and negative if it is lower (Husson et al., 2010).
Table 3.
Variables that characterize each cluster.
Cluster 1 is characterized by:
- Low access to internet and mobile devices;
- Low Global Innovation Index (GII);
- Low percentage of investment in health and education.
Cluster 2 is characterized by:
- High percentage of investment in health;
- Low GDP and energy consumption per capita;
- Medium internet access.
Cluster 3 is characterized by:
- A percentage of investment in health that is slightly lower than the world average.
Cluster 4 is characterized by:
- Significantly higher levels of GDP per capita, Global Innovation Index (GII), internet access, energy consumption per capita, and access to mobile devices.
Cluster 5 is characterized by:
- Significantly higher levels of CO2 emissions and energy consumption per capita.
To better understand each cluster, we can examine the observations (countries) that are most representative of its characteristics. For each cluster, we calculate the distance from each observation to the cluster’s center point (centroid). Table 4 highlights the five observations closest to the centroid of each cluster, providing a clear picture of the typical members of each cluster.
Table 4.
The five closest observations to the centroid of each cluster.
To identify the most representative countries within each cluster, we can rank each one according to its proximity to the centroid of the cluster to which it has been assigned. This process allows us to identify the “core” members of each cluster, those that most accurately represent its defining characteristics. Table 5 shows each of these countries, ordered from closest to farthest from their respective centroids, providing a detailed view of the most representative members of each group. These representative countries are Haiti, Cuba, the Dominican Republic, and the Bahamas.
Table 5.
The five specific observations for each cluster.
5. Discussion
The results obtained using principal component analysis (PCA) confirm the relevance of reducing the dimensionality of a broad set of variables, as it allows for capturing the majority of variability with a small number of components. This approach is particularly useful when working with multiple indicators that encompass economic, social, and environmental dimensions (Cooper et al., 2007). In the present study, the selection of principal components was guided by statistical criteria (eigenvalue > 1, explained variance, and the scree plot), ensuring that the largest proportion of the original information was preserved.
The use of hierarchical agglomerative analysis using Ward’s method, applied to PCA scores, allowed for the identification of robust and structurally coherent groupings of countries. This strategy, based on Euclidean distance and validated using the elbow method and the silhouette index, not only facilitated visually interpretable segmentation but also eliminated redundancies and collinearities between indicators. Compared with approaches such as K-means or models based on observed variables (Pick et al., 2021), the hierarchical structure offered a more flexible and robust classification for the Latin American context, reinforcing the usefulness of this methodological combination in multidimensional development studies (Möring-Martínez et al., 2024; Jiménez-Preciado et al., 2024; Krishnan & Firoz, 2023). This strategy minimizes biases that could arise from simultaneously including correlated variables, providing a clearer view of the underlying structure in the data.
The findings suggest that nations with higher levels of variables linked to innovation, digital connectivity (internet and mobile phone users), and GDP per capita tend to cluster together, reflecting development patterns focused on economic diversification and technology adoption. On the other hand, countries located in lower-performing clusters share traits such as less access to digital services or reduced investment in health and education, which is consistent with the literature linking human capital accumulation and technological advancement with greater growth and well-being. (Pérez-Morote et al., 2020; Al-Worafi, 2024).
The robustness of the results was reinforced by conducting Bartlett’s test of sphericity to support the use of PCA. This reduced the likelihood of overfitting or underfitting the true structure of the data. Additionally, replicating the analysis using different distance metrics (e.g., Euclidean and Manhattan distance) would have been an additional step to compare the stability of the clusters (Plaza-Díaz et al., 2020; Haining et al., 2022; Niu et al., 2022).
This work offers a comprehensive methodological approach in comparison with other previous studies in the context of Latin America and the Caribbean. Santiago et al. (2020) examined the role of globalization and economic freedom in growth through ARDL models, but they did not address latent structures or consider regional segmentation. Ahmed et al. (2021) constructed an ICT index using principal component analysis (PCA) and link it to environmental sustainability; however, they do not attempt to group countries or validate the data structure. Pick et al. (2021) used K-means clustering to study the digital divide in the region, but their analysis is based only on observed variables, and no internal validation tests are mentioned. In contrast, this study applies PCA followed by hierarchical cluster analysis, allowing for a detailed identification of groupings across countries. This combination offers a broader view of development in the region by integrating variables related to health, education, economic performance, sustainability, and digital innovation.
The combination of principal component analysis (PCA) and cluster analysis has both absolute and relative methodological advantages over other methods used in country classification studies. PCA is different from methods like data envelopment analysis (DEA) or multivariate regression models since it can combine a lot of multidimensional data without making any assumptions about how productive something is or how things are related.
From a comparative perspective, studies that exclusively use methods like K-means tend to simplify the structural complexity of countries by relying on arbitrarily selected variables or direct aggregations. In contrast, PCA empirically identifies the latent dimensions that explain the variability, which improves the quality of the subsequent clustering.
Additionally, the use of hierarchical analysis (Ward) on the principal components guarantees greater robustness in segmentation compared to models that operate directly on the original variables, which are often correlated with each other. This reduction in multicollinearity and the emphasis on the internal structure of the data provide researchers and professionals with a more interpretable, replicable, and useful classification for public policy design.
Together, the PCA–Cluster combination presents itself as a solid methodological alternative, especially in contexts where capturing complex structural patterns is required, such as in the case of Latin America and the Caribbean. This comparative perspective reinforces the practical utility of the study, particularly for those responsible for regional planning and analysis.
These results show that PCA can help group countries and find clusters. Even though PCA is not a clustering method on its own, it can still make the results of hierarchical clustering better by showing patterns in the data when looking at how countries perform in different areas.
Interpretación Integral de Los Conglomerados: Desempeño, Estructura y Fundamentos Teóricos
The classification into five clusters not only highlights quantitative differences among the countries of Latin America and the Caribbean but also allows for the identification of comprehensive development profiles, supported by historical trajectories, institutional configurations, economic structures, and sociocultural foundations. This section aims to analyze the emerging patterns in relation to the theoretical literature on multidimensional development, governance, and structural transformation.
Cluster 4, composed of Uruguay, Chile, Costa Rica, and Panama, represents a group of high structural performance. These countries combine high per capita income, high levels of innovation, robust technological connectivity, and widespread access to essential public services. From the theory of human capital and knowledge-oriented development models (Asongu & Nwachukwu, 2017; Alkhayrat et al., 2020), this group illustrates how sustained investment in education, science, and governance can translate into tangible well-being outcomes. Institutionally, they show greater state efficiency, regulatory stability, and relative social cohesion. In productive terms, more diversified economies are observed, with the capacity to insert themselves into global value chains, sustaining a virtuous cycle between internal capabilities and external opportunities.
At the opposite end, Cluster 1, consisting of Haiti and Venezuela, reflects a pattern of multidimensional low performance. The flaws show up in low levels of social investment, a failing educational system, bad connections, and the breakdown of institutions. Guillén-Fernández (2024) and Santos et al. (2023) said that without basic governance and state legitimacy, development indicators not only stop moving forward, but they can even move backward for a long time. These situations are in line with what they said. Both countries have weak or broken production structures, rely heavily on remittances or other outside resources, and cannot create long-term value. They are dealing with a lot of distrust, a lot of people moving away, and a collapse of the social contract, all of which make their structural vulnerability worse.
Cluster 2, which contains Bolivia, Honduras, Nicaragua, and Guatemala, does okay but not great. Some social indices, such as spending on health or education, show redistributive measures, but these do not always lead to more income, creativity, or environmental sustainability. The main activities that make these countries productive are primary activities, which have poor productivity and little added value.
The structural limitations described by Kamari and Schultz (2022) are reflected in persistent informality, dependence on natural resources or remittances, and limited digital transformation. On the institutional level, there is fragility in public management, low tax pressure, and unequal service coverage. Ethnic and cultural diversity, although a potential wealth, often does not integrate effectively into development processes.
Cluster 3, more diverse, groups countries like Peru, the Dominican Republic, Ecuador, and Paraguay, with intermediate performance. These countries show partial progress in connectivity, health, and GDP per capita, but without structural consolidation. From the perspective of Pick et al. (2021) and Pérez-Morote et al. (2020), these are economies that transition between traditional models and proposals more oriented towards innovation, although with institutional limitations to sustain the reforms. Economic structures tend to be dual: modern sectors (mining, tourism, financial services) coexist with large areas of informality or rural backwardness. At the sociocultural level, governance is more stable than in Cluster 2 but is still conditioned by political cycles, regional fragmentation, or distrust towards the elites.
Cluster 5, composed exclusively of Trinidad and Tobago, constitutes an atypical case. Its economic performance is high in terms of per capita income and energy consumption, but it is based on an economy intensive in fossil resources. From Almulhim’s (2024) perspective, this type of economy faces the “paradox of plenty”: growth with low diversification and risks of external volatility. Although its social indicators are acceptable and its institutions relatively stable, the model is vulnerable to international price shocks and faces long-term sustainability challenges. The country’s cultural and religious diversity, along with regional heterogeneity, poses additional challenges for social cohesion.
In summary, this integrated interpretation shows that empirical classification is not only useful for describing but also for explaining structural differences in regional development. The conglomerates reflect divergent paths, where performance is inseparable from factors such as institutional quality, economic structure, and social fabric. Far from being a technical segmentation, this typology constitutes an interpretative tool that allows us to understand how capacities, constraints, and opportunities are articulated in the different national contexts of Latin America and the Caribbean.
From this study, it follows that Latin America and the Caribbean cannot be analyzed as a homogeneous development block, as there are clearly differentiable structural patterns that go beyond individual country statistics. The classification into conglomerates, based on multiple dimensions—economic, social, technological, and environmental—allows for the precise identification of groups of countries facing similar challenges and, therefore, could benefit from differentiated and collaborative regional strategies.
The analysis shows that countries with greater digital connectivity, investment in innovation, and human capital tend to achieve higher levels of development, while those with low state capacity and limited social investment present more adverse conditions. Furthermore, by incorporating a sociocultural reading of the results, it is recognized that the numerical indicators reflect, in many cases, historical trajectories, institutional dynamics, and deeply rooted cultural contexts.
For all the above reasons, this study offers a useful and adaptable methodological tool for classifying countries based on comprehensive criteria, providing empirical evidence to support targeted public policies. At the same time, it invites us to rethink regional development from a logic of segmented and contextualized cooperation instead of universal recipes.
6. Conclusions
In this study, we proposed a methodology to understand the performance of Latin American and Caribbean countries in several key areas. To do so, we combined principal component analysis (PCA) with hierarchical cluster analysis. The objective is to group countries based on indicators related to education, health, economy, environment, and technology. This combination allows us to analyze complex information more easily and identify patterns that might not be obvious at first glance.
The results show that countries with higher GDP per capita levels, better Global Innovation Index (GII) scores, greater digital connectivity, and higher per capita energy consumption tend to appear in groups with greater overall development. On the other hand, countries with less access to the internet and mobile devices, lower GII values, and lower investment in health and education tend to be located in clusters with less favorable conditions. This type of grouping helps build a clearer picture of the region and can serve as a starting point for developing public policies better adapted to the realities of each group of countries.
It should be noted that the study is based on official data, using average values from the 2017–2022 period. This helps reduce the impact of short-term changes. However, there are some limitations, especially regarding the lack of data for some countries or factors that are difficult to measure, such as deep-seated structural problems. Even so, the method used is robust and could be applied to other regions for similar analysis.
In future work, it would be interesting to compare these findings with the results of other methods, such as data envelopment analysis (DEA), hybrid models like PCA-DEA, and factor analysis combined with DEA. This type of comparison could help improve the design of strategies for each group of countries.
Author Contributions
Writing—review and editing, writing—original draft, validation, and conceptualization: A.M.-M., D.V.-C. and E.D.L.H.-D. Methodology: A.M.-M. and D.V.-C. Formal analysis: A.M.-M. and D.V.-C. Resources: A.M.-M. and D.V.-C. Data curation: A.M.-M. and E.D.L.H.-D. Software: E.D.L.H.-D. and D.V.-C. All authors have read and agreed to the published version of the manuscript.
Funding
This research received no external funding.
Institutional Review Board Statement
Not applicable.
Informed Consent Statement
Not applicable.
Data Availability Statement
Data will be made available on request.
Conflicts of Interest
The authors declare no conflicts of interest.
References
- Abson, D. J., Dougill, A. J., & Stringer, L. C. (2012). Using principal component analysis for information-rich socio-ecological vulnerability mapping in Southern Africa. Applied Geography, 35(1–2), 515–524. [Google Scholar] [CrossRef]
- Ahlborn, M., & Schweickert, R. (2019). Economic systems in developing countries—A macro cluster approach. Economic Systems, 43(3–4), 100692. [Google Scholar] [CrossRef]
- Ahmed, Z., Nathaniel, S. P., & Shahbaz, M. (2021). The criticality of information and communication technology and human capital in environmental sustainability: Evidence from Latin American and Caribbean countries. Journal of Cleaner Production, 286, 125529. [Google Scholar] [CrossRef]
- Alkhayrat, M., Aljnidi, M., & Aljoumaa, K. (2020). A comparative dimensionality reduction study in telecom customer segmentation using deep learning and PCA. Journal of Big Data, 7(1), 9. [Google Scholar] [CrossRef]
- Almulhim, T. (2024). Assessment of green development level performance in G20 countries: A dynamic evaluation framework. Heliyon, 10(18), e37622. [Google Scholar] [CrossRef]
- Al-Worafi, Y. M. (2024). Technology in public health education in developing countries. In Handbook of medical and health sciences in developing countries: Education, practice, and research (pp. 1–20). Springer International Publishing. [Google Scholar]
- Amarante, V., & Colacce, M. (2022). Multidimensional poverty among older people in five Latin American countries. Social Indicators Research, 159(3), 945–965. [Google Scholar] [CrossRef]
- Asongu, S. A., & Nwachukwu, J. C. (2017). The comparative inclusive human development of globalization in Africa. Social Indicators Research, 134, 1027–1050. [Google Scholar] [CrossRef]
- Barska, A., Jędrzejczak-Gas, J., Wyrwa, J., & Kononowicz, K. (2020). Multidimensional assessment of the social development of EU countries in the context of implementing the concept of sustainable development. Sustainability, 12(18), 7821. [Google Scholar] [CrossRef]
- Bravo-Sanzana, M. V., Varela, J., Terán-Mendoza, O., & Rodriguez-Rivas, M. E. (2023). Measuring school social climate in Latin America: The need for multidimensional and multi-informant tests—A systematic review. Frontiers in Psychology, 14, 1190432. [Google Scholar] [CrossRef] [PubMed]
- Cooper, W. W., Seiford, L. M., & Tone, K. (2007). Data envelopment analysis: Comprehensive text with models, applications, references and DEA-solver software (Vol. 2, p. 489). Springer. [Google Scholar]
- Cruz-Martínez, G. (2014). Welfare state development in Latin America and the Caribbean (1970s–2000s): Multidimensional welfare index, its methodology and results. Social Indicators Research, 119, 1295–1317. [Google Scholar] [CrossRef]
- Dai, P. F., Xiong, X., & Zhou, W. X. (2021). A global economic policy uncertainty index from principal component analysis. Finance Research Letters, 40, 101686. [Google Scholar] [CrossRef]
- Ester, M., Kriegel, H. P., Sander, J., & Xu, X. (1996, August 2–4). A density-based algorithm for discovering clusters in large spatial databases with noise. Kdd (Vol. 96, No. 34, pp. 226–231), Portland, OR, USA. [Google Scholar]
- Gewers, F. L., Ferreira, G. R., Arruda, H. F. D., Silva, F. N., Comin, C. H., Amancio, D. R., & Costa, L. D. F. (2021). Principal component analysis: A natural approach to data exploration. ACM Computing Surveys (CSUR), 54(4), 1–34. [Google Scholar]
- González, P., Sehnbruch, K., Apablaza, M., Méndez Pineda, R., & Arriagada, V. (2021). A multidimensional approach to measuring quality of employment (QoE) deprivation in six central American countries. Social Indicators Research, 158(1), 107–141. [Google Scholar] [CrossRef]
- Guillén-Fernández, Y. B. (2024). Socioeconomic factors determining multidimensional child poverty groups in central America: A measurement proposal from the wellbeing approach using a comprehensive set of children’s rights. Child Indicators Research, 17(5), 2175–2217. [Google Scholar] [CrossRef]
- Guo, H., Liang, D., Sun, Z., Chen, F., Wang, X., Li, J., Zhu, L., Bian, J., Wei, Y., Huang, L., Chen, Y., Peng, D., Li, X., Lu, S., Liu, J., & Shirazi, Z. (2022). Measuring and evaluating SDG indicators with Big Earth Data. Science Bulletin, 67(17), 1792–1801. [Google Scholar] [CrossRef] [PubMed]
- Haining, K., Gajwani, R., Gross, J., Gumley, A. I., Ince, R. A. A., Lawrie, S. M., Schultze-Lutter, F., Schwannauer, M., & Uhlhaas, P. J. (2022). Characterizing cognitive heterogeneity in individuals at clinical high-risk for psychosis: A cluster analysis with clinical and functional outcome prediction. European Archives of Psychiatry and Clinical Neuroscience, 272(3), 437–448. [Google Scholar] [CrossRef]
- Husson, F., Josse, J., Lê, S. F., & FactoMineR, J. M. (2023). Multivariate exploratory data analysis and data mining with R Package ‘FactoMineR’. Available online: https://cran.r-project.org/web/packages/FactoMineR/index.html (accessed on 27 May 2025).
- Husson, F., Josse, J., & Pages, J. (2010). Principal component methods-hierarchical clustering-partitional clustering: Why would we need to choose for visualizing data. Applied Mathematics Department, 2010, 1–17. [Google Scholar]
- Jansson, N. F., Allen, R. L., Skogsmo, G., & Tavakoli, S. (2022). Principal component analysis and K-means clustering as tools during exploration for Zn skarn deposits and industrial carbonates, Sala area, Sweden. Journal of Geochemical Exploration, 233, 106909. [Google Scholar] [CrossRef]
- Jiang, Q., Liu, Z., Liu, W., Li, T., Cong, W., Zhang, H., & Shi, J. (2018). A principal component analysis based three-dimensional sustainability assessment model to evaluate corporate sustainable performance. Journal of Cleaner Production, 187, 625–637. [Google Scholar] [CrossRef]
- Jiménez-Preciado, A. L., Cruz-Aké, S., & Venegas-Martínez, F. (2024). Identification of patterns in CO2 emissions among 208 countries: K-Means clustering combined with PCA and non-linear t-SNE visualization. Mathematics, 12(16), 2591. [Google Scholar] [CrossRef]
- Jolliffe, I. T. (2002). Principal component analysis for special types of data (pp. 338–372). Springer. [Google Scholar]
- Jolliffe, I. T., & Cadima, J. (2016). Principal component analysis: A review and recent developments. Philosophical Transactions of the Royal Society A: Mathematical, Physical and Engineering Sciences, 374(2065), 20150202. [Google Scholar] [CrossRef]
- Kamari, A., & Schultz, C. P. L. (2022). A combined principal component analysis and clustering approach for exploring enormous renovation design spaces. Journal of Building Engineering, 48, 103971. [Google Scholar] [CrossRef]
- Kassambara, A., & Mundt, F. (2016). Package “factoextra”. Extract and visualize the results of multivariate data analyses. Available online: https://cran.r-project.org/web/packages/factoextra/index.html (accessed on 27 May 2025).
- Kaufman, L., & Rousseeuw, P. J. (2009). Finding groups in data: An introduction to cluster analysis. John Wiley & Sons. [Google Scholar]
- Korir, E. K. (2024). Comparative clustering and visualization of socioeconomic and health indicators: A case of Kenya. Socio-Economic Planning Sciences, 95, 101961. [Google Scholar] [CrossRef]
- Krishnan, S., & Firoz, M. (2023). Assessment of regional environmental quality using cluster analysis. Environmental Development, 45, 100832. [Google Scholar] [CrossRef]
- Krzyśko, M., Nijkamp, P., Ratajczak, W., & Wołyński, W. (2022). Multidimensional economic indicators and multivariate functional principal component analysis (MFPCA) in a comparative study of countries’ competitiveness. Journal of Geographical Systems, 24(1), 49–65. [Google Scholar] [CrossRef]
- Kurek, K. A., Heijman, W., van Ophem, J., Gędek, S., & Strojny, J. (2022). Measuring local competitiveness: Comparing and integrating two methods PCA and AHP. Quality & Quantity, 56(3), 1371–1389. [Google Scholar]
- MacQueen, J. (1967). Some methods for classification and analysis of multivariate observations. In Proceedings of the fifth Berkeley symposium on mathematical statistics and probability, volume 1: Statistics (Vol. 5, pp. 281–298). University of California Press. [Google Scholar]
- Medina-Hernández, E., Fernández-Gómez, M. J., & Barrera-Mellado, I. (2021). Gender inequality in Latin America: A multidimensional analysis based on ECLAC indicators. Sustainability, 13(23), 13140. [Google Scholar] [CrossRef]
- Möring-Martínez, G., Senzeybek, M., & Jochem, P. (2024). Clustering the European Union electric vehicle markets: A scenario analysis until 2035. Transportation Research Part D: Transport and Environment, 135, 104372. [Google Scholar] [CrossRef]
- Neri, L., D’Agostino, A., Regoli, A., Pulselli, F. M., & Coscieme, L. (2017). Evaluating dynamics of national economies through cluster analysis within the input-state-output sustainability framework. Ecological Indicators, 72, 77–90. [Google Scholar] [CrossRef]
- Niu, T., Huang, W., Zhang, C., Zeng, T., Chen, J., Li, Y., & Liu, Y. (2022). Study of degradation of fuel cell stack based on the collected high-dimensional data and clustering algorithms calculations. Energy and AI, 10, 100184. [Google Scholar] [CrossRef]
- Noman, A. A., Rehman, F. U., Khan, I., & Saeed, T. (2024). Trade competitiveness and sustainable energy practices: The moderating role of ecological footprint. Environmental and Sustainability Indicators, 21, 100331. [Google Scholar] [CrossRef]
- Pérez-Morote, R., Pontones-Rosa, C., & Núñez-Chicharro, M. (2020). The effects of e-government evaluation, trust and the digital divide in the levels of e-government use in European countries. Technological Forecasting and Social Change, 154, 119973. [Google Scholar] [CrossRef]
- Pick, J., Sarkar, A., & Parrish, E. (2021). The Latin American and Caribbean digital divide: A geospatial and multivariate analysis. Information Technology for Development, 27(2), 235–262. [Google Scholar] [CrossRef]
- Pinar, M. (2019). Multidimensional well-being and inequality across the European regions with alternative interactions between the well-being dimensions. Social Indicators Research, 144(1), 31–72. [Google Scholar] [CrossRef]
- Plaza-Díaz, J., Molina-Montes, E., Soto-Méndez, M. J., Madrigal, C., Hernández-Ruiz, Á., Valero, T., Villoslada, F. L., Leis, R., de Victoria, E. M., Moreno, J. M., Ortega, R. M., Ruiz-López, M. D., Varela-Moreiras, G., & Gil, Á. (2020). Clustering of dietary patterns and lifestyles among spanish children in the EsNuPi study. Nutrients, 12(9), 2536. [Google Scholar] [CrossRef]
- Pranata, K. S., Gunawan, A. A., & Gaol, F. L. (2023). Development clustering system IDX company with k-means algorithm and DBSCAN based on fundamental indicator and ESG. Procedia Computer Science, 216, 319–327. [Google Scholar] [CrossRef]
- Qazi, A. (2022). Adoption of a probabilistic network model investigating country risk drivers that influence logistics performance indicators. Environmental Impact Assessment Review, 94, 106760. [Google Scholar] [CrossRef]
- Ray, P., Reddy, S. S., & Banerjee, T. (2021). Various dimension reduction techniques for high dimensional data analysis: A review. Artificial Intelligence Review, 54(5), 3473–3515. [Google Scholar] [CrossRef]
- Romesburg, H. C. (2004). Cluster analysis for researchers. Lulu Press. [Google Scholar]
- Salem, N., & Hussein, S. (2019). Data dimensional reduction and principal components analysis. Procedia Computer Science, 163, 292–299. [Google Scholar] [CrossRef]
- Santiago, R., Fuinhas, J. A., & Marques, A. C. (2020). The impact of globalization and economic freedom on economic growth: The case of Latin America and Caribbean countries. Economic Change and Restructuring, 53(1), 61–85. [Google Scholar] [CrossRef]
- Santillán, O. S., Cedano, K. G., & Martínez, M. (2020). Analysis of energy poverty in 7 Latin American countries using multidimensional energy poverty index. Energies, 13(7), 1608. [Google Scholar] [CrossRef]
- Santos, G. F. D., Vives Vergara, A., Fuentes-Alburquenque, M., de Sousa Filho, J. F., Paiva, A. S., Useche, A. F., Yamada, G., Alfaro, T., Friche, A. A. L., Andrade, R. F. S., Barreto, M. L., Caiaffa, W. T., & Diez-Roux, A. V. (2023). Socioeconomic urban environment in Latin America: Towards a typology of cities. Sustainability, 15(8), 6380. [Google Scholar] [CrossRef]
- Spoor, J. M. (2023). Improving customer segmentation via classification of key accounts as outliers. Journal of Marketing Analytics, 11(4), 747–760. [Google Scholar] [CrossRef]
- Strielkowski, W., Chygryn, O., Drozd, S., & Koibichuk, V. (2024). Sustainable transformation of energy sector: Cluster analysis for the sustainable development strategies of selected European countries. Heliyon, 10(19), e38930. [Google Scholar] [CrossRef]
- Tripathi, S., Bachmann, N., Brunner, M., Tuezuen, A., Thienemann, A. K., Pöchtrager, S., & Jodlbauer, H. (2025). Evaluation of clustering with PCA for market segmentation: A study using simulated and surrogate data. Procedia Computer Science, 253, 2063–2075. [Google Scholar] [CrossRef]
- Van Leeuwen, R., & Koole, G. (2022). Data-driven market segmentation in hospitality using unsupervised machine learning. Machine Learning with Applications, 10, 100414. [Google Scholar] [CrossRef]
- Ward, J. H., Jr. (1963). Hierarchical grouping to optimize an objective function. Journal of the American Statistical Association, 58(301), 236–244. [Google Scholar] [CrossRef]
- Younes, K., Mouhtady, O., Chaouk, H., Obeid, E., Roufayel, R., Moghrabi, A., & Murshid, N. (2021). The application of principal component analysis (PCA) for the optimization of the conditions of fabrication of electropunk nanofibrous membrane for desalination and ion removal. Membranes, 11(12), 979. [Google Scholar] [CrossRef]
- Zhang, H., Cheng, S., Li, H., Fu, K., & Xu, Y. (2020). Groundwater pollution source identification and apportionment using PMF and PCA-APCA-MLR receptor models in a typical mixed land-use area in Southwestern China. Science of the Total Environment, 741, 140383. [Google Scholar] [CrossRef]
Disclaimer/Publisher’s Note: The statements, opinions and data contained in all publications are solely those of the individual author(s) and contributor(s) and not of MDPI and/or the editor(s). MDPI and/or the editor(s) disclaim responsibility for any injury to people or property resulting from any ideas, methods, instructions or products referred to in the content. |
© 2025 by the authors. Licensee MDPI, Basel, Switzerland. This article is an open access article distributed under the terms and conditions of the Creative Commons Attribution (CC BY) license (https://creativecommons.org/licenses/by/4.0/).