Abstract
As urbanization accelerates globally, higher education agglomeration (HEA) emerges as a critical mechanism for integrating regional economic theories with practical strategies, driving innovation and sustainable development. This paper examines how HEA promotes innovation, human capital accumulation, industrial restructuring, and equitable income distribution across 193 cities in the “Two Transverse and Three Lengthways” urban clusters from 2006 to 2020. Using dynamic panel regression and spatial econometric models, the results show that HEA yields significant local and spatial spillover benefits, particularly in core cities that facilitate knowledge diffusion and resource sharing. Heterogeneity analysis reveals that these positive spillovers are strongest in first-tier, highly developed clusters and third-tier, early-stage clusters but weaker or even negative in second-tier, rapidly expanding regions. These spatial effects grow over time, reflecting the evolving patterns of regional integration. Theoretically, the paper advances the understanding of spatial synergy and spillover mechanisms in HEA in urban clusters. Practically, the findings highlight the need to tailor higher education strategies to the developmental stage of each urban cluster to optimize resource allocation and foster inclusive growth. This paper provides policy insights for using HEA as a catalyst for coordinated urban development.
1. Introduction
Despite divergent urbanization trajectories and developmental stages worldwide, the spatial evolution of urban agglomerations consistently demonstrates the clustering of higher education activities, which act as catalysts for spatial spillover effects, enhancing regional innovation and driving industrial restructuring (Borsi et al., 2022; Mok & Marginson, 2021; Slavova et al., 2025). According to data from China’s Ministry of Education, the enrolment in higher education surpassed 40 million students by 20201, with the majority concentrated in urban clusters such as the Yangtze River Delta, the Pearl River Delta, and the Beijing–Tianjin–Hebei region (Yin et al., 2022). This underlines the crucial role of urban clusters in the allocation of higher education resources across China. Similarly, in most regions of Asia or Europe, top universities are located within the main metropolitan areas, providing sustained impetus to regional innovation systems (Chao, 2014; Brennan & Cochrane, 2019; Peng & Xu, 2024).
As platforms for socioeconomic progress, cities serve as critical hubs for the agglomeration of higher education institutions. Researchers often emphasize the transformative potential of higher education agglomeration in driving innovation and economic transitions within urban clusters (Addie et al., 2015; Lendel & Qian, 2017; X. Liu et al., 2024). Some studies have placed greater emphasis on the integration of higher education with local industries, aiming to enhance regional coordination and balanced development (J. F. Gu, 2012a; Ji et al., 2023; Ziberi et al., 2022). For example, leading urban agglomerations in developed nations, such as the Boston and Silicon Valley clusters in the United States, leverage universities to anchor high-tech industrial ecosystems, thereby emerging as global centers of innovation (Bevilacqua et al., 2023; Fang & Yu, 2017; Ma et al., 2023; Pink-Harper, 2015). From a theoretical standpoint, the literature frequently draws upon new economic geography to investigate knowledge diffusion, talent networks, and their synergistic linkages with regional development (Acs et al., 2002; Chou et al., 2023; Florida & Adler, 2020; Lee, 2014; Vaz, 2024). Collectively, these processes promote regional educational integration, which in turn fosters innovation, drives industrial transformation, and supports high-quality economic development. While substantial research has been conducted on urban clusters and higher education, the mechanisms through which the spatial evolution of urban clusters facilitates the alignment of higher education agglomeration with regional economic growth and scientific innovation demands remain underexplored. Additionally, there is limited empirical evidence regarding the spatial spillover effects of higher education agglomeration on socioeconomic development.
Therefore, this paper utilizes panel data from 193 cities within China’s “Two Transverse and Three Lengthways” urban clusters2 for the period from 2006 to 2020, aiming to empirically investigate the pathways through which higher education agglomeration contributes to regional socioeconomic development. The focus is on examining the spillover and demonstration effects in promoting innovation, enhancing human capital, advancing industrial upgrading, and optimizing income distribution. Employing dynamic panel regression and spatial econometric analysis, this paper seeks to address the following core questions: what is the impact of higher education agglomeration on regional innovation and economic development, and through what mechanisms does this impact manifest? The findings of this paper are anticipated to offer valuable insights for the formulation of higher education strategies and regional coordination policies. Specifically, the results underscore the importance of aligning higher education initiatives with the developmental priorities of specific regions, enabling urban clusters to realize their transformative potential and promoting inclusive regional prosperity. This strategic alignment is essential for leveraging the capacity of urban agglomerations to drive comprehensive economic and social progress.
2. Literature Review and Hypothesis Development
2.1. Higher Education Agglomeration in Urban Clusters
Urban clusters function as central nodes for higher education agglomeration, attracting graduates or skilled professionals via superior economic opportunities and public services, thereby catalyzing knowledge creation and innovation (Gordon & Kourtit, 2020). Agglomeration economies, as a consequence of higher education clustering, can enhance productivity and invigorate regional innovation systems (H. Gu et al., 2020). While some studies have highlighted that high levels of concentration may exacerbate regional disparities, a more nuanced spatial–economic lens indicates that agglomeration is also a dynamic mechanism for long-term spatial equilibrium (Harrison et al., 2017). This mechanism enables lagging regions to benefit from sustained knowledge diffusion and resource reallocation, mitigating inequality over time.
Higher education serves as a foundational component of the knowledge economy, shaping talent formation and innovation capacity. The process of higher education agglomeration is manifested through three primary features: the spatial concentration of educational resources, the generation of economic and social benefits, and the facilitation of spatial spillover effects that transmit innovation and knowledge to neighboring areas (H. Liu et al., 2024; Mohanty & Bhanumurthy, 2018). These spillovers are critical channels through which higher education agglomeration advances regional socioeconomic development.
The empirical literature utilizes diverse methodologies to examine these phenomena, focusing on the spatial distribution of higher education talent, determinants of agglomeration, and implications for regional or urban economic disparities (Aldieri et al., 2018; H. Gu et al., 2020; Tsvetkova & Lomer, 2019). Other research has investigated the impacts of higher education clustering on regional innovation, industrial transformation, and urbanization (Alder et al., 2016; Lyu et al., 2019; Pablo-Martí & Arauzo-Carod, 2020). Despite these advances, there is a notable gap regarding systematic empirical investigation into the unique spatial features of higher education agglomeration and the explicit mechanisms by which it influences regional development trajectories and reduces spatial inequality (Drucker, 2016; Kim & Lee, 2024).
Methodologically, higher education agglomeration within urban clusters offers multiple benefits, such as attracting high-level talent, encouraging academic vibrancy, and facilitating regional industrial upgrading and competitiveness. Strategic clustering allows higher education institutions to optimize resource distribution, counteracting inefficiencies associated with dispersed or undifferentiated expansion (Tleppayev et al., 2025). However, reliance on cross-sectional analysis or insufficient spatial analysis has constrained deeper insights into these complex dynamics (De Falco, 2021). Furthermore, ambiguity and inconsistency in empirical conclusions have limited actionable policy guidance (Tripathi, 2021).
While the extant studies have contributed important theoretical and empirical perspectives, there remains a lack of systematic assessment of the scale and spillover effects of higher education agglomeration within urban clusters. Without such empirical clarity, it is challenging to design effective policies that leverage higher education agglomeration as a catalyst for regionally balanced innovation, economic transformation, and sustainable socioeconomic advancement.
2.2. Spatial Agglomeration of Higher Education
Mainstream economic theories stress that urban agglomerations originate from the spatial concentration of key production factors such as labor and capital within specific geographic units (Fang & Yu, 2017; Zhao et al., 2025). This phenomenon, known as “agglomeration economies”, is fundamentally driven by mechanisms of sharing, matching, and learning among spatially proximate actors within an urban area (Billings & Johnson, 2016). Traditional economic theories, based primarily on balanced growth assumptions and diminishing returns, often neglected the decisive influence of spatial characteristics on economic patterns (Ottaviano & Thisse, 2004; Tridico, 2011). The emergence of new economic geography (NEG), pioneered by Krugman, marked a significant shift by incorporating increasing returns to scale and spatial disequilibrium as central components in regional development analysis (Krugman, 1991). NEG, in particular, emphasizes how locational advantages lead to the nonlinear evolution of “agglomeration–dispersion–reagglomeration” cycles, resulting in multi-equilibrium and “lumpy” spatial configurations of economic activity (Fujita & Krugman, 2003). Central to this framework are mechanisms of self-reinforcing externalities and lock-in effects, which explain the persistent economic dominance of urban clusters and core nodes, and their capacity to attract key resources, including higher education institutions (Fujita & Mori, 1996; Z. Yang et al., 2015; Yu et al., 2024).
Building on these foundations, agglomeration economics and knowledge externalities theory provide the core analytical logic for understanding higher education agglomeration. The former, typified by Marshall and extended by urban economists such as Glaeser et al. (1992), argues that spatial concentration of industrial organization and skilled labor reduces transaction costs, enhances labor market pooling, and fosters more specialized supply chains, thereby optimizing resource allocation and driving productivity gains. The latter, grounded in endogenous growth theory (Lucas, 1988; Romer, 1986) and the geography of innovation (Breschi & Lissoni, 2001), highlights the central role of universities and research centers in generating knowledge spillovers, developing human capital, and stimulating entrepreneurial activity (Al-Youbi et al., 2021; Chen & Kenney, 2007). These positive externalities, in turn, facilitate spatial knowledge diffusion and extend the developmental benefits of agglomeration well beyond immediate locales.
The spatial structure of higher education is thus shaped by the aggregation, interaction, and movement of institutions, talent, disciplines, and research resources between regions (Chao, 2014; Jongbloed et al., 2008). Higher education agglomeration is not only reflected by the geographic concentration of educational and research assets but also by the extensive knowledge spillovers, technological diffusion, and innovation network effects that substantially impact regional growth and industrial upgrading (Rodríguez-Pose, 2001; Verspagen, 2010). NEG, together with urban systems and core–periphery models, further provides theoretical perspectives for analyzing both the hierarchical and functional differentiation of urban clusters as well as the heterogeneous spatial impacts of higher education agglomeration (Addie, 2017; Valero & Van Reenen, 2019).
In China, key national initiatives such as “Project 211”, “Project 985”, and the “Double First-Class” program have strategically concentrated higher education resources and innovation capacities in coastal and core urban clusters, underlining the joint impact of market forces and policy intervention in spatial restructuring (J. F. Gu, 2012b; X. Y. Li et al., 2020; X. Liu et al., 2024; Yu et al., 2024). These trends align with NEG’s assertions regarding initial advantage, spatial self-reinforcement, and the Matthew effect while also emphasizing the long-term role of knowledge diffusion and collective learning in narrowing regional disparities.
2.3. Spatial Mechanisms of Higher Education Agglomeration Dynamic
The concept of “agglomeration” was first systematically articulated by Alfred Marshall in the late nineteenth century, establishing a foundational pillar in regional economics. He introduced not only the concept of agglomeration economies but also the idea of “industrial districts” (Konzelmann et al., 2025; Marshall, 2013). Building on this foundational work, economists further developed the theory and highlighted its implications for spatial dynamics, specifically through spillover and demonstration effects (Krugman, 1991; Marshall, 2013; Porter, 2000; Rosenfeld et al., 2007). Spatial agglomeration is now widely recognized as a multifaceted process that facilitates information exchange, collaboration, specialization, and technological spillovers. These processes enhance regional productivity and promote innovation (Fujita, 2008). Variations in agglomeration patterns produce differing effects on resource allocation and technological advancement (Motoyama, 2008; Santoalha et al., 2018). Empirical research has demonstrated that specialized agglomeration promotes significant positive effects and spatial spillovers on urban technological innovation (Gaspar, 2020; Munnich & Iacono, 2016). By synthesizing existing research and theoretical insights, the spatial spillover and demonstration effects associated with higher education agglomeration within urban clusters can be identified in several key areas.
(1) The spatial agglomeration of higher education institutions within urban clusters enhances regional innovation through knowledge spillover mechanisms. Competitive and communicative interactions among universities, students, and industries foster the diffusion of knowledge, thereby strengthening regional innovation capabilities (Y. Li et al., 2021). The Bologna Process serves as a benchmark initiative, exemplifying efforts to build symbiotic partnerships between universities, industries, and research institutes to advance coordinated innovation networks (Woldegiorgis et al., 2015; Arbo & Benneworth, 2007). Empirical studies have consistently confirmed the substantial spatial spillover effects of higher education on economic development including increased entrepreneurial activities and elevated innovation levels (Caniëls & van den Bosch, 2011; Drucker, 2016). However, while research extensively explores technical support provided by universities to regional development, fewer studies examine their critical role in shaping regional innovation systems through higher education agglomeration.
(2) The spatial agglomeration of higher education amplifies “human capital externalities”, transforming accumulated human capital into measurable talent dividends via economies of scale. Concentrating higher education resources, including universities, students, and faculty, within urban clusters generates a robust pool of skilled talent, facilitating the conversion of research outputs into productive forces and reinforcing regional innovation capabilities (Valero & Van Reenen, 2019). Strategic investment in human capital through spatial agglomeration principles can eliminate institutional barriers to talent mobility, enabling the efficient flow of highly skilled labor across regions and maximizing societal benefits. Empirical evidence has demonstrated that the spatial concentration of high-skilled labor increases the rate of return on education and creates a demonstration effect, raising wages and boosting a city’s overall social rate of return (Czaller, 2017; Xiong et al., 2022).
(3) Spatial agglomeration in higher education facilitates resource allocation and integration, overcoming inefficiencies caused by fragmented institutional structures. Urban clusters in developed regions, such as the Northeast Coast of the United States, exemplify this efficiency, where short commuting distances among universities enhance academic collaboration and provide ample student and faculty resources for institutional development (Bayuo et al., 2020; Huffman & Quigley, 2002). Avoiding the redundancies associated with “colossal and comprehensive” models, spatial agglomeration enables regional higher education systems to optimize resource allocation. In regions like the Yangtze River Delta, Pearl River Delta, and Shandong Peninsula, the spatial evolution of higher education has catalyzed enterprise agglomeration, capital investment, talent cultivation, and technological renewal (Wilck, 2020; T. Zhang et al., 2023). These enhancements in resource efficiency and integration accelerate human capital accumulation, scientific progress, and socioeconomic development, making urban clusters pivotal in driving coordinated regional growth.
The global pursuit of high-quality development places increasing emphasis on regional innovation and social inclusiveness. Higher education agglomeration, as conceptualized in agglomeration economics and knowledge externalities, is recognized as a key mechanism for promoting regional innovation, talent concentration, and structural transformation. Drawing on agglomeration economies, the spatial concentration of higher education facilitates information exchange, labor market matching, and knowledge diffusion, creating favorable conditions for innovation and industrial upgrading. Knowledge externality further highlights the role of universities in facilitating cross-sectoral knowledge spillovers and demonstration effects that benefit surrounding areas while new economic geography emphasizes the amplifying influence of scale and spatial proximity. Accordingly, the paper identifies higher education agglomeration as the core explanatory variable and introduces a comprehensive theoretical framework (refer to Figure 1) that elucidates the intrinsic mechanisms of spatial and demonstration effects. Based on this theoretical logic, the following hypotheses are proposed:
H1:
Higher education agglomeration in urban clusters generates spatial spillovers that drive regional socioeconomic development through innovation, talent attraction, and economic transformation.
H2:
The spatial concentration of higher education, as explained by new economic geography and agglomeration economies, enhances regional growth via knowledge spillovers, innovation, and coordinated urbanization.
H3:
The impacts of higher education agglomeration exhibit temporal and spatial heterogeneity across urban clusters, with the effects differing by region and evolving over time.
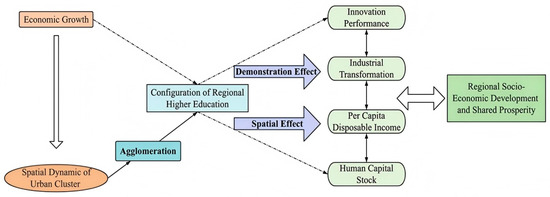
Figure 1.
The spatial mechanism of urban cluster in higher education agglomeration.
Figure 1.
The spatial mechanism of urban cluster in higher education agglomeration.

3. Empirical Strategy
3.1. Background
China is undergoing one of the world’s most rapid urbanization processes, characterized by significant spatial expansion and reconfiguration. The collaborative sharing, synergistic cooperation, and radiating influence among cities have intensified, marking a shift from unidirectional urban development to a spatially coordinated model driven by urban clusters, which exemplifies a framework for achieving common prosperity (Yin et al., 2022). In alignment with China’s “14th Five-Year Planning”, the “Two Transverse and Three Lengthways” urban cluster framework is poised strategically to accelerate the emergence of vital forces for high-quality development. This initiative aims through a belt-tiered approach, which includes 193 cities and 19 clusters, thereby enhancing regional economic efficiency and ensuring that the benefits of development are more equitably shared among the populace (Fang & Yu, 2020). The spatial evolution of urban clusters dictates the redistribution of resources, with the coordinated advancement of these clusters expected to unlock the demographic dividend through improved labor allocation, thereby driving regional innovation and facilitating China’s transition to high-quality economic growth (C. Zhang et al., 2024). To sustain this trajectory, it is essential to move beyond traditional administrative resource allocation and to reconfigure higher education resources in line with the spatial evolution of urban clusters. This requires exploring innovative institutional arrangements and optimizing regional higher education layouts to catalyze socioeconomic progress and support sustainable development.
3.2. Method
In concordance with Joseph Schumpeter’s conceptualization of innovation and its implications for economic growth, Paul Romer’s endogenous growth theory identifies technological progress as an intrinsic driver of sustained economic expansion. This theory accentuates the escalating benefits of knowledge aggregation, technological innovation, and human capital investment. The optimal conduit for knowledge accumulation is through strategic investment in human capital, suggesting a governmental imperative to bolster the spatial configuration of higher education. Such investments are instrumental in amassing a knowledge base and propelling regional technological advancements through enhanced scientific and technological endeavors (Chandra, 2022; Ziemnowicz, 2020). The presence of knowledge spillover and demonstration effects indicates that urban clusters, with their concentrated higher education institutions, can foster conditions for multiple equilibrium in knowledge and innovation dynamics. As the preeminent form of spatial layout, the ascendancy of urban cluster has increasingly surpassed the traditional economic structures within provinces/states, becoming synonymous with regional economies. Based on this fact, our research manages to examine the impact of higher education in urban clusters, seeking to examine whether these arrangements influence innovation, human capital, and socioeconomic development. In light of this, our empirical strategy is anchored in a refined knowledge production function, which serves as the foundation for a baseline regression model. It is subjected to a rigorous empirical examination to ascertain its validity and applicability. The benchmark model’s formulation is articulated as follows:
Equation (1) is the dynamic panel model with two-way interaction fixed effect, where i and t refer to the city and the year, respectively. The dependent variable, Output, encapsulates the spectrum of innovation capacity, human capital, industrial composition, and per capita disposable income for cities across various years. The core explanatory variable, HEA, captures the spatial agglomeration of higher education configuration. The control variables, X, encompass a suite of factors that affect a city’s innovation capabilities, industrial structure, residential income levels, and human capital accumulation. α is the constant term while β represents the vectors of coefficients for the explanatory and control variables. The city fixed effect, μ, mitigates the influence of unobserved, city-specific variables that are invariant over time but differ among cities. The time fixed effect, γ, addresses unobserved elements tied to the temporal accumulation of effects and temporal variations, reflecting the macroeconomic shifts and incremental changes faced by higher education development in urban clusters. The random disturbance term, ε, accounts for the stochastic elements within the model.
The rationale behind the design of this model lies in its consideration of the cumulative effects of clustering over time and the regional selection mechanisms, avoiding the potential endogeneity disturbances. By incorporating lagged terms of independent variables and employing a two-way-interaction fixed-effects approach, the model integrates multidimensional shocks present in reality and captures the temporal heterogeneity of how various cities respond to these shocks. This methodology minimizes selection bias arising from path dependence and mitigates the interference of endogeneity issues as much as possible.
To address potential endogeneity, reverse causality, and sample selection bias in the model, this paper adopts multiple robust approaches. First, propensity score matching is applied to reduce sample selection bias. Specifically, the kernel matching method is utilized to pair the treatment and control groups based on covariates from the baseline regression. This approach reduces the influence of extreme propensity scores and improves the validity of sample matching. Second, to address possible reverse causality, an instrumental variable approach is utilized, with the stock of higher education institutions in each city selected as an instrument. This selection is justified because the number of institutions is strongly correlated with higher education development but is not directly affected by the outcome variables, thus ensuring its exogeneity. The IV estimation provides further control over endogeneity concerns. Third, robustness checks are conducted by substituting the primary independent variable with an alternative indicator, specifically the number of urban residents holding an associate degree or higher. This variable also reflects higher education agglomeration at the city level. Collectively, these methods improve the credibility and explanatory power of the empirical results.
To further pinpoint the spatial and demonstration effects of higher education agglomeration, this paper employs the Global Moran’s I to testify spatial autocorrelation across cities and applies the spatial panel Durbin model for econometric estimation, following the analytical paradigm of spatial econometric methodologies. Spatial panel models generally include key forms such as the spatial Durbin model (SDM), the Spatial Autoregressive Model (SAR), and the Spatial Autocorrelation Model (SAC). The SAR and SAC models impose relatively strict assumptions whereas the SDM is more flexible. It accounts for spatial correlations among the dependent variable, independent variables, and error term while also providing interaction effects across various spatial weight matrices (Anselin & Anil, 1998). This versatility makes the SDM well-suited to practical scenarios and a favored option in empirical research. The models are as follows:
Equation (2) is the spatial econometric regression model, where ρ and β refer to the spatial interaction coefficients for the dependent and core explanatory variables, respectively. If ρ is zero or insignificant, it indicates that there is no spatial association. If this value is positive significantly, it suggests that the spatial and demonstration effect of the agglomeration of higher education among cities has a significant positive impact. Conversely, a negative value would imply the opposite. In Equation (3), Yi and Yj represent the observed values for cities i and j concerning knowledge production, industrial transformation, disposable income, and human capital. The spatial weight matrix, Wij, illustrates the spatial relationship between cities i and j. Given that inter-city economic and social activities are influenced not only by geographical proximity but also by economic development, this paper utilizes spatial weight matrices that account for both geographical and economic distances; these two distances are crucial to spatial agglomeration and spillover effects (Maggioni & Uberti, 2009). The Global Moran’s I is employed to detect patterns of spatial clustering and dispersion among cities. The remaining vectors are consistent with those presented in Equation (1).
3.3. Variables
3.3.1. Dependent Variables
This paper selects the number of patent grants, the level of human capital, the proportion of secondary and tertiary industries, and regional average wages as indicators to assess the impact of the agglomeration of higher education on innovation capabilities, human capital, industrial structure, and disposable income. The rationale for the choice of the dependent variable is multifaceted:
(1) The level of scientific and technological innovation is often gauged by original achievements or science and technology investments. However, relying solely on the number of original achievements or research expenditure can overlook the synergy between innovation and regional economic and social development (Capone et al., 2021). Patent grants serve as an outcome indicator of innovation levels, reflecting both the transformation of original research and its alignment with regional development (Mitze & Makkonen, 2020), making the patent count a reasonable metric, denoted as PAT. Given the varying contributions of different patent types to China’s economic growth, with invention patents having a greater impact than design and utility model patents (Sun et al., 2008), this paper adjusts the patent count to account for the “gold content” of each type, with invention patents weighted at 0.5, utility models at 0.3, and design patents at 0.2.
(2) Human capital: The growth of regional economies along high-quality trajectories is contingent upon the availability of skilled labor and the effective conversion of human capital into a measurable talent dividend (Z. Yang, 2023). Thus, measuring human capital by the ratio of the population with higher education to the total permanent population is justified, with a higher ratio indicating a higher level of human capital, denoted as HC.
(3) The transformation and upgrading of the industrial structure are pivotal to modern economic development, with cities driving non-agricultural employment and aiming for higher value addition through manufacturing and services (Yu et al., 2024). The proportion of secondary and tertiary industries, denoted as IND, is indicative of a city’s industrial evolution.
(4) Due to the challenges in obtaining per capita disposable income data across cities and the prevalence of missing data, this paper uses regional average wages as a proxy for income levels. Given that living costs and consumption levels are relatively stable, a higher average wage correlates with higher per capita disposable income, reflecting the equity in the initial distribution of prosperity (Q. Zhang, 2023), denoted as SAL.
3.3.2. Independent Variables
The key independent variable, known as an explanatory variable, in this paper is designed to represent higher education agglomeration as elucidated in the theoretical framework. The extent of spatial agglomeration is primarily indicated by the availability of human capital and educational resources such as institutions and universities’ students and faculty within a certain area (Adamakou et al., 2021). Given the Chinese Ministry of Education’s stringent regulations on the student–teacher ratio for educational audits and evaluations, it is reasonable to deduce that the scale of student enrollment in a city is typically proportional to the number of academic staff and institutions required to meet the qualified standards of educational assessments. Consequently, any or all of these factors can authentically represent the concentration of higher education within a city. In light of this, the paper employs the number of students enrolled in undergraduate and associate degree programs as an indicator of the spatial agglomeration of higher education, denoted as STU. Furthermore, in the higher education system, which is predominantly public, the government exerts influence over the regional structure of higher education through the establishment or modification of institutions (Abu Alfoul et al., 2024). To objectively reflect the regional distribution of higher education in spatial effect analysis, the paper utilizes the number of institutions per million people as a proxy for the degree of spatial agglomeration of higher education, denoted as UNI.
3.3.3. Control Variables
To mitigate omitted variable bias, this paper integrates key factors affecting urban scientific and technological innovation capacity, such as human capital, industrial structure, and per capita disposable income, into the control variables. These encompass the number of R&D personnel, internal R&D expenditure, average number of full-time faculty per institution, general budgetary education spending, fiscal autonomy, total social fixed asset investment, total foreign direct investment, permanent population, and employment ratio. (1) Regional variations in industrial structures and innovation demands lead to diverse impacts on innovation capacity. However, labor and financial resources are vital for developing regional innovation systems and fostering economic growth. Full-time faculty and R&D personnel in higher education drive research and innovation, with their scale determining human capital accumulation in talent hubs. Additionally, the government’s catalytic role is emphasized through education spending, fiscal autonomy, and R&D funding, crucial for conducting research activities and optimizing industrial structures, influencing urban innovation capacities (Aritenang & Chandramidi, 2023; Wang et al., 2022). (2) Total social fixed asset investment forms the material basis for innovation, with sufficient investment facilitating industrial restructuring and growth (Wu & Zhu, 2021). And foreign direct investment indicates economic openness and attracts talent, introducing innovative technologies, thus reflecting regional industrial transformation and income enhancement (Belderbos et al., 2024). Both factors can indicate the transformation and upgrading of regional industrial structures and income levels to varying extents. (3) The accelerated urbanization process and urban belt reforms result in the concentrated flow and aggregation of population and skilled talent in cities, generating significant labor demand. This may demonstrate a positive impact of permanent population and number of employed persons on human capital levels (Lao et al., 2021).
3.4. Data
This paper primarily draws upon data from the “China City Statistical Yearbook”, “China Urban Construction Statistical Yearbook”, and various annually published municipal statistical yearbooks. These official sources are widely recognized in the field of urban and regional studies in China, ensuring both the authority and reliability of the data. According to official yearbook records, approximately 285 cities are consistently documented across years. The sample selection for this research first identified those cities located within the 19 national urban clusters defined by the “Two Transverse and Three Lengthways” planning. Among these, any city that underwent administrative restructuring, new establishment, or mergers during the sample period, or exhibited substantial missing or anomalous data, was excluded to maintain the consistency and integrity of the dataset. After screening and data cleaning, a final sample of 193 cities was established, resulting in a panel dataset comprising 2895 observations at the prefecture-city level.
The temporal coverage spans from 2006 to 2020, capturing the primary phase of rapid development among China’s urban clusters and ensuring strong data continuity and completeness. Geographically, the chosen sample encompasses cities from diverse regions and at varying stages of socioeconomic development, thereby introducing significant heterogeneity in geographic, economic, demographic, and educational dimensions. This inclusiveness is essential for an analysis of the spatial characteristics of higher education agglomeration in China’s urban clusters and ensures that the empirical results are robust and generalizable. The adopted sampling approach is also consistent with established international academic practices in urban and regional research.
To address potential issues arising from differences in variable magnitudes and to mitigate problems related to heteroscedasticity and skewness in the data distribution, all variables have been transformed using the natural logarithm. Descriptive statistics for all variables are reported in Table 1.

Table 1.
Descriptive statistics.
4. Estimating Results and Discussion
4.1. Regression Result of Benchmark Model
To enhance the interpretability of the model and accurately identify the agglomeration of higher education in urban clusters, the following tests for multicollinearity diagnostics were conducted in this paper. Initially, the Variance Inflation Factor (VIF) was utilized to gauge the extent of multicollinearity, with a general benchmark threshold of 10 for VIF values. The findings revealed VIFs for all variables to be below this threshold, averaging at 4.62, thus indicating no severe multicollinearity issues. Subsequently, the rank condition was applied to further assess multicollinearity, which showed a condition number of 24.6984, well below the critical threshold of 30, thereby confirming the absence of multicollinearity concerns. These findings lend credence to the model’s reliability in elucidating the spatial and demonstration effects of higher education agglomeration in urban clusters.
The estimation, as detailed in Table 2, shows a significant positive correlation between the core independent variables that reflect higher education agglomeration, consistently significant at the 1% level across columns (1) to (8). This robust correlation remains even after the inclusion of a comprehensive set of control variables and the consideration of fixed effects at the city level over time, strongly supporting Research Hypothesis 1. The persistence of this correlation is particularly noteworthy as it highlights the strategic impact of urban cluster policies on the aggregation of demographic and labor resources. Such aggregation not only enhances the spatial agglomeration of higher education within urban clusters but also aligns with the urban demand for knowledge production. This alignment is crucial as it stimulates the intrinsic motivation for structural adjustments in regional higher education configuration, which are essential for meeting the evolving needs of urban innovation ecosystems, with a pronounced influence on elevating the human capital within urban clusters.
Table 2.
Estimation results of dynamic panel model.
The regression results from the spatial econometric model, as presented in Table 3, reveal significant findings under the spatial weight matrix based on economic distance. Related to Research Hypothesis 2, the results of the Global Moran’s I decisively affirm the presence of spatial autocorrelation in the influence that the agglomeration of higher education experts on urban innovation, initial distribution income, the level of human capital and the structure of industry. Importantly, the statistical significance of this impact has been observed to intensify over time. This temporal trend corroborates the notion that the demonstration effect of cities can stimulate innovation and human capital accumulation in adjacent areas through spatial spillover effects. Such stimulation contributes to the transformation and upgrading of industrial structures and to an increase in per capita disposable income within the region, all converging towards the goal of shared prosperity. Notably, the prominence of the demonstration effect within the spatial concentration of higher education in urban agglomerations has become increasingly evident. It is also observed that the spatial autocorrelation coefficient, which reflects the impact of higher education agglomerations on the regional industrial structure, has experienced a gradual decline over time. A plausible explanation for this trend is the role of local governments as catalysts for economic and social development within their jurisdictions, where they can implement innovative policy measures. By implementing innovative policy measures, local governments can nurture leading enterprises that spearhead regional development. In this dynamic, the distinctive industrial policies of local governments, shaped by regional comparative advantages, reinforce the division of labor among regions, resulting in pronounced regional disparities.
Table 3.
Results of the Global Moran’s I test.
As illustrated in Table 4, under the spatial weight matrices of both geographical and economic distances, the spatial interaction coefficients of the independent variables are all positively significant at the 1% statistical level, indicating a pronounced demonstration effect of the spatial agglomeration of higher education in urban clusters. This effect facilitates positive spatial spillovers among cities that are geographically neighboring and economically similar in terms of innovation capacity, human capital enrichment, industrial restructuring and advancement, and the elevation of initial distribution income levels. It provides evidence supporting Research Hypothesis 2. Specifically, the spatial interaction coefficients estimated in columns (1) to (8) suggest that the spatial effect of higher education agglomeration in urban clusters is more pronounced under the geographical distance spatial weight matrix than under the economic matrix, especially for the optimization and upgrading of the industrial structure of nearby cities. This observation maintains that the current strategy, leveraging urban clusters as a growth “poles”, transcends the conventional model of resource allocation predicated on administrative boundaries. It effectively surmounts the “local protectionism” engendered by the yardstick competition mechanism, reinforcing the demonstrative influence of higher education agglomeration through cooperative and sharing mechanisms.
Table 4.
Estimation results of spatial Durbin model.
Furthermore, the results of the core independent variables indicating the higher education agglomeration show that its spatial attributes underscore the significance of their spatial characteristics, further supporting Research Hypothesis 2. Throughout the sample period, the spatial trend influence of its demonstration effect maintains a significant positive role, with the degree of influence from spatial spillover and diffusion being in the following order: human capital level > number of patent authorizations > proportion of secondary and tertiary industries > regional average wage. Notably, the impact is more influenced by geographical distance than by economic distance. This insight further indicates that although the planning of higher education in urban layouts may be influenced by inter-city economic competition, potentially leading to expenditure biases and disparities, the demonstrative effect of higher education agglomeration in urban clusters fosters inter-city collaboration and mutual reinforcement, forming a radiation-driven pattern. Specifically, the spatial agglomeration of higher education in urban clusters accelerates the accrual of human capital, propelling regional innovation and, by extension, the industrial transformation and upgrading in surrounding regions. This dynamic also enhances per capita disposable income within the initial distribution phase, steering towards the ultimate goal of shared prosperity.
4.2. Robustness Test
To avert potential biases in the empirical estimation, this paper rigorously applies three robustness tests to ensure the credibility and explanatory strength of the findings.
The first method employs propensity score matching, aimed at addressing potential sample self-selection bias. We reclassified the key independent variable representing higher education agglomeration, designating values above the median as 1 for the treatment group, while the remaining values were assigned as 0 for the control group. Subsequently, using the control variables from the baseline regression as matching variables, we selected and paired the control group via the kernel matching method. Compared to other matching methods, kernel matching offers greater flexibility. It uses kernel functions to weight the samples in the treatment and control groups, making full use of the sample data and accommodating complex data distributions. This method effectively mitigates the impact of extreme propensity scores, reducing bias and variance during the matching process. The results demonstrate that (refer to Table 5) the post-matching estimations are largely consistent, with no apparent sample selection bias, indicating that the regression results possess strong robustness and reliability. Moreover, when we excluded unmatched data and conducted a new regression, the consistency in coefficient directionality and significance levels with the baseline regression further confirmed the robustness of our empirical estimates.
Table 5.
Robustness test results for propensity score matching.
The second method employs the instrumental variable approach to address potential reverse causality between the variables. The paper utilizes the stock of higher education institutions (‘School’) across various cities as an objective instrumental variable. This selection is underpinned by several considerations. Firstly, there is typically a strong correlation between the number of higher education institutions and the extent of higher education development. A greater number of institutions generally signifies an abundance of degree resources and educational opportunities, indicating a higher agglomeration of higher education. This correlation fulfills the requirement for a strong association between the instrumental variable and the independent variable. Secondly, innovation capability is contingent upon factors such as research investment and collaboration, with the number of institutions serving as a foundational condition. Human capital levels are limited by various factors, including educational quality; the industrial structure is influenced by resources and policy; and resident disposable income is tied to the economy and employment, none of which are directly determined by the number of institutions. Hence, there is no direct causal relationship with the error term, and it maintains a degree of exogeneity relative to the dependent variable. The results show that (refer to Table 6) the Kleibergen–Paap rk LM statistic is significant at the 1% level, allowing the rejection of the null hypothesis of the under-identification for the instrumental variable. The Cragg–Donald Wald F and Kleibergen–Paap rk Wald F statistics significantly exceed the critical value of 16.38, rejecting the hypothesis of weak instruments. Additionally, our estimation results align closely with the benchmark regression, confirming the validity of our instrumental variable selection and attesting to the robustness and reliability of the paper’s findings.
Table 6.
Results of instrumental variable test.
The third method involves the substitution of the core independent variable (as detailed in Table 7). In this part, the variable is replaced with the number of urban residents with junior college education or above (STU2), an indicator that similarly represents the spatial agglomeration of higher education among cities and is conceptually and statistically similar to the core explanatory variable used in the benchmark model. The results are consistent with the regression results above, with the direction and significance level of the estimated coefficients for each variable in each column being similar and without significant differences, further confirming the robustness of the empirical estimation results.
Table 7.
Robustness test results with core explanatory variables replaced.
4.3. Heterogeneity Analysis
Considering the heterogeneity of spatial and demonstration effects at different stages of urban clusters, we conduct a sample-specific heterogeneity analysis based on the “Two Transverse and Three Lengthways” Reform outlined in China’s “14th Five-Year Planning” for the 19 national urban clusters divided into three gradients (see Note 3), as shown in Table 8.
Table 8.
Spatial econometric estimation results of heterogeneity analysis (by region).3
In terms of the dependent variable, the demonstration effect of inter-city higher education spatial agglomeration is particularly prominent within the “High-Quality Upgrading” and “Nurturing and Developing” urban clusters, significantly positively spilling over to the innovation capabilities, human capital levels, industrial structure transformation and upgrading, and initial distribution income levels of adjacent cities within the clusters. However, in the “Vigorous Growth and Expansion” urban clusters, the spatial agglomeration of higher education shows varying degrees of negative spillover effects. These findings partially confirm Research Hypothesis 3. This alerts policymakers that in areas with a weak foundation of higher education, a “sprinkling pepper” approach to higher education configuration is not advisable. Instead, efforts should be concentrated on significant initiatives to fully leverage the spatial-demonstration effects and diffusion functions of higher education agglomeration, thereby promoting coordinated regional economic and social development. Regarding the core independent variable, the paper uncovers that the estimated coefficients for the degree of higher education spatial agglomeration differ markedly among urban clusters. Specifically, in the “Nurturing and Developing” urban clusters, an increase in the degree of higher education spatial agglomeration has a significantly positive demonstration effect, which intensifies with geographical proximity. The order of impact is as follows: the number of patent authorizations > the level of human capital > the upgrade of industrial structure > the regional average wage level. Additionally, the “High-Quality Upgrading” and “Vigorous Growth and Expansion” urban clusters also indicate varying degrees of spatial spillover. The results reveal that under the influence of spatial factors, the positive demonstration effects of technological innovation and socioeconomic activities are predominantly propelled by the “High-Quality Upgrading” urban clusters. However, there is an opportunity: by maturing the spatial scale and concentration of higher education agglomeration within the “Nurturing and Developing” urban clusters, the demonstration effect can be significantly amplified, thereby enhancing the overall developmental trajectory of these regions.
The paper further examines the dynamics of higher education agglomeration in spatial spillover effects and the evolution of spatial concentration over time. The heterogeneity analysis based on temporal changes in Table 9 reveals a positive correlation in the spatiotemporal lag terms of key independent variables, indicating that as time progresses, significant and sustained spatial spillover and demonstration effects emerge in higher education agglomeration. Generally, the spatial effects do not immediately manifest in economic outcomes but require time to become apparent, offering significant evidence in support of Research Hypothesis 3. In the early phases of urban clustering, diffusion and radiation effects are not prominent, likely due to policy support and regional efforts, along with synergies and structural adjustments within cities that have fostered a robust educational ecosystem (Ma et al., 2023), facilitating the regional expansion of higher education agglomeration. This process contributes to the convergence of socioeconomic development gaps between cities at specific geographical and economic distances. However, as changes of the agglomeration over years, socioeconomic activities between geographically proximate and similarly developed cities become increasingly vibrant. This is specifically evident in urban expansion, increased population mobility, and adjustments in universities’ disciplinary and professional structures (Duan et al., 2022), advancing economic and social progress across a broader region. This development provides higher education institutions with greater space and resource support, encouraging city clusters with similar industrial and socioeconomic development levels to overcome their original path dependencies, thereby influencing the pattern of higher education agglomeration. More importantly, the dissemination of knowledge and technology further elevates regional scientific innovation levels and drives economic transformation and upgrading, enhancing the spatial spillover and demonstration effects of this agglomerative layout.
Table 9.
Spatial econometric estimation results of heterogeneity analysis (by time).
5. Discussion and Conclusions
5.1. Discussion
This paper has comprehensively examined the multidimensional spatial spillover and demonstration effects of higher education agglomeration on regional innovation, human capital accumulation, industrial upgrading, and income distribution within Chinese urban clusters. The empirical findings have revealed that higher education agglomeration exerts a critical influence on innovation-led and coordinated regional development, with notable spatial heterogeneity. These results are largely consonant with prior empirical research while the present paper advances both theoretical frameworks and methodological approaches.
The results are consistent with mainstream studies, which identified the significant contribution of spatial agglomeration to economic growth (Fang & Yu, 2017; Zhao et al., 2025). These studies have affirmed that spatial concentration, whether of higher education institutions, population, or industry, enhances macroeconomic performance via mediating mechanisms such as technological innovation and industrial restructuring. Moreover, this paper has elucidated the centrality of knowledge spillovers induced by higher education agglomeration in augmenting regional innovation capacity, attracting high-quality human capital, and strengthening economic coordination. This observation is corroborated by Liang et al. (2025), who documented that polycentric urban spatial structures and dual-core coupling mechanisms significantly promote economic resilience through positive spatial externalities. Unlike analyses that focus solely on industrial or demographic factors, the current research has emphasized the composite effect of higher education agglomeration as a strategic spatial resource in enhancing both regional resilience and innovative capacity. Notably, this paper has further innovated by integrating dynamic panel regression and spatial econometric models to capture the temporal evolution and spatial heterogeneity of spillover effects, allowing for the identification of patterns previously overlooked in cross-sectional analyses. Additionally, in line with Yu et al. (2024), this paper has recognized the government’s pivotal role and regional heterogeneity in shaping the stratified functions and differentiated development paths of Chinese urban agglomerations. Distinctively, this research has developed a comprehensive framework that explicitly links higher education resource spatial allocation to the multilayered growth trajectories of urban clusters, including the identification of functional regions and innovation hubs, thus enriching the current understanding of urban agglomeration typologies in developing economies.
Internationally, a comparable positive impact of higher education spatial concentration on regional innovation systems and technological diffusion has been substantiated in developed economies, notably those in Europe and North America (Drucker, 2016; Ebersberger et al., 2013; Valero & Van Reenen, 2019). Nonetheless, Chinese urban agglomerations are distinct for their policy-driven dynamics, rapid industrial transformation, and pronounced regional diversity (H. Yang et al., 2025). This paper’s nuanced analysis of integration between state-driven and market-driven mechanisms, and the observed shift toward diversified innovation models, represents an original contribution to the comparative literature on global agglomeration economies. From a theoretical viewpoint, the integration of Martin’s regional resilience framework and multi-scalar spatial heterogeneity enriches the theoretical landscape of new economic geography and agglomeration economics (Feng, 2021; Martin, 2011), offering critical insights into the unique spillover pathways and industrial differentiation associated with higher education agglomeration. In particular, by employing a spatially explicit analytical perspective, this research has unpacked the multiple channels, such as knowledge networks and institutional synergies, through which higher education agglomeration shapes complex urban-regional innovation ecosystems.
5.2. Conclusions
Grounded in the evolving phenomenon and structure of urban clusters, this paper has sought to elucidate the mechanisms by which higher education agglomeration stimulates regional socioeconomic progress. Utilizing panel data from 193 cities across the “Two Transverse and Three Lengthways” urban clusters from 2006 to 2020, we applied a dynamic panel regression to scrutinize the influence of higher education agglomeration on inter-city innovation capacity, human capital development, industrial restructuring, and equitable initial income distribution. Furthermore, spatial Durbin models, informed by spatial weights derived from geographic and economic distances, were employed to confirm the demonstration effects of higher education agglomeration and its catalytic pathways for regional development. Our overarching conclusion is that the current agglomeration of higher education is effectively synchronized with the strategic urban cluster development at the national level. This alignment generates a notable agglomeration effect on innovation capabilities, human capital accumulation, industrial adjustment, and income levels. The key role of core cities within urban clusters is particularly pronounced, with the spatial and demonstration effect of higher education agglomeration becoming increasingly evident, especially in terms of human capital accumulation.
This research systematically analyzes the spatial evolution of urban clusters and highlights the role of higher education agglomeration in regional development. The findings indicate that regional higher education strategies should be more closely integrated with the spatial and socioeconomic frameworks of urban clusters. Policy formulation should be adapted to the specific conditions of different regions to address diverse developmental needs. Relevant concepts from new economic geography, such as multiple equilibrium and spatial equilibrium, emphasize the importance of spatial interdependence. Regional policies should facilitate the flow of educational resources and population in developed areas, while advancing targeted higher education reforms in less-developed regions, and account for differences in technological and resource allocation among different cities. The theoretical contribution of this paper lies in supplementing and validating existing theories on higher education agglomeration and regional coordination from a spatial perspective and demonstrating the applicability of new economic geography approaches in the Chinese context. In practical terms, the results suggest that higher education policies should be differentiated based on the type and developmental stage of urban clusters. For core cities, efforts should focus on the further concentration of higher education resources and enhancing innovation capacity; for emerging and secondary clusters, the emphasis should be placed on closer integration between higher education and local industry; and for peripheral or less-developed areas, attention should be directed to the equitable distribution of educational resources and improving access for disadvantaged groups.
The limitations of this paper stem primarily from its reliance on official statistical data, which do not fully capture factors such as the flow of educational resources or informal education, and from the restricted range of variables and methodologies applied. Future research could incorporate micro-level data and more advanced spatial analytical techniques to conduct more detailed comparative studies across various types of urban clusters and population groups.
Author Contributions
Conceptualization, Y.H., C.Y. and J.M.; methodology, Y.H.; validation, Y.H. and C.Y.; formal analysis, Y.H.; data curation, Y.H.; writing—original draft preparation, Y.H.; writing—review and editing, C.Y. and J.M.; supervision, C.Y.; project administration, C.Y.; funding acquisition, J.M. All authors have read and agreed to the published version of the manuscript.
Funding
This research was funded by following programs: Postdoctoral Research Projects of Guangzhou (Grant No. 624021-71); Fujian Provincial Social Science Fund General Project (Grant No. FJ2024B138). Major Project of the Ministry of Education’s Research on Philosophy and Social Sciences (Grant No. 21JZD057).
Institutional Review Board Statement
Not applicable.
Informed Consent Statement
Not applicable.
Data Availability Statement
The original data presented in this study are included in the article. Further inquiries can be directed to the corresponding author.
Conflicts of Interest
The authors declare no conflict of interest.
Notes
| 1 | The data on enrolment in higher education have been derived from the “National Educational Statistics Bulletin” issued by the Ministry of Education of China. Related links: http://www.moe.gov.cn/jyb_sjzl/sjzl_fztjgb/202108/t20210827_555004.html, accessed on 10 March 2025. |
| 2 | The national-level urban clusters of the “Two Transverse and Three Lengthways” framework in China are hierarchically classified as follows: the first tier of “High-Quality Upgrading” Urban Clusters (Beijing–Tianjin–Hebei, the Yangtze River Delta, the Pearl River Delta, Chengdu–Chongqing, and the Middle Reaches of the Yangtze River), the second tier of “Vigorous Growth and Expansion” Urban Clusters (the Shandong Peninsula, the Coastal Area of Guangdong–Fujian–Zhejiang, the Central Plains, the Guanzhong Plain, and the Beibu Gulf), and the third tier of “Nurturing and Developing” Urban Clusters (Harbin–Changchun, Central and Southern Liaoning, Central Shanxi, Central Guizhou, Central Yunnan, Hohhot–Baotou–Yulin, Lanzhou–Xining, Ningxia along the Yellow River, and the northern slope of the Tianshan Mountains). |
| 3 | Given that the results of benchmark regression have validated the interchangeability of “number of higher education institutions per million people” as a metric for assessing the spatial agglomeration of higher education distribution, and have shown significant spatial spillover effects under both the geographical distance and economic distance spatial weight matrices, in Table 8 and Table 9, it is henceforth sufficient to use only “number of undergraduate students” as a proxy variable, based on the spatial weight matrix of geographical distance and the dynamic panel analysis, to examine the heterogeneity of the spatiotemporal effects of higher education agglomeration in urban clusters. The complete results are also available upon request. |
References
- Abu Alfoul, M. N., Bazhair, A. H., Khatatbeh, I. N., Arian, A. G., & Abu Al-Foul, M. N. (2024). The effect of education on economic growth in Sub-Saharan African countries: Do institutions matter? Economies, 12(11), 300. [Google Scholar] [CrossRef]
- Acs, Z. J., Anselin, L., & Varga, A. (2002). Patents and innovation counts as measures of regional production of new knowledge. Research Policy, 31(7), 1069–1085. [Google Scholar] [CrossRef]
- Adamakou, M., Kallioras, D., & Petrakos, G. (2021). Detecting convergence trends among EU universities. Economies, 9(2), 42. [Google Scholar] [CrossRef]
- Addie, J. P. D. (2017). From the urban university to universities in urban society. Regional Studies, 51(7), 1089–1099. [Google Scholar] [CrossRef]
- Addie, J. P. D., Keil, R., & Olds, K. (2015). Beyond town and gown: Universities, territoriality and the mobilization of new urban structures in Canada. Territory Politics Governance, 3(1), 27–50. [Google Scholar] [CrossRef]
- Alder, S., Shao, L., & Zilibotti, F. (2016). Economic reforms and industrial policy in a panel of Chinese cities. Journal of Economic Growth, 21(4), 305–349. [Google Scholar] [CrossRef]
- Aldieri, L., Kotsemir, M. N., & Vinci, C. P. (2018). Knowledge spillover effects: Empirical evidence from Russian regions. Quality & Quantity, 52(5), 2111–2132. [Google Scholar] [CrossRef]
- Al-Youbi, A. O., Zahed, A. H. M., Nahas, M. N., & Hegazy, A. A. (2021). The Roles of Universities in Development. In The leading world’s most innovative universities (pp. 1–8). Springer International Publishing. [Google Scholar] [CrossRef]
- Anselin, L. B., & Anil, K. (1998). Spatial dependence in linear regression models with an introduction to spatial econometrics. In A. Ullah (Ed.), Handbook of applied economic statistics. CRC Press. [Google Scholar] [CrossRef]
- Arbo, P., & Benneworth, P. (2007). Understanding the regional contribution of higher education institutions (OECD Education Working Papers, No. 9). OECD Publishing. [Google Scholar] [CrossRef]
- Aritenang, A. F., & Chandramidi, A. N. (2023). The spatial effects of fiscal decentralization on regional convergence: The case of regions in indonesia. GeoJournal, 88(2), 2011–2030. [Google Scholar] [CrossRef]
- Bayuo, B. B., Chaminade, C., & Göransson, B. (2020). Unpacking the role of universities in the emergence, development and impact of social innovations—A systematic review of the literature. Technological Forecasting and Social Change, 155, 120030. [Google Scholar] [CrossRef]
- Belderbos, R., Castellani, D., Du, H. S., & Lee, G. H. (2024). Internal versus external agglomeration advantages in investment location choice: The role of global cities’ international connectivity. Journal of International Business Studies, 55(6), 745–763. [Google Scholar] [CrossRef]
- Bevilacqua, C., Pizzimenti, P., & Ou, Y. (2023). Cities in transition and urban innovation ecosystems: Place and innovation dynamics in the case of Boston and Cambridge (USA). Sustainability, 15(18), 13346. [Google Scholar] [CrossRef]
- Billings, S. B., & Johnson, E. B. (2016). Agglomeration within an urban area. Journal of Urban Economics, 91, 13–25. [Google Scholar] [CrossRef]
- Borsi, M. T., Valerio Mendoza, O. M., & Comim, F. (2022). Measuring the provincial supply of higher education institutions in China. China Economic Review, 71, 101724. [Google Scholar] [CrossRef]
- Brennan, J., & Cochrane, A. (2019). Universities: In, of, and beyond their cities. Oxford Review of Education, 45(2), 188–203. [Google Scholar] [CrossRef]
- Breschi, S., & Lissoni, F. (2001). Knowledge spillovers and local innovation systems: A critical survey. Industrial and Corporate Change, 10(4), 975–1005. [Google Scholar] [CrossRef]
- Caniëls, M. C. J., & van den Bosch, H. (2011). The role of higher education institutions in building regional innovation systems. Papers in Regional Science, 90(2), 271–287. [Google Scholar] [CrossRef]
- Capone, F., Lazzeretti, L., & Innocenti, N. (2021). Innovation and diversity: The role of knowledge networks in the inventive capacity of cities. Small Business Economics, 56(2), 773–788. [Google Scholar] [CrossRef]
- Chandra, R. (2022). Paul Romer and modern endogenous growth theory. In R. Chandra (Ed.), Endogenous growth in historical perspective: From Adam Smith to Paul Romer (pp. 251–281). Springer International Publishing. [Google Scholar] [CrossRef]
- Chao, R. Y. (2014). Pathways to an East Asian higher education area: A comparative analysis of East Asian and European regionalization processes. Higher Education, 68(4), 559–575. [Google Scholar] [CrossRef]
- Chen, K., & Kenney, M. (2007). Universities/research institutes and regional innovation systems: The cases of Beijing and Shenzhen. World Development, 35(6), 1056–1074. [Google Scholar] [CrossRef]
- Chou, M. H., Erkkilä, T., & Mölsä, J. (2023). Crafting innovation hubs: Future cities and global challenges. The British Journal of Politics and International Relations, 26(3), 694–717. [Google Scholar] [CrossRef]
- Czaller, L. (2017). Increasing social returns to human capital: Evidence from Hungarian regions. Regional Studies, 51(3), 467–477. [Google Scholar] [CrossRef]
- De Falco, S. (2021). Spatial dynamics regarding geographical concentration of economic activities. Italian NUTS-3 analysis. Applied Spatial Analysis and Policy, 14(4), 795–825. [Google Scholar] [CrossRef]
- Drucker, J. (2016). Reconsidering the regional economic development impacts of higher education institutions in the United States. Regional Studies, 50(7), 1185–1202. [Google Scholar] [CrossRef]
- Duan, Y., Zhang, H., Wang, W., & Ao, X. (2022). The effects of China’s higher education expansion on urban and rural intergenerational mobility. China Economic Review, 73, 101793. [Google Scholar] [CrossRef]
- Ebersberger, B., Herstad, S. J., & Altmann, A. (2013). Higher education institutions and regional development. In A. Altmann, & B. Ebersberger (Eds.), Universities in change: Managing higher education institutions in the age of globalization (pp. 311–321). Springer New York. [Google Scholar] [CrossRef]
- Fang, C., & Yu, D. (2017). Urban agglomeration: An evolving concept of an emerging phenomenon. Landscape and Urban Planning, 162, 126–136. [Google Scholar] [CrossRef]
- Fang, C., & Yu, D. (2020). Overview of the fundamental connotation and strategic position of China’s urban agglomerations. In China’s urban agglomerations (pp. 1–63). Springer Singapore. [Google Scholar] [CrossRef]
- Feng, L. (2021). Influence of spatiotemporal difference and input of higher education on regional economy. Discrete Dynamics in Nature and Society, 2021(1), 9515285. [Google Scholar] [CrossRef]
- Florida, R., & Adler, P. (2020). Economic geography. In A. Kobayashi (Ed.), International encyclopedia of human geography (2nd ed., pp. 25–28). Elsevier. [Google Scholar] [CrossRef]
- Fujita, M. (2008). Formation and growth of economic agglomerations and industrial clusters: A theoretical framework from the viewpoint of spatial economics. In A. Kuchiki, & M. Tsuji (Eds.), The flowchart approach to industrial cluster policy (pp. 18–37). Palgrave Macmillan UK. [Google Scholar] [CrossRef]
- Fujita, M., & Krugman, P. (2003). The new economic geography: Past, present and the future. Papers in Regional Science, 83(1), 139–164. [Google Scholar] [CrossRef]
- Fujita, M., & Mori, T. (1996). The role of ports in the making of major cities: Self-agglomeration and hub-effect. Journal of Development Economics, 49(1), 93–120. [Google Scholar] [CrossRef]
- Gaspar, J. M. (2020). New economic geography: Economic integration and spatial imbalances. In S. Colombo (Ed.), Spatial economics volume I: Theory (pp. 79–110). Springer International Publishing. [Google Scholar] [CrossRef]
- Glaeser, E. L., Kallal, H. D., Scheinkman, J. A., & Shleifer, A. (1992). Growth in cities. Journal of Political Economy, 100(6), 1126–1152. [Google Scholar] [CrossRef]
- Gordon, P., & Kourtit, K. (2020). Agglomeration and clusters near and far for regional development: A critical assessment. Regional Science Policy & Practice, 12(3), 387–396. [Google Scholar] [CrossRef]
- Gu, H., Meng, X., Shen, T., & Wen, L. (2020). China’s highly educated talents in 2015: Patterns, determinants and spatial spillover effects. Applied Spatial Analysis and Policy, 13(3), 631–648. [Google Scholar] [CrossRef]
- Gu, J. F. (2012a). Harmonious expansion of China’s higher education: A new growth pattern. Higher Education, 63(4), 513–528. [Google Scholar] [CrossRef]
- Gu, J. F. (2012b). Spatial recruiting competition in Chinese higher education system. Higher Education, 63(2), 165–185. [Google Scholar] [CrossRef]
- Harrison, J., Smith, D. P., & Kinton, C. (2017). Relational regions “in the making”: Institutionalizing new regional geographies of higher education. Regional Studies, 51(7), 1020–1034. [Google Scholar] [CrossRef]
- Huffman, D., & Quigley, J. M. (2002). The role of the university in attracting high tech entrepreneurship: A Silicon Valley tale. Annals of Regional Science, 36(3), 403–419. [Google Scholar] [CrossRef]
- Ji, M., Jiao, Y. W., & Cheng, N. (2023). An Innovative decision-making scheme for the high-quality economy development driven by higher education. Journal of Innovation & Knowledge, 8(2), 100345. [Google Scholar] [CrossRef]
- Jongbloed, B., Enders, J., & Salerno, C. (2008). Higher education and its communities: Interconnections, interdependencies and a research agenda. Higher Education, 56(3), 303–324. [Google Scholar] [CrossRef]
- Kim, Y. J., & Lee, C.-I. (2024). Space and technology in catching-up economies: “The city as a laboratory for innovation”. The Annals of Regional Science, 73(1), 205–239. [Google Scholar] [CrossRef]
- Konzelmann, S. J., Pitelis, C. N., & Tomlinson, P. R. (2025). Is it all in Marshall, still? An appreciation of Marshall’s contribution to modern economics. Cambridge Journal of Economics, 49(3), 385–404. [Google Scholar] [CrossRef]
- Krugman, P. (1991). Increasing returns and economic geography. Journal of Political Economy, 99(3), 483–499. [Google Scholar] [CrossRef]
- Lao, X., Gu, H., Yu, H., & Xiao, F. (2021). Exploring the spatially-varying effects of human capital on urban innovation in China. Applied Spatial Analysis and Policy, 14(4), 827–848. [Google Scholar] [CrossRef]
- Lee, J. T. (2014). Education hubs and talent development: Policymaking and implementation challenges. Higher Education, 68(6), 807–823. [Google Scholar] [CrossRef]
- Lendel, I., & Qian, H. F. (2017). Inside the great recession: University products and regional economic development. Growth and Change, 48(1), 153–173. [Google Scholar] [CrossRef]
- Li, X. Y., Li, J. L., & Wu, X. J. (2020). University spillovers, spatial distance, and firm innovation: Evidence at Chinese listed firms. Emerging Markets Finance and Trade, 56(7), 1504–1519. [Google Scholar] [CrossRef]
- Li, Y., Zhang, J. N., Yang, X. D., Wang, W. L., Wu, H. T., Ran, Q. Y., & Luo, R. D. (2021). The impact of innovative city construction on ecological efficiency: A quasi-natural experiment from China. Sustainable Production and Consumption, 28, 1724–1735. [Google Scholar] [CrossRef]
- Liang, W., Wang, D., Gao, L., & Li, C. (2025). Study on the impact of China’s urban agglomerations’ tiered spatial structure on regional economic resilience. PLoS ONE, 20(3), e0314538. [Google Scholar] [CrossRef]
- Liu, H., Wang, L., Wang, J., Ming, H., Wu, X., Xu, G., & Zhang, S. (2024). Multidimensional spatial inequality in China and its relationship with economic growth. Humanities and Social Sciences Communications, 11(1), 1415. [Google Scholar] [CrossRef]
- Liu, X., Wu, X., & Zhang, W. (2024). A new DEA model and its application in performance evaluation of scientific research activities in the universities of China’s double first-class initiative. Socio-Economic Planning Sciences, 92, 101839. [Google Scholar] [CrossRef]
- Lucas, R. E. (1988). On the mechanics of economic development. Journal of Monetary Economics, 22(1), 3–42. [Google Scholar] [CrossRef]
- Lyu, L., Sun, F., & Huang, R. (2019). Innovation-based urbanization: Evidence from 270 cities at the prefecture level or above in China. Journal of Geographical Sciences, 29(8), 1283–1299. [Google Scholar] [CrossRef]
- Ma, C. Y., Wu, H. C., & Li, X. H. (2023). Spatial spillover of local general higher education expenditures on sustainable regional economic growth: A spatial econometric analysis. PLoS ONE, 18(11), e0292781. [Google Scholar] [CrossRef]
- Maggioni, M. A., & Uberti, T. E. (2009). Knowledge networks across Europe: Which distance matters? The Annals of Regional Science, 43(3), 691–720. [Google Scholar] [CrossRef]
- Marshall, A. (2013). The growth of wealth. In A. Marshall (Ed.), Principles of economics (pp. 183–199). Palgrave Macmillan UK. [Google Scholar] [CrossRef]
- Martin, R. (2011). Regional economic resilience, hysteresis and recessionary shocks. Journal of Economic Geography, 12(1), 1–32. [Google Scholar] [CrossRef]
- Mitze, T., & Makkonen, T. (2020). When interaction matters: The contingent effects of spatial knowledge spillovers and internal R&I on firm productivity. The Journal of Technology Transfer, 45(4), 1088–1120. [Google Scholar] [CrossRef]
- Mohanty, B., & Bhanumurthy, N. R. (2018). Regional growth policy experience in India: The spatial dimension. Asia-Pacific Journal of Regional Science, 2(2), 479–505. [Google Scholar] [CrossRef]
- Mok, K. H., & Marginson, S. (2021). Massification, diversification and internationalisation of higher education in China: Critical reflections of developments in the last two decades. International Journal of Educational Development, 84, 102405. [Google Scholar] [CrossRef]
- Motoyama, Y. (2008). What was new about the cluster theory?: What could it answer and what could it not answer? Economic Development Quarterly, 22(4), 353–363. [Google Scholar] [CrossRef]
- Munnich, L., & Iacono, M. (2016). Competitive industry clusters and transportation in Minnesota. Competitiveness Review, 26, 25–40. [Google Scholar] [CrossRef]
- Ottaviano, G., & Thisse, J. F. (2004). Agglomeration and economic geography. In J. V. Henderson, & J. F. Thisse (Eds.), Handbook of regional and urban economics (Vol. 4, pp. 2563–2608). Elsevier. [Google Scholar] [CrossRef]
- Pablo-Martí, F., & Arauzo-Carod, J.-M. (2020). Spatial distribution of economic activities: A network approach. Journal of Economic Interaction and Coordination, 15(2), 441–470. [Google Scholar] [CrossRef]
- Peng, C., & Xu, H. (2024). Universities and cities: The impact of higher education on urban innovation, entrepreneurship, and economic growth. Asian Economic Papers, 23(2), 33–56. [Google Scholar] [CrossRef]
- Pink-Harper, S. A. (2015). Educational attainment: An examination of its impact on regional economic growth. Economic Development Quarterly, 29(2), 167–179. [Google Scholar] [CrossRef]
- Porter, M. E. (2000). Location, competition, and economic development: Local clusters in a global economy. Economic Development Quarterly, 14(1), 15–34. [Google Scholar] [CrossRef]
- Rodríguez-Pose, A. (2001). Is R&D investment in lagging areas of Europe worthwhile? Theory and empirical evidence. Papers in Regional Science, 80(3), 275–295. [Google Scholar] [CrossRef]
- Romer, P. M. (1986). Increasing returns and long-run growth. Journal of Political Economy, 94(5), 1002–1037. [Google Scholar] [CrossRef]
- Rosenfeld, M. T. W., Franz, P., & Heimpold, G. (2007). Economic ‘clusters’ in East Germany: Evidence on the location and characteristics of spatially concentrated industries. Post-Communist Economies, 19(1), 73–92. [Google Scholar] [CrossRef]
- Santoalha, A., Biscaia, R., & Teixeira, P. (2018). Higher education and its contribution to a diverse regional supply of human capital: Does the binary/unitary divide matters? Higher Education, 75(2), 209–230. [Google Scholar] [CrossRef]
- Slavova, S., Rubalcaba, L., & Franco-Riquelme, J. N. (2025). Understanding imbalanced transmission from R&D inputs into innovation outputs and impacts: Evidence from Kazakhstan. Economies, 13(2), 25. [Google Scholar] [CrossRef]
- Sun, Y. M., Lu, Y. L., Wang, T. Y., Ma, H., & He, G. Z. (2008). Pattern of patent-based environmental technology innovation in China. Technological Forecasting and Social Change, 75(7), 1032–1042. [Google Scholar] [CrossRef]
- Tleppayev, A., Zeinolla, S., Tyulyubayeva, D., & Aben, A. (2025). Education, institutions, and investment as determinants of economic growth in Central Asia and the Caucasus: A panel data analysis. Economies, 13(3), 78. [Google Scholar] [CrossRef]
- Tridico, P. (2011). Explaining economic development: Old and new theories. In Institutions, human development and economic growth in transition economies (pp. 181–194). Palgrave Macmillan UK. [Google Scholar] [CrossRef]
- Tripathi, S. (2021). Do macroeconomic factors promote urbanization? Evidence from BRICS countries. Asia-Pacific Journal of Regional Science, 5(2), 397–426. [Google Scholar] [CrossRef]
- Tsvetkova, E., & Lomer, S. (2019). Academic excellence as “competitiveness enhancement” in Russian higher education. International Journal of Comparative Education and Development, 21(2), 127–144. [Google Scholar] [CrossRef]
- Valero, A., & Van Reenen, J. (2019). The economic impact of universities: Evidence from across the globe. Economics of Education Review, 68, 53–67. [Google Scholar] [CrossRef]
- Vaz, E. (2024). Spatial spillovers and knowledge structures. In Regional knowledge economies: Exploring the intersection of technology, geography, and innovation in the digital era (pp. 7–21). Springer Nature Switzerland. [Google Scholar] [CrossRef]
- Verspagen, B. (2010). The spatial hierarchy of technological change and economic development in Europe. The Annals of Regional Science, 45(1), 109–132. [Google Scholar] [CrossRef]
- Wang, C., Wang, L., Xue, Y., & Li, R. (2022). Revealing spatial spillover effect in high-tech industry Agglomeration from a high-skilled labor flow network perspective. Journal of Systems Science and Complexity, 35(3), 839–859. [Google Scholar] [CrossRef]
- Wilck, J. H. (2020). Introduction to the special issue on engineering economy education. The Engineering Economist, 65(3), 177–178. [Google Scholar] [CrossRef]
- Woldegiorgis, E., Jonck, P., & Goujon, A. (2015). Regional higher education reform initiatives in Africa: A comparative analysis with the Bologna Process. International Journal of Higher Education, 4, 241–253. [Google Scholar] [CrossRef]
- Wu, W. W., & Zhu, J. D. (2021). Are there demonstration effects of fiscal expenditures on higher education in China? An empirical investigation. International Journal of Educational Development, 81, 102345. [Google Scholar] [CrossRef]
- Xiong, W., Yang, J., & Shen, W. (2022). Higher education reform in China: A comprehensive review of policymaking, implementation, and outcomes since 1978. China Economic Review, 72, 101752. [Google Scholar] [CrossRef]
- Yang, H., Ma, G., & Tan, B. (2025). The impact of higher education revitalisation on regional innovation capability. Finance Research Letters, 75, 106908. [Google Scholar] [CrossRef]
- Yang, Z. (2023). Human capital space: A spatial perspective of the dynamics of people and economic relationships. Humanities and Social Sciences Communications, 10(1), 145. [Google Scholar] [CrossRef]
- Yang, Z., Hao, P., & Cai, J. (2015). Economic clusters: A bridge between economic and spatial policies in the case of Beijing. Cities, 42, 171–185. [Google Scholar] [CrossRef]
- Yin, X. S., Hussain, J., & Kui, Z. (2022). The spatial distribution pattern and formation mechanism of the spatial agglomeration of Chinese higher education population: A cross-province comparison. Applied Spatial Analysis and Policy, 15(2), 315–338. [Google Scholar] [CrossRef]
- Yu, J., Hu, W., & Deng, T. (2024). Towards more resilient economy—Analyzing the impact of new-type urbanization on urban economic resilience: Mechanisms and spatial spillover boundaries. Economic Change and Restructuring, 57(5), 158. [Google Scholar] [CrossRef]
- Zhang, C., Tian, L., & Fang, G. (2024). Analysis of sustainable transformation development patterns and heterogeneity of Chinese cities based on spatial general equilibrium model. Environment, Development and Sustainability, 26(10), 25689–25715. [Google Scholar] [CrossRef]
- Zhang, Q. (2023). Urban–rural gap and regional inequality of local household income in Jiangsu Province, China. GeoJournal, 88(6), 6589–6601. [Google Scholar] [CrossRef]
- Zhang, T., Lei, Y., & Zhang, Q. (2023). The contribution of enterprises, universities, and research institutes to regional innovation efficiency in China. Technology Analysis & Strategic Management, 1–12. [Google Scholar] [CrossRef]
- Zhao, J., Chen, N., & Jin, Z. (2025). The more centralized the spatial structure is, the greater the economic growth? Evidence from urban agglomerations in western China. Humanities and Social Sciences Communications, 12(1), 483. [Google Scholar] [CrossRef]
- Ziberi, B. F., Rexha, D., Ibraimi, X., & Avdiaj, B. (2022). Empirical analysis of the impact of education on economic growth. Economies, 10(4), 89. [Google Scholar] [CrossRef]
- Ziemnowicz, C. (2020). Joseph A. Schumpeter and innovation. In E. G. Carayannis (Ed.), Encyclopedia of creativity, invention, innovation and entrepreneurship (pp. 1517–1522). Springer International Publishing. [Google Scholar] [CrossRef]
Disclaimer/Publisher’s Note: The statements, opinions and data contained in all publications are solely those of the individual author(s) and contributor(s) and not of MDPI and/or the editor(s). MDPI and/or the editor(s) disclaim responsibility for any injury to people or property resulting from any ideas, methods, instructions or products referred to in the content. |
© 2025 by the authors. Licensee MDPI, Basel, Switzerland. This article is an open access article distributed under the terms and conditions of the Creative Commons Attribution (CC BY) license (https://creativecommons.org/licenses/by/4.0/).