Article

Economic Clues to Crime: Insights from Mongolia

by
Dagvasuren Ganbold
1,*,
Enkhbayar Jamsranjav
2,
Young-Rae Kim
1 and
Erdenechuluun Jargalsaikhan
1
1
Department of Fundamental Science, University of Finance and Economics, BZD 3rd Street, Peace Avenue-5, Ulaanbaatar 13381, Mongolia
2
Department of Applied Mathematics, National University of Mongolia, Ikh Surguuliin Gudamj-1, Ulaanbaatar 14201, Mongolia
*
Author to whom correspondence should be addressed.
Economies 2025, 13(6), 160; https://doi.org/10.3390/economies13060160
Submission received: 6 May 2025 / Accepted: 21 May 2025 / Published: 4 June 2025
(This article belongs to the Section Economic Development)

Abstract

:
This paper examines the dynamic relationship between economic indicators, law enforcement mechanisms, and property-related crimes in Mongolia using a time-series econometric approach. Relying on the theoretical frameworks of Becker’s economic model of crime and Cantor and Land’s motivation–opportunity hypothesis, the study explores the effects of unemployment, detection probability, and incarceration rates on four crime categories: total crime, theft, robbery, and fraud. An error correction model (ECM) is employed to capture both short-run fluctuations and long-run equilibrium relationships over the period 1992–2022. The empirical findings reveal that detection rates exert a statistically significant deterrent effect on robbery in the short term, while incarceration rates are effective in reducing theft. Unemployment shows a positive and significant long-run effect on theft prior to 2009 but weakens thereafter due to methodological changes in labor statistics. Fraud demonstrates a distinct response pattern, exhibiting negative associations with both incarceration and unemployment, and showing no sensitivity to detection probability. Diagnostic tests support the model’s robustness, with heteroskedasticity in the theft model addressed using robust standard errors. This study contributes to the literature by providing the first country-specific empirical evidence on crime determinants in Mongolia. It highlights the heterogeneous impact of economic and institutional factors on different crime types in a transition economy. The findings underscore the need for integrated policy responses that combine improvements in law enforcement with inclusive economic and social development strategies.

1. Introduction

Crime imposes substantial social and economic costs worldwide, particularly in developing and transition economies. The relationship between economic conditions and criminal activity has long been of interest to researchers and policymakers. One of the most prominent frameworks for understanding crime behavior from an economic perspective is Becker’s (1968) rational choice theory, which models crime as an individual’s utility-maximizing decision weighed against the probability and severity of punishment. Ehrlich (1973) further extended this framework by incorporating labor market dynamics, suggesting that individuals may substitute illegal for legal income when employment prospects diminish.
A complementary approach is offered by Cantor and Land (1985), who introduced the concepts of the motivation effect and opportunity effect. The motivation effect suggests that rising unemployment increases crime by lowering the opportunity cost of illegal activity, while the opportunity effect posits that economic downturns may reduce criminal opportunities as people stay home more or reduce conspicuous consumption. These perspectives have guided a wide range of empirical studies in both developed and developing countries, with varying results depending on data availability, legal infrastructure, and crime type. For example, studies in the United States (Jawadi et al., 2019; Levitt, 1998; Lucas, 2024), the United Kingdom (Saridakis, 2004), and Iran (Costantini et al., 2018) have found mixed results on the unemployment–crime nexus. In developing contexts, Buonanno and Montolio (2008) used regional panel data to assess economic and demographic effects on crime in Spain, while Tang (2009) employed Johansen cointegration and ECM methods to investigate the long- and short-run relationships between unemployment, inflation, and overall crime rates in Malaysia, finding significant positive impacts of both variables on crime.
Despite the rich literature, empirical studies focusing on post-socialist economies, particularly Mongolia, remain scarce. Mongolia, a landlocked country in East and Central Asia, has undergone substantial political and economic transformation since transitioning from socialism to democracy and a market economy in the early 1990s. These changes have coincided with rising urbanization, income inequality, and shifts in social structures, raising concerns about public safety and law enforcement effectiveness. However, no previous study has empirically investigated how macroeconomic conditions and law enforcement variables influence crime trends in Mongolia using formal econometric models.
This study addresses this gap by empirically evaluating the effects of economic and institutional factors on crime in Mongolia using a time-series approach. Specifically, we apply an error correction model (ECM) to assess how detection rates, incarceration rates, and unemployment affect overall crime as well as property-related crime types: theft, robbery, and fraud. These variables are selected based on established theoretical models and prior empirical findings (Atmadi et al., 2024; Britto et al., 2022; Levitt, 1998; Wang & Hu, 2021).
The study is guided by the following research question: To what extent do macroeconomic conditions and law enforcement efforts influence crime trends in Mongolia, and how do these effects differ across crime types and over time? The contribution of this study is threefold. First, it introduces novel empirical evidence from a post-socialist context, offering insights for a country previously unexamined in this domain. Second, by disaggregating crime into distinct categories, it provides a more nuanced understanding of how institutional and economic forces affect specific types of criminal behavior. Third, the use of a time-series ECM framework allows for the differentiation between short-run fluctuations and long-run equilibrium relationships—critical in understanding the dynamics of crime in transitional settings.
In doing so, this paper adds to a growing body of literature highlighting that crime in transitional and developing economies cannot be fully explained by models developed for high-income countries alone. Rather, context-specific factors such as informal labor markets, institutional fragility, and legal evolution must be considered.

2. Literature Review

Criminals act as rational economic agents seeking to maximize utility. They analyzed how crime rates are closely related to law enforcement intensity and socioeconomic conditions, arguing that an increase in the probability of arrest and severity of punishment would reduce criminal motivation. Conversely, they explained that higher expected returns from illegal activities or lower returns from the legal labor market would increase the likelihood of criminal participation. Subsequent research has focused on empirically testing these hypotheses.
Cantor and Land (1985) analyzed the impact of unemployment on crime through the opportunity effect and motivation effect. They argued that rising unemployment could reduce opportunities for certain types of crime while simultaneously lowering the opportunity cost of legal employment, thereby increasing criminal motivation. Empirical studies showed that while higher levels of unemployment reduced violent and property crimes, increases in unemployment rates promoted property crime. Britt (1994) expanded on Cantor and Land’s approach by examining the relationship between youth unemployment and crime. His study found a negative correlation between the unemployment level and youth crime rates, while changes in unemployment rates had a positive effect on property crime. However, no significant relationship was found between unemployment rate changes and violent crime. Greenberg (2001) and Hale and Sabbagh (1991) criticized Cantor and Land’s methodological approach, highlighting that OLS estimation could be inappropriate when the integration orders of variables differ. Greenberg (2001) applied cointegration and error correction models to analyze the relationships between unemployment, divorce rates, homicide, and robbery, finding that homicide rate changes were positively correlated with divorce rates and negatively correlated with unemployment in the short term. Meanwhile, Hale and Sabbagh (1991) did not find a long-term cointegration relationship between unemployment and crime rates in crime data from England and Wales, proposing alternative models. Subsequent studies employed various econometric techniques to analyze the relationships between crime and economic variables.
Dhiri et al. (1999) examined the long-term relationship between personal consumption expenditure, young male population, and crime opportunities. Saridakis (2004) analyzed whether harsher punishments and improved economic opportunities reduce violent crime. Using Johansen cointegration tests, the study found that serious crime (GBH) was positively correlated with unemployment and poverty levels, whereas no significant long-term relationships were found for crimes such as rape and assault.
More recent studies have investigated crime–unemployment relationships across different countries. Tang (2009) confirmed a long-term relationship between crime, unemployment, and inflation in Malaysia. Phillips and Land (2012) conducted a multilevel analysis of unemployment and crime across 400 U.S. counties. Fallahi et al. (2012) analyzed the relationship between unemployment and crime stability in the U.S. using ARCH and ARDL models, finding that unemployment volatility affects crime rates in the short term. Furthermore, Maddah (2013) conducted a structural VAR analysis in Iran, reporting that unemployment had a greater impact on crime rates than income inequality. Janko and Popli (2015) used a panel error correction model in Canada, finding no long-term motivation effect but confirming a short-term opportunity effect.
Costantini et al. (2018) found that income inequality and unemployment increased crime rates in the U.S., while law enforcement intensity suppressed property crimes. Recent studies have focused on analyzing crime dynamics in specific countries and regions. Nordin and Almén (2017) found that long-term unemployment significantly impacted violent crime in Sweden. Ojo et al. (2021) confirmed that unemployment increased crime rates in Nigeria using an ARDL model.
Coccia et al. (2024) identified a positive correlation between unemployment and homicide rates across 38 European countries, while Mkonza and Zungu (2024) found that youth unemployment was a major driver of violent crime in South Africa. These studies have advanced the economic approach to crime, highlighting that the impact of unemployment on crime varies depending on crime type and national economic structures. In particular, the differing effects of motivation and opportunity across crime types underscore the importance of employing diverse econometric methodologies in crime analysis.
These findings have been reinforced by Atmadi et al. (2024), who disaggregated crime types and found that law enforcement and economic effects vary depending on crime characteristics in Indonesia. Britto et al. (2022) provided micro-level causal evidence on the effect of job loss on crime in Brazil, further supporting the relevance of the motivation effect in transitional economies. In addition, Lucas (2024) employed monthly time-series models in the U.S. and found differential short- and long-term effects of inflation and unemployment on specific crime categories. Wang and Hu (2021) emphasized the inclusion of institutional quality and demographic variables when modeling crime determinants in China, particularly income inequality and urbanization. Saputra and Widodo (2023), studying Indonesia, confirmed the importance of poverty and inequality in shaping property crime patterns, advocating for socioeconomic variables in modeling frameworks.

Methodological Issues

Time-series data are the most critical and commonly used data structure for studying factors influencing crime; panel and cross-sectional data are also available. Levitt (2001) described national-level time-series data as “a blunt instrument for answering criminological questions”. This assertion stems from several limitations. First, time-series data are well-suited for studying macroeconomic variables like economic growth and inflation, but crime rates and their influencing factors often reflect local variations that national-level data cannot capture. As a result, time-series data fail to account for location-specific differences in crime modeling. Second, compared to panel or cross-sectional data, time-series data typically involve smaller sample sizes, limiting the number of explanatory variables that can be included in the model. Consequently, the estimated parameters may reflect only correlations between explanatory and dependent variables rather than causal relationships. For coefficients to be interpreted causally, all potential factors influencing crime must be included in the equation, which is challenging due to the limited degrees of freedom in time-series data. Third, as suggested by Cantor and Land (1985), researchers are often interested in separately evaluating the opportunity and motivation effects through which unemployment may influence crime. However, using national-level time-series data may not be robust enough for such analyses.
Despite its limitations, time-series data and associated methodologies remain valuable tools for studying the relationships between crime rates and influencing factors. Many studies have utilized time-series data to examine these relationships; however, a significant challenge lies in fully capturing the opposing characteristics of the motivation and opportunity effects. The motivation effect suggests that rising unemployment increases the incentive to engage in illegal activities due to reduced legitimate income opportunities, whereas the opportunity effect posits that unemployment reduces opportunities for crime by limiting access to potential targets or resources. Disentangling these effects and determining the net long-term impact of unemployment on crime remain major challenges in criminological research. To address these challenges, advanced methodologies like long-term cointegration models and error correction models (ECM) have been identified as effective tools.
Cointegration models enable the identification of stable, long-term relationships between variables, allowing researchers to assess whether the net effect of unemployment on crime is positive, negative, or insignificant. ECM integrates short-term fluctuations with long-term equilibrium relationships, making it particularly suitable for time-series data with its inherent complexities. In our study, we aim to use national-level time-series data from Mongolia to investigate the relationship between unemployment and crime, as well as the deterrent effect of law enforcement. Examining both the long-term and short-term effects of unemployment and law enforcement on crime is crucial for understanding their dynamic interactions. This approach is expected to provide a more nuanced and detailed understanding of the relationships between unemployment, crime, and law enforcement, contributing valuable insights to both research and policy development.

3. Data and Methodology

3.1. Theoretical Basis of the Economic Model of Crime
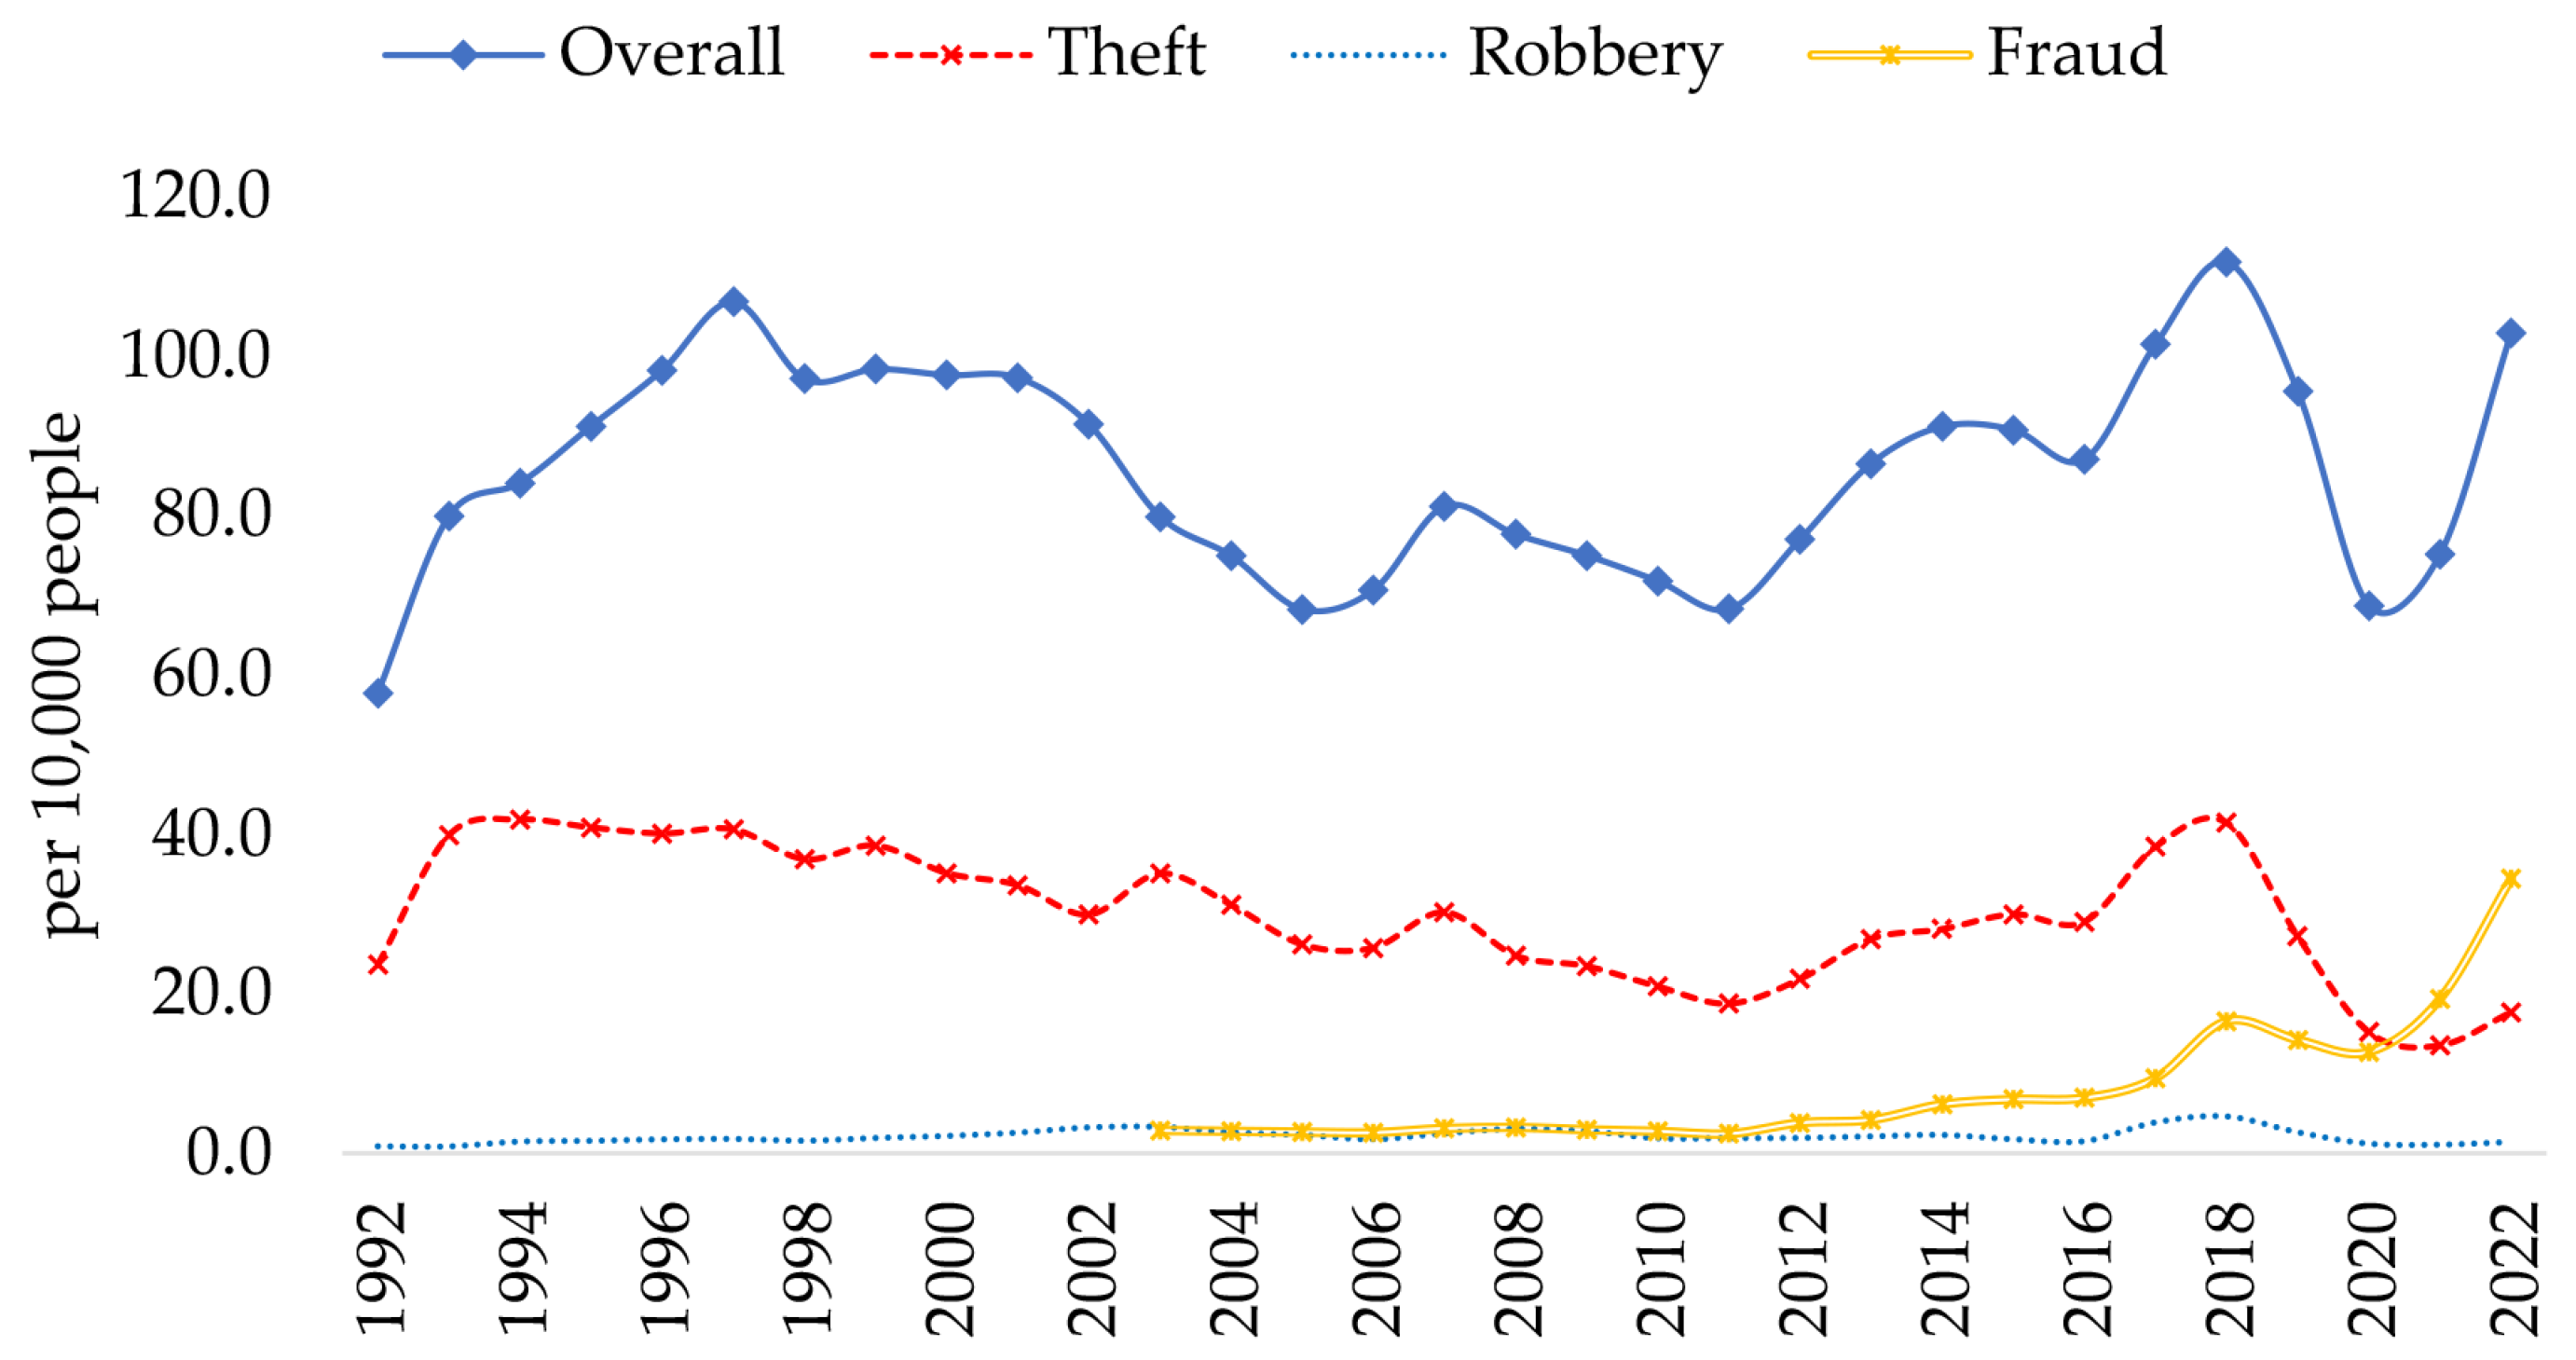
Becker (1968) proposed a model in which potential offenders are assumed to act rationally, aiming to maximize their expected utility from committing crimes. Thus, the number of crimes committed by an individual depends on the probability of apprehension and the severity of punishment. Specifically, an increase in either the probability of apprehension or the severity of punishment is expected to reduce an individual’s motivation to commit crimes. Based on the assumption that all individuals respond similarly to changes in law enforcement efforts, the overall supply of crime can be derived. Becker (1968) hypothesized that crime would decrease when either or both the probability of apprehension and the severity of punishment are high. Ehrlich (1973) developed a model in which individuals are assumed to freely allocate their time between legal and illegal activities while still aiming to maximize their expected utility.
Holding other factors constant, an increase in either the probability of apprehension or the severity of punishment reduces the relative return from illegal activities compared to legal activities, thereby decreasing an individual’s involvement in crime. Similarly, favorable opportunities in the legal labor market can reduce crime by making legal work more profitable compared to engaging in criminal activities. The unemployment rate is incorporated into an individual’s expected utility function as a measure of the risks associated with the legal labor market. On the one hand, a high unemployment rate reduces the opportunity cost of engaging in crime, thereby increasing an individual’s involvement in criminal activities. On the other hand, high unemployment increases the likelihood of an individual facing undesirable outcomes, such as being unemployed in the legal labor market or failing in legal activities. This increased risk may reduce an individual’s willingness to engage in crime. Therefore, Ehrlich (1973) suggested that the net effect of a high unemployment rate on crime is ambiguous. Based on the above theories, the following model can be formulated to explain crime.
C = Ψ ( P , F , U )
where the crime level C is modeled as a function of the probability of apprehension P, the severity of punishment F, and the unemployment rate U. Specifically, P is represented by the detection rate of crimes and F is represented by the number of incarcerated individuals per 1000 population. These two variables are expected to have a negative relationship with the crime rate C. Meanwhile, the effect of the unemployment rate U on crime is acknowledged as potentially ambiguous. It may not necessarily be positive or significant, and we await the empirical results to determine its actual impact.

3.2. Data

The study utilized data spanning 31 years, from 1992 to 2022. The dependent variables in the study include the overall crime rate and property-related crimes such as theft, robbery, and fraud. The key explanatory and control variables, along with their sources and expected signs, are summarized in Table 1. The dependent variables in the study include the overall crime rate and property-related crimes such as theft, robbery, and fraud. We focused on property-related crimes for specific reasons. Firstly, from a theoretical perspective, property-related crimes are expected to respond more strongly to the explanatory variables in our model. Becker (1968) and Ehrlich (1973) linked the economic models of crime to variables like the costs associated with crime, lost opportunities, and deterrence. They demonstrated that increased law enforcement efforts or higher penalties reduce the likelihood of committing crimes. Therefore, an increase in the detection rate and the severity of punishment discourages individuals from engaging in property crimes by raising the associated costs. Additionally, higher unemployment rates reduce the opportunity costs of property-related crimes, encouraging illegal activity. Conversely, lower unemployment levels discourage such crimes. Second, violent crimes may exhibit weaker direct correlations with these factors. This is because violent crimes are often driven by emotional or psychological motives rather than financial incentives.
Secondly, previous empirical studies indicate that property-related crimes are more often explained by economic variables compared to violent crimes. For example, spatial analyses of crime in England and Wales have shown that law enforcement and socio-economic factors significantly influence property crimes but have weaker associations with violent crimes (Han, 2010). This suggests that while socio-economic factors, such as law enforcement and unemployment, significantly influence property crimes, violent crimes tend to be more closely associated with non-economic motives or systemic issues. Furthermore, violent crimes, such as physical assaults or severe bodily harm, are more likely to correlate with law enforcement factors and socio-economic influences (Saridakis, 2004). However, crimes like sexual offenses and other severe violent crimes are less associated with economic variables over the long run, as demonstrated by the findings of Saridakis (2004). Based on these observations, this study focuses on analyzing the relationship between overall crime rates and property-related crimes while incorporating relevant explanatory factors.
The data on total registered crimes and property-related crimes, such as theft, robbery, and fraud, were obtained from the National Statistics Office’s (NSO) online database at www.1212.mn (accessed on 15 February 2024). For property-related crimes, data from 2003 onward were directly available online. However, for the period before 2003, data were extracted from annual statistical compendiums, where information on theft and robbery was found. Data on fraud-related crimes before 2003 were not available in the NSO’s online database or in Mongolia’s annual statistical compendiums, nor could they be retrieved from the General Police Department’s archives. This is because fraud-related crimes were not recorded as a separate category before 2003 and were instead classified under “other” crimes. As a result, the data for total registered crimes, theft, and robbery cover the period from 1992 to 2022, while fraud-related crimes are limited to 2003–2022. Nonetheless, the focus remains on theft, robbery, and fraud among property-related crimes.
Figure 1 shows the time trends of crime rates. The theft crime rate appears to fluctuate similarly to the overall crime rate. This is likely due to theft accounting for approximately 40% of total crimes up until 2002 and around 30% since 2003. The fraud crime rate was comparable to the robbery crime rate until 2011 and remained relatively lower than theft. However, it gradually increased after 2012, peaking in 2018. Between 2018 and 2020, the fraud crime rate remained stable but has sharply increased over the last three years.
The crime detection rate (calculated as the ratio of criminal cases prosecuted and suspects charged to the total number of cases filed for investigation, expressed as a percentage) is used as a proxy variable for the probability of arrest. It is expected to have a negative correlation with crime rates. Additionally, the number of incarcerated individuals per 1000 population is used as a proxy variable for the severity of punishment. According to crime theory, this variable is expected to have a deterrent and preventive effect, leading to a negative correlation with crime rates. The data for this variable were officially obtained from the General Authority for Court Decisions (GACD). One of the variables included in our analysis is the unemployment rate. Until 2008, the unemployment rate in Mongolia was calculated as the ratio of registered unemployed individuals at the Labor and Social Welfare Department to the economically active population. However, in line with the implementation of the Mongolian Government’s 2008–2012 Action Program, a goal to revise the definitions and methodologies for calculating labor statistics was set out in the plan of action. Based on Articles 12.3.4 and 12.3.7 of the Law on Statistics of Mongolia, a joint directive issued on 16 June 2009, the Chairperson of the National Statistics Office and the Minister of Social Welfare and Labor officially approved the “Methodology for Calculating Employment and Labor Force Statistics”. This methodology aligns labor statistics definitions and calculations with international standards issued by the International Labor Organization (ILO), while also incorporating the unique characteristics of Mongolia. Consequently, a methodological discrepancy exists between the years prior to and after 2008. To account for this inconsistency, it is necessary to include this effect in the model. From a theoretical perspective, the correlation between the unemployment rate and crime rates is complex and difficult to predict, as it involves both opportunity effects and motivation effects.

3.3. Econometric Methodology for Estimating the Economic Model of Crime

3.3.1. Testing the Stationarity of Time-Series Data

The stationarity of the variables, particularly the crime rate, is examined using the Augmented Dickey–Fuller (ADF) test (Dickey & Fuller, 1979). Specifically, the test is conducted using the following equation:
Δ C t = α 0 + γ C t 1 + α 1 t + i = 1 p θ i Δ C t i + u t
This equation incorporates lagged differences of the crime rate and focuses on the coefficient γ . If γ = 0 , the crime rate C follows a random walk process, indicating non-stationarity. Conversely, if γ < 0 , the crime rate is stationary at its level, represented as C t = C t 1 + u t . The ADF test is used to determine whether the variable is stationary, based on the methodology outlined by MacKinnon (1996). The decision on whether to include a trend term depends on whether the time series exhibits a clear trend. If the variable is found to be stationary (e.g., γ = 0 ), no further differencing is necessary. Otherwise, additional differencing is applied until stationarity is achieved, and the test is repeated. Once the stationarity condition is satisfied, the analysis proceeds to the next stage, such as cointegration testing.

3.3.2. Long-Run Relationships: Cointegration

In the late 1980s, Engle and Granger (1991) proposed a statistical technique to test for long-run relationships between two or more non-stationary variables, commonly known as the cointegration test (Hendry, 1986). If y t and x t are both non-stationary, their linear combination (the regression residuals) may yield a stationary series, as demonstrated by various studies. In other words, the regression of two random walks can produce residuals that are not random walks. Consider the following regression model:
y t = β 1 + β 2 x t + u t
The estimated regression function is expressed as
y t = β ^ 1 + β ^ 2 x t + u ^ t
Rearranging the residual term, we have
u ^ t = y t β ^ 1 β ^ 2 x t
In Equation (5), the residuals u ^ t represent the linear combination of y t and x t . If y t and x t are both non-stationary (i.e., I ( 1 ) ), but their residuals u ^ t are stationary, it indicates that y t and x t share a long-run equilibrium relationship. This is known as cointegration. Thus, if y t and x t are non-stationary variables but their residuals are stationary, y t and x t are said to be cointegrated.
Suppose that Equation (3) is extended to include k + 1 variables, assuming all variables are I ( 1 ) . The model can be represented as follows:
y t = β 1 + β 2 x 2 t + + β k x k t + u t
The estimated regression function is expressed as
y t = β ^ 1 + β ^ 2 x 2 t + + β ^ k x k t + u ^ t
Rearranging the residual term yields
u ^ t = y t β ^ 1 β ^ 2 x 2 t β ^ k x k t
If the residual u ^ t in Equation (8) is I ( 0 ) , the variables are considered to be cointegrated. This indicates that despite the individual variables being non-stationary random walks, their linear combination is stationary. Such cointegration represents a long-term relationship or equilibrium among the variables. The concept of cointegration allows us to test for long-run equilibrium relationships among time-series variables. It provides a framework to analyze relationships between non-stationary processes while avoiding spurious regression results. Cointegration is thus a critical tool for modeling long-run relationships, as it allows the inclusion of both stationary and non-stationary variables. In our study, we assume that the crime rate and its influencing factors exhibit cointegration. Based on this assumption, Equation (1), in the previous section, serves as the foundation for modeling the long-run dynamics of crime.
ln ( C r i m e t ) = β 0 + β 1 ln ( D e t e c t t ) + β 2 ln ( C u s t o t ) + β 3 ln ( U n e m p t ) + β 4 ln ( U n e m p t ) · D + u t
Here, C r i m e t represents the crime rate, D e t e c t t is the detection rate of crimes, C u s t o t denotes the number of incarcerated individuals per 1000 population, U n e m p t is the unemployment rate, and D is a dummy variable that reflects structural changes in unemployment trends (taking the value of 1 after 2009 and 0 otherwise). The residuals from Equation (9) can be expressed as follows:
u ^ t = ln ( C r i m e t ) β ^ 0 β ^ 1 ln ( D e t e c t t ) β ^ 2 ln ( C u s t o t ) β ^ 3 ln ( U n e m p t ) β ^ 4 ln ( U n e m p t ) · D

3.3.3. Cointegration Testing

Testing for cointegration involves assessing whether a set of variables share a long-term equilibrium relationship, even if they are individually non-stationary. Several methods are commonly used for cointegration testing. (1) Engle–Granger Two-Step Method (Engle & Granger, 1987): this method involves estimating the residuals from a regression of the dependent variable on the independent variables and testing for their stationarity. It is simple but may have limitations in cases with multiple variables. (2) Engle–Yoo Three-Step Method (Engle & Yoo, 1987): This is an extension of the Engle–Granger method and provides better estimates of cointegration relationships when dealing with more complex systems. (3) Johansen Method (Johansen, 1988; Johansen & Juselius, 1990): This method is the most robust and widely used for testing cointegration in systems with multiple variables. It can estimate the number of cointegrating vectors and is considered superior in cases involving more than two variables.
Despite the strengths of the Engle–Granger method, it has limitations, especially in analyzing multivariate systems. The Johansen method, which employs maximum likelihood estimation, is more appropriate and interpretable for assessing long-term relationships in such contexts. In this study, we apply the Johansen method to test for cointegration relationships among the crime rate and its influencing factors.
To test for cointegration using the Engle–Granger two-step method, the residuals from Equation (10) are evaluated for stationarity. The ADF test statistic is used for this purpose. In this case, the null hypothesis assumes that the residuals contain a unit root (non-stationary), while the alternative hypothesis assumes stationarity. If the ADF test statistic exceeds the critical value, the null hypothesis is rejected, indicating that the residuals are stationary. This suggests the existence of a cointegration relationship among the variables. The decision-making process follows the guidelines provided by Engle and Yoo (1987) and MacKinnon (1991). Once stationarity of the residuals is confirmed, it can be concluded that the variables are cointegrated.

3.3.4. Error Correction Model (ECM)

The error correction model (ECM) is explained using the logic of Granger’s representation theorem (Engle & Granger, 1991). This theorem states that if variables are cointegrated, there exists an error correction term that accounts for the adjustment toward long-run equilibrium. The ECM captures both the short-term dynamics and the long-term relationship (identified through cointegration) between the variables. For instance, consider the following model for two variables
Δ y t = α 1 + α 2 Δ x t γ ( y t 1 β 1 β 2 x t 1 ) + ϵ t
In Equation (11), the term γ ( y t 1 β 1 β 2 x t 1 ) is the error correction term (ECT). It represents the deviation from the long-term equilibrium identified by the cointegration relationship in Equation (3). The residuals of the regression in Equation (5) are used to estimate this term. The parameter γ measures the speed of adjustment back to equilibrium after a short-term deviation. If γ is significant, it confirms the presence of a meaningful error correction mechanism. Equation (11) includes all variables in their stationary form, making the ECM a reliable tool with which to analyse short-term dynamics while accounting for long-term relationships. Thus, the ECM serves as one of the most effective models for understanding the interplay between short-term fluctuations and long-term equilibrium.
Δ y t = α 1 + α 2 Δ x t γ Z t 1 + ϵ t
Equation (12) represents the error correction model, where Z t 1 = u t 1 is the error correction term derived from the residuals of Equation (3). This term reflects the extent of deviation from the long-term equilibrium relationship. Z t 1 captures the speed of adjustment as the system moves back towards equilibrium after a short-term deviation. Additionally, the dynamic interaction between Δ y t 1 and Δ x t 1 is also included in the model. For models with k + 1 variables, the error correction model can be extended as follows:
Δ y t = α 1 + α 2 Δ x 2 t + + α k Δ x k t γ Z t 1 + ϵ t
Here, Z t 1 remains the error correction term derived from the residuals of Equation (6), representing one-period-lagged deviations from equilibrium. In this context, the crime rate and other explanatory variables are modeled within a system that accounts for both short-term dynamics and long-term relationships. To capture the dynamics of various types of crime rates, an ECM approach is applied. Using the regression estimates from Equation (14), the ECM is evaluated to identify the interplay between short-term fluctuations and long-term equilibrium relationships for each type of crime.
Δ ln ( C r i m e t ) = α 0 + α 1 Δ ln ( C r i m e t 1 ) + α 2 Δ ln ( D e t e c t t ) + α 3 Δ ln ( C u s t o t ) + α 4 Δ ln ( U n e m p t ) + α 5 Δ ln ( U n e m p t ) · D + γ Z t 1 + ϵ t
Here, Z t 1 represents the long-term relationship captured by the error term from Equation (9), specifically the one-period lag of the residual, that is, Z t 1 = u ^ t 1 .
Z t 1 = u ^ t 1 = ln ( C r i m e t 1 ) β ^ 0 β ^ 1 ln ( D e t e c t t 1 ) β ^ 2 ln ( C u s t o t 1 ) β ^ 3 ln ( U n e m p t 1 ) β ^ 4 ln ( U n e m p t 1 ) · D
Equation (15) highlights several important aspects when evaluating the specified model. Firstly, the inclusion of an error correction mechanism in the model provides an advantage by incorporating equilibrium information into the short-term dynamics. The coefficients of the first-order differences of variables on the right-hand side of Equation (15) measure the immediate impact of changes in the detection rate, the number of incarcerated individuals, and the unemployment rate on crime. Thus, these coefficients represent short-term relationships. Secondly, the coefficient of Z t 1 serves as the adjustment speed of the error correction mechanism. This coefficient should be negative and significant, indicating that deviations from the equilibrium are corrected in the following period, thereby pulling the crime rate back toward long-term equilibrium. Lastly, the estimation of Equation (15) must satisfy several statistical assumptions. Specifically, the residuals should exhibit normality, no serial correlation, and homoscedasticity. These conditions are essential for ensuring the validity of the model. If these assumptions hold, the lagged term Δ ln ( C r i m e t 1 ) is incorporated into the analysis to capture persistence in changes in the crime rate. By meeting these requirements, the model effectively explains both short-term relationships and long-term dynamics, linking crime rates with their influencing factors over time.

4. Analysis and Results

4.1. Stationarity of Variables

In this section, we determined the integration order of the variables using tests. As shown in Table 2, the null hypothesis of the test, which assumes the presence of a unit root for all variables at their levels, could not be rejected. In other words, all variables were non-stationary at their levels. Therefore, the first differences of all variables were taken, and the tests were re-applied to determine whether they were stationary. After first differencing, the null hypothesis of a unit root was rejected at the 1% and 5% significance levels for all variables. This indicates that the variables became stationary after first differencing, and all variables were found to be integrated of order one, I ( 1 ) .

4.2. Cointegration Test Results

The Engle–Granger two-step procedure was applied to test for cointegration relationships among the variables. First, regression models were estimated using Ordinary Least Squares (OLS) for different crime types, and residuals were extracted. The stationarity of these residuals was then tested. As shown in Table 3, the residuals from the long-term equilibrium models for each type of crime rejected the null hypothesis of a unit root at the 1% level. This result confirms the presence of cointegration relationships among the variables.

4.3. Long-Run Equilibrium Relationships

Detection rates show a negative relationship with robbery. The coefficient for robbery is statistically significant at the 1% level, indicating that a 1 percentage point increase in detection rates reduces robbery rates by 1.7% (see Table 4). This result aligns with Levitt (1998), who found that higher arrest rates reduce crime through deterrence effects. Similarly, Saridakis (2004) observed that law enforcement efficiency influences violent crime trends in the United States, emphasizing the role of socioeconomic and demographic factors in crime prevention. In the context of Mongolia, detection rates appear particularly important in reducing crimes involving confrontation, such as robbery, where the immediate risk of arrest acts as a stronger deterrent. This highlights the critical importance of law enforcement policies targeting high-risk crimes. However, the weak or statistically insignificant coefficients for other crime types, such as fraud, suggest that detection rates may not uniformly influence all categories of crime. This finding aligns with Jawadi et al. (2019), who found that economically motivated crimes like fraud are more influenced by structural economic conditions and regulatory oversight than by direct law enforcement measures. This emphasizes that different crime types require tailored approaches. For instance, while detection rates may reduce violent crimes, fraud-related interventions should prioritize enhanced monitoring and regulatory frameworks. This result is also consistent with findings by Wang and Hu (2021), who emphasized the differentiated effects of enforcement policies across crime types in urban China. Atmadi et al. (2024) further demonstrated that regional differences in law enforcement capacity significantly shape the responsiveness of crime types to detection policies. This result is also consistent with findings by Wang and Hu (2021), who emphasized the differentiated effects of enforcement policies across crime types in urban China. Atmadi et al. (2024) further demonstrated that regional differences in law enforcement capacity significantly shape the responsiveness of crime types to detection policies.
Incarceration rates exhibit a significant negative relationship with fraud, with a 1% increase in incarceration rates reducing fraud by 1.78%. This result supports the hypothesis of Ehrlich (1973) that stricter penalties act as deterrents. It also echoes findings by Nagin (2013), who demonstrated that increased imprisonment reduces crimes with measurable economic motives. This finding underscores the need to view incarceration policies through the lens of crime type—premeditated crimes like fraud may be more sensitive to imprisonment policies compared to impulsive crimes. This observation mirrors Saputra and Widodo (2023), who found that crimes such as fraud are more influenced by institutional quality than by immediate punishment in Indonesia. The heterogeneous impact of incarceration across crime types also aligns with Coccia et al. (2024), who reported that violent crimes respond differently to punitive measures across 38 European countries.
However, the coefficients for theft and robbery are either weakly significant or insignificant. This may indicate that incarceration impacts crimes with delayed planning, such as fraud, more than impulsive crimes like robbery, which are less influenced by perceptions of punishment severity. Similar patterns were identified by Britt (1994), who found that incarceration had a limited deterrent effect on violent crimes compared to property crimes. Unemployment rates show a positive and statistically significant effect on theft before 2009, with a 1 percentage point increase in unemployment rates resulting in an 8.7% increase in theft rates. Before 2009, unemployment had a statistically significant positive effect on theft. Specifically, a 1 percentage point increase in the unemployment rate was associated with an approximately 9.09% increase in theft cases. This supports the motivation effect proposed by Cantor and Land (1985), which argues that unemployment increases the incentive for property crimes by reducing legal income opportunities. However, the absence of statistically significant effects on robbery or other crimes suggests that unemployment’s influence may vary significantly by crime type and socio-economic context.
In contrast, before 2009, unemployment exhibited a statistically significant negative effect on fraud. Specifically, a 1 percentage point increase in the unemployment rate was associated with an approximately 40.13% reduction in fraud rates. This finding aligns with studies such as Lucas (2024) and Jawadi et al. (2019), which suggest that economic downturns and high unemployment can reduce non-violent crimes like fraud due to fewer opportunities for financial offenses. Similarly, Costantini et al. (2018) argue that economic instability can constrain fraud-related activities, reinforcing the persistent negative effect of unemployment on fraud. Nordin and Almén (2017) similarly identified that long-term unemployment influenced violent crimes more than white-collar offenses in Sweden.
However, since 2009, when the unemployment rate began to be measured using a new methodology, its negative effect on fraud crimes has weakened by approximately 24.16 percentage points. Nevertheless, the effect remains negative. After 2009, the relationship between unemployment and crime weakened due to changes in unemployment measurement methodologies. This methodological shift, which stemmed from the introduction of international labor standards in Mongolia, may have caused discrepancies in data interpretation, further emphasizing the need for caution when comparing pre-2009 and post-2009 trends.

4.4. Short-Run Dynamics and Adjustment Effects

The results of the short-run model estimates (see Table 5) provide insights into the dynamic relationships between crime rates and economic and law enforcement factors. The findings indicate that detection rates have a statistically significant and negative impact on robbery, with a one percentage point increase in the detection rate leading to a 54.66% reduction in robbery rates. This result is consistent with studies such as Levitt (1998) and Cameron (1988), which emphasize that crimes involving direct confrontation, such as robbery, are more responsive to increased law enforcement efforts due to the heightened perceived risk of arrest. Recent work by Atmadi et al. (2024) also shows that regional disparities in policing efficacy contribute to differential crime responses in Indonesia, echoing this observed responsiveness in Mongolia.
However, detection rates do not show statistically significant effects on overall crime, theft, or fraud. The absence of a statistically significant relationship between detection rates and fraud is consistent with studies such as Costantini et al. (2018) and Jawadi et al. (2019), which suggest that fraud-related offenses may be more influenced by economic conditions and financial regulations rather than direct law enforcement measures. Similarly, Britt (1994) found that theft often reflects broader economic conditions rather than short-term fluctuations in law enforcement effectiveness. Similarly, Britt (1994) found that theft often reflects broader economic conditions rather than short-term fluctuations in law enforcement effectiveness. This reinforces the argument made by Wang and Hu (2021), who highlight the role of institutional and regulatory variables in shaping outcomes for economically motivated crimes.
Incarceration rates also demonstrate a deterrent effect, particularly for theft, with a 10% increase in incarceration rates leading to a 3.57% reduction in theft rates. This finding supports the hypothesis of Ehrlich (1973) that punitive measures can deter property crimes by increasing the perceived costs of offending. Comparable results were reported by Nagin (2013), who emphasized the role of imprisonment in deterring economic crimes. Saputra and Widodo (2023) showed that fraud prevention in transitional economies is more responsive to regulatory control than punitive escalation alone.
However, incarceration rates do not exhibit significant effects on robbery or fraud, suggesting that impulsive crimes like robbery may be more sensitive to immediate risks, such as detection. In contrast, premeditated crimes like fraud may require regulatory interventions rather than punitive measures. These findings are consistent with Britt (1994), who noted that the effectiveness of incarceration varies based on the type of crime. Unemployment, however, does not show statistically significant short-run effects on any type of crime, including theft and fraud. This result diverges from Cantor and Land (1985) motivation–opportunity framework, which posits that unemployment can increase property crimes by lowering opportunity costs and providing motivation for illegal activities. Instead, the findings align with the work of Lucas (2024) and Jawadi et al. (2019), which suggest that unemployment effects on crime may be more evident in the long term. A potential explanation lies in the buffering effects of informal employment and household structures, particularly in developing economies like Mongolia.
Lucas (2024) found that higher unemployment was associated with decreased crime, indicating that economic downturns might reduce opportunities for certain non-violent crimes. Similarly, Jawadi et al. (2019) demonstrated that economic recessions influence crime trends differently depending on the type of offense, reinforcing the importance of distinguishing between immediate and structural economic effects. The error correction term is statistically significant and negative across all models, confirming that deviations from long-run equilibrium are corrected over time. The adjustment speeds range from 48.4% to 60.1% per year, suggesting that the models effectively capture both short-term dynamics and long-term relationships. These findings align with Greenberg (2001), who reported similar adjustment rates for property crimes in the United States, and Costantini et al. (2018), who examined the role of economic instability in shaping crime trends. These adjustment speeds may reflect both strong institutional responsiveness and characteristics of national statistical reporting systems.
Their results suggest that crime adjustments occur rapidly in response to structural economic conditions, reinforcing the importance of considering long-term economic stability in crime prevention strategies. This suggests that Mongolia’s crime rates are responsive to economic and law enforcement factors, offering a practical basis for short-term interventions to address immediate crime concerns. Overall, the results underscore the importance of detection rates in reducing violent crimes like robbery and incarceration rates in addressing property crimes like theft. However, the lack of short-run effects from unemployment suggests that economic interventions may require longer time horizons to produce measurable impacts on crime. These findings emphasize the need for a balanced approach that combines law enforcement improvements with structural economic reforms to address both immediate and long-term drivers of crime. Importantly, these short-run effects are in line with Fallahi et al. (2012) and Janko and Popli (2015), who noted that crime responsiveness may remain hidden in short horizons but surface in cumulative dynamics captured in panel and structural models.
Compared to previous studies, this analysis highlights context-specific factors in Mongolia’s economic and legal environment while reinforcing broader theoretical frameworks regarding crime deterrence and prevention. To validate the reliability of the model estimates, diagnostic tests were conducted for normality, autocorrelation, and heteroskedasticity. All models passed the Jarque–Bera and LM tests. However, heteroskedasticity was detected in the theft model, for which robust standard errors were used in the final estimation. This ensures that the inferences drawn from the model are statistically sound.

5. Discussion and Conclusions

This study aimed to examine the relationship between property crimes, unemployment, and law enforcement efforts in Mongolia by employing time-series analysis. Using theoretical frameworks established by Becker (1968) and Ehrlich (1973), the analysis explored the effects of detection rates, incarceration rates, and unemployment on overall crime, theft, robbery, and fraud. The findings align with prior research while offering context-specific insights relevant to transition economies like Mongolia.
The results confirm that detection rates have a significant negative effect on robbery in the short run. Specifically, a one percentage point increase in detection rates reduces robbery by 54.66% in the short run. This finding supports those of Levitt (1998) and Cameron (1988), who emphasized the deterrent role of law enforcement in crimes involving direct confrontation. Detection rates, however, show no statistically significant impact on theft or fraud, suggesting that economically motivated crimes may respond more strongly to structural economic reforms than immediate policing efforts. This finding aligns with those of Costantini et al. (2018) and Jawadi et al. (2019), who suggest that fraud-related offenses are more influenced by economic conditions and financial regulations rather than direct law enforcement measures. Similarly, Britt (1994) found that property crimes like theft are less influenced by law enforcement visibility and more dependent on economic opportunities and regulatory systems. More recent studies such as Ojo et al. (2021) and Mkonza and Zungu (2024) further highlight that while law enforcement may deter violent crimes, property and economic crimes often respond better to economic stability and governance reforms.
The findings also indicate that incarceration rates have a statistically significant effect on theft, with a 10% increase in incarceration rates reducing theft by 3.57%. This aligns with the findings of Ehrlich (1973) and Nagin (2013), who emphasized the role of imprisonment as both a deterrent and an incapacitated tool. However, incarceration rates do not significantly impact robbery or fraud, underscoring the idea that those crimes requiring planning, such as fraud, may be less sensitive to punitive measures and instead influenced by regulatory frameworks. Meanwhile, impulsive crimes like robbery appear more responsive to immediate risks, such as detection probabilities, rather than incarceration rates. Nordin and Almén (2017) also argue that incarceration can serve as a deterrent in certain socio-institutional contexts, but its effectiveness varies depending on the type and motivation behind the crime.
Unemployment rates show mixed effects. In the long run, unemployment had a significant positive impact on theft before 2009, supporting the motivation effect proposed by Cantor and Land (1985), which suggests that unemployment increases property crimes by lowering opportunity costs. However, this relationship weakened after 2009, potentially due to changes in unemployment measurement methodologies or broader economic transitions. This shift aligns with findings from Lucas (2024) and Jawadi et al. (2019), who suggest that long-term unemployment trends play a more significant role in shaping crime patterns, particularly in economies where structural changes influence labor markets.
In contrast, the short-run estimates found no statistically significant relationship between unemployment and any crime type. This result suggests that unemployment may exert its influence through structural vulnerabilities rather than immediate economic disruptions. Similarly, Britt (1994) and Costantini et al. (2018) found that short-term economic fluctuations often fail to translate into immediate changes in crime rates due to the buffering effects of social safety nets and broader labor market structures. Coccia et al. (2024) similarly report that structural labor market imbalances significantly affect violent and property crime in Europe, suggesting that macroeconomic uncertainty reinforces long-run criminal incentives.
The error correction terms across all models were statistically significant and negative, indicating that deviations from long-run equilibrium are corrected quickly, with adjustment speeds ranging from 48.4% to 60.1% per year. These results echo those of Greenberg (2001) and Costantini et al. (2018), who reported similar adjustment rates and demonstrate that Mongolia’s crime patterns are highly responsive to policy interventions. The rapid adjustment suggests that policies targeting law enforcement effectiveness and economic stability can yield measurable outcomes within a relatively short time frame. The findings reinforce the notion that law enforcement improvements play a critical role in addressing crimes like robbery, which respond strongly to detection rates. Meanwhile, property crimes such as theft appear more sensitive to economic conditions and require long-term structural reforms. Fraud, on the other hand, does not respond significantly to either detection or incarceration rates, implying the need for regulatory oversight and financial monitoring systems to address its root causes.
From a policy perspective, the results highlight the need for a balanced approach that combines short-term deterrence measures with long-term economic strategies. Strengthening law enforcement through improved detection capabilities and increased incarceration may be effective in reducing certain crimes, particularly robbery and theft, in the short term. However, these approaches come with financial and social costs, including administrative expenses and the economic marginalization of offenders post-incarceration. Future policies should, therefore, complement enforcement strategies with initiatives that address employment creation, poverty reduction, and skills training programs to reduce crime sustainably.
In addition, the findings underscore the importance of addressing data-related challenges. Changes in unemployment measurement methodologies after 2009 may have influenced the observed weakening of unemployment’s effect on theft. Future studies could refine these estimates by using higher-frequency data, regional-level analyses, or panel data models to better capture local variations and structural breaks. Micro-level data, including household income, education levels, and social welfare participation, could also provide deeper insights into individual motivations for criminal behavior.
While this study is among the first to empirically examine the relationship between economic factors and crime in Mongolia, it has certain limitations. First, structural changes in Mongolia’s criminal law, including amendments in 2002 and 2017, may have influenced crime trends. Although dummy variables were included to capture some of these effects, more detailed modeling of policy shifts may improve future analyses. Second, the reliance on national-level data may mask regional variations, which could be addressed through subnational studies. Finally, the lack of short-term unemployment effects suggests the need for further exploration of informal employment and seasonal labor patterns, which may buffer economic shocks in the short run.
In conclusion, this study highlights the significance of integrating law enforcement improvements with economic reforms to address both short- and long-term drivers of crime in Mongolia. The findings support the theories of Becker (1968) and Ehrlich (1973), while providing new evidence from a transition economy. Effective crime prevention strategies should balance enforcement efforts with policies aimed at improving employment opportunities and income equality. Future research should continue to explore these relationships using more granular data and alternative econometric approaches to refine policy recommendations further.

Author Contributions

Conceptualization, D.G., E.J. (Enkhbayar Jamsranjav), Y.-R.K. and E.J. (Erdenechuluun Jargalsaikhan); methodology, D.G.; software, D.G.; validation, D.G., E.J. (Enkhbayar Jamsranjav), Y.-R.K. and E.J. (Erdenechuluun Jargalsaikhan); formal analysis, D.G.; investigation, D.G.; data curation, D.G. and E.J. (Erdenechuluun Jargalsaikhan); writing—original draft preparation, D.G.; writing—review and editing, D.G., E.J. (Enkhbayar Jamsranjav), Y.-R.K. and E.J. (Erdenechuluun Jargalsaikhan); supervision, E.J. (Enkhbayar Jamsranjav) and Y.-R.K. All authors have read and agreed to the published version of the manuscript.

Funding

This research received no external funding.

Institutional Review Board Statement

Not applicable.

Informed Consent Statement

Not applicable.

Data Availability Statement

The data used in this study were compiled from multiple publicly available sources and partially processed by the authors. Processed datasets are available from the corresponding author upon reasonable request.

Acknowledgments

The authors would like to express their sincere gratitude to the Mongolian Society of Criminologists, its leadership, and staff members for their valuable support in facilitating official access to crime-related statistical data from relevant institutions.

Conflicts of Interest

The authors declare no conflict of interest.

References

  1. Atmadi, A., Tarigan, N. R., Negara, I. P. A. B. P. C. N., Syalaisa, N., & Ismail, M. I. A. (2024). Linear mixed model approach: The effect of poor people & unemployment rate on various types of crime in 34 provinces in Indonesia. International Journal of Applied Mathematics, Sciences, and Technology for National Defense, 2(1), 37–48. [Google Scholar] [CrossRef]
  2. Becker, G. S. (1968). Crime and punishment: An economic approach. Journal of Political Economy, 76(2), 169–217. [Google Scholar] [CrossRef]
  3. Britt, C. L. (1994). Crime and unemployment among youths in the United States, 1958–1990. American Journal of Economics and Sociology, 53(1), 99–109. [Google Scholar] [CrossRef]
  4. Britto, D. G. C., Pinotti, P., & Sampaio, B. (2022). The effect of job loss and unemployment insurance on crime in Brazil. Econometrica, 90(4), 1393–1423. [Google Scholar] [CrossRef]
  5. Buonanno, P., & Montolio, D. (2008). Identifying the socio-economic and demographic determinants of crime across Spanish provinces. International Review of Law and Economics, 28(2), 89–97. [Google Scholar] [CrossRef]
  6. Cameron, S. (1988). The economics of crime deterrence: A survey of theory and evidence. Kyklos, 41(2), 301–323. [Google Scholar] [CrossRef]
  7. Cantor, D., & Land, K. C. (1985). Unemployment and crime rates in the post-world War II United States: A theoretical and empirical analysis. American Sociological Review, 50(3), 317–332. [Google Scholar] [CrossRef]
  8. Coccia, M., Cohn, E. G., & Kakar, S. (2024). How immigration, level of unemployment, and income inequality affect crime in Europe. Crime, Law and Social Change, 1, 1–23. [Google Scholar] [CrossRef]
  9. Costantini, M., Meco, I., & Paradiso, A. (2018). Do inequality, unemployment and deterrence affect crime over the long run? Regional Studies, 52(4), 558–571. [Google Scholar] [CrossRef]
  10. Dhiri, S., Brand, S., Harries, R., & Price, R. (1999). Modelling and predicting property crime trends in england and wales. Home Office. [Google Scholar] [CrossRef]
  11. Dickey, D. A., & Fuller, W. A. (1979). Distribution of the estimators for autoregressive time series with a unit root. Journal of the American Statistical Association, 74(366a), 427–431. [Google Scholar] [CrossRef]
  12. Ehrlich, I. (1973). Participation in illegitimate activities: A theoretical and empirical investigation. Journal of Political Economy, 81(3), 521–565. [Google Scholar] [CrossRef]
  13. Engle, R. F., & Granger, C. W. J. (1987). Cointegration and error correction: Representation, estimation, and testing. Econometrica, 55(2), 251–276. [Google Scholar] [CrossRef]
  14. Engle, R. F., & Granger, C. W. J. (Eds.). (1991). Long-run economic relationships: Readings in cointegration. Oxford University Press. [Google Scholar]
  15. Engle, R. F., & Yoo, B. S. (1987). Forecasting and testing in co-integrated systems. Journal of Econometrics, 35(1), 143–159. [Google Scholar] [CrossRef]
  16. Fallahi, F., Pourtaghi, H., & Rodríguez, G. (2012). The unemployment rate, unemployment volatility, and crime. International Journal of Social Economics, 39(6), 440–448. [Google Scholar] [CrossRef]
  17. Greenberg, D. F. (2001). Time series analysis of crime rates. Journal of Quantitative Criminology, 17(4), 291–327. [Google Scholar] [CrossRef]
  18. Hale, C., & Sabbagh, D. (1991). Testing the relationship between unemployment and crime: A methodological comment and empirical analysis using time series data from england and wales. Journal of Research in Crime and Delinquency, 28(4), 400–417. [Google Scholar] [CrossRef]
  19. Han, L. (2010). Economic analyses of crime in england and wales [Doctoral dissertation, University of Birmingham]. [Google Scholar]
  20. Hendry, D. F. (1986). Econometric modelling with cointegrated variables: An overview. Oxford Bulletin of Economics and Statistics, 48(3), 201–212. [Google Scholar] [CrossRef]
  21. Janko, Z., & Popli, G. (2015). Examining the link between crime and unemployment: A time-series analysis for Canada. Applied Economics, 47(37), 4007–4019. [Google Scholar] [CrossRef]
  22. Jawadi, F., Mallick, S. K., Cheffou, A. I., & Augustine, A. (2019). Does unemployment matter for crime? New evidence from europe and the United States. Economic Modelling, 81, 381–397. [Google Scholar] [CrossRef]
  23. Johansen, S. (1988). Statistical analysis of cointegration vectors. Journal of Economic Dynamics and Control, 12(2–3), 231–254. [Google Scholar] [CrossRef]
  24. Johansen, S., & Juselius, K. (1990). Maximum likelihood estimation and inference on cointegration—With applications to the demand for money. Oxford Bulletin of Economics and Statistics, 52, 169–210. [Google Scholar] [CrossRef]
  25. Levitt, S. D. (1998). Why do increased arrest rates appear to reduce crime: Deterrence, incapacitation, or measurement error? Economic Inquiry, 36(3), 353–372. [Google Scholar] [CrossRef]
  26. Levitt, S. D. (2001). Alternative strategies for identifying the link between unemployment and crime. Journal of Quantitative Criminology, 17, 377–390. [Google Scholar] [CrossRef]
  27. Lucas, H. (2024). Crime, inflation, & unemployment in american cities: A time series analysis [Master’s thesis, Tarleton State University]. [Google Scholar]
  28. MacKinnon, J. G. (1991). Critical values for cointegration tests. In R. F. Engle, & C. W. J. Granger (Eds.), Long-run economic relationships: Readings in cointegration (pp. 267–276). Oxford University Press. [Google Scholar]
  29. MacKinnon, J. G. (1996). Numerical distribution functions for unit root and cointegration tests. Journal of Applied Econometrics, 11(6), 601–618. [Google Scholar] [CrossRef]
  30. Maddah, M. (2013). The effect of unemployment and income inequality on crimes: A time series analysis. International Journal of Economics Research, 4(2), 37–42. [Google Scholar]
  31. Mkonza, Z. B., & Zungu, L. T. (2024). Investigating the dynamic impact of socioeconomic issues on crimes: A comparison of newly democratized countries. Preprints. [Google Scholar] [CrossRef]
  32. Nagin, D. S. (2013). Deterrence in the twenty-first century. Crime and Justice, 42(1), 199–263. [Google Scholar] [CrossRef]
  33. Nordin, M., & Almén, D. (2017). Long-term unemployment and crime: Evidence from Sweden. Empirical Economics, 53(2), 367–389. [Google Scholar] [CrossRef]
  34. Ojo, T. J., Omojuwa, O., & Oludare, K. M. (2021). Unemployment and crime rate nexus: An empirical evidence from Nigeria. Journal of Economics and Policy Analysis, 6(2), 45–66. [Google Scholar]
  35. Phillips, J., & Land, K. C. (2012). The link between unemployment and crime rate fluctuations: An analysis at the county, state, and national levels. Social Science Research, 41(3), 681–694. [Google Scholar] [CrossRef] [PubMed]
  36. Saputra, S. A., & Widodo, W. (2023). The impact of poverty, economic inequality, and unemployment on crime rates in Central Java Province from 2000 to 2021. Journal of Economic Education, 12(1), 113–124. Available online: https://journal.unnes.ac.id/sju/index.php/jeec/article/view/74064 (accessed on 15 December 2024).
  37. Saridakis, G. (2004). Violent crime in the united states of America: A time-series analysis between 1960–2000. European Journal of Law and Economics, 18(3), 203–221. [Google Scholar] [CrossRef]
  38. Tang, C. F. (2009). The linkages among inflation, unemployment and crime rates in Malaysia. International Journal of Economics and Management, 3(1), 50–61. [Google Scholar]
  39. Wang, X., & Hu, S. (2021). Analysis of the relationship between unemployment and crime rate in China. In Proceedings of the 2021 international conference on social development and media communication (SDMC 2021) (Vol. 631, pp. 665–670). Atlantis Press. [Google Scholar] [CrossRef]
Figure 1. Crime rates in Mongolia, 1992–2022. Source: Authors’ computation using data from the National Statistical Office.
Economies 13 00160 g001
Table 1. Variables and data.
VariablesDescriptionSourceExpected Sign
DependentCrime: Crime rates measured as incidents per 10,000 peopleNSO
Theft: Incidents of theft per 10,000 peopleNSO
Robbery: Incidents of robbery per 10,000 peopleNSO
Fraud: Incidents of fraud per 10,000 peopleNSO
IndependentDetec: Probability of arrest measured by detection rateGPD(−)
Custo: Number of incarcerated individuals per 1000 peopleGACD(−)
Unemp: Unemployment rateNSO(+) or (−)
Note: “+” indicates a positive expected relationship; “−” indicates a negative expected relationship.
Table 2. Stationarity of variables.
Test Statistics at LevelTest Statistics at First Difference
ln(Crime)−2.26−2.93 **
ln(Theft)−2.75−4.54 **
ln(Robbery)−0.68−5.84 **
ln(Fraud)1.34−2.42 *
ln(Detect)−2.53−6.06 **
Custom−2.24−5.77 **
Unemp−2.59−6.83 **
Note: ** 1% and * 5% significance levels.
Table 3. Stationarity test results of regression residuals for cointegration.
Dependent VariableResiduals Test Statistic
ln(Crime)−3.30 **
ln(Theft)−3.01 **
ln(Robbery)−4.15 **
ln(Fraud)−4.05 **
Note: ** 1% significance levels.
Table 4. Long-run equilibrium estimation.
Dependent var.ln(Crime)ln(Theft)ln(Robbery)ln(Fraud)
Const4.647 **3.519 **2.121 **4.205 **
(0.208)(0.325)(0.426)(0.662)
Detec−0.002−0.006−0.017 **0.0007
(0.002)(0.004)(0.005)(0.0067)
ln(Custo)−0.174−0.0310.303−1.778 **
(0.117)(0.183)(0.239)(0.285)
Unemp0.0210.087 **−0.073 +−0.513 *
(0.019)(0.030)(0.040)(0.192)
Unemp · D−0.024−0.087 **0.0100.339 *
(0.015)(0.023)(0.030)(0.133)
R-squared0.1920.4300.4250.841
Obs. number31313120
Note: ** 1% and * 5% significance levels. + denotes 10% level.
Table 5. Estimation of the short-term model.
Dep. Variables Δ ln(Crime) Δ ln(Theft) Δ ln(Robbery) Δ ln(Fraud)
Const0.005−0.0080.0020.108
(0.020)[0.031](0.050)(0.055)
Δ ln(Crime)t−1−0.453 *
(0.207)
Δ ln(Theft)t−1 0.547 *
[0.254]
Δ (Detec)−0.0008−0.002−0.791 **0.001
(0.0019)[0.005](0.238)(0.004)
Δ ln(Custo)−0.184−0.357 *0.100−0.406
(0.128)[0.169](0.296)(0.285)
Δ (Unemp)−0.0010.021−0.3910.160
(0.0237)[0.020](0.350)(0.457)
Δ (Unemp) · D−0.008−0.0340.449−0.205
(0.025)[0.024](0.371)(0.457)
Z t 1 −0.484 **−0.487 **−0.584 *−0.601 *
(0.158)[0.186](0.233)(0.224)
R-squared0.3730.4000.5040.403
Obs. number29292819
Jarque-Bera test stat0.2921.0961.6430.861
LM test stat1.8050.3580.6260.560
Heteroskedasticity test stat1.7783.093 *1.1440.959
Note: ** 1% and * 5% significance levels. Robust standard errors are reported in square brackets.
Disclaimer/Publisher’s Note: The statements, opinions and data contained in all publications are solely those of the individual author(s) and contributor(s) and not of MDPI and/or the editor(s). MDPI and/or the editor(s) disclaim responsibility for any injury to people or property resulting from any ideas, methods, instructions or products referred to in the content.

