1. Introduction
The 2023 Central Financial Work Conference emphasized the need to effectively address the “five major tasks” of financial sector reform, including science and technology finance. As a policy agenda aligned with the development of China’s modern industrial system and the advancement of new forms of productive forces, science and technology finance traces its origins back to “technology loans” in 1985. Its policy value lies in establishing an efficient and smooth financing mechanism between financial capital and technological assets. The core principle is to ensure a reasonable and fair distribution of risks and returns throughout the technological innovation process, thereby stimulating innovation vitality, advancing scientific and technological progress, and promoting economic development. However, the coherence, diversity, and complexity of scientific and technological innovation activities, coupled with the broad applicability and flexibility of financial instruments, pose numerous challenges to the formulation and implementation of science and technology finance policies.
An index system for measuring the development level of science and technology finance can multi-dimensionally reflect the current characteristics and evolution trends of science and technology finance in a country or region. Scholars such as
Fang (
2015) have put forward a series of theoretical viewpoints and operational measures regarding the essential connotation and policy evolution of science and technology finance. They further point out that the essence of science and technology finance is a new economic paradigm that promotes the deep integration and aggregation of innovative elements such as technological capital, innovation capital, and entrepreneurial capital. It consists of three closely interconnected subsystems: technology–economy, finance–economy, and entrepreneurship–economy. They also propose a reciprocal relationship among the stages of economic development, R&D investment intensity, and R&D structure, providing a basis for measuring the demand for science and technology finance within a regional scope. Empirical research by
Jie (
2020) and
Liu et al. (
2020) indicate that science and technology finance significantly promotes regional high-quality development, but heterogeneous science and technology finance services have differentiated intermediary effects on high-quality development, with public science and technology finance exhibiting a complete intermediary effect, while market-based science and technology finance demonstrates an incomplete intermediary effect.
Xu (
2022) and
Su (
2024) argue that the allocation of science and technology financial resources significantly promotes high-quality economic development. Spatial interaction effects reveal that science and technology finance has a significant negative spatial spillover effect on total factor productivity (TFP). The allocation of science and technology financial resources, through the transformation of scientific and technological achievements, forces the adjustment of industrial structure, accelerates the industrialization process, optimizes the allocation of factor resources, and thus significantly enhances TFP.
Geng et al. (
2023) and
Jiang (
2023) emphasize the role of finance as a key force driving technological innovation and industrial development. To better facilitate technological innovation, it is essential to promote the mutual promotion and empowerment of science and technology and finance, thereby accelerating the formation of new forms of productive forces.
Cao and Peng (
2024) empirically investigate the innovation spillover effects of science and technology finance policies and their spillover channels. The results show that science and technology finance pilot programs significantly enhance the innovation level of suppliers in non-pilot regions through two channels: knowledge spillover and demand pull, transmitted from clients to suppliers.
In terms of index measurement,
Z. J. Zhou et al. (
2022),
Corrado and Corrado (
2017) employed the input–output method to evaluate regional science and technology finance efficiency, elucidating the characteristics of uneven development in China’s regional science and technology finance levels.
Alam et al. (
2019) and
Wang et al. (
2021) conducted an empirical analysis of financing behavior for R&D investment in emerging markets using the generalized method of moments, examining the impact of differences between allied and non-allied firms, as well as national financial systems, on corporate financing behavior. Chinese scholar
Zou et al. (
2025), based on the theory of financial intermediation and a multi-level science and technology financial service system, constructed a multi-dimensional comprehensive index system that includes public science and technology finance and market-based science and technology finance. Their measurement results indicate that China’s science and technology finance development index has shown a steady growth trend, with public and market-based science and technology finance advancing in tandem. The development index exhibits characteristics of a spiky, right-skewed, and heavy-tailed distribution with multiple peaks, a gradient decrease and diffusion pattern across eastern, central, and western regions, and an evolutionary pattern of “faster development in the south than in the north” along with uneven development towards higher levels.
J. L. Li and Zhou (
2024) adopted a combined approach of subjective and objective weighting to measure China’s science and technology finance development level index. The results revealed overall convergence, spatial agglomeration, and spatial heterogeneity in the development levels of China’s regional science and technology finance.
Lei et al. (
2024) developed a comprehensive evaluation index system comprising five dimensions—finance and innovation environment, science and technology finance input, financing environment for technology enterprises, regional science and technology output, and science and technology finance profitability—calculated via the entropy method.
Hu and Liu (
2022) measured science and technology finance efficiency using the super-efficiency SBM model, employed the Dagum Gini coefficient to dissect the spatial differences in science and technology finance efficiency, used Kernel density to examine spatial evolution trends, and revealed spatial correlation through the calculation of Moran’s I.
K. Zhou and Guo (
2019) used the composite entropy method to measure the basic index, input index, output index, and contribution index of science and technology finance in six central provinces and conducted a dynamic assessment of the regional distribution of these indices.
Overall, current academic studies on science-technology finance (STFI) primarily focus on macro-level systemic frameworks, integrating credit/capital/insurance markets through a traditional lens. However, data limitations constrain analytical depth, manifesting two key gaps: (1) Fragmented perspectives isolate financial development from broader socio-ecological contexts, with narrow policy-finance definitions obscuring ecosystemic interactions and yielding biased STFI assessments. (2) Existing metrics fail to capture the reciprocal evolution between financial innovation and technological progress, neglecting financial resource clustering effects and index internal coherence, thereby limiting analytical applicability. This study advocates for multidimensional frameworks bridging financial, technological, and societal dimensions to advance STFI theory and measurement.
This study investigates the reform of China’s science and technology finance (STFI) system in the context of developing new quality-driven productive forces. Building on the theoretical framework of “technology–economy–finance–entrepreneurship” symbiosis, we redefine STFI as an innovation-driven economic paradigm that systematically integrates technological, financial, and social capital through policy-institutional coordination across the “basic research–technology commercialization–industrial application” chain. This conceptualization extends beyond traditional financial instrument approaches by incorporating public service capabilities and institutional optimization as critical catalytic elements.
To address methodological shortcomings, this study introduces two key innovations: First, a multidimensional “finance–technology–society” index is constructed using hierarchical entropy weighting, with the innovative inclusion of regional public service capacity as a critical institutional dimension. This extends beyond traditional economic indicators, capturing systemic disparities across Chinese provinces. Second, analytical rigor is enhanced by integrating dynamic panel models with Dagum Gini decomposition to quantify spatiotemporal heterogeneity, while panel VAR modeling elucidates long-term innovation feedback loops. Theoretically, the study quantifies how institutional differentials mediate resource allocation efficiency within China’s innovation ecosystem. Methodologically, the shift from static cross-sectional analysis to dynamic evolutionary modeling with temporal-spatial interaction metrics provides superior explanatory power. Empirically, the findings reveal paradoxical trends between aggregate STFI growth and innovation output divergence, supporting differentiated governance strategies. However, several limitations remain: (1) Potential endogeneity concerns in entropy weighting calculations may bias the significance of dimensions; (2) Data availability constraints limited indicator selection, particularly excluding micro-level firm innovation dynamics and qualitative institutional factors, which could introduce omitted variable bias; (3) Provincial aggregation obscures significant sub-regional variations in technology adoption rates. Future research should incorporate mixed-methods approaches, combining big data analytics with qualitative case studies to fully capture the complexity of STFI evolution.
The remainder of this paper is structured as follows.
Section 1 introduces the research context and policy significance, followed by a comprehensive literature review that synthesizes existing theories and empirical gaps in STFI studies.
Section 2 details the entropy-based methodology for constructing the STFI, including indicator selection criteria and dimensional frameworks. Spatiotemporal trends and regional disparities of the composite index are analyzed in
Section 3, while
Section 4 employs the Dagum Gini coefficient to quantify inter-provincial heterogeneity.
Section 5 explores causal mechanisms through fixed-effects regression and panel vector autoregression models, examining how capital investment intensity and market development drive innovation efficiency. Policy implications and recommendations are discussed in
Section 6.
2. Mechanism of the Impact of Regional Public Service Disparities on Science and Technology Finance
As a crucial link in the synergy between government and market, the collaborative mechanism between public service capabilities and finance plays a decisive role in the allocation pattern and flow of innovation funds within a region, profoundly influencing enterprises’ funding shortages and the vibrancy of their investment decisions (
Z. B. Li et al., 2022). It is generally believed that the supply conditions of regional public resources enhance the intensity and efficiency of science and technology finance investment by creating an external environment conducive to the aggregation of innovation elements and leveraging “generalized reciprocity” (
Zhu et al., 2023). Specifically, advanced research facilities, high-quality educational resources, abundant data reserves, and efficient public services within a region can significantly attract key innovation elements such as innovative talents, funds, and technologies to cluster in specific areas, providing a sustained source of power for technological innovation and industrial upgrading and offering room for science and technology finance investment to exert its effects.
Meanwhile, optimized allocation strategies for public resources play a significant role in improving the utilization efficiency of innovation elements. By implementing refined resource allocation and sharing mechanisms, the maximized utilization of innovation elements within the region can be ensured, effectively avoiding resource waste and redundant construction. This reduces innovation costs while promoting deep collaboration and integration among innovation elements, forming a powerful synergistic force for innovation. Furthermore, sustained investment in and innovation upgrades of public resources are key factors in stimulating the vitality and creativity of innovation elements. The continuous improvement of regional infrastructure and hardware resources, the optimization of the policy environment, and the cultivation of an innovative culture lay a solid foundation for the sustained prosperity of innovation activities, contributing to the formation of a more open, inclusive, and dynamic innovation ecosystem.
The balanced distribution of public resources also has a significant impact on the balanced agglomeration of innovation elements. When resources are unevenly allocated across a region, innovation elements may become excessively concentrated in certain areas, leaving others relatively scarce. This uneven distribution is not conducive to the coordinated development of the regional economy and may hinder the smooth flow and cooperation of innovation elements. Therefore, the balanced allocation and distribution of public resources are intrinsic requirements for the balanced agglomeration and harmonious development of innovation elements within the region.
From the perspective of the layered network structure characteristics of technological innovation, newly added science and technology finance investments tend to establish connections with nodes that already have more connections within the network, exhibiting a behavior trait of “preferential attachment” (
Pham et al., 2021). This manifests as key elements such as funds, resources, and technologies being more inclined to flow to regions or research institutions that already possess a good resource base, extensive cooperation networks, and significant influence. Due to their central position in the innovation network, these entities can often more effectively absorb and utilize new financial investments, promoting technological innovation, knowledge diffusion, and industrial upgrading. The “preferential attachment” of science and technology finance stems from the broader information channels and stronger information processing capabilities typically possessed by nodes with numerous established connections, enabling them to identify and seize new investment opportunities more quickly based on their information advantage and reduce information asymmetry and disperse investment risks through multi-partner collaborations.
As the number of new connections within the network grows, the value and influence of science and technology finance in the network also increase, thereby more effectively integrating internal and external resources, fostering cross-domain collaboration, attracting additional resource inflows and capital, and ultimately establishing a positive feedback loop. Nevertheless, the “preferential attachment” characteristic inherent in science and technology finance further intensifies the non-uniformity of capital distribution. This provides a theoretical foundation for optimizing the network environment, promoting equitable competition, and reinforcing policy support for underdeveloped regions.
3. Index Construction
To address the challenge of collinearity in indicator selection, this study adopts the entropy method over alternative approaches such as AHP and DEA due to its significant advantages in managing correlated variables. The entropy method calculates objective weights based on the information entropy principle, which quantifies the degree of disorder or variability within each indicator’s data distribution. This process inherently accounts for inter-indicator relationships by assigning higher weights to indicators with greater discriminatory power, thereby reducing redundancy caused by collinear variables. In contrast, AHP relies on subjective pairwise comparisons that may amplify collinearity effects through potentially biased judgment matrices, especially when evaluating multiple interrelated dimensions. While DEA avoids subjective weighting, it does not inherently address collinearity issues and may produce unstable efficiency frontiers when input/output variables exhibit strong correlations. The entropy method’s data-driven normalization process effectively mitigates these limitations by focusing on the relative information contribution of each indicator, ensuring robust composite index construction even in the presence of multicollinearity. This methodological choice aligns with best practices in composite indicator development, where collinearity diagnostics and objective weighting are crucial for valid empirical analysis.
3.1. Fundamental Principles
3.1.1. Diversification of Financial Investment
Technology finance exhibits a diverse nature to cater to the financing needs of heterogeneous innovation entities (
Tian & Xu, 2024). In practical applications of technology finance, based on the differences in the attributes of investing entities, investment sources can be broadly categorized into three types: (i) Market-oriented capital investments, such as venture capital, technology loans, and technology insurance, which are dually regulated by the development levels of both the capital market and regional finance, and constitute the primary targets of government technology finance policies; (ii) Policy-based financial investments from the government, including various fiscal expenditures specific to technology, loans from policy-based financial institutions, and tax expenditures (
Zhang, 2024). Government policy-based financial investments and market-oriented capital investments demonstrate certain differences and complementarities in their target entities and effectiveness (
Xie & Cai, 2025),
Isaksson et al. (
2016). Additionally, in existing research on technology finance, relatively few scholars have focused on the third type of investment, namely, endogenous corporate funding based on free cash flow. Despite its limited scale, this type of funding can reduce corporate dependence on the external environment, enhance corporate risk resistance, mitigate internal incentive and moral hazard issues, thereby enabling companies to allocate funds more flexibly, increase investments in early-stage R&D, and form an organic connection with exogenous financing.
3.1.2. Innovation Efficiency Orientation
Innovation efficiency is a key indicator for measuring the effectiveness of technology finance development. Technology finance accelerates the process of technological innovation and promotes industrial upgrading and economic growth through financial means (
Zhong et al., 2021). Emphasizing innovation efficiency orientation implies that indicator design should focus on how financial resources precisely and efficiently support technological innovation activities, ensuring that resources flow to areas with the greatest innovation potential and market prospects. Simultaneously, the efficiency-oriented principle helps reveal the rationality of resource allocation, identify potential resource allocation issues by assessing the input–output ratio of innovation activities, and provide a policy basis for optimizing resource allocation strategies. It is evident that innovation efficiency bridges effective communication between technology finance investment, government guidance policies, and corporate innovation willingness, serving as the foundation for “generalized reciprocity” among different entities in technology finance.
3.1.3. Combination of Market Drive and Public Service Provision
Although technology finance is often understood as a product defined within a policy context, its contingency character confirms that it cannot develop independently of the capital market. In other words, the driving force generated by the self-improvement and development of the capital market constitutes the primary impetus for the formation and development of technology finance, rather than the reverse. Therefore, constructing a capital market indicator system from a broader perspective aids in theoretically clarifying the drivers of technology finance, thereby providing a basis for seeking policy guidance intervention points. As China’s capital market integration deepens, the dynamic effects of regional financial markets exert a direct influence on technology finance, effectively linking government policy guidance with the capital market (
Sheng et al., 2021). In the evolution of regional financial markets, public service provision offers spatial carriers and innovation element entities preferred by financial entities. Thus, this paper reinforces the integration concept of market drive and public service provision in indicator construction, ensuring that the indicators better align with the environmental behavioral characteristics of innovation activities.
3.2. Indicator Selection
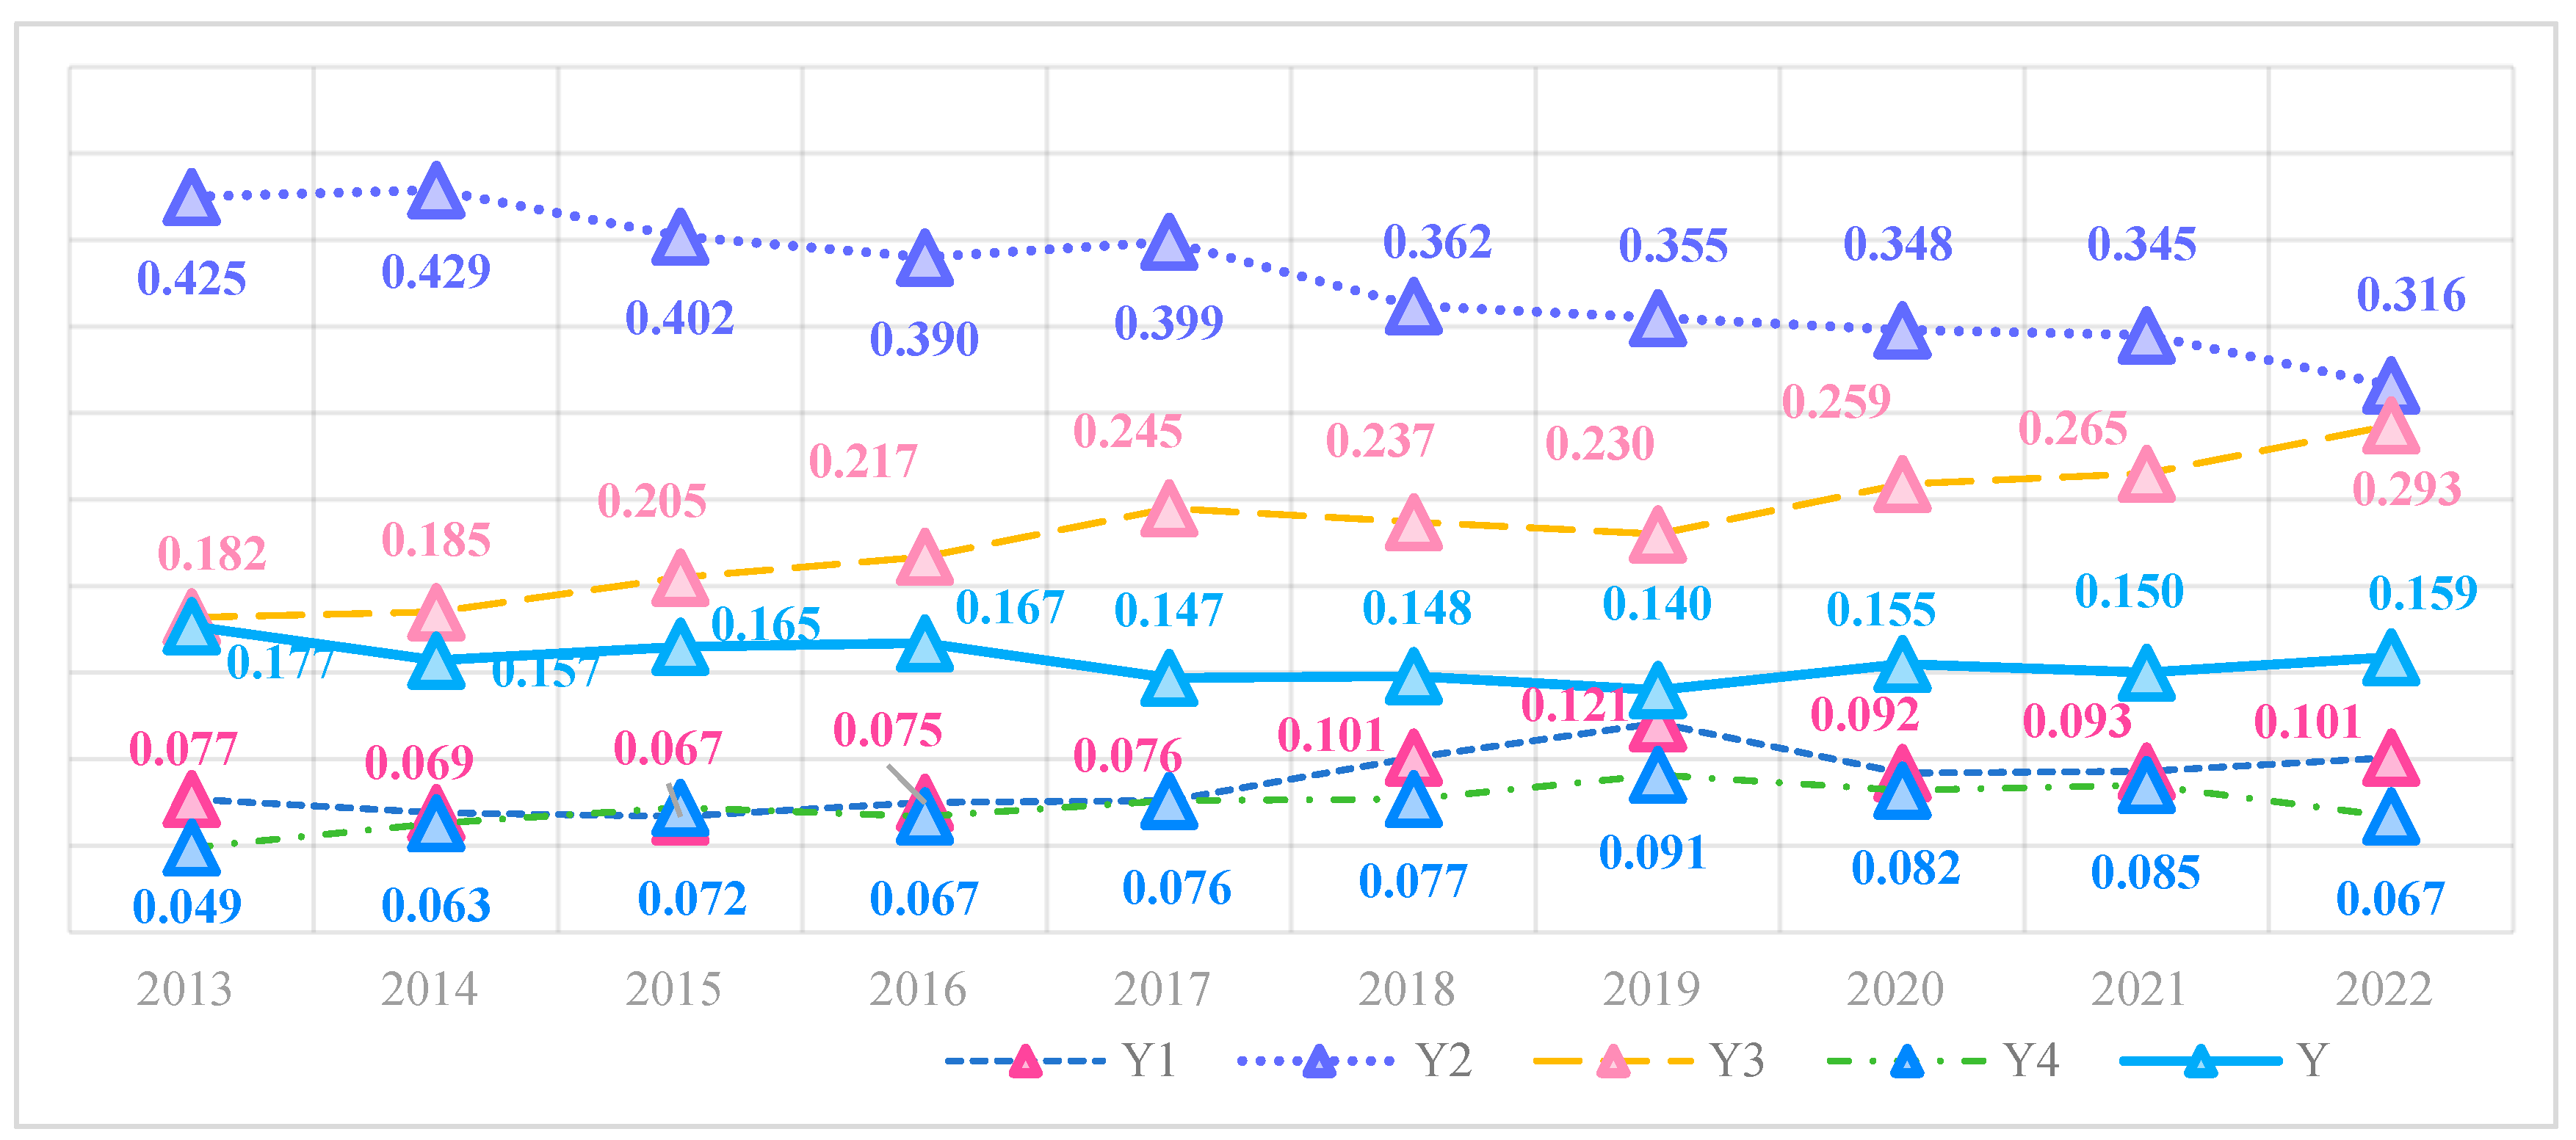
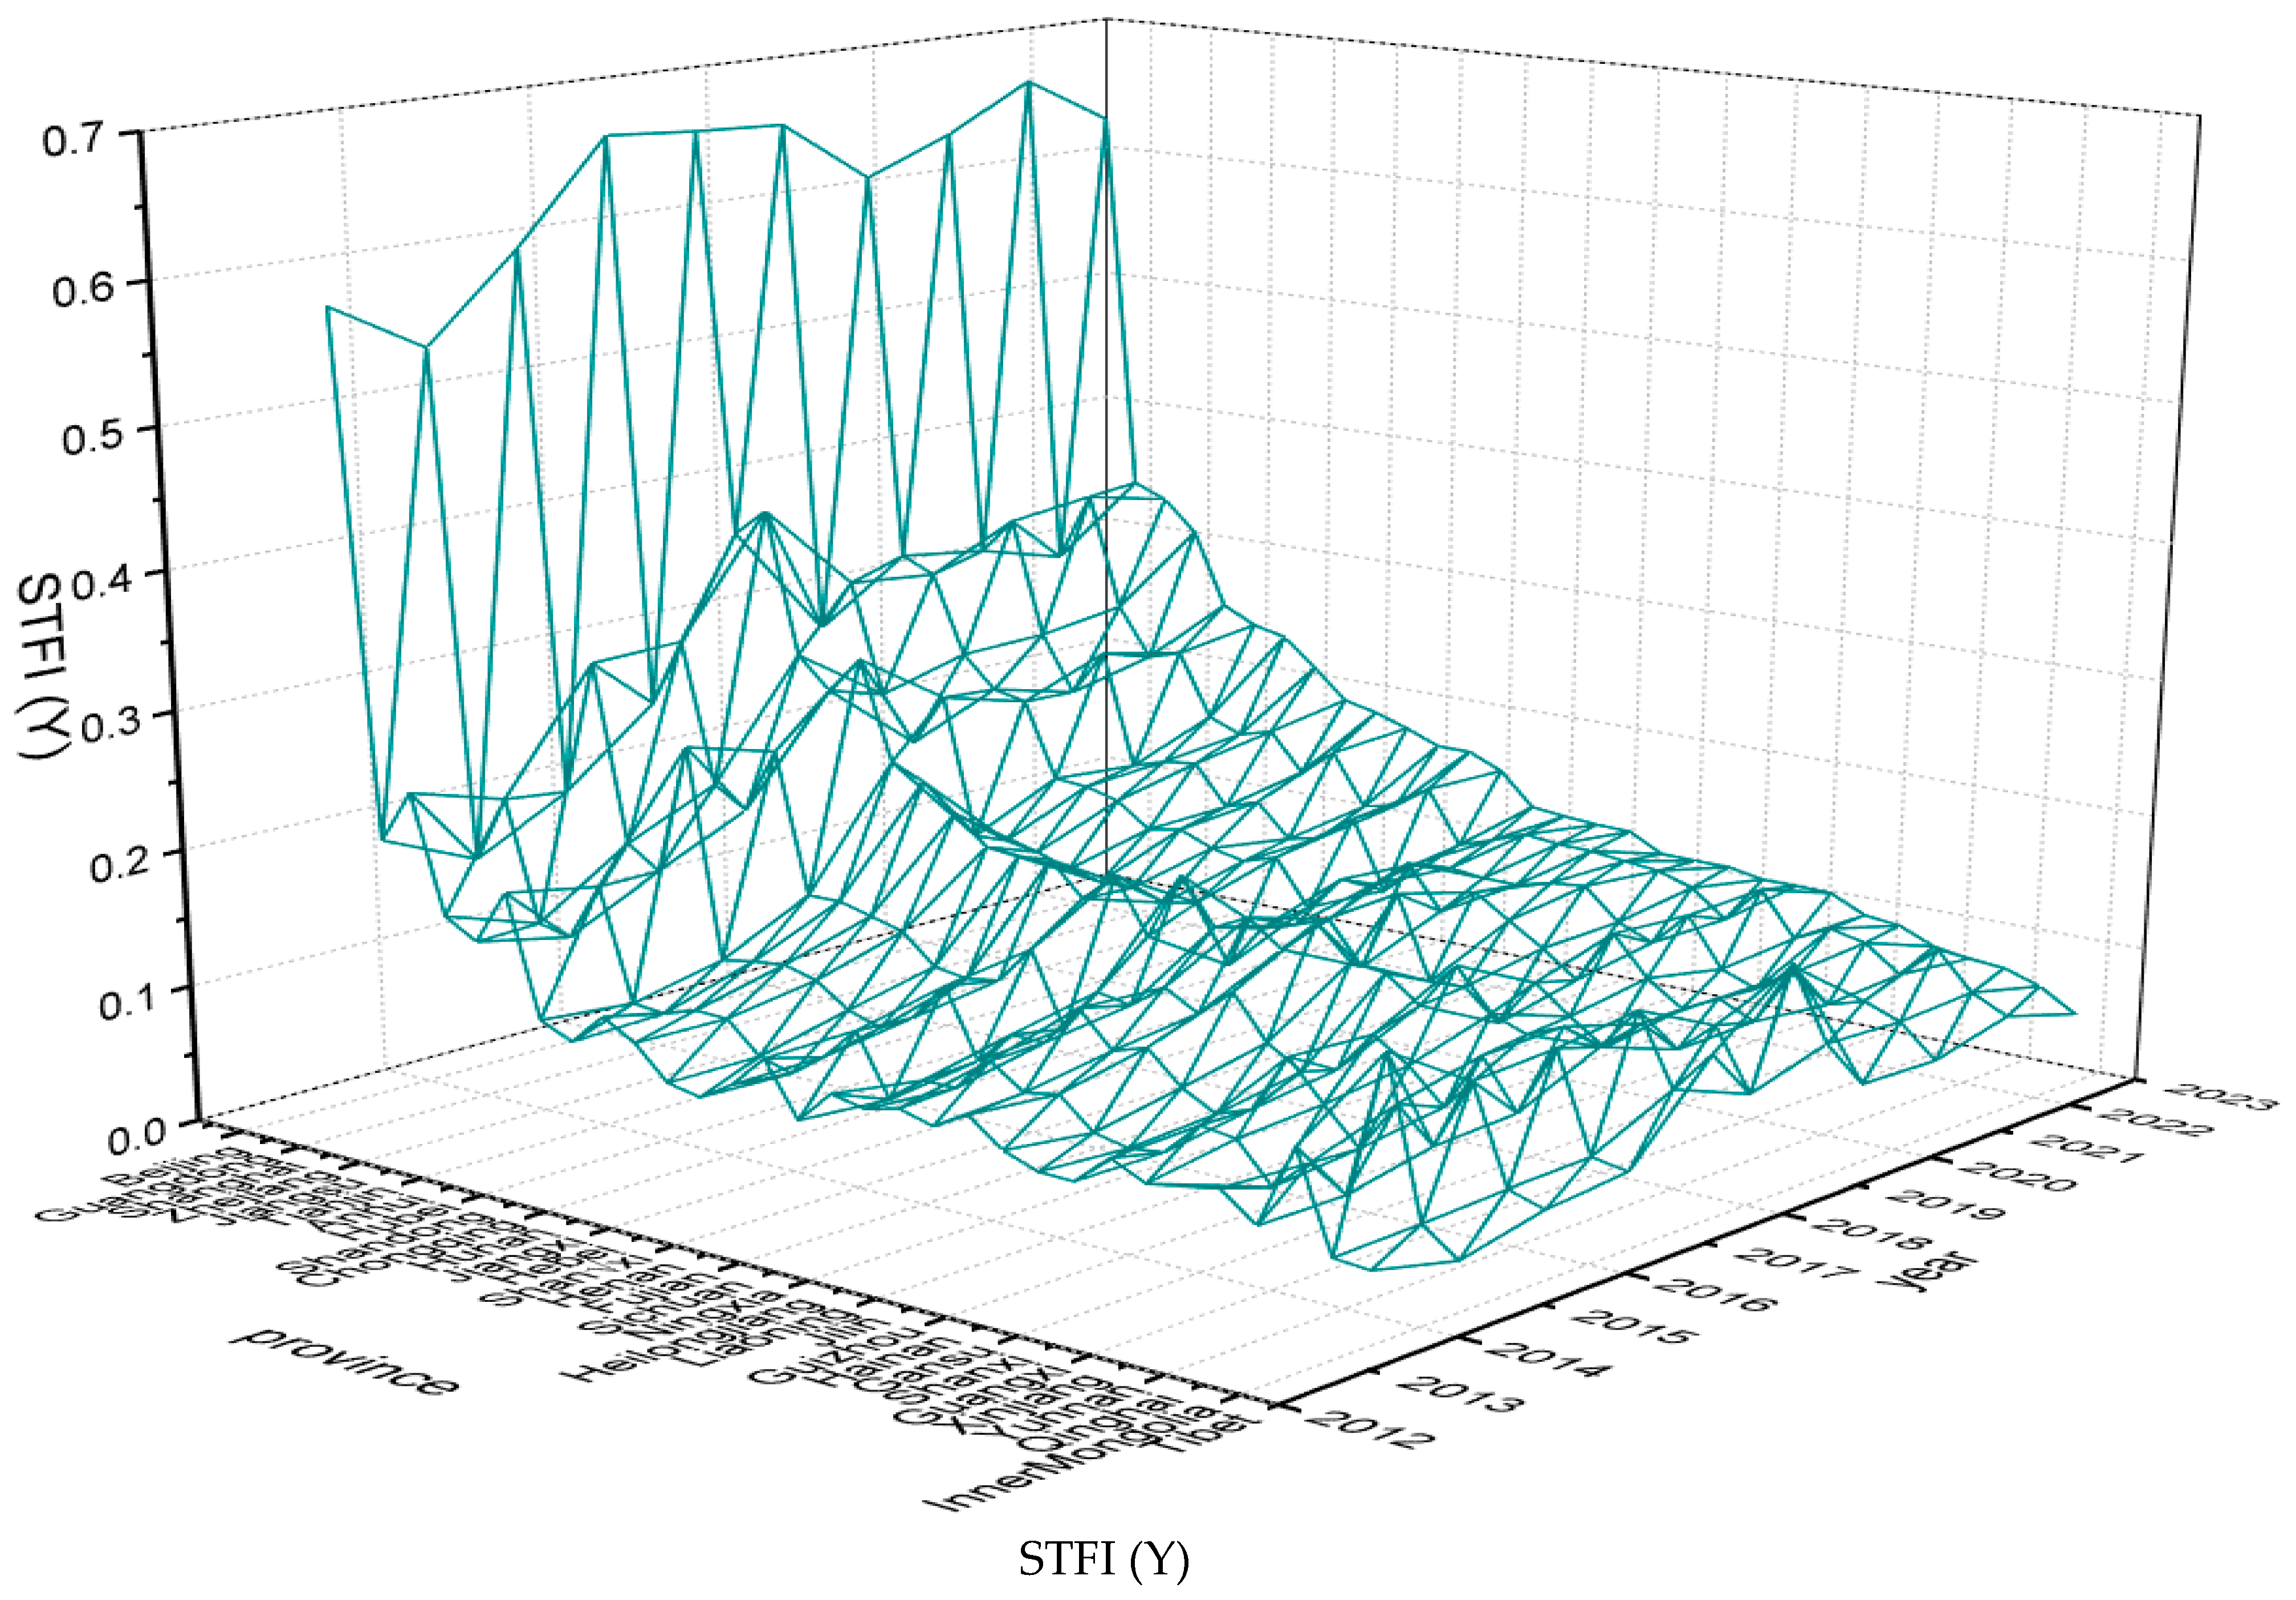
This paper constructs a technology finance index based on four dimensions: investment intensity, market development level, technological innovation efficiency, and social service capacity. Specifically:
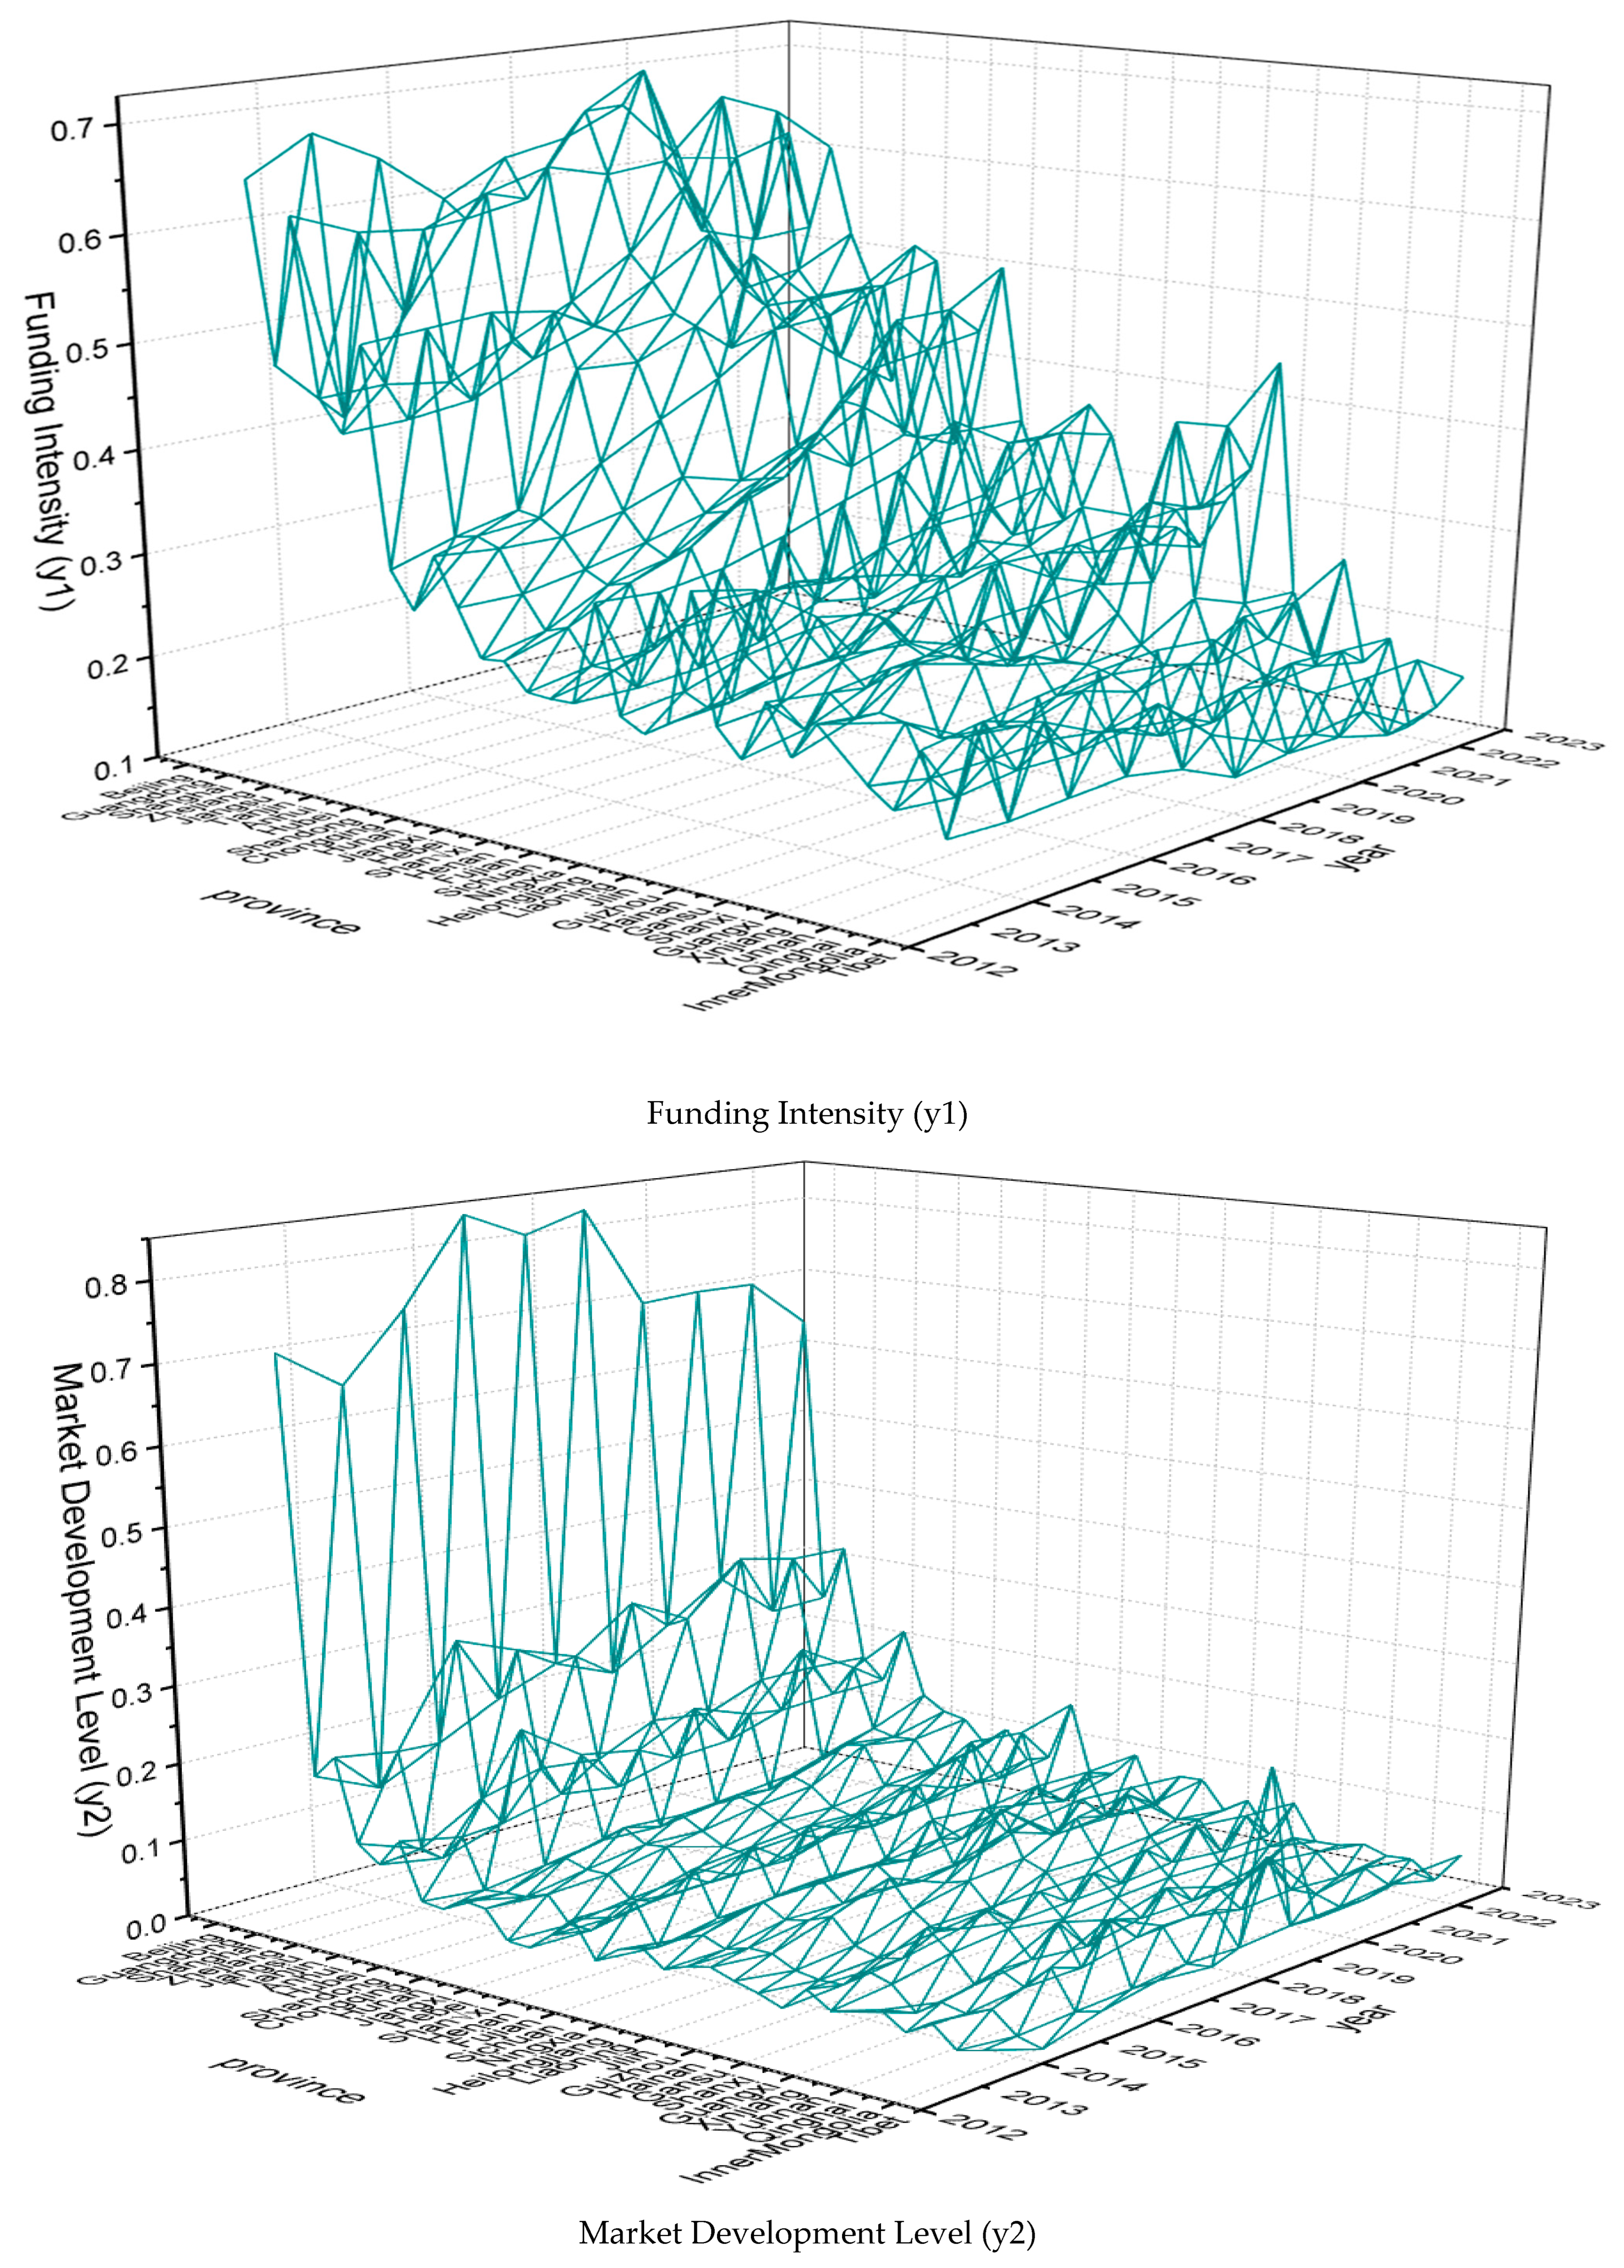
Investment Intensity (y1) is the foundation of technology finance development. Adequate funding supports technological innovation, promoting the research, development, and application of new technologies and products. The specific indicator design incorporates funding situations from multiple levels, including government, enterprises, financial institutions, and society, to reflect the funding supply conditions and liquidity of technology finance activities within a region.
Market Development Level (y2) focuses on measuring the activity and maturity of technology finance. A mature and active market provides more financing channels and investment opportunities for technological innovation. The indicator design specifically includes the development status of six sub-markets: financial markets, insurance markets, bond markets, capital markets, venture capital markets, and technology markets.
Technological Innovation Efficiency (y3) is the core driving force of technology finance development. Efficient technological innovation accelerates the application and popularization of new technologies and products, thereby enhancing the productivity and competitiveness of the entire society. In this study, technological innovation efficiency is assessed through five dimensions: output rate of innovation results, value conversion capability, corporate profitability, R&D activity level, and new product development rate.
Social Service Capacity (y4) is designed based on the principles of “generalized reciprocity” and “preference attachment”, encompassing six aspects: regional macro tax burden level, public service level, education expenditure intensity, ecological environment development level, and energy consumption per unit of GDP. This indicator reflects the interactive impact between technology finance activities and economic-social development, as well as improvements in people’s livelihoods.
The specific indicator design is presented in
Table 1.
3.3. Index Fitting
In this paper, a hierarchical synthesis method is employed to fit the final index. Specifically, the tertiary indicators are first used to fit the secondary indicators, which are then used to fit the final index. The entropy method is utilized to determine the weight coefficients of the indicators during the synthesis process. The specific steps are as follows:
Given that the units of measurement for various indicators across subsystems are not uniform, it is essential to eliminate these discrepancies prior to analysis by conducting interval or standardization processing on the data in order to address the homogeneity issue of the indicators. The initial data is standardized using the normalization method to unify the dimensions.
For positive indicators, the processing method is:
For negative indicators, the processing method is:
where
i represents the province,
j represents the year, and
k represents the indicator code.
denotes the initial value of the kth indicator for province
i in year
j, denotes the standardized value after normalization, while
and
denote the minimum and maximum values of the kth indicator for province
i over all years, respectively.
After the aforementioned processing, the initial data were standardized to the interval [0, 1]. The larger the positive indicators within this interval, the better, whereas the negative indicators behaved conversely.
Calculate the proportion of the
k indicator in Province
i on an annual basis, respectively, get
.
The entropy value of the third-level indicators to the second-level indicators
was calculated hierarchically by using the entropy value method in j years, get
.
where
. In this study,
i = 31,
k = 10, and the range of the entropy weight coefficient is adjusted to lie within the interval (0, 1).
The secondary indicators are constructed for each year j as follows:
with t ∈ {1,2,3,4} and when
t = 1,
k ∈ {1,2,3,4,5,6}; when
t = 2,
k ∈ {7,8,9,10,11,12}; when
t = 3,
k ∈ {13,14,15,16,17}; when
t = 4,
k ∈ {18,19,20,21,22}.
Calculate the weight coefficient
of the secondary indicator
year by year.
with the utility information
,
.
The final STFI Y is calculated separately for each year j:
Compared with other studies, this paper adopts an objective assignment method for indicator synthesis, which can reduce the subjective bias that may arise from manual weighting.


