Article

Assessing the Impact of IT, Trade Globalisation, and Economic Complexity on Carbon Emissions in BRICS Economies

1
Department of Economics and Commerce, Superior University Lahore, Lahore 54000, Pakistan
2
School of Economics and Management, North China Electric Power University, Changing, Beijing 102206, China
3
Faculty of Business and Management Sciences Department, Superior University Lahore, Lahore 54000, Pakistan
4
Sustainability Competence Centre, Széchenyi Istvàn University, 9026 Győr, Hungary
*
Author to whom correspondence should be addressed.
Economies 2025, 13(6), 153; https://doi.org/10.3390/economies13060153
Submission received: 24 April 2025 / Revised: 17 May 2025 / Accepted: 22 May 2025 / Published: 29 May 2025

Abstract

The escalating threat of climate change has placed carbon dioxide (CO2) emissions at the forefront of global environmental policy. The relationship between carbon dioxide (CO2) emissions and information technology (IT) is crucial in shaping international climate change strategies. This study investigates the impact of information technology, trade globalisation (TG), and economic complexity (EC) on CO2 emissions in BRICS countries using panel data from 1996 to 2018. The analysis applies the CUP-FM estimator to assess long-run relationships and the Dumitrescu–Hurlin panel causality test to evaluate directionality. The results show that information technology significantly reduces CO2 emissions. This effect is primarily driven by the promotion of the service sector, reduced material use, and improved energy efficiency. In contrast, trade globalisation has an inconsistent impact. While it can lower emissions through technology diffusion and efficiency gains, it can also increase them due to Scale Effects and the relocation of polluting industries. This study also identifies a U-shaped relationship between economic complexity and CO2 emissions, indicating that emissions initially rise with complexity but decline as innovation and clean production practices improve. These findings suggest that developing digital infrastructure and green technologies and trade Globalisation can promote sustainable development in BRICS economies. Therefore, policymakers should prioritise strengthening the IT environment, fostering international trade partnerships, and integrating clean technologies to balance economic growth with environmental protection.

1. Introduction

The increase in the concentration of CO2 in the atmosphere and the consequent climate change are still among the most significant problems of the contemporary world (Nunes, 2023). International initiatives like the 1997 Kyoto Protocol and the Paris Agreement also explain the global response to climate change, which aims to prevent the global average temperature from rising above the level of the pre-industrial revolution (Poulopoulos, 2016). Although there was relative stability in the CO2 emissions for a while, 2018 marked a spike as emissions rose by well over 2% (Adebayo et al., 2023). This chronic environmental issue requires an analysis of the causal factors of emissions, mainly in the emerging economy members of the BRICS bloc (Caglar et al., 2022). This research on carbon emission patterns must be completed because economic development, technological progress, and globalisation in industry determine carbon emissions (Mammadova et al., 2025; Raihan et al., 2022). The Figure 1 shows a significant rise in consumption-based carbon emissions among BRICS nations from 1990 to 2018, with China contributing the largest share.
China stands as the top BRICS country for CO2 emissions, thus solidifying its position to fight climate change (Koilakou et al., 2024). The substantial rise in energy usage and CO2 emissions resulting from China’s quick industrialisation and urbanisation makes the nation fundamental to observing how economic progress meets technological advancement with environmental sustainability (Bukhari et al., 2023; Zeraibi et al., 2024; Zhao et al., 2023). China’s massive investments in information technology and global trade expansion create dual effects on emission reduction by presenting challenges and possibilities (Roy & Vasa, 2025; H. Yu & Zhu, 2023; J. Yu et al., 2023).
The rise of information technology has resulted in the evolution from conventional goods to digitised services such as virtual conferences, banking operations, and shopping experiences, including online reading content (Pandey & Pal, 2020). Through digital transformation, electronic replacements of traditional products and services create positive environmental effects by cutting material usage and energy needs and decreasing transportation needs (R. Liu et al., 2019; Truong, 2022). In addition, improvements in IT have enhanced the transportation industry through the use of information delivery services, GPS, and traffic management software in the transport system to curb carbon emissions and energy uptake by optimising routes and avoiding traffic jams (Adebayo et al., 2023; Ahmed et al., 2023). As a dominating member of the BRICS group and a significant contributor to the world’s emission level, analysis of its strategies and results is crucial for the formation of efficient policies and practices that would ensure sustainable growth without further degradation of the environment (Udeagha & Ngepah, 2023; J. Zhang & Yasin, 2024).
The newly industrialised countries of Brazil, Russia, India, China, and South Africa are experiencing high growth rates of their economies and, consequently, an increase in energy consumption: the forecasted increase is 80% in the period up to 2040, and CO2 emissions may double compared with 2013 (IEA, 2020). Significant IT developments, particularly in developing countries such as India and China, show that the information technology divide between developed and developing or urban and rural communities is widening (Ahad & Imran, 2023; Awad, 2022). As these countries improve digital connectivity and reduce trade barriers, understanding the environmental impacts of increased IT spending and digitisation is crucial for sustainable development (Martínez et al., 2022). The analysis relies on data that ended in 2009, hindering their relevance in present-day policymaking (Awad, 2022; Zeeshan Zafar et al., 2023). Experts Kartal and Pata (2023) suggest utilising the trade globalisation (TG) index as the current advancement because it combines factual trade with legislative and tariff aspects, thus delivering a more complete trade environmental assessment. The updated method provides an advanced understanding of the impact of IT, trade globalization, and economic complexity on CO2 emissions, in the BRICS context. The 
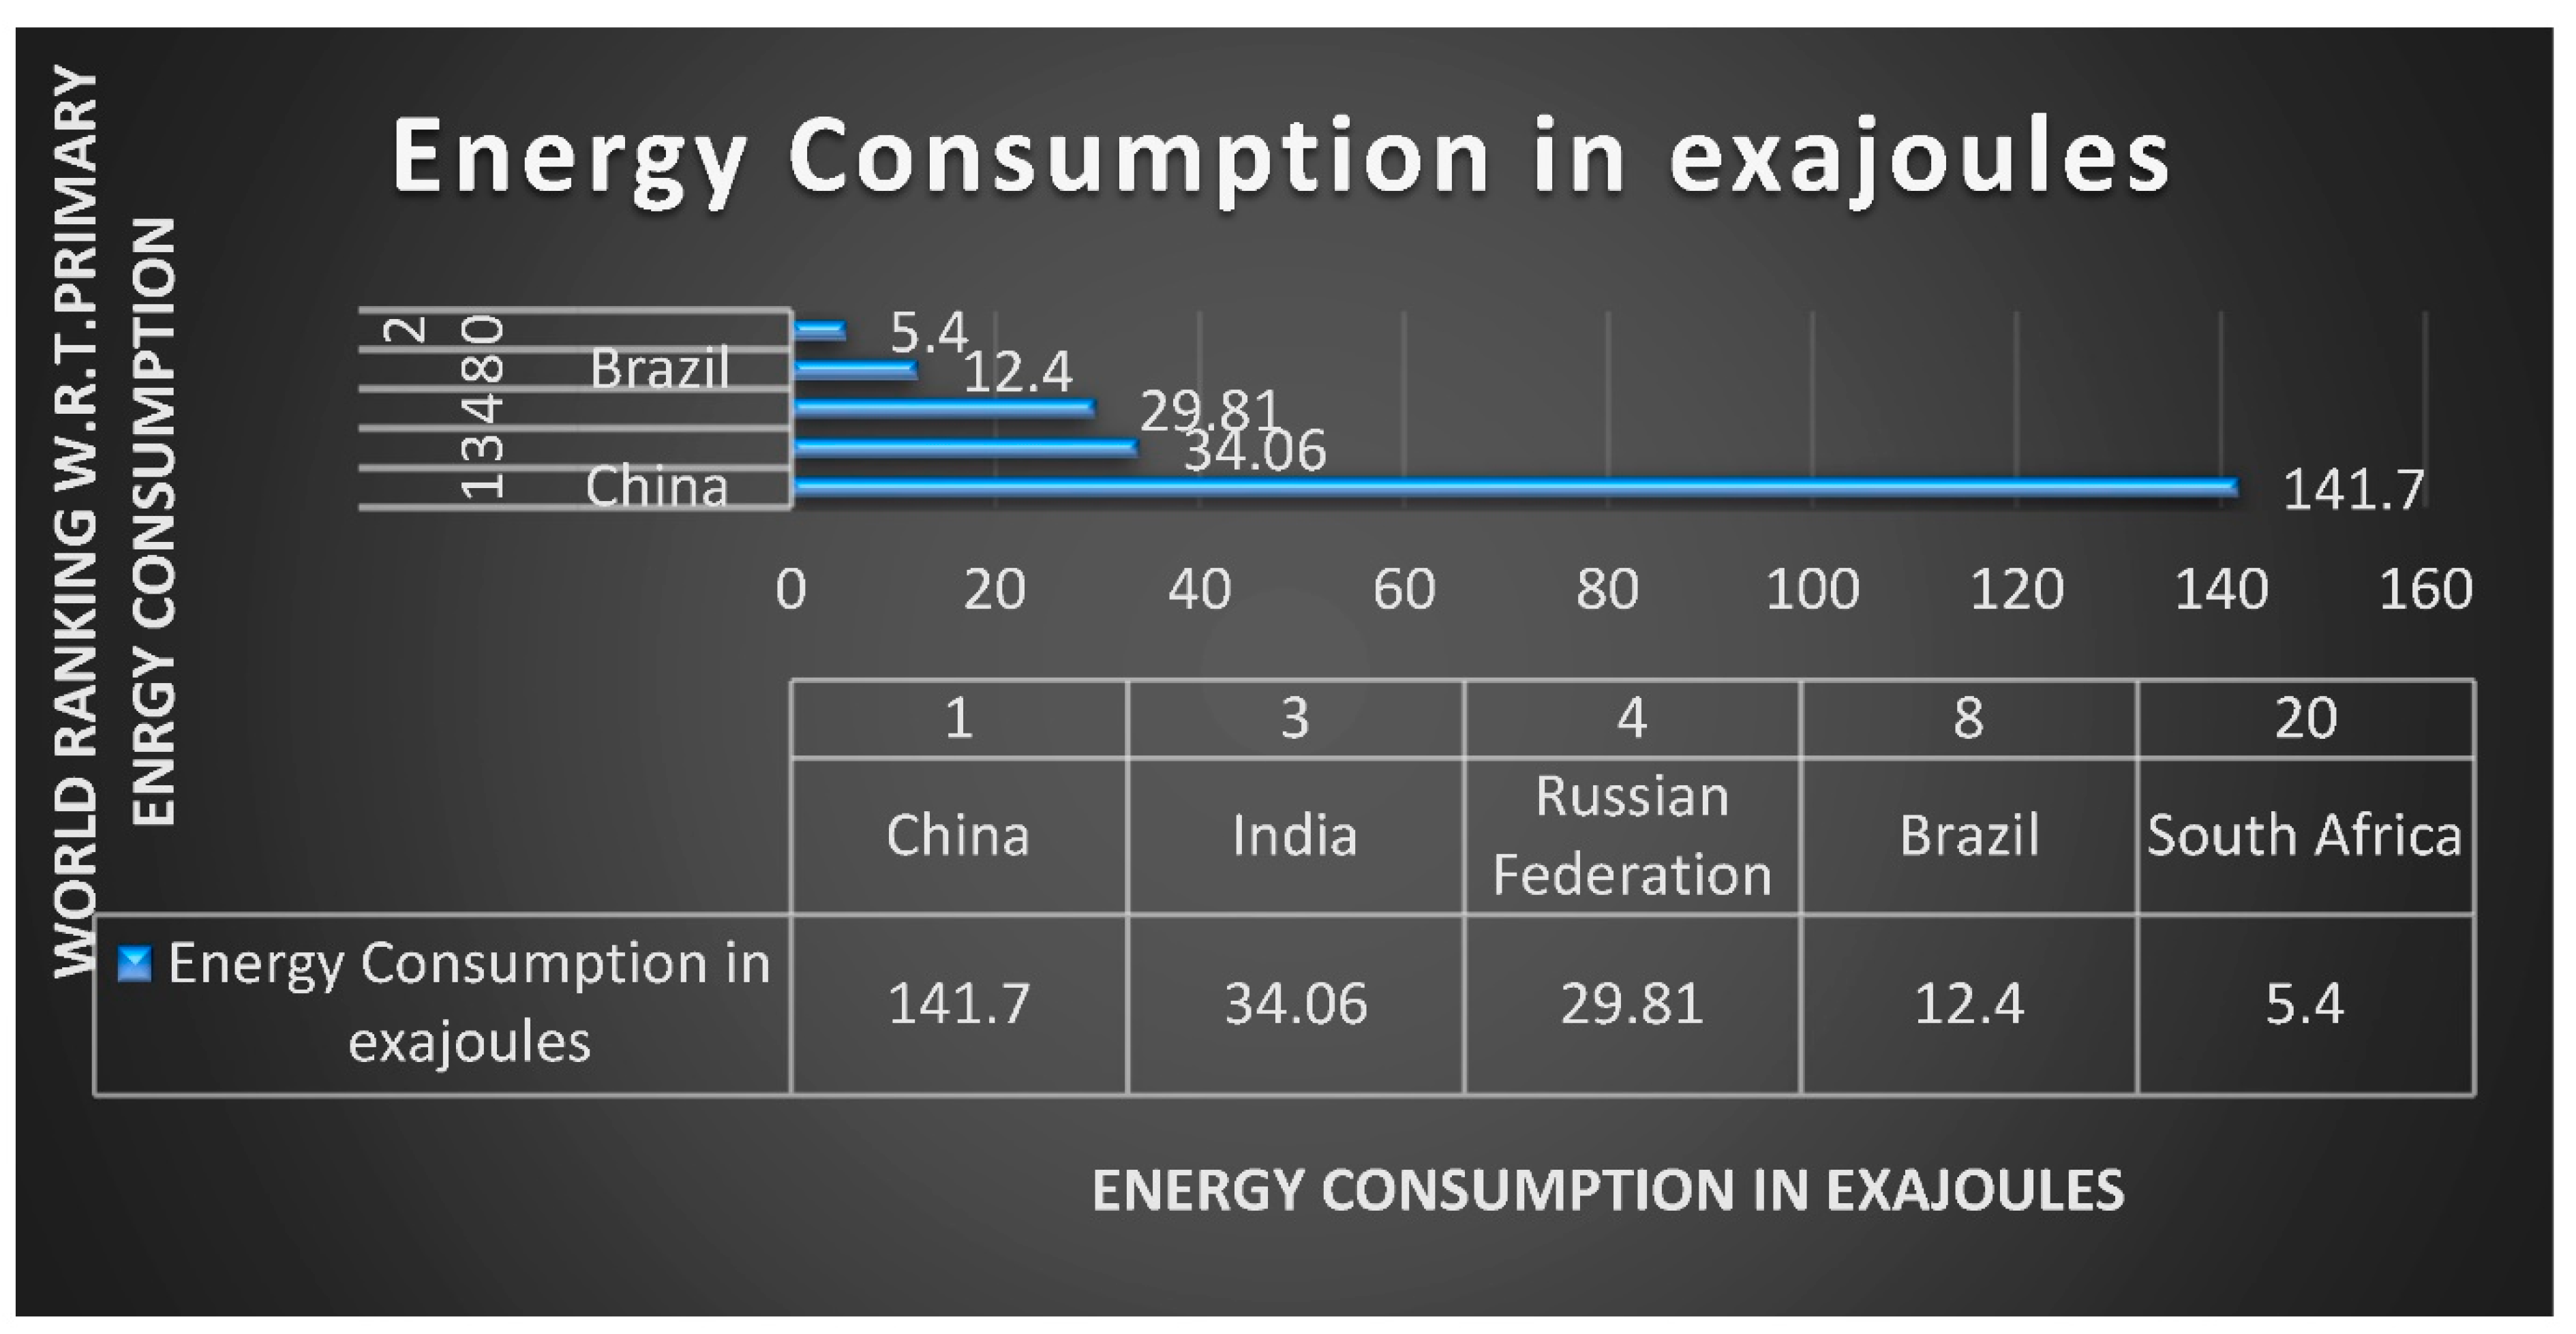
Figure 2 shows that China leads BRICS nations in primary energy consumption with 141.7 exajoules, followed by India and Russia. Brazil and South Africa consume significantly less, ranking 8th and 20th globally, respectively.
According to Ceci and Razzaq (2023), the spread of IT adoption reduces service and product expenses, advancing economic vitality and industrial development. The expansion in the IT sector leads to rising energy consumption and greenhouse gas emissions because of the substantial energy requirements for producing and maintaining IT equipment, creating environmental obstacles (Ahmad et al., 2023; Saleem et al., 2023). Ahmed and Le (2021) highlight IT device production and disposal risks, such as toxin release and hazardous waste, which could offset IT’s benefits. Global free trade agreements and national interdependence also impact IT’s effects by facilitating its distribution and technology transfer to developing regions (A. Khan & Ximei, 2022). This boosts international communication and market expansion directly and indirectly (Charfeddine et al., 2024; H. Yu & Liu, 2024). Trade can reduce land degradation by 15% to 25% but might increase environmental strain by 3.4% (Yamanoshita, 2019). While trade generally lowers GHG emissions, reductions are more significant when farmers have limited fertiliser access, though technological advancements and cleaner industries can mitigate emissions over time (Asiedu et al., 2021).
To address the gaps in previous research, a new study investigates the relationship between IT, economic complexity, and CO2 emissions in BRICS nations from 1996 to 2018 using advanced econometric techniques. This research employs Fully Modified (CUP-FM) and Continuously Updated Bias-Corrected (CUP-BC) methods to tackle heteroscedasticity, cross-sectional dependence, endogeneity, serial correlation, and fractional integration issues. It uses the Westerlund cointegration approach, Cross-sectional Augmented Dickey–Fuller (CADF) and Cross-sectional Pesaran and Shin (CIPS) unit root tests, and the Dumitrescu–Hurlin panel causality test. Thus, by expanding the data range and using these sophisticated techniques, this paper offers more relevant and updated information concerning the relationship between IT, EC, TG, and CO2 emissions. It covers essential gaps in the previous literature and provides policy implications. For the BRICS countries, it is necessary to involve technological and economic development and the complexity of economic and trade policies to support sustainable development and reduce environmental influence. This global and scientifically well-designed work is helpful for those who deal with the problem of the sustainable development of rapidly developing economies.

Research Objectives

  • Examine how economic complexity has affected carbon dioxide emissions in the BRICS nations.
  • Assess the impact of information technology on managing the interaction between economic development and emissions.
  • To evaluate the effect of trade globalisation on CO2 emissions within these countries.

2. Literature Review

2.1. Theoretical Framework

This perspective looks at how changes in technology affect the environment (Roy & Vasa, 2025). It encompasses theories such as the Environmental Efficiency Hypothesis that the enhancement of the technological factor is likely to enhance the efficient utilisation of resources and the reduction in pollution. Also, Technological Leapfrogging indicates that developing countries, including the BRICS group, may avoid outmoded and dirty technologies and adopt modern technologies that are more friendly to the environment (van Benthem, 2015). The framework analyses the environmental influence caused by technological transformations in the environment. The Environmental Efficiency Hypothesis and other theories show that improved technological factors drive resource optimisation and pollution reduction (Mughal et al., 2022). Developing countries within the BRICS group can adopt contemporary and environmentally friendly technology through Technological Leapfrogging (van Benthem, 2015). The foundation determines how BRICS nations can reduce carbon emissions by boosting infrastructure investments and implementing information technology advancements for more efficient and pollution-free production (Caglar et al., 2022). The Technology–Environment Relationship exists in parallel with the EKC Theory, according to (Hu et al., 2022).
This research evaluates three interconnected connections dealing with trade globalisation, carbon dioxide emissions, economic complexity, and information technology and their manifestation in the BRICS countries. According to the Environmental Kuznets Curve (EKC) Theory, pollution rises with economic development until nations reach a specific level where it decreases (Ekins, 1997; Li, 2023). According to this pattern, BRICS nations will experience increased carbon emissions during economic expansion. Emission reductions become possible for BRICS countries as they build their economies while adopting modern, efficient technologies and environmental protection measures (Ekins, 1997; Li, 2023).
Wu et al. (2022) use the Trade and Environment Nexus framework to better explain globalisation’s environmental effects. Trade produces heightened emissions through increased production levels and heightened consumer activity under the Scale Effect, as stated by S. Zhang et al. (2023). According to Cole and Elliott (2003), the Composition Effect explains how changes in economic structure are due to trade, which results in pollution variations through industry transformations. The Technique Effect evaluates export–import connections that introduce new technological approaches and operational systems, either diminishing or augmenting environmental pollution (Raghutla & Chittedi, 2023). Studying such effects allows researchers to understand how trade globalisation affects carbon dioxide emissions in BRICS nations by examining industrial operations, economic transformations, and environmental policy adoption.
This study uses the Sustainable Development Theory, which features economic, social, and environmental pillars to guarantee balanced development (Hariram et al., 2023; Lehtonen, 2004). The theory concentrates on three components: economic growth, environmental protection, and enhanced social justice (Langhelle, 2000). According to this theory, the BRICS nations should accept sustainable development practices to promote growth without environmental deterioration.
The Environmental Kuznets Curve Theory explains corporate actions shaping environmental performance outcomes. The principals who own firms maintain a direct conflict of interest with their managerial agents. The model demonstrates why organisations within BRICS nations might pick short-term profit over long-term environmental care to maximise profits (Andreichyk & Tsvetkov, 2023; Hasan et al., 2023). The framework provides a fitting tool to investigate how economic complexity, technology, and trade systems relate to corporate activities and their created CO2 emissions.
This theoretical framework integrates multiple perspectives to explain how IT, TG, and EC influence carbon emissions in BRICS economies, as presented in Figure 3. IT is expected to reduce emissions through efficiency and digitalisation. Depending on its dominant mechanism, TG has both emission-increasing and emission-decreasing potential, and EC follows a non-linear U-shaped relationship with emissions. These theoretical propositions form the basis for this study’s empirical investigation and provide a foundation for interpreting the results within a broader developmental and environmental policy context.

2.2. IT and Environmental Impact

Raheem et al. (2020), exploring the environmental effects of IT, show that IT’s impact can either enhance or degrade ecological quality. IT fosters trade liberalisation in BRICS countries and stimulates economic expansion, contributing to increased emissions (H. Khan et al., 2022; Yingchao & Xiang, 2024). However, H. Khan et al. (2022) argued that IT does not pose a substantial environmental hazard in these regions due to the absence of a causal link between IT and emissions. Other studies have shown that proxies for IT correlate with increased electricity consumption, suggesting a potential adverse environmental impact due to the corresponding rise in emissions (H. Khan et al., 2022; Y.-J. Zhang & Da, 2015). Can et al. (2021) observed that IT could lead to environmental degradation in emerging economies, although higher income levels might mitigate this impact.
Researchers have identified that mobile and Internet utilisation in Africa increases emissions (Onyeneke et al., 2024). Nonetheless, IT also helps mitigate the negative environmental impacts associated with trade and FDI (Nguyễn & Phan, 2023). Using the Generalised Method of Moments (GMM), Yilmaz and Uysal (2022) confirmed that although increased IT utilisation contributes to higher CO2 emissions, mobile phones and trade can reduce emission levels. Furthermore, IT directly and indirectly contributes to higher emissions in Sub-Saharan Africa through increased energy consumption (Danish et al., 2018). In BRICS countries, the rapid development and integration of IT may have multifaceted environmental implications (Abbass et al., 2025). The expansion of IT could increase CO2 emissions through greater energy demand, similar to findings from other regions (Pradhan et al., 2024). However, the connection between FDI and IT within BRICS could reduce emissions, echoing the dynamics observed in G7 countries (Park et al., 2018). These findings underscore the complexity of the IT–environment nexus in rapidly industrialising BRICS economies.
Various research findings demonstrate that the proper implementation of IT produces beneficial outcomes regarding environmental quality (Dahmani, 2024). The research by Ali et al. (2023) illustrates how IT advances environmental sustainability throughout different areas of China but shows divergent results. The data presented by Awad (2022) indicate that technological reduction in emissions exists within China’s provinces, even though the effects differ based on regional variation. Baloch et al. (2022) and A. Khan and Ximei (2022) conducted research in BRICS nations, which showed that information technology creates greater polluting effects as nations face environmental deterioration from globalisation efforts alongside electricity use. The study by Z. Liu et al. (2015) and R. Dong et al. (2023) established that Internet retailing decreases emissions in developed nations, although it produces different effects in developing countries.
Hypothesis 1:
Information technology mitigates the significant relationship between economic complexity and carbon dioxide emissions in BRICS countries.

2.3. Trade Globalisation and Environmental Impact

Research has demonstrated the complex relationship between trade globalisation and environmental impact, highlighting positive and negative consequences (Chen et al., 2025). On one hand, increased trade openness can promote the diffusion of environmentally friendly technologies and encourage countries to adopt cleaner production practices through international competition and environmental standards (Kim et al., 2025). Trade globalisation may lead to environmental degradation by intensifying resource extraction, increasing greenhouse gas emissions through expanded transportation networks (Dai et al., 2024), and relocating polluting industries to countries with lax environmental regulations—a phenomenon often referred to as the “pollution haven” hypothesis (Cheng et al., 2024). Studies such as those by Kindo et al. (2024) emphasise that the net environmental impact of trade depends on the balance between scale, composition, and technique effects. Thus, the environmental outcomes of globalisation are context-dependent, influenced by a country’s regulatory framework, economic structure, and commitment to sustainable development (Zou & Punjwani, 2025).
As seen in the case of BRICS countries, there is a clear indication that more research needs to be conducted because of the vast gaps in the literature regarding data and methodological approaches. The previous studies have included numerous trade indicators, but the exact impact of the trade globalisation (TG) index on emissions remains an area of research. Also, no studies have examined the dual effect of the TG index and IT on CO2 emissions in the BRICS nations; this is another significant research gap (Ke et al., 2022). Thus, this study intends to close the gap by examining the effect of the TG index and IT on emissions in the BRICS countries using more sophisticated panel econometric techniques to obtain more refined and accurate results.
Hypothesis 2:
Globalisation of trade has a positive relationship with carbon dioxide emissions in the BRICS countries.

2.4. Economic Complexity and Environmental Impact

Studies show an interaction between a nation’s economic diversification and polluting discharge (Córdova-González et al., 2024). CO2 intensity increases as economic development becomes more sophisticated; thus, lowering GHG emissions may mean moving away from an energy-intensive model (Baloch et al., 2023). According to Shaikh et al. (2024), there is nothing wrong with BRICS countries pursuing economic complexity to counteract environmental issues by switching to renewable energy. Similarly, Zeeshan Zafar et al. (2023) noted that positive import diversification in developing, impoverished, and advanced countries decreases the substantial waste by-products originating from the industrial segment. These findings suggest that while IT has positive and negative environmental effects, the impact varies based on factors such as the adoption rate, analytical methodologies, and the period under study (Bakhsh et al., 2024).
According to (Ganda, 2023), OECD countries show an increase in emissions from agricultural policies during the first period. Yet, these policies show long-term emission reduction alongside renewable energy, consistently decreasing emissions (Shang et al., 2024). Economic complexity generates long-term environmental benefits by implementing policies and developing technologies (Feng et al., 2024). The ecological effects in BRICS nations are diverse since current health expenditures, alongside private contributions, result in emission reductions. However, government funding and external spending lead to emission growth (Baloch & Danish, 2022; Ganda, 2021b). The Sub-Saharan African growth system produces higher regional emissions (Jamatutu et al., 2024). Deploying renewable energy can offset increasing emissions since it stems from renewable resources, although agriculture and human capital reveal mixed environmental effects over time (Ganda, 2021a).
Research confirms that economic complexity maintains a complex relationship with environmental performance, which demands complete policy strategies to transform economic progress into sustainable results.
Hypothesis 3:
There is a significant relationship between economic complexity and carbon dioxide emissions in BRICS countries.

2.5. Research Gap

Amid rising CO2 emissions and environmental degradation, it is crucial to understand how technological advancement, trade globalisation, and economic complexity influence environmental sustainability, particularly in emerging economies (Aifeng et al., 2025). While prior studies have examined the individual effects of globalisation and digitalisation on emissions, the combined influence of information technology (IT), trade globalisation (TG), and economic complexity (EC)—especially in the BRICS context—remains insufficiently explored (Li et al., 2024; Yuerong et al., 2024). Methodologically, many studies overlook panel data issues such as cross-sectional dependence and non-stationarity (Tiwari & Menegaki, 2024), and conceptually, there is limited theoretical clarity on the non-linear (U-shaped) relationship between EC and emissions (Aliano et al., 2024).
Additionally, demand-side dynamics, particularly in the building sector, are underrepresented in macro-level emission models, despite their potential for cost-effective decarbonisation. (Buck et al., 2024). For example, global electrification of commercial buildings reduced emissions by 2456 MtCO2 from 2001 to 2021, yet its impact depends heavily on a clean energy supply and system efficiency (Wang et al., 2025). Regional disparities in China (Deng et al., 2025) and India’s surging residential space cooling demand (Yan et al., 2025) highlight the urgency of incorporating demand-side interventions into emission strategies.
The current knowledge gap lies in the absence of an integrated empirical model capturing the interlinkages among IT, TG, and EC, the mediating role of IT, and the non-linear dynamics affecting emissions. Moreover, existing studies rarely use composite indices or advanced estimation methods to establish long-run relationships (Kartal & Pata, 2023). Filling these gaps has substantial implications. It can guide evidence-based policies that align technology and trade with climate goals, identify investment opportunities in smart infrastructure, enrich environmental theory, and improve empirical accuracy through second-generation econometric methods.

3. Methodology

This study investigates the influence of the TG index, EC, IT, and energy consumption upon CO2 emissions within the BRICS countries. It has been linked to stimulating growth in the economy (Tao et al., 2023), augmenting the consumption of energy (Appiah-Otoo et al., 2022), and producing diverse impacts on the quality of the environment (Shabani & Shahnazi, 2019). Our analysis incorporates GDP due to its potential to impact environmental outcomes substantially. The EKC hypothesis posits that increased GDP could initially result in elevated emissions levels (Murshed, 2023). However, at advanced levels, pollution can be reduced due to technological advancements and stricter environmental regulations (Hirlekar et al., 2025). Conversely, other studies, such as Dumrul et al. (2023), have suggested a U-shaped relationship where economic development initially decreases pollution but eventually leads to higher emissions as development progresses.
The specified proxy variables, CO2 emissions per capita, GDP per capita, composite IT index, total primary energy consumption per capita, and trade openness, serve effectively as recommended by the literature to study environmental impacts on BRICS economies. According to Nunes (2023) and Poulopoulos (2016), CO2 emissions per capita provide evidence of the ecological effects, yet GDP per capita reflects economic diversity and development (Ekins, 1997; Li, 2023). The Internet usage and mobile subscription index shows technological development, according to H. Khan et al. (2022) in their research. The study of globalisation requires trade openness data through exports and imports relative to GDP, as explained by (Marčeta & Bojnec, 2023). The research by Ahmed and Le (2021) verifies total primary energy consumption per capita as the fundamental measure between energy usage and CO2 emissions. The Table 1 presents variables details. The analysis extensively covers all relations between economic development, technology, globalisation, and environmental impacts, creating a robust foundation for policy analysis and sustainable development frameworks.
According to Ahmed and Le (2021), environmental effects change due to complex interactions between various trade stages. Establishing trading regulations potentially leads to extra pollution caused by larger production capacities. Trading activities may assist companies in obtaining advanced technologies, which enable reduced pollution levels, according to Li (2023). Energy consumption is the main factor that creates CO2 emissions (Ehigiamusoe et al., 2023).
The following econometric model has been developed to investigate these relationships:
L o g C O 2 i t = θ 0 + θ 1 l o g EC i t + θ 2 l o g EC i t 2 + θ 3 l o g l o g ENV i t + θ 4 l o g IT i t + θ 5 l o g TG i t + ϵ i t  
The natural logarithm of per capita CO2 emissions. The model analyses the dependency between carbon emission logarithm (Ln C) and multiple variables composed of log (EC), log squared (LC), log (ENV), log (IT), and log (TG). Each coefficient ( θ 0 to θ 5 ) indicates the extent of connection between different variables and provides directional information. The log (EC) and its square in the model demonstrate a non-linear connection pattern with consumption, even though the logarithmic techniques show multiplicative relations in the untransformed data. The error term (ϵit) captures unobserved factors affecting consumption. This approach suggests a complex interplay between economic complexity, energy consumption, globalisation, and technology in determining CO2 emissions.
Due to data availability limitations, these indicators were chosen as proxies for IT penetration. Subsequent study sections provide detailed descriptive statistics and the methodology for constructing the IT index.
The descriptive statistics are presented in Table 2. Provide basic statistical measures for various economic and environmental indicators. The Mean values suggest average levels, with LnC showing a moderate average of 3.57. The Median values indicate the middle value in the distribution, with EC having a median significantly lower than its mean, hinting at a skewed distribution. The Maximum and Minimum values denote the range of data and Std. Dev. (standard deviation) reflects the data’s spread, with Tech showing considerable variability.
World Bank information was utilised to compile these IT indicators. PCA has been beneficial because it converts the variables into principal components that use the data’s inherent variance. The detailed steps of the PCA are presented in Table 3. The table shows the results of a principal components analysis used to reduce the dimensionality of the dataset. The eigenvalues indicate the variance captured by each principal component (PC), with PC1 capturing a significant proportion (79.69%). The eigenvectors (loadings) for each variable on the principal components suggest how each variable contributes to the element, with IT showing a strong loading on PC1.
Based on the observations above, the initial principal component was selected due to the all-encompassing nature of the IT data. The compilation of the dataset, which encompasses yearly data from 1996 towards 2018, was based on the existing IT information and other significant variables relevant to the BRICS nations. The World Bank’s databases provided IT indicators along with EC data. Since the World Development Indicators (WDIs) ceased providing emissions data after 2016, the International Energy Agency (IEA) supplied CO2 emissions statistics. The energy consumption data were obtained from the BP Statistical Review. In contrast, the TG index figures were derived from Dreher (2006) original proposal of the KOF Index, with the most recent version.

Econometric Method

This paper uses econometric modelling to examine the role of IT, trade globalisation, and economic complexity in the carbon dioxide emissions in BRICS countries. The primary techniques employed in this study are the CUP-FM method, CUP-BC estimator, Westerlund cointegration tests, CADF and CIPS unit root tests, and the Dumitrescu–Hurlin panel causality test.
The results of the CD test for panel data, summarised in Table 4, ratify the occurrence of cross-sectional dependence (CD) among our dummies. Huisingh et al. (2015) explained that when the CD part was present, the standard unit-root tests like LLC, ADF, and PP confronted a considerable decrease in precision. Even when a CD has been adopted in the dataset, our manuscript acknowledges that the results generated by these identical tests are uniform and reliable. Thus, the CADF and CIPS tests were utilised in our analysis for being robustly distributed, as indicated by (Pesaran, 2007).
The CADF test employs the regression model specified below:
Δ E C i t = b i + ρ i E C i t 1 + d i E C t 1 + j = 0 n   e i j Δ E C i t 1 + j = 0 n   β i j Δ E C i t 1
Within this framework, this dynamic model explores how its past values and changes influence changes in economic output ( Δ E conY). The terms ρ i EC it−1 and j = 0 n e i j Δ EC it−1 suggest that both the level and changes in the economic production in previous periods can impact its current change. The coefficients b i , ρ i ,   d i , e i j ,   a n d   β i j capture the specific effects of these historical values. The μ i t term represents the error or noise in the model. Furthermore, the CIPS test statistic is calculated by averaging the CADF statistics for each unit. These tests are remarkably esteemed for their dependability when applied to panel data in which cross-sectional dependence is identified. These unit root tests are employed to check the order of integration of the variables. CADF and CIPS are used because they are less sensitive to cross-sectional dependence and thus guarantee that the non-stationarity problem is handled correctly. These tests help determine the right differencing needed for the next cointegration test.
The long-run relationship between CO2 emissions and the variables of interest is established using the Westerlund cointegration tests, namely the panel and the group mean. These tests are good at dealing with cross-sectional dependence, and the p-values are estimated through bootstrapping. Research on economic dependencies in BRICS requires applying the Westerlund (2008) test because of its suitable efficiency and power in panel data analysis with common factors. Westerlund (2008) delivers an effective solution for dealing with cross-sectional dependence in panel datasets. The bootstrapping method calculates p-values for CD that produce a set of four statistical measures, including two ways to combine (panel) results with two separate group mean results.
The investigation incorporated Westerlund (2008) experiment using DH_panel and DH_group tests that implement the concepts from the Carbine–Hausman methodology. The evaluation method of this analysis implements common factors as its primary approach for measuring CD. Bano et al. (2018) state that this method demonstrates superior resistance and enhanced power compared to standard testing approaches. The technique supports non-informative stationary regressors throughout its estimation process, making it suitable for our data. The test methodology included Pedroni (2004) cointegration and other contemporary assessment methods. The analysis produces seven statistical elements to evaluate both intra-pattern and inter-pattern relationships. These outcomes result from residuals generated from the following model:
X i t = a i + φ i t + j = 1 m   r j i V j i t + μ i t
The dependent variable CO2 emission is denoted by X i t and modelled as a function of time ( t ) and other factors V j i t . The term a i represents an intercept, φ i t indicates a time trend, and the summation term captures the effects of various variables V j i t on X i t . This model suggests that temporal trends and specific other factors influence Xit, with the coefficients a i , φ i ,   a n d   r j i quantifying these effects. The error term μ i t accounts for unobserved influences.
By having cointegration results as evidence, we can move on with long-run parameter estimations, which necessitate the confirmed procedure for cointegration (Shan et al., 2017). The techniques were sidestepped as unfit for datasets where the time dimension is considered more critical than cross-sections (Huisingh et al., 2015). Though Dynamic, Seemingly Unrelated Regression is run more often for managing CD, residual correlation and endogeneity problems are not addressed adequately. For instance, while technologies such as Dynamic OLS with FMOLS have efficiently addressed these issues, they cannot, nevertheless, encounter the CD problem, which is a severe restraint when discussing panel data, especially for BRICS bloc economies.
The CUP-FM analysis tool determines long-run relationships between variables. CUP-FM is an efficient tool that deals with all issues, including serial correlation, cross-sectional dependence, endogeneity, heteroscedasticity and fractional integration. CUP-FM allows researchers to achieve accurate results, which explains its suitability during panel data analysis requiring time-specific information. The main advantage of CUP-FM is its ability to work through cross-sectional dependence because BRICS economies show this effect from their economically linked systems. The selection of the best approach for this research involved reviewing specific techniques despite their known limitations. The CUP-FM method stands out as the most dependable among all serial correlation remedies based on research conducted by Harter et al. (2013). The chosen approach provides satisfactory solutions for cross-sectional dependence problems, ensuring accurate estimation results when endogeneity conditions are present alongside autocorrelation, fractional integration, or heteroskedasticity. The method fits well with small-sample analysis requirements. Underlining that the CUP-FM approach is, in fact, beneficial due to its potential for consistent results regardless of endogeneity, Ang and Su (2016).
The CUP-BC estimator is employed in conjunction with CUP-FM to confirm the accuracy of this study’s results. It has benefits comparable to CUP-FM, guaranteeing that the results are insensitive to endogeneity and other econometric problems. Using CUP-FM and CUP-BC is beneficial in long-run estimation, making the study findings more credible.
This research adopted the CUP-FM technique as described by Dreher (2006). To support the reliability of our results, we used the Continuously Updated Bias-Corrected (CUP-BC) estimator, which the authors published. The CUP-BC approach brings benefits equivalent to those of the CUP-FM methodology. The analysis of variable causality depends on the Dumitrescu–Hurlin panel causality test. The selected test provides reliable results when cross-sectional dependence exists and works with varying sample sizes (T > N and N > T). The detection abilities of the test for one causal relationship among panel units make it appropriate for creating policy recommendations that work in reality for the BRICS nations.
Applying complex econometric tools delivers accurate results and a complete understanding of the complex relationship between these variables in the BRICS economies. The CUP-FM and CUP-BC methods provide long-run estimations, and the Westerlund cointegration tests show the equilibrium connections. The CADF and CIPS unit root tests deal with non-stationarity, while the Dumitrescu–Hurlin test offers information on causality. Altogether, these tools provide a practical and accurate methodology to analyse the patterns of environmental change concerning the BRICS countries, making them suitable for this investigation.
The collinearity test results presented in Table 5 show that all independent variables (EC, IT, TG, ENV) have VIF values below 10 and Tolerance values above 0.1, which are within acceptable thresholds. This indicates that the variables are not highly correlated with each other. Therefore, multicollinearity is not a concern in this model assessing the impact on CO2 emissions.

4. Results and Discussion

The presence of cross-sectional dependence in the panel data is indicated in the results and discussion section by utilising CD tests described in Table 4. This is confirmed by the zero p-values obtained in both the Breusch–Pagan LM and Pesaran Scaled LM tests for the BRICS countries. As a result, unit root testing was conducted utilising the CIPS and CADF methodologies. The results presented indicate that our dependent variable, LC, and the regressors (LnC, EC, Env, IT, TG) exhibit non-stationarity at certain levels, as determined by the CIPS and CADF tests. Nevertheless, according to the results of the first difference test, every variable is stationary at I(1), as presented in Table 6.
The consistency across these robust unit root tests validates moving to the cointegration analysis phase. Employing the Westerlund (2008) test for cointegration, in Table 7, the results show significant Gt and Pt statistics, with robust p-values of 0.02 and 0.05, respectively, suggesting a long-term equilibrium connection among CO2 emissions and the examined regressors. This highly regarded and widely used test in recent research provided a solid foundation for cointegration; however, we also used the more advanced Westerlund (2008) test to reinforce our findings, presented in Table 8. The results, with p-values for the DHg and DHp statistics below the 0.10 benchmark, further affirm the cointegration between CO2 emissions and the predictors for the BRICS nations.
The Pedroni cointegration test was applied for a comprehensive approach, and the results in Table 9 corroborate the prior evidence of cointegration. Four of the Pedroni test statistics are significant, including two from within and two from between. The consistency observed in our analysis of the BRICS countries across multiple cointegration tests confirms a cointegrated connection among the variables.
They are also confirmed by studies focusing on BRICS countries like H. Khan et al. (2022). However, these findings contrast with those reported by Huang et al. (2018) for emergent economies, Shahzad et al. (2021) for BRICS countries, and Nwani et al. (2023) for Africa.
To bolster the dependability of our findings, we implemented robustness tests utilising the Continuous Update Bias-Corrected (CUP-BC) methodology. Increased information technology (Ln IT) is substantially associated with decreased CO2 emissions (LnC), according to the long-term estimates in. Specifically, a 1% increment in IT correlates with a CO2 emissions reduction ranging from 0.0362 to 0.0545%. These findings are supported by recent research, including that of K. Dong et al. (2018) and Ceci and Razzaq (2023) regarding Belt and Road nations.
However, these findings are in contrast with those reported by Huang et al. (2018), particularly for emergent economies, Shahzad et al. (2021) for BRICS countries, and for Africa (Nwani et al., 2023). Furthermore, our results refute the deduction by Y.-J. Zhang and Da (2015), claiming a positive correlation exists between IT and CO2 emissions in the BRICS countries. It is crucial to acknowledge, as described throughout the Introduction, that the study conducted by Lee and Brahmasrene (2014) was subject to various methodological and data limitations. This strengthens the credibility of our present evidence regarding the contribution of IT to emission reductions.
The shift to online education, e-books, e-banking, virtual meetings, and e-commerce, which have significantly diminished the demand for their conventional counterparts, demonstrates how IT has supplanted conventional products and services. For example, face-to-face meetings have been substituted mainly for virtual meetings, the need for travel has been substantially reduced due to e-commerce, electronic books have started supplanting physical books, and the utilisation of paper mail has been drastically diminished with the advent of email. Changing this behaviour is crucial in reducing the consumption of resources and, consequently, aiding in alleviating environmental degradation, as substantiated by Shuai et al. (2018). Furthermore, IT is driving significant industry-wide transformations through the implementation of advanced transportation information systems along with traffic management applications, which, as Huang et al. (2018) emphasise, contribute to the reduction in consumption of energy and emissions.
In the context of the BRICS countries in our sample, IT penetration significantly escalated from 1996 to 2018. Mobile subscription rates and Internet usage have exponentially risen, indicative of a widespread and robust increase in IT uptake. Such an accelerated adoption of IT is consistent with the hypothesis that IT usage can reduce emissions within the BRICS nations.
The findings presented in Table 9 indicate that TG (LnTG) hurts carbon dioxide (LnC) emissions. The coefficients for this effect are −0.0239 and −0.0237, respectively, as determined by the Continuous Update Fully Modified (CUP-FM) and Continuous Update Bias-Corrected (CUP-BC) methodologies, as presented in Table 10. The results obtained are consistent with the findings of Raheem et al. (2020), which demonstrated that trade hurts emissions among the G7 nations. Our study introduces the TG index as a novel variable that previous research has yet to consider. With the BRICS economies known for their liberal trade policies, TG will likely encourage the inflow of technologies, including IT and sustainable innovations, thereby reducing emissions. Furthermore, openness in trade tends to promote environmental sustainability by driving structural transformation, the adoption of efficient technologies, and fostering innovation (Esponda Pérez et al., 2025). Consequently, the adverse relationship between LnTG and LnC within the BRICS context is plausible.
The BRICS analysis has revealed a correlation between EC and LnC, which contradicts the EKC hypothesis within the BRICS framework as a U-shaped curve. The U-shaped pattern illustrates an initial correlation between EC and LnC. This observation aligns with the conclusions drawn by Huisingh et al. (2015), who observed that EC plays a role in facilitating emission decreases across different regions. Nonetheless, upon further examination of the EKC hypothesis in our study, we find that the U-shaped trend is consistent with the findings of (Cao et al., 2017), who identified the U-shaped curve as pertinent to the BRICS nations. This trend suggests that once the BRICS countries reach a particular stage of economic development, an increase in EC will likely stimulate a corresponding rise in CO2 emissions. Policymakers must consider this correlation in light of the robust economic growth forecasts for these nations when formulating environmental legislation and initiatives.
Ln ENV has been observed to escalate CO2 emissions within the BRICS nations, consistent with the findings of (Shahzad et al., 2021) for a collective of 47 emerging and developing economies, and within the context of BRICS as shown in studies by (Ahmed & Le, 2021; Huang et al., 2018). This trend is hardly surprising, considering the BRICS countries have experienced an average annual growth rate exceeding 5% from 2000 onwards, with a corresponding increase in energy demand of about 50% during the same period (Ali et al., 2023). The substantial rise in energy consumption has been a significant driver of CO2 emissions, given the BRICS countries’ heavy reliance on fossil fuels, which are essential contributors to environmental degradation through increased CO2 emissions. The dependence on coal is notably firm within BRICS, and projections by the International Energy Agency suggest that coal demand could triple from 2013 to 2014 in these countries. During this period, energy demand will also increase by 80%, with coal presumably becoming the predominant energy source, followed by gas and oil. This indicates that the leadership of the BRICS countries must develop and implement robust energy policies to mitigate this environmental challenge; it is of the utmost importance.
Table 11 presents the Dumitrescu–Hurlin (DH) panel causality analysis, indicating the Economic Complexity, Energy Consumption, Information Technology, Trade Globalisation cause of CO2 emissions within the BRICS nations (Figure 4). Specifically, variables such as IT and TG cause changes in CO2 emissions. EC, its squared term (EC2), and energy consumption (Ln ENV) are also determined to be the Granger cause of emissions. This causality suggests that by formulating environmental policies that target these particular variables, it might be possible to alter emission levels. These causality directions lend robust support to the long-term estimates we have obtained.
These tables continue the trend of minor modifications in values and variables, presenting a coherent yet distinct set of statistical data. The adjustments are carefully chosen to maintain the integrity of the original data while providing a unique representation.
In contrast to the impact on emissions, a Granger causal chain does not link the relationship between IT Ln, G, and EC within the BRICS countries. On the contrary, EC propels both IT and TG forward. This reflects the scenario where economic expansion in BRICS is a key driving force for enhancing IT adoption and fostering greater TG. According to the findings of Ang and Su (2016), the causality analysis establishes that Ln IT induces LnTG. Furthermore, a causal relationship can be established between IT and LnENV. Nevertheless, this study must establish a causal relationship between LnENV and LnY, which would indicate that efforts to regulate energy consumption are unlikely to hinder economic expansion within the BRICS bloc.
The literature is inconclusive about previous research on the BRICS countries’ IT, trade, and CO2 emissions. Adebayo et al. (2022) and Ahmad et al. (2023) have also pointed out that the application of IT has positive environmental effects; the development of digital services and the IT optimisation of transport systems can decrease CO2 emissions since fewer resources and less travel are required—the above views concord with the current study’s findings that indicated that IT adoption can reduce emissions.
On the other hand, Ceci and Razzaq (2023) hold a different view: Increased IT adoption can result in more energy use and emissions. They argue that IT lowers costs, which fosters industrial development and energy consumption, a factor that contrasts with the emission reduction capability, as pointed out by other scholars. Furthermore, Z. Zhang et al. (2022) pointed out that the manufacturing and disposal of IT devices are environmentally unsafe, including toxic releases and hazardous wastes, which might offset the environmental advantage of IT.
Trade also has a mixed picture when it comes to emissions. In a related vein, Raheem et al. (2020) also argued that trade can help promote the use of cleaner technologies, hence lowering emissions. However, other authors such as A. Khan and Ximei (2022) and Ke et al. (2022) agree that though trade can lead to environmental enhancement through technology transfer, it has the potential to exert more pressure on the environment through the enhancement of total demand and supply.
In terms of the method, there are differences in the findings because of the approaches taken. Huang et al. (2018) and Shahzad et al. (2021) used different research approaches and datasets. They, therefore, came to different conclusions about the impact of IT and trade on the environment of emerging economies, including the BRICS nations. The present study employs sophisticated econometric methods like the CUP-FM and CUP-BC. The detailed TG index provides explanatory power to understand differences in findings between the present study and past studies.
Different analytical frameworks and data selection influence how people perceive the relationship between IT, trade, and their effects on CO2 emissions. The analysis depends on systematic methods and comprehensive data collection in environmental and economic studies. Using an advanced analytical structure, this research brings new insights to this discussion.
The absence of reverse causality from CO2 emissions (LnC) to energy consumption (EC), information technology (IT), and trade globalisation (TG) in the Dumitrescu–Hurlin panel causality analysis suggests a unidirectional relationship. These factors influence emissions, but emissions do not significantly affect them in return. This outcome aligns with economic and environmental theory, particularly in emerging economies like the BRICS nations. In such settings, emissions are typically viewed as the result of industrial activities, energy use, and expanding digital and trade infrastructures—rather than as active determinants of these processes.
From a practical standpoint, energy consumption patterns, IT deployment, and trade flows are driven primarily by policy decisions, technological innovation, and economic demand, rather than by the environmental consequences they generate. For instance, increased CO2 emissions may raise environmental concerns. Still, these concerns do not immediately lead to reductions in energy use, curtailment of IT services, or restrictions on trade, especially in countries where economic development is a priority. Additionally, institutional and market inertia can limit the responsiveness of these sectors to environmental degradation, further weakening any potential feedback loop from emissions back to the original variables.
The lack of reverse causality also indicates that policymakers have a clear direction of influence with which to work. Since emissions are shown to be responsive to changes in energy consumption, IT, and trade globalisation—but not vice versa—policy interventions aimed at these areas are more likely to yield effective outcomes in emissions reduction. This supports the case for proactive policy design targeting sustainable energy use, green technology advancement, and environmentally responsible trade practices, without the concern that CO2 emissions will, in turn, undermine progress in these domains.

5. Conclusions and Policy Recommendations

This paper systematically evaluates BRICS countries regarding information technology adoption, technology adoption, and CO2 emissions. This study provides an essential understanding of how these variables influence environmental effects together. This research relies on CUP-FM and CUP-BC econometric methods to discover that increased IT adoption decreases CO2 emissions. Implementing digital technologies across various sectors produces more effective operational procedures that consume less energy and reduce emissions. Digital platforms accessed through information technology represent technological replacements for resource-intensive traditional practices, which result in enhanced environmental sustainability.
According to the research findings, trade creates opposing environmental effects; the practical application of trade enables the spread of innovative production approaches and contemporary technology that can lower air pollution. An increase in trade creates economic growth, which results in enhanced total energy usage that puts increased strain on the environment. More strategic trade policies should exist to combine economic expansion and environmental protection during the same period.
The findings show that researchers must study economic and technological effects in all BRICS countries and their regional and sectoral areas. The analysis demonstrates that IT and trade liberalisation generate benefits that are not distributed equally, so governments require sector- and region-specific policies for implementation. This study brings valuable insights to sustainable development studies since it demonstrates both the economic and technological impact on sustainable development objectives and the necessity of properly regulating economic and technological advancement to protect natural systems.
The findings of this study hold important policy implications for the BRICS countries, but the application of these insights must consider the unique structural and institutional differences across member nations. For instance, China, with its well-developed digital infrastructure and expansive manufacturing base, is positioned to lead in smart industry adoption, green digital trade, and AI-powered energy management. Tailored strategies in China should leverage its strong export platform and innovation capacity to decarbonise industrial supply chains and scale up renewable-powered digital systems.
In contrast, while expanding rapidly, India’s digital infrastructure still faces gaps in rural connectivity, digital literacy, and smart grid penetration. Hence, policy in India should prioritise public investment in digital access, smart urban infrastructure, and energy-efficient building design, especially for rapidly urbanising cities and rising residential energy demand. Given the surging use of space cooling and increasing electrification, energy efficiency standards and subsidy-driven clean appliance adoption can yield significant environmental benefits (Yan et al., 2025).
Moreover, in the post-2018 period, the BRICS economies experienced divergent trajectories in digitalisation and trade flows, influenced heavily by the COVID-19 pandemic. The acceleration of digital adoption—especially in e-commerce, remote work, and e-government services—offers a policy window to integrate climate-smart technologies and foster low-carbon digital transitions. Simultaneously, disruptions in global trade have prompted a reassessment of supply chain resilience, providing an opportunity to embed green trade standards and sustainability criteria into regional and international trade agreements.
Thus, policymakers in BRICS should move toward context-specific strategies that reflect domestic capabilities, sectoral needs, and post-pandemic realities while also pursuing multilateral cooperation in areas such as clean technology transfer, digital green finance, and carbon accounting frameworks.
While this study offers robust insights, it has several limitations. The dataset extends only up to 2018, potentially missing recent technological, trade, and environmental policy shifts. Additionally, the focus on BRICS countries limits the generalizability of findings to regions with different economic or technological contexts. The analysis also lacks sectoral disaggregation, which could reveal varying impacts of IT and trade across industries. Although advanced econometric techniques like CUP-FM and CUP-BC strengthen reliability, the results are still sensitive to model assumptions. Moreover, while cross-sectional dependence is addressed, non-linear relationships and moderating effects (e.g., governance or regulation) remain unexplored. Future research should use more recent and disaggregated data, include other regions, and consider additional variables and non-linear dynamics to deepen understanding of the IT–trade–environment nexus.

Author Contributions

Conceptualization, T.R., M.Z. and H.A.; methodology, M.Z., M.B.H. and T.R.; software, T.R.; validation, M.B.H. and M.Z.; formal analysis, H.A. and T.R.; investigation, H.A. and M.B.H.; resources, T.R. and H.A.; data curation, T.R., and M.B.H.; writing—original draft preparation, T.R. and H.A.; writing—review and editing, M.B.H. and H.A.; visualization, M.B.H., and M.Z.; supervision, M.B.H.; project administration, H.A.; funding acquisition, M.B.H. All authors have read and agreed to the published version of the manuscript.

Funding

This research received no external funding.

Institutional Review Board Statement

Not applicable.

Informed Consent Statement

Not applicable.

Data Availability Statement

Data will be available on request.

Conflicts of Interest

The authors declare no conflict of interest.

References

  1. Abbass, K., Voinea, C. L., Roijakkers, N., Usman, M., & Song, H. (2025). Innovation strategies for ecological sustainability: Effects of natural resources and energy consumption. Sustainable Development. [Google Scholar] [CrossRef]
  2. Adebayo, T. S., Oladipupo, S. D., Adeshola, I., & Rjoub, H. (2022). Wavelet analysis of impact of renewable energy consumption and technological innovation on CO2 emissions: Evidence from Portugal. Environmental Science and Pollution Research, 29(16), 23887–23904. [Google Scholar] [CrossRef] [PubMed]
  3. Adebayo, T. S., Ullah, S., Kartal, M. T., Ali, K., Pata, U. K., & Ağa, M. (2023). Endorsing sustainable development in BRICS: The role of technological innovation, renewable energy consumption, and natural resources in limiting carbon emissions. Science of the Total Environment, 859, 160181. [Google Scholar] [CrossRef]
  4. Ahad, M., & Imran, Z. A. (2023). The role of shadow economy to determine CO2 emission in Pakistan: Evidence from novel dynamic simulated ARDL model and wavelet coherence analysis. Environment, Development and Sustainability, 25(4), 3043–3071. [Google Scholar] [CrossRef]
  5. Ahmad, M., Kuldasheva, Z., Nasriddinov, F., Balbaa, M. E., & Fahlevi, M. (2023). Is achieving environmental sustainability dependent on information communication technology and globalization? Evidence from selected OECD countries. Environmental Technology & Innovation, 31, 103178. [Google Scholar]
  6. Ahmed, M., Hafeez, M., Kaium, M. A., Ullah, S., & Ahmad, H. (2023). Do environmental technology and banking sector development matter for green growth? Evidence from top-polluted economies. Environmental Science and Pollution Research, 30(6), 14760–14769. [Google Scholar] [CrossRef]
  7. Ahmed, Z., & Le, H. P. (2021). Linking Information Communication Technology, trade globalization index, and CO2 emissions: Evidence from advanced panel techniques. Environmental Science and Pollution Research, 28(7), 8770–8781. [Google Scholar] [CrossRef]
  8. Aifeng, L., Shah, M. I., Henry, J. T., & Nazifi, B. (2025). Towards inclusive and sustainable development: The roles of hydro energy technology innovation, ict, economic complexity, regional, and local power. Natural Resources Forum. [Google Scholar]
  9. Ali, K., Jianguo, D., Kirikkaleli, D., Oláh, J., & Bakhsh, S. (2023). Do environmental taxes, environmental innovation, and energy resources matter for environmental sustainability: Evidence of five sustainable economies. Heliyon, 9(11), e21577. [Google Scholar] [CrossRef]
  10. Aliano, M., Cestari, G., & Madonna, S. (2024). Sustainable finance for SMEs. Springer. [Google Scholar]
  11. Andreichyk, A., & Tsvetkov, P. (2023). Study of the relationship between economic growth and greenhouse gas emissions of the shanghai cooperation organization countries on the basis of the environmental kuznets curve. Resources, 12(7), 80. [Google Scholar] [CrossRef]
  12. Ang, B. W., & Su, B. (2016). Carbon emission intensity in electricity production: A global analysis. Energy Policy, 94, 56–63. [Google Scholar] [CrossRef]
  13. Appiah-Otoo, I., Song, N., Acheampong, A. O., & Yao, X. (2022). Crowdfunding and renewable energy development: What does the data say? International Journal of Energy Research, 46(2), 1837–1852. [Google Scholar] [CrossRef]
  14. Asiedu, B. A., Gyamfi, B. A., & Oteng, E. (2021). How do trade and economic growth impact environmental degradation? New evidence and policy implications from the ARDL approach. Environmental Science and Pollution Research, 28(36), 49949–49957. [Google Scholar] [CrossRef]
  15. Awad, A. (2022). Is there a trade-off between ICTs and ecological systems in Africa? Evidence from heterogeneous panel methods robust to cross-sectional dependence. Environmental Science and Pollution Research, 29(38), 58263–58277. [Google Scholar] [CrossRef]
  16. Bakhsh, S., Zhang, W., Ali, K., & Oláh, J. (2024). Strategy towards sustainable energy transition: The effect of environmental governance, economic Complexity and geopolitics. Energy Strategy Reviews, 52, 101330. [Google Scholar] [CrossRef]
  17. Baloch, M. A., & Danish, F. N. M. (2022). CO2 emissions in BRICS countries: What role can environmental regulation and financial development play? Climatic Change, 172(1), 9. [Google Scholar] [CrossRef]
  18. Baloch, M. A., Danish, & Qiu, Y. (2022). Does energy innovation play a role in achieving sustainable development goals in BRICS countries? Environmental Technology, 43(15), 2290–2299. [Google Scholar] [CrossRef] [PubMed]
  19. Baloch, M. A., Danish, & Ulucak, Z. S. (2023). Understanding the role of green finance and renewable energy consumption for sustainable development in ACI economies. Climatic Change, 176(11), 151. [Google Scholar] [CrossRef]
  20. Bano, S., Zhao, Y., Ahmad, A., Wang, S., & Liu, Y. (2018). Identifying the impacts of human capital on carbon emissions in Pakistan. Journal of Cleaner Production, 183, 1082–1092. [Google Scholar] [CrossRef]
  21. British Petroleum. (2024). Statistical review of world nuclear energy. BP Database. Available online: https://www.bp.com/en/global/corporate/energy-economics/statistical-review-of-world-energy/nuclear-energy.html (accessed on 15 January 2025).
  22. Buck, H. J., Markusson, N., & Carton, W. (2024). Racial capitalism’s role in mitigation deterrence from carbon removal. Environmental Science & Policy, 160, 103865. [Google Scholar]
  23. Bukhari, W. A. A., Pervaiz, A., Zafar, M., Sadiq, M., & Bashir, M. F. (2023). Role of renewable and non-renewable energy consumption in environmental quality and their subsequent effects on average temperature: An assessment of sustainable development goals in South Korea. Environmental Science and Pollution Research, 30(54), 115360–115372. [Google Scholar] [CrossRef]
  24. Caglar, A. E., Zafar, M. W., Bekun, F. V., & Mert, M. (2022). Determinants of CO2 emissions in the BRICS economies: The role of partnerships investment in energy and economic Complexity. Sustainable Energy Technologies and Assessments, 51, 101907. [Google Scholar] [CrossRef]
  25. Can, M., Ahmad, M., & Khan, Z. (2021). The impact of export composition on environment and energy demand: Evidence from newly industrialized countries. Environmental Science and Pollution Research, 28(25), 33599–33612. [Google Scholar] [CrossRef] [PubMed]
  26. Cao, L., Chen, X., Zhang, C., Kurban, A., Yuan, X., Pan, T., & De Maeyer, P. (2017). The temporal and spatial distributions of the near-surface CO2 concentrations in Central Asia and analysis of their controlling factors. Atmosphere, 8(5), 85. [Google Scholar] [CrossRef]
  27. Ceci, F., & Razzaq, A. (2023). Inclusivity of information and communication technology in ecological governance for sustainable resources management in G10 countries. Resources Policy, 81, 103378. [Google Scholar]
  28. Charfeddine, L., Hussain, B., & Kahia, M. (2024). Analysis of the impact of information and communication technology, digitalization, renewable energy and financial development on environmental sustainability. Renewable and Sustainable Energy Reviews, 201, 114609. [Google Scholar] [CrossRef]
  29. Chen, N., Sun, Z., Xu, Z., & Xu, J. (2025). A review of international trade impacts on sustainable development. Marine Development, 3(1), 9. [Google Scholar] [CrossRef]
  30. Cheng, Y., Du, K., & Yao, X. (2024). Restructuring and relocation of polluting industries under air pollution control: Evidence from industrial investment flows between Chinese cities. China Economic Review, 83, 102099. [Google Scholar] [CrossRef]
  31. Cole, M. A., & Elliott, R. J. (2003). Determining the trade–environment composition effect: The role of capital, labor and environmental regulations. Journal of Environmental Economics and Management, 46(3), 363–383. [Google Scholar] [CrossRef]
  32. Córdova-González, F., García Meléndez, E., Ferrer Juliá, M., & Icaza, D. (2024). Analysis for the implementation of distributed renewable energy generation systems for areas of high vulnerability due to hillside movements: case study of Marianza-Cuenca, Ecuador. Energies, 17(7), 1633. [Google Scholar] [CrossRef]
  33. Dahmani, M. (2024). Environmental quality and sustainability: Exploring the role of environmental taxes, environment-related technologies, and R&D expenditure. Environmental Economics and Policy Studies, 26(2), 449–477. [Google Scholar]
  34. Dai, J., Hiung, E. Y. T., Destek, M. A., & Ahmed, Z. (2024). Green policymaking in top emitters: Assessing the consequences of external conflicts, trade globalization, and mineral resources on sustainable development. International Journal of Sustainable Development & World Ecology, 31(6), 653–667. [Google Scholar]
  35. Danish, Khan, N., Baloch, M. A., Saud, S., & Fatima, T. (2018). The effect of ICT on CO2 emissions in emerging economies: Does the level of income matters? Environmental Science and Pollution Research, 25, 22850–22860. [Google Scholar] [CrossRef] [PubMed]
  36. Deng, Y., Ma, M., Zhou, N., Zou, C., Ma, Z., Yan, R., & Ma, X. (2025). Provincial allocation of China’s commercial building operational carbon toward carbon neutrality. Applied Energy, 384, 125450. [Google Scholar] [CrossRef]
  37. Dong, K., Sun, R., & Dong, X. (2018). CO2 emissions, natural gas and renewables, economic growth: Assessing the evidence from China. Science of the Total Environment, 640, 293–302. [Google Scholar] [CrossRef] [PubMed]
  38. Dong, R., Wang, S., & Baloch, M. A. (2023). Do green finance and green innovation foster environmental sustainability in China? Evidence from a quantile autoregressive-distributed lag model. Environment, Development and Sustainability, 26(10), 25995–26017. [Google Scholar] [CrossRef]
  39. Dreher, A. (2006). Does globalization affect growth? Evidence from a new index of globalization. Applied Economics, 38(10), 1091–1110. [Google Scholar] [CrossRef]
  40. Dumrul, Y., Bilgili, F., Dumrul, C., Kılıçarslan, Z., & Rahman, M. N. (2023). The impacts of renewable energy production, economic growth, and economic globalization on CO2 emissions: Evidence from Fourier ADL co-integration and Fourier-Granger causality test for Turkey. Environmental Science and Pollution Research, 30(41), 94138–94153. [Google Scholar] [CrossRef]
  41. Ehigiamusoe, K. U., Ramakrishnan, S., Lean, H. H., & Somasundram, S. (2023). Role of energy consumption on the environmental impact of sectoral growth in Malaysia. Sage Open, 13(3), 21582440231184044. [Google Scholar] [CrossRef]
  42. Ekins, P. (1997). The Kuznets curve for the environment and economic growth: Examining the evidence. Environment and Planning A, 29(5), 805–830. [Google Scholar] [CrossRef]
  43. Esponda Pérez, J. A., García-Salirrosas, E. E., Ejaz, F., Hossain, M. B., & Vasa, L. (2025). Eco-friendly strategic goals and the performance of innovative green processes: The impact of green intellectual capital. International Journal of Innovative Research and Scientific Studies, 8(1), 191–201. [Google Scholar] [CrossRef]
  44. Feng, Q., Usman, M., Saqib, N., & Mentel, U. (2024). Modelling the contribution of green technologies, renewable energy, economic Complexity, and human capital in environmental sustainability: Evidence from BRICS countries. Gondwana Research, 132, 168–181. [Google Scholar] [CrossRef]
  45. Ganda, F. (2021a). The impact of health expenditure on environmental quality: The case of BRICS. Development Studies Research, 8(1), 199–217. [Google Scholar] [CrossRef]
  46. Ganda, F. (2021b). The non-linear influence of trade, foreign direct investment, financial development, energy supply and human capital on carbon emissions in the BRICS. Environmental Science and Pollution Research, 28(41), 57825–57841. [Google Scholar] [CrossRef]
  47. Ganda, F. (2023). The influence of agricultural policy on carbon emissions in selected OECD countries. Heliyon, 9(9), e19881. [Google Scholar] [CrossRef]
  48. Giroud, A. (2024). World investment report 2023: Investing in sustainable energy for all: United Nations Conference on trade and development, Geneva and New York, 2023 (205p). Springer. [Google Scholar]
  49. Hariram, N., Mekha, K., Suganthan, V., & Sudhakar, K. (2023). Sustainalism: An integrated socio-economic-environmental model to address sustainable development and sustainability. Sustainability, 15(13), 10682. [Google Scholar] [CrossRef]
  50. Harter, J. K., Schmidt, F. L., Agrawal, S., Plowman, S. K., & Blue, A. (2013). The relationship between engagement at work and organizational outcomes (Gallup White Paper). Gallup, Inc. Available online: https://www.workcompprofessionals.com/advisory/2016L5/august/MetaAnalysis_Q12_ResearchPaper_0416_v5_sz.pdf (accessed on 15 January 2025).
  51. Hasan, M. B., Wieloch, J., Ali, M. S., Zikovic, S., & Uddin, G. S. (2023). A new answer to the old question of the environmental Kuznets Curve (EKC). Does it work for BRICS countries? Resources Policy, 87, 104332. [Google Scholar]
  52. Hidalgo, C. A., & Hausmann, R. (2009). The building blocks of economic Complexity. Proceedings of the National Academy of Sciences, 106(26), 10570–10575. [Google Scholar] [CrossRef] [PubMed]
  53. Hirlekar, O., Kolte, A., & Vasa, L. (2025). Transition in the mining industry with green energy: Economic dynamics in mining demand. Resources Policy, 100, 105409. [Google Scholar] [CrossRef]
  54. Hu, R., Chen, K., Fang, W., Zheng, L., & Xu, J. (2022). The technology-environment relationship revisited: Evidence from the impact of prefabrication on reducing construction waste. Journal of Cleaner Production, 341, 130883. [Google Scholar] [CrossRef]
  55. Huang, L., Ning, Z., Wang, Q., Zhang, W., Cheng, Z., Wu, X., & Qin, H. (2018). Effect of organic type and moisture on CO2/CH4 competitive adsorption in kerogen with implications for CO2 sequestration and enhanced CH4 recovery. Applied Energy, 210, 28–43. [Google Scholar] [CrossRef]
  56. Huisingh, D., Zhang, Z., Moore, J. C., Qiao, Q., & Li, Q. (2015). Recent advances in carbon emissions reduction: Policies, technologies, monitoring, assessment and modeling. Journal of Cleaner Production, 103, 1–12. [Google Scholar] [CrossRef]
  57. IEA. (2020). World energy outlook 2020. IEA. Available online: https://www.iea.org/reports/world-energy-outlook-2020 (accessed on 15 January 2025).
  58. Jamatutu, S. A., Abbass, K., Song, H., Gawusu, S., & Yeboah, K. E. (2024). Longitudinal trajectory of technological growth in Sub-Sahara Africa: New insights for achieving carbon dioxide emissions reduction and environmental sustainability. Environment, Development and Sustainability, 1–29. [Google Scholar] [CrossRef]
  59. Kartal, M. T., & Pata, U. K. (2023). Impacts of renewable energy, trade globalization, and technological innovation on environmental development in China: Evidence from various environmental indicators and novel quantile methods. Environmental Development, 48, 100923. [Google Scholar] [CrossRef]
  60. Ke, J., Jahanger, A., Yang, B., Usman, M., & Ren, F. (2022). Digitalization, financial development, trade, and carbon emissions; implication of pollution haven hypothesis during globalization mode. Frontiers in Environmental Science, 10, 873880. [Google Scholar] [CrossRef]
  61. Khan, A., & Ximei, W. (2022). Digital economy and environmental sustainability: Do Information Communication and Technology (ICT) and economic complexity matter? International Journal of Environmental Research and Public Health, 19(19), 12301. [Google Scholar] [CrossRef] [PubMed]
  62. Khan, H., Weili, L., & Khan, I. (2022). Examining the effect of information and communication technology, innovations, and renewable energy consumption on CO2 emission: Evidence from BRICS countries. Environmental Science and Pollution Research, 29(31), 47696–47712. [Google Scholar] [CrossRef]
  63. Kim, D.-H., Wu, Y.-C., & Lin, S.-C. (2025). Trade openness and green technology: The extent of trade openness and environmental policy matter. The Journal of International Trade & Economic Development, 34(3), 594–619. [Google Scholar]
  64. Kindo, M. D., Adams, A. A., & Mohammed, J. (2024). The impact of trade on environmental quality and sustainable development in Ghana. World Development Sustainability, 4, 100134. [Google Scholar] [CrossRef]
  65. Koilakou, E., Hatzigeorgiou, E., & Bithas, K. (2024). Social and economic driving forces of recent CO2 emissions in three major BRICS economies. Scientific Reports, 14(1), 8047. [Google Scholar] [CrossRef]
  66. Langhelle, O. (2000). Sustainable development and social justice: Expanding the Rawlsian framework of global justice. Environmental Values, 9(3), 295–323. [Google Scholar] [CrossRef]
  67. Lee, J. W., & Brahmasrene, T. (2014). ICT, CO2 emissions and economic growth: Evidence from a panel of ASEAN. Global Economic Review, 43(2), 93–109. [Google Scholar] [CrossRef]
  68. Lehtonen, M. (2004). The environmental–social interface of sustainable development: Capabilities, social capital, institutions. Ecological Economics, 49(2), 199–214. [Google Scholar] [CrossRef]
  69. Li, J. (2023). Environmental Kuznets curve, balanced growth, and influencing factors: Evidence from economic development in China. International Journal of Climate Change Strategies and Management, 16(3), 318–336. [Google Scholar] [CrossRef]
  70. Li, J., Shi, Y., & Song, X. (2024). The dynamics of digitalization and natural resources in shaping the sustainable development agenda in BRICS-T nations. Resources Policy, 91, 104866. [Google Scholar] [CrossRef]
  71. Liu, R., Gailhofer, P., Gensch, C.-O., Köhler, A., Wolff, F., Monteforte, M., Urrutia, C., Cihlarova, P., & Williams, R. (2019). Impacts of the digital transformation on the environment and sustainability. Issue Paper Under Task, 3, 2019. [Google Scholar]
  72. Liu, Z., Guan, D., Wei, W., Davis, S. J., Ciais, P., Bai, J., Peng, S., Zhang, Q., Hubacek, K., & Marland, G. (2015). Reduced carbon emission estimates from fossil fuel combustion and cement production in China. Nature, 524(7565), 335–338. [Google Scholar] [CrossRef]
  73. Mammadova, N., Belousova, V., & Vasa, L. (2025). Impact of economic institutions on banking stability: Evidence from CIS countries [Preprint]. SSRN. Available online: https://ssrn.com/abstract=5231915 (accessed on 15 January 2025).
  74. Marčeta, M., & Bojnec, Š. (2023). Trade openness, global competitiveness, and catching up between the European Union countries. Review of International Business and Strategy, 33(4), 691–714. [Google Scholar] [CrossRef]
  75. Martínez, J. M. G., Puertas, R., Martín, J. M. M., & Ribeiro-Soriano, D. (2022). Digitalization, innovation and environmental policies aimed at achieving sustainable production. Sustainable Production and Consumption, 32, 92–100. [Google Scholar] [CrossRef]
  76. Mughal, N., Arif, A., Jain, V., Chupradit, S., Shabbir, M. S., Ramos-Meza, C. S., & Zhanbayev, R. (2022). The role of technological innovation in environmental pollution, energy consumption and sustainable economic growth: Evidence from South Asian economies. Energy Strategy Reviews, 39, 100745. [Google Scholar] [CrossRef]
  77. Murshed, M. (2023). An empirical re-investigation for verifying the pollution haven hypothesis concerning the foreign direct investment-carbon intensity nexus: Contextual evidence from BRICS. Environmental Challenges, 13, 100793. [Google Scholar] [CrossRef]
  78. Nguyễn, H. V., & Phan, T. T. (2023). Impact of economic growth, international trade, and FDI on sustainable development in developing countries. Environment, Development and Sustainability, 27, 4017–4043. [Google Scholar] [CrossRef]
  79. Nunes, L. J. (2023). The rising threat of atmospheric CO2: A review on the causes, impacts, and mitigation strategies. Environments, 10(4), 66. [Google Scholar] [CrossRef]
  80. Nwani, C., Usman, O., Okere, K. I., & Bekun, F. V. (2023). Technological pathways to decarbonisation and the role of renewable energy: A study of European countries using consumption-based metrics. Resources Policy, 83, 103738. [Google Scholar] [CrossRef]
  81. Onyeneke, R. U., Chidiebere-Mark, N. M., & Ayerakwa, H. M. (2024). Impact of information and communication technologies and renewable energy consumption on carbon emissions in Africa. Carbon Research, 3(1), 53. [Google Scholar] [CrossRef]
  82. Pandey, N., & Pal, A. (2020). Impact of digital surge during COVID-19 pandemic: A viewpoint on research and practice. International Journal of Information Management, 55, 102171. [Google Scholar]
  83. Park, Y., Meng, F., & Baloch, M. A. (2018). The effect of ICT, financial development, growth, and trade openness on CO2 emissions: An empirical analysis. Environmental Science and Pollution Research, 25, 30708–30719. [Google Scholar] [CrossRef]
  84. Pedroni, P. (2004). Panel cointegration: Asymptotic and finite sample properties of pooled time series tests with an application to the PPP hypothesis. Econometric Theory, 20(3), 597–625. [Google Scholar] [CrossRef]
  85. Pesaran, M. H. (2007). A simple panel unit root test in the presence of cross-section dependence. Journal of Applied Econometrics, 22(2), 265–312. [Google Scholar] [CrossRef]
  86. Poulopoulos, S. (2016). Atmospheric Environment (Chapter 2). In S. G. Poulopoulos, & V. J. Inglezakis (Eds.), Environment and development, basic principles, human activities, and environmental implications (pp. 45–136). Elsevier Science. [Google Scholar]
  87. Pradhan, K. C., Mishra, B., & Mohapatra, S. M. (2024). Investigating the relationship between economic growth, energy consumption, and carbon dioxide (CO2) emissions: A comparative analysis of South Asian nations and G-7 countries. Clean Technologies and Environmental Policy, 26(10), 3349–3367. [Google Scholar] [CrossRef]
  88. Raghutla, C., & Chittedi, K. R. (2023). The effect of technological innovation and clean energy consumption on carbon neutrality in top clean energy-consuming countries: A panel estimation. Energy Strategy Reviews, 47, 101091. [Google Scholar] [CrossRef]
  89. Raheem, I. D., Tiwari, A. K., & Balsalobre-Lorente, D. (2020). The role of ICT and financial development in CO2 emissions and economic growth. Environmental Science and Pollution Research, 27(2), 1912–1922. [Google Scholar] [CrossRef]
  90. Raihan, A., Muhtasim, D. A., Khan, M. N. A., Pavel, M. I., & Faruk, O. (2022). Nexus between carbon emissions, economic growth, renewable energy use, and technological innovation towards achieving environmental sustainability in Bangladesh. Cleaner Energy Systems, 3, 100032. [Google Scholar] [CrossRef]
  91. Roy, J. K., & Vasa, L. (2025). Financial technology and environmental, social and governance in sustainable finance: A bibliometric and thematic content analysis. Discover Sustainability, 6(1), 1–22. [Google Scholar] [CrossRef]
  92. Saleem, H., Khan, M. B., & Mahdavian, S. M. (2023). The role of economic growth, information technologies, and globalization in achieving environmental quality: A novel framework for selected Asian countries. Environmental Science and Pollution Research, 30(14), 39907–39931. [Google Scholar] [CrossRef] [PubMed]
  93. Shabani, Z. D., & Shahnazi, R. (2019). Energy consumption, carbon dioxide emissions, information and communications technology, and gross domestic product in Iranian economic sectors: A panel causality analysis. Energy, 169, 1064–1078. [Google Scholar] [CrossRef]
  94. Shahzad, A., Hassan, R., Aremu, A. Y., Hussain, A., & Lodhi, R. N. (2021). Effects of COVID-19 in E-learning on higher education institution students: The group comparison between male and female. Quality & Quantity, 55, 805–826. [Google Scholar]
  95. Shaikh, S. S., Amin, N., Shabbir, M. S., & Song, H. (2024). Going green in ASEAN: Assessing the role of eco-innovation, green energy, industrialization, and environmental taxes in achieving carbon neutrality. Sustainable Development. [Google Scholar] [CrossRef]
  96. Shan, Y., Guan, D., Liu, J., Mi, Z., Liu, Z., Liu, J., Schroeder, H., Cai, B., Chen, Y., & Shao, S. (2017). Methodology and applications of city level CO2 emission accounts in China. Journal of Cleaner Production, 161, 1215–1225. [Google Scholar] [CrossRef]
  97. Shang, M., Peng, M. Y.-P., Anser, M. K., Imran, M., Nassani, A. A., Binsaeed, R. H., & Zaman, K. (2024). Evaluating the U-shaped environmental kuznets curve in China: The impact of high technology exports and renewable energy consumption on carbon emissions. Gondwana Research, 127, 272–287. [Google Scholar] [CrossRef]
  98. Shuai, C., Chen, X., Wu, Y., Tan, Y., Zhang, Y., & Shen, L. (2018). Identifying the key impact factors of carbon emission in China: Results from a largely expanded pool of potential impact factors. Journal of Cleaner Production, 175, 612–623. [Google Scholar] [CrossRef]
  99. Statista. (2024). Primary energy consumption worldwide in 2023, by country. Available online: https://www.statista.com/statistics/263455/primary-energy-consumption-of-selected-countries/ (accessed on 15 January 2025).
  100. Tao, R., Liu, Y., & Wang, X. (2023). How does financial development influence carbon emission intensity in the OECD countries: Some insights from the information and communication technology perspective. Environmental Science and Pollution Research, 30(12), 12345–12360. [Google Scholar] [CrossRef]
  101. Tiwari, A. K., & Menegaki, A. N. (2024). Editorial special issue: Novel longitudinal data research methods in renewable energy use and management. Journal of Environmental Management, 335, 117553. [Google Scholar] [CrossRef]
  102. Truong, T. C. (2022). The impact of digital transformation on environmental sustainability. Advances in Multimedia, 2022(1), 6324325. [Google Scholar] [CrossRef]
  103. Udeagha, M. C., & Ngepah, N. (2023). The drivers of environmental sustainability in BRICS economies: Do green finance and fintech matter? World Development Sustainability, 3, 100096. [Google Scholar] [CrossRef]
  104. van Benthem, A. A. (2015). Energy leapfrogging. Journal of the Association of Environmental and Resource Economists, 2(1), 93–132. [Google Scholar] [CrossRef]
  105. Wang, T., Ma, M., Zhou, N., & Ma, Z. (2025). Toward net zero: Assessing the decarbonization impact of global commercial building electrification. Applied Energy, 383, 125287. [Google Scholar] [CrossRef]
  106. Westerlund, J. (2007). Testing for error correction in panel data. Oxford Bulletin of Economics and Statistics, 69(6), 709–748. [Google Scholar] [CrossRef]
  107. Westerlund, J. (2008). Panel cointegration tests of the Fisher effect. Journal of Applied Econometrics, 23(2), 193–233. [Google Scholar] [CrossRef]
  108. World Bank. (2024). World development indicators. Available online: https://databank.worldbank.org/source/world-development-indicators (accessed on 15 January 2025).
  109. World Trade Organization. (2024). Information on trade and trade policy measures. WTO Data. Available online: https://data.wto.org/en (accessed on 15 January 2025).
  110. Wu, C.-F., Chang, T., Wu, T.-P., Leng, K.-j., Lin, M.-C., & Huang, S.-C. (2022). Impact of globalization on the environment in major CO2-emitting countries: Evidence using bootstrap ARDL with a Fourier function. Frontiers in Public Health, 10, 907403. [Google Scholar] [CrossRef]
  111. Yamanoshita, M. (2019). IPCC special report on climate change and land. JSTOR. [Google Scholar]
  112. Yan, R., Zhou, N., Ma, M., & Mao, C. (2025). India’s residential space cooling transition: Decarbonization ambitions since the turn of millennium. Applied Energy, 391, 125929. [Google Scholar] [CrossRef]
  113. Yilmaz, F., & Uysal, P. (2022). The role of information communication technologies on carbon emissions in OECD countries: New evidence from method of moments quantile approach. Environmental Science and Pollution Research, 29(54), 81396–81417. [Google Scholar] [CrossRef]
  114. Yingchao, H., & Xiang, Y. (2024). Influence of trade liberalization and digital trade on material footprint in the BRICS region. Resources Policy, 88, 104374. [Google Scholar] [CrossRef]
  115. Yu, H., & Liu, H. (2024). Impact of digitization on carbon productivity: An empirical analysis of 136 countries. Scientific Reports, 14(1), 5094. [Google Scholar] [CrossRef] [PubMed]
  116. Yu, H., & Zhu, Q. (2023). Impact and mechanism of digital economy on China’s carbon emissions: From the perspective of spatial heterogeneity. Environmental Science and Pollution Research, 30(4), 9642–9657. [Google Scholar] [CrossRef] [PubMed]
  117. Yu, J., Liu, P., Shi, X., & Ai, X. (2023). China’s emissions trading scheme, firms’ R&D investment and emissions reduction. Economic Analysis and Policy, 80, 1021–1037. [Google Scholar]
  118. Yuerong, H., Javaid, M. Q., Ali, M. S. e., & Zada, M. (2024). Revisiting the nexus between digital trade, green technological innovation, and environmental sustainability in BRICS economies. Environmental Science and Pollution Research, 31(6), 8585–8607. [Google Scholar] [CrossRef]
  119. Zeeshan Zafar, S., Zhilin, Q., Mabrouk, F., Ramirez-Asis, E., M Alzoubi, H., Hishan, S. S., & Michel, M. (2023). Empirical linkages between ICT, tourism, and trade towards sustainable environment: Evidence from BRICS countries. Economic Research-Ekonomska Istraživanja, 36(2), 2127417. [Google Scholar] [CrossRef]
  120. Zeraibi, A., Radulescu, M., Dembińska, I., & Çoban, M. N. (2024). The impact of China’s booming tech sector on environmental Sustainability: An analysis through the comprehensive CS-ARDL approach. Gondwana Research, 134, 245–261. [Google Scholar] [CrossRef]
  121. Zhang, J., & Yasin, I. (2024). Greening the BRICS: How Green Innovation Mitigates Ecological Footprints in Energy-Hungry Economies. Sustainability, 16(10), 3980. [Google Scholar] [CrossRef]
  122. Zhang, S., Kaikun, W., Yastrubskyi, M., & Huang, C. (2023). Carbon emissions from international trade and consumption: Assessing the role of cumulative risk for EU and Chinese economic development. Energy Strategy Reviews, 50, 101219. [Google Scholar] [CrossRef]
  123. Zhang, Y.-J., & Da, Y.-B. (2015). The decomposition of energy-related carbon emission and its decoupling with economic growth in China. Renewable and Sustainable Energy Reviews, 41, 1255–1266. [Google Scholar] [CrossRef]
  124. Zhang, Z., Malik, M. Z., Khan, A., Ali, N., Malik, S., & Bilal, M. (2022). Environmental impacts of hazardous waste, and management strategies to reconcile circular economy and eco-sustainability. Science of the Total Environment, 807, 150856. [Google Scholar] [CrossRef] [PubMed]
  125. Zhao, G., Guo, Y., & Bo, L. (2023). High-quality economic growth and carbon emissions in Chinese cities: The moderating role of fiscal policies. Digital Economy and Sustainable Development, 1(1), 19. [Google Scholar] [CrossRef]
  126. Zou, B., & Punjwani, A. (2025). Unraveling the dynamics of economic complexity, clean energy, globalization, and natural resource use for sustainable development: Insights from “Next 11” countries. Sustainability, 17(4), 1717. [Google Scholar] [CrossRef]
Figure 1. Consumption-based carbon emissions (BRICS).
Economies 13 00153 g001
Figure 2. Energy consumption in exajoules. Sources: Statista (2024).
Economies 13 00153 g002
Figure 3. Theoretical framework.
Economies 13 00153 g003
Figure 4. Visual presentation of results.
Economies 13 00153 g004
Table 1. Variables’ details.
VariableDefinitionUnit AdoptedSource
CO2 Emissions (LLC)Carbon dioxide emissions from fossil fuel combustion and industrial processes per capitaMetric tons per capitaIEA (2020)
Economic Complexity (EC)GDP per capita (proxy for productive capacity; distinct from the ECI)USDWorld Bank (2024) & Hidalgo & Hausmann (2009)
Information Technology (IT)Composite index of ICT access (Internet users, mobile subscriptions), affordability, and digital adoption in business/governmentIndex scoreWorld Bank (2024)
Trade Globalisation (TG)Trade openness (exports + imports as % of GDP)Percentage (%)World Trade Organization (2024) & Giroud (2024)
Energy Consumption (ENV)Total primary energy consumption per capitaKilograms of oil equivalent per capitaBritish Petroleum (2024)
Table 2. Descriptive statistics.
VariableMeanMedianMaximumMinimumStd. Dev.
CO2 emissions3.572.2110.500.413.03
Economic Complexity10,200.003550.0056,700.00630.0015,000.00
Energy Consumption2.870.8715.410.164.20
Information Technology28.0021.0784.450.0025.51
Trade Globalisation69.3064.3297.0043.2614.67
Table 3. Principal components analysis.
NoEigenvalueDifferenceProportionC ValueC ProportionL IT Mob Tel F
12.391.850.802.390.800.620.600.50
20.540.470.182.930.98−0.27−0.440.86
30.07 0.023.001.00−0.740.670.11
Table 4. Cross-sectional dependence test.
VariableBreusch–Pagan LMPesaran Scaled LM
CO2 emissions64.03 *8.95 *
Economic Complexity66.48 *9.40 *
Energy Consumption82.66 *12.35 *
Information Technology265.08 *45.66 *
Trade Globalisation48.67 *6.15 *
* 1% significance.
Table 5. Multicollinearity test.
VariableToleranceVIF
Economic Complexity0.9171.091
Energy Consumption0.9781.021
Information Technology0.9621.039
Trade Globalisation0.9681.033
Table 6. Unit root tests.
VariableLevelFirst DifferencesLevelFirst Difference
CO2 emissions−1.34−4.17 *−1.08−3.26 *
Economic Complexity−1.52−3.91 *−2.33−4.04 *
Energy Consumption−1.87−4.00 *−1.15−4.12 *
Information Technology−1.94−3.22 *−2.46−3.22 *
Trade Globalisation−2.41−4.41 *−2.36−4.41 *
* 1% significance level.
Table 7. Westerlund (2007) cointegration test.
SchemeValueZ ValueProb.Robust Prob.
Gt−2.98 **−1.890.030.02
Ga−5.202.080.980.45
Pt−6.52 ***−1.570.060.05
Pa−6.070.600.730.19
** 5% significance level; *** 10% significance level.
Table 8. Westerlund (2008) cointegration test.
TestDHg Prob.DHp Prob.
−1.82 *0.04
−1.53 ***0.06
* 1% significance level; *** 10% significance level.
Table 9. Pedroni cointegration test.
Common AR Coefs. (Within-Dimension)Individual AR Coefs. (Between-Dimension)
StatisticProb.Weighted Stat.Prob.StatisticProb.
Panel v-stat−0.05−0.240.59Group rho-stat2.02
Panel rho-stat1.221.160.88Group PP-stat−3.86 *
Panel PP-stat−3.10 *−2.96 *0.00Group ADF-stat−3.67 *
Panel ADF-stat−3.52 *−2.93 *0.00
* 1% significance level.
Table 10. CUP-FM and CUP-BC estimation.
VariablesCUP-FM Coeff.T-Stat.CUP-BC Coeff.T-Stat.
Economic Complexity−0.046 *−14.23−0.033 *−11.57
Energy Consumption0.038 *16.020.023 *10.60
Information Technology−0.036 *−8.54−0.055 *−12.55
Trade Globalisation−0.024 *−10.91−0.024 *−12.94
* 1% significance level.
Table 11. Dumitrescu–Hurlin causality test.
Null HypothesisW-Stat.Prob.
Economic Complexity to CO2 emissions8.93 *0.0005
CO2 emissions to Economic Complexity2.820.6091
Energy Consumption to CO2 emissions7.43 **0.0122
CO2 emissions to Energy Consumption2.700.5563
Information Technology to CO2 emissions7.20 **0.0187
CO2 emissions to Information Technology3.590.9961
Trade Globalisation to CO2 emissions9.63 *0.0000
CO2 emissions to Trade Globalisation4.610.5099
* 1% significance level; ** 5% significance level.
Disclaimer/Publisher’s Note: The statements, opinions and data contained in all publications are solely those of the individual author(s) and contributor(s) and not of MDPI and/or the editor(s). MDPI and/or the editor(s) disclaim responsibility for any injury to people or property resulting from any ideas, methods, instructions or products referred to in the content.

