
Health Expenditure Shocks and Household Poverty Amidst COVID-19 in Uganda: How Catastrophic?


Abstract
1. Introduction
2. Health Care Expenditure and Household Welfare
3. Methodology
3.1. Data
3.2. Theoretical Framework and Empirical Strategy
3.2.1. CHE Headcount ()
3.2.2. CHE Poverty Gap ()
3.2.3. The Impoverishing Effect of CHEs in the Pre- and COVID-19 Periods
3.2.4. Demographic and Socioeconomic Determinants of OOPs
3.2.5. The Effect of Catastrophic Health Expenditures on Household Welfare
4. Results
Foregone or Substituted Care?
5. Conclusions
Author Contributions
Funding
Institutional Review Board Statement
Informed Consent Statement
Data Availability Statement
Acknowledgments
Conflicts of Interest
Appendix A
Appendix A.1. Weighting of Regressions (Summary of Survey Regressions)

| Regression | y = LogOOP | y = LogFoodExpenditure |
|---|---|---|
| Number of strata | 17 | 17 |
| Number of PSUs | 4061 | 4061 |
| Number of observations | 4061 | 4061 |
| Design df | 4044 | 4044 |
| F(19, 4026), F(24, 4021) | 36.05 | 171.79 |
| Prob > F | 0.0000 | 0.0000 |
| Population size (No. of Households) | 2,663,969 | 2,663,969 |
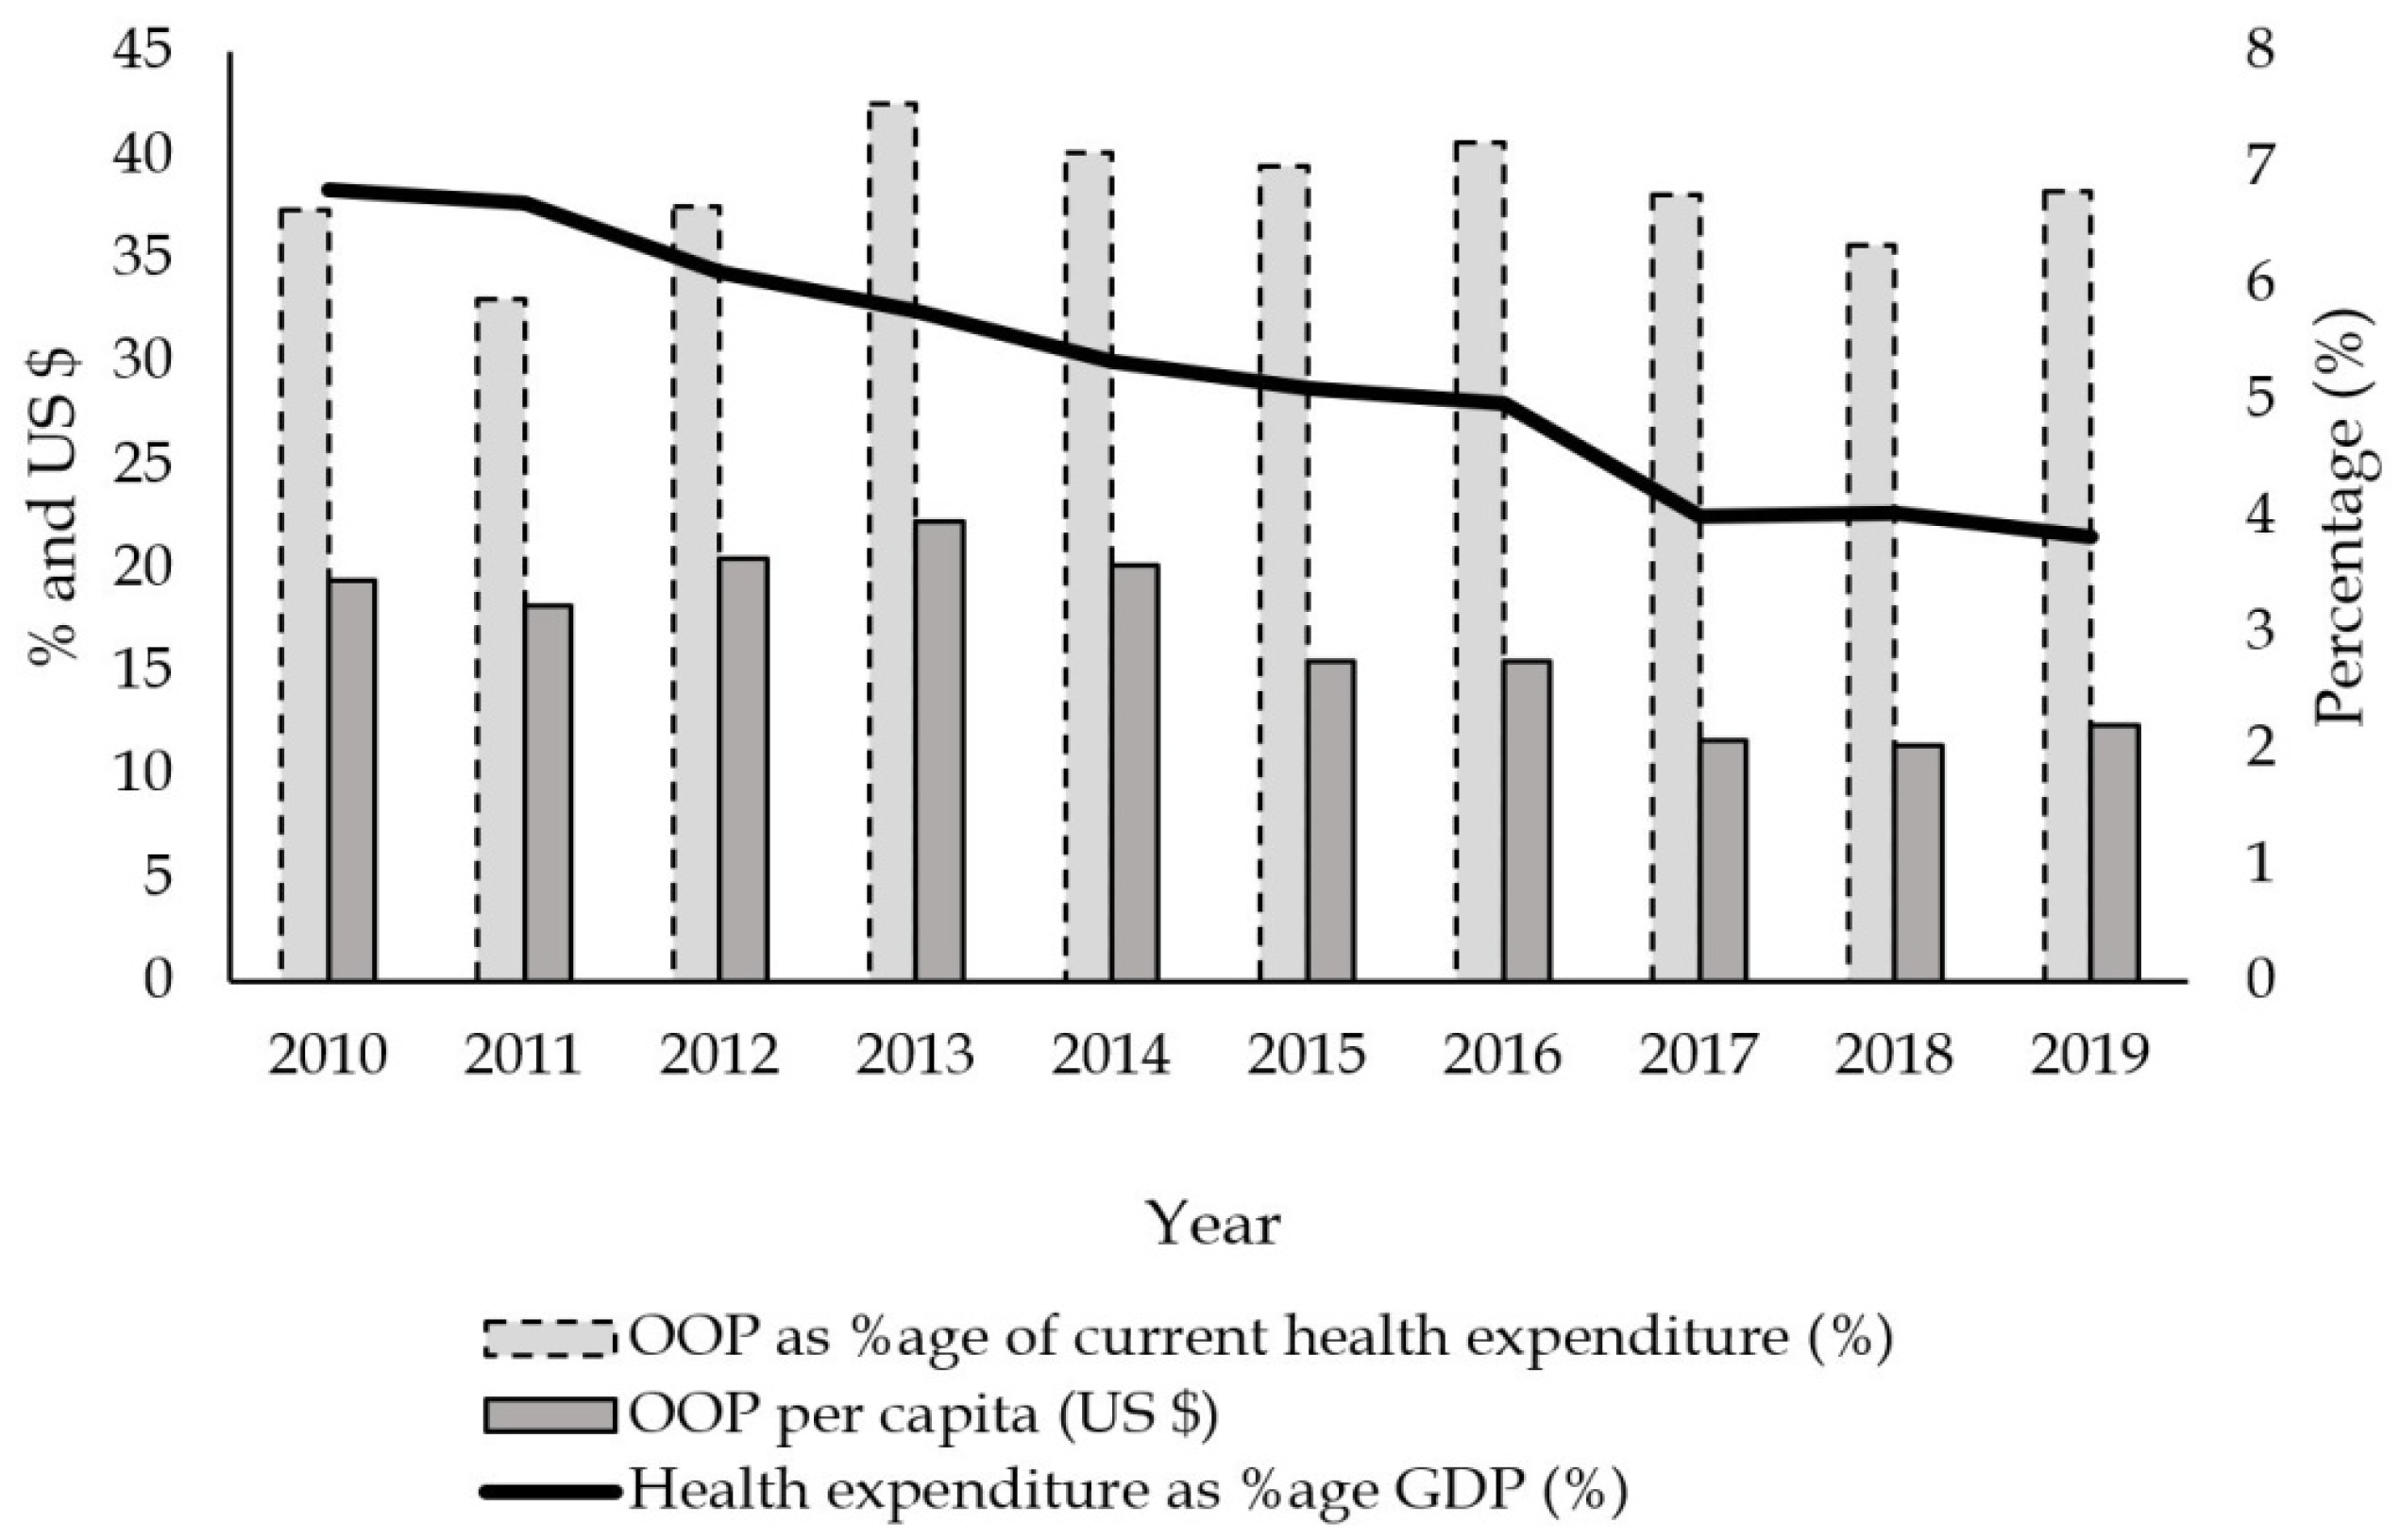
Appendix A.2. Out-of-Pocket Payments vs. Public Health Expenditure
Appendix A.3. Distance, Number of Times Experiencing Sickness, and Household Size Across the Quantiles

Appendix A.4. Variance Inflation Factor
| y = LogOOP | ||
| Variable | VIF | 1/VIF |
| Eastern region | 2.09 | 0.478 |
| Northern region | 1.905 | 0.525 |
| Western region | 1.777 | 0.563 |
| Widow/widower | 1.432 | 0.698 |
| HH with elder > 65 yrs | 1.258 | 0.795 |
| Never married | 1.211 | 0.826 |
| Female | 1.174 | 0.851 |
| NCD | 1.153 | 0.867 |
| Household size | 1.153 | 0.868 |
| Divorced/separated | 1.141 | 0.877 |
| Smoker | 1.108 | 0.902 |
| Married polygamous | 1.088 | 0.919 |
| Distance (>8 km) | 1.085 | 0.922 |
| Urban | 1.082 | 0.924 |
| Distance (3–<5 km) | 1.077 | 0.928 |
| Public facility | 1.076 | 0.929 |
| Malaria | 1.056 | 0.947 |
| In-COVID-19 | 1.038 | 0.964 |
| Distance (5–<8 km) | 1.031 | 0.97 |
| Mean VIF | 1.260 | |
| y = LogFoodExpenditure | ||
| Variable | VIF | 1/VIF |
| Income quintile 5 | 3.225 | 0.31 |
| Income quintile 4 | 2.55 | 0.392 |
| Income quintile 3 | 2.367 | 0.422 |
| Eastern region | 2.157 | 0.464 |
| Income quintile 2 | 2.048 | 0.488 |
| Northern region | 1.982 | 0.504 |
| Western region | 1.803 | 0.554 |
| Widow/widower | 1.437 | 0.696 |
| Log health expenditure | 1.426 | 0.701 |
| Household size | 1.308 | 0.765 |
| HH with elder > 65 yrs | 1.269 | 0.788 |
| Distance (>8 km) | 1.226 | 0.816 |
| Never married | 1.217 | 0.822 |
| Female | 1.184 | 0.845 |
| NCD | 1.16 | 0.862 |
| Divorced/separated | 1.145 | 0.873 |
| Urban | 1.137 | 0.88 |
| Public facility | 1.112 | 0.9 |
| Smoker | 1.111 | 0.9 |
| Distance (3–<5 km) | 1.102 | 0.907 |
| Married polygamous | 1.09 | 0.917 |
| Distance (5–<8 km) | 1.062 | 0.942 |
| Malaria | 1.06 | 0.943 |
| In-COVID-19 | 1.04 | 0.961 |
| Mean VIF | 1.509 | |
| The variance inflation factor is defined as . Source: data from the UNHS 2019/20. | ||
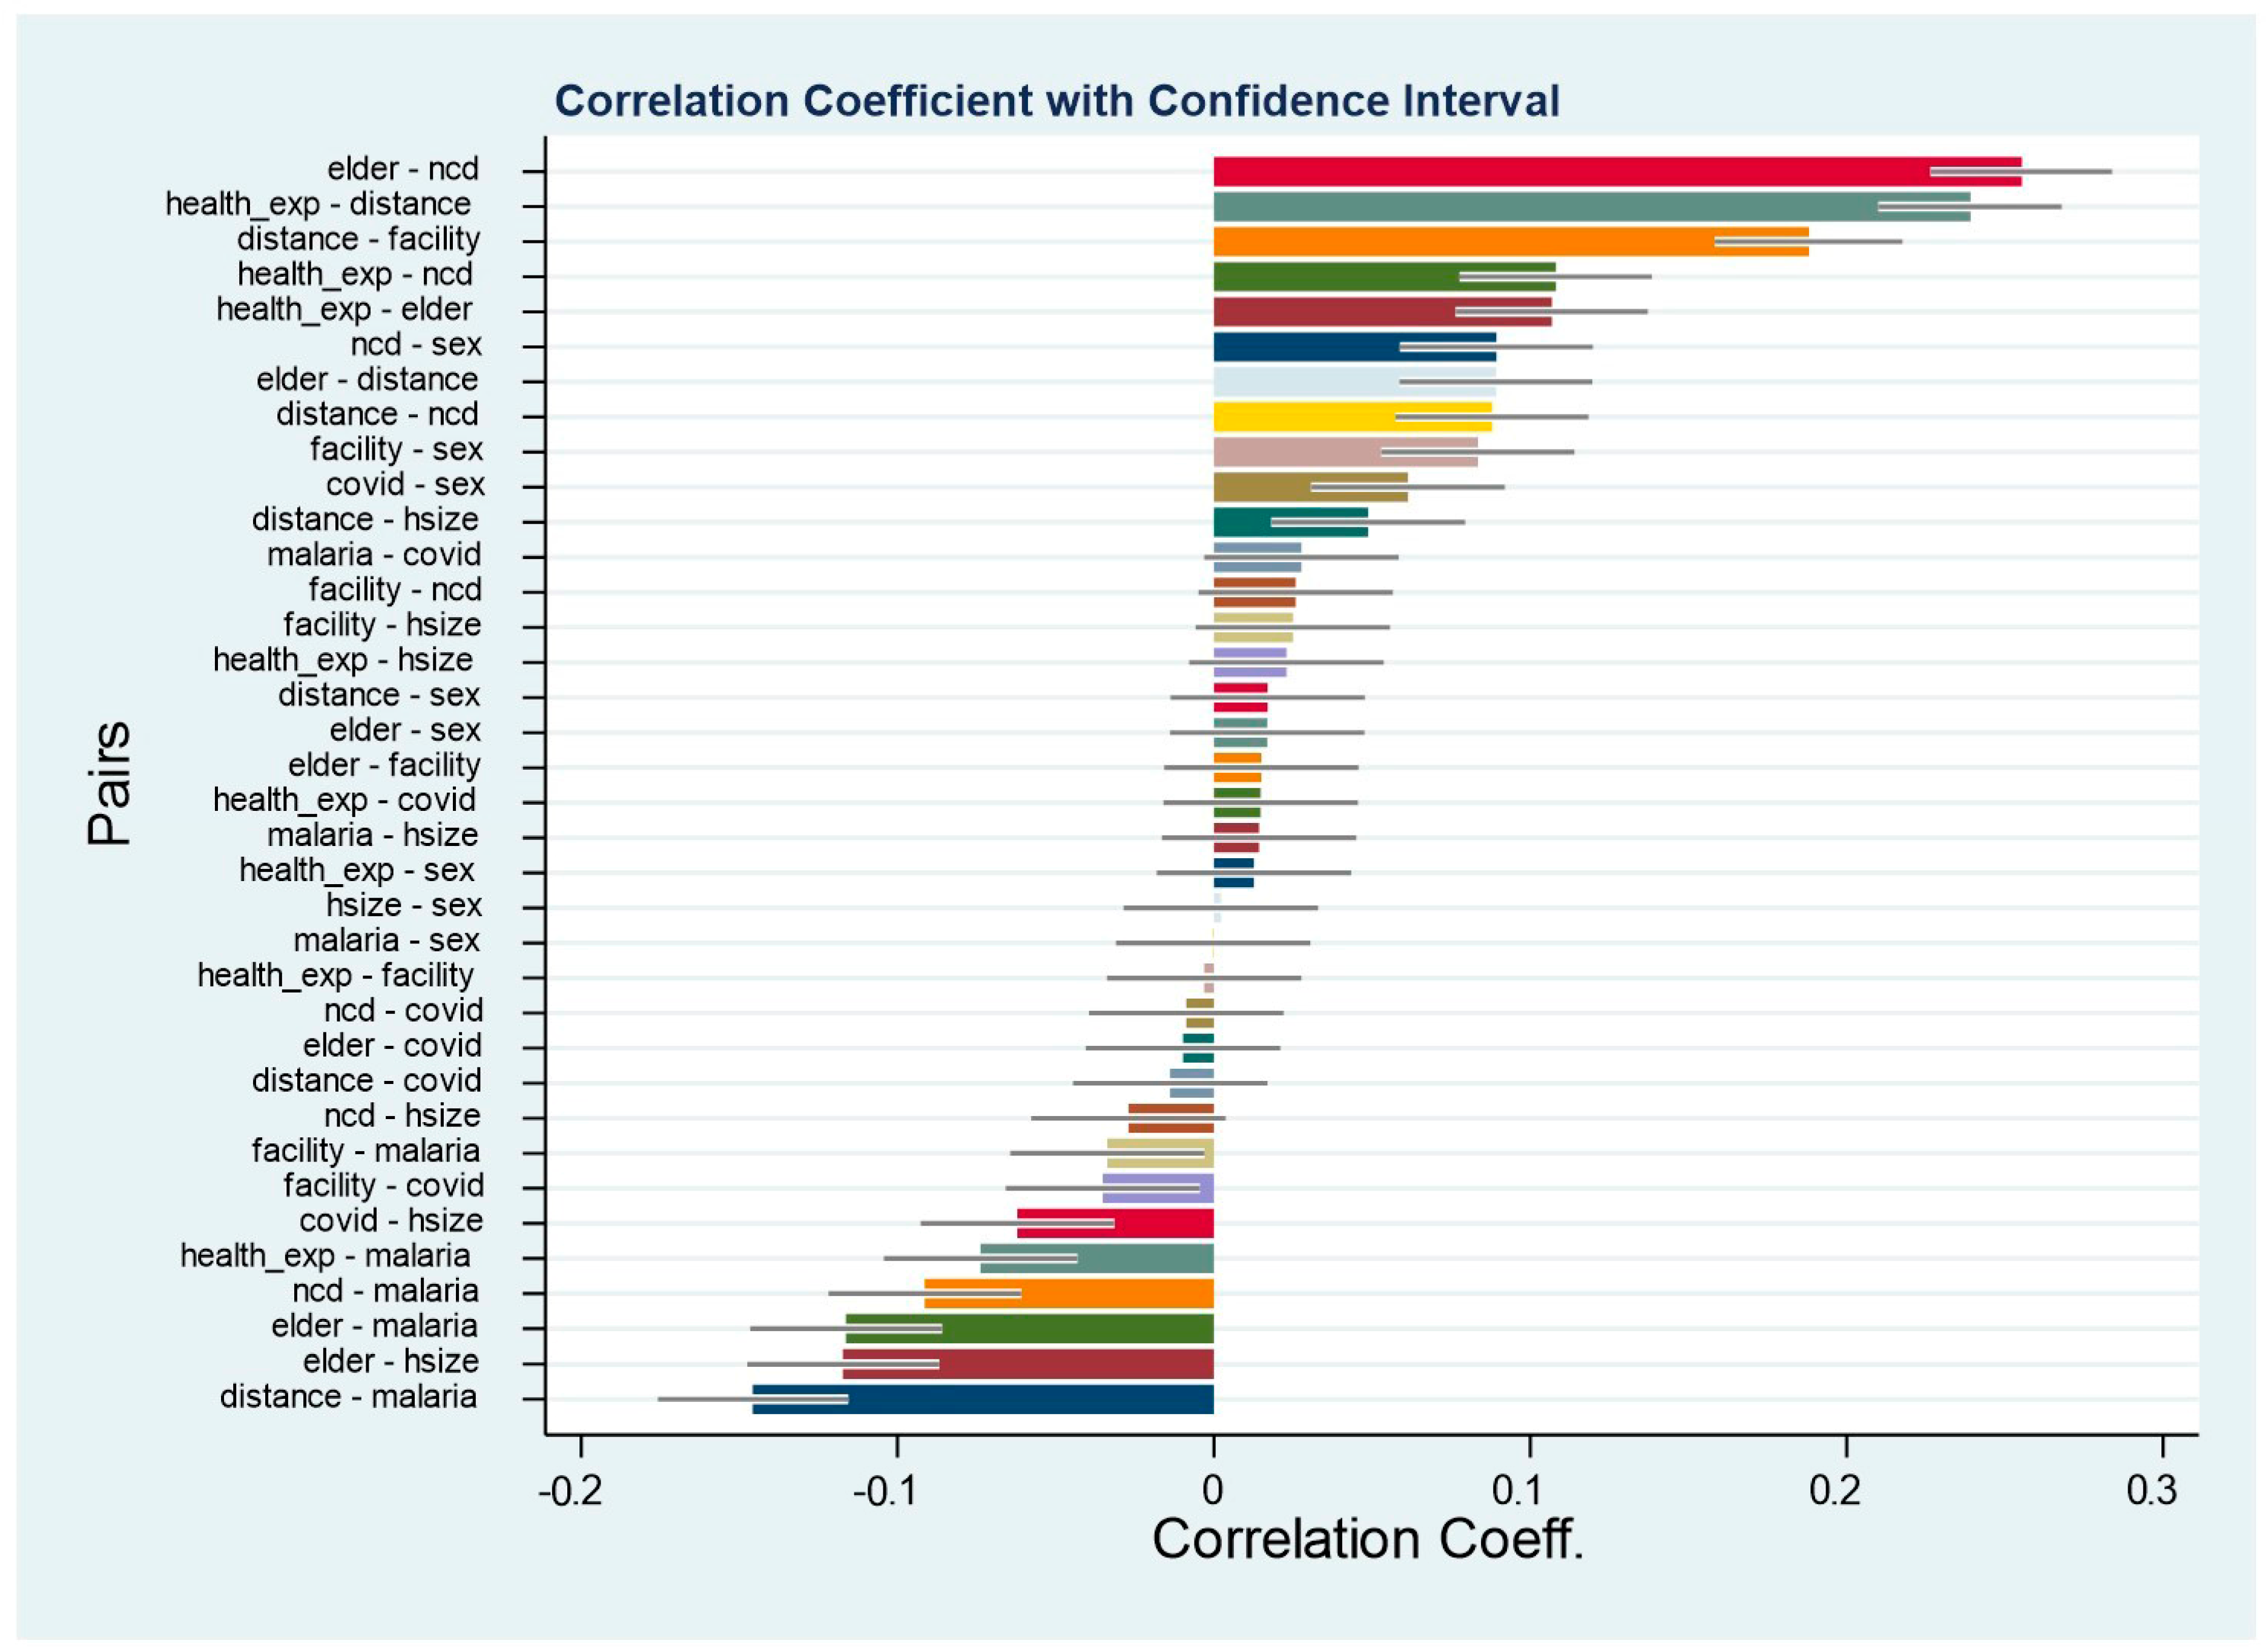
Appendix A.5. Pairwise Correlation Coefficients
| 1 | See Mpuuga and Eshete (2022) and Mpuuga et al. (2019) for a review of the health care financing double jeopardy faced by households in the wake of limited health insurance coverage and an upsurge of noncommunicable diseases. |
| 2 | The government of Uganda abolished user fees for all public health units on 1 March 2001. |
| 3 | Our instrument was generated from the question, which was asked verbatim, “How many times did [NAME] fall sick during the last 30 days?”. Since all our expenditure estimates are measured monthly, we consider the median number of times of falling sick within a household in a month. Considering that our unit of analysis is a household and not an individual, we take the median number of times for each unique household. We do not consider the average to avoid underestimating the health expenditure burden in the event a household has a common sickly person when the rest of the members rarely fall sick. |
References
- Alam, K., & Mahal, A. (2014). Economic impacts of health shocks on households in low- and middle-income countries: A review of the literature. Globalization and Health, 10(1), 1–18. [Google Scholar] [CrossRef] [PubMed]
- Aregbeshola, B. S., & Khan, S. M. (2017). Determinants of impoverishment due to out-of-pocket payments in Nigeria. Journal of Ayub Medical College Abbottabad, 29(2), 194–199. [Google Scholar]
- Ataguba, J. E. O. (2012). Reassessing catastrophic health-care payments with a Nigerian case study. Health Economics, Policy and Law, 7(3), 309–326. [Google Scholar] [CrossRef] [PubMed]
- Atake, E. H. (2018). Health Shocks in Sub-Saharan Africa: Are the poor and uninsured households more vulnerable? Health Economics Review, 8(1), 26. [Google Scholar] [CrossRef] [PubMed]
- Bloom, D., & Canning, D. (2003). The health and poverty of nations: From theory to practice. Journal of Human Development, 4(1), 47–71. [Google Scholar] [CrossRef]
- Cameron, A. C., & Trivedi, K. P. (2005). Microeconometrics methods and applications. Cambridge University Press. [Google Scholar]
- Green, H. W. (2012). Econometric analysis (7th ed.). Pearson Education Inc. [Google Scholar]
- Gujarati, N. D., & Porter, C. D. (2009). Basic econometrics (5th ed.). McGraw-Hill International. [Google Scholar]
- Gupta, I., & Mitra, A. (2004). Economic growth, health and poverty: An exploratory study for India. Development Policy Review, 22(2), 193–206. [Google Scholar] [CrossRef]
- Kwesiga, B., Aliti, T., Nabukhonzo, P., Najuko, S., Byawaka, P., Hsu, J., & Kabaniha, G. (2020). What has been the progress in addressing financial risk in Uganda? Analysis of catastrophe and impoverishment due to health payments. BMC Health Services Research, 20(1), 741. [Google Scholar]
- Ministry of Health. (2021). Annual health sector performance report—Financial year 2020/21. Ministry of Health. [Google Scholar]
- Mpuuga, D., & Eshete, Z. S. (2022). Uncovered silent killers: The prevalence of non-communicable diseases and health insurance coverage in Uganda. African Journal of Economic Review, 10(1), 95–116. [Google Scholar]
- Mpuuga, D., Mbowa, S., & Odokonyero, T. (2019). Limited health insurance coverage amidst upsurge of non-communicable diseases in Uganda. Economic Policy Research Centre (EPRC). [Google Scholar]
- Mpuuga, D., Yawe, B. L., & Muwanga, J. (2020). Determinants of demand for health insurance in Uganda: An analysis of utilisation and willingness to pay. Tanzania Economic Review, 10(1), 1–22. [Google Scholar] [CrossRef]
- Nabyonga Orem, J., Mugisha, F., Okui, A. P., Musango, L., & Kirigia, J. M. (2013). Health care seeking patterns and determinants of out-of-pocket expenditure for malaria for the children under-five in Uganda. Malaria Journal, 12(1), 175. [Google Scholar] [CrossRef] [PubMed]
- Séne, L. M., & Cissé, M. (2015). Catastrophic out-of-pocket payments for health and poverty nexus: Evidence from Senegal. International Journal of Health Economics and Management, 15(3), 307–328. [Google Scholar] [CrossRef] [PubMed]
- Ssewanyana, S., & Kasirye, I. (2020). Estimating catastrophic health expenditures from household surveys: Evidence from living standard measurement surveys (LSMS)-integrated surveys on agriculture (ISA) from sub-Saharan Africa. Applied Health Economics and Health Policy, 18(6), 781–788. [Google Scholar] [CrossRef] [PubMed]
- Uganda Bureau of Statistics. (2021). Uganda national household survey 2019/2020. Uganda Bureau of Statistics. [Google Scholar]
- Wagstaff, A., & Doorslaer, E. V. (2003). Catastrophe and impoverishment in paying for health care: With applications to Vietnam 1993–1998. Health Economics, 12(11), 921–933. [Google Scholar] [CrossRef] [PubMed]
- Wasswa, H. (2021). Covid-19: Uganda’s low inpatient numbers mask high community infection as desperate patients turn to herbs. BMJ: British Medical Journal, 374, n1909. [Google Scholar] [CrossRef] [PubMed]
- Wooldridge, J. M. (2010). Econometric analysis of cross section and panel data. MIT press. [Google Scholar]
- World Health Organization. (2020). Monitoring health for sustainable development goals (SDGs). World Health Statistics. [Google Scholar]
- World Health Organization. (2022). Global health observatory database, 2022. World Health Organization. [Google Scholar]

| Variable | How It Is Captured in the UNHS 2019/20 |
|---|---|
| Consultation fees | Consultation fees (includes the fee for examining the patient and diagnosing the illness, e.g., lab test costs) |
| Medicines | Medicines, etc. |
| Hospital/clinic fees | Hospital/clinic charges |
| Traditional medicines fees | Traditional doctor’s fees/medicines |
| Transport | Transport to and from facility |
| Other expenses | Other expenses, e.g., overnight stay expenses |
| Expenses that cannot be broken down | Expenses that cannot be broken down |
| Total health expenditure | Total health and medical expenses |
| Variable | Mean | SD | Min | Max | N |
|---|---|---|---|---|---|
| Monthly HH health exp (UGX) | 45,145.6 | 18,3341.4 | 100 | 10,000,000 | 6147 |
| Monthly HH food exp (UGX) | 166,068.7 | 242,959.2 | 0 | 16,900,000 | 6147 |
| Total Monthly HH exp (UGX) | 372,128.3 | 720,510.8 | 1388 | 35,074,816 | 6147 |
| HH with elder > 65 years | 0.07 | 0.255 | 0 | 1 | 6147 |
| HH suffered from malaria | 0.498 | 0.5 | 0 | 1 | 6147 |
| Household size | 5.271 | 2.538 | 1 | 20 | 6147 |
| Distance to place of consultation 0 to <3 km | 0.767 | 0.423 | 0 | 1 | 5679 |
| 3 to <5 km | 0.133 | 0.34 | 0 | 1 | 5679 |
| 5 to <8 km | 0.043 | 0.202 | 0 | 1 | 5679 |
| >8 km | 0.057 | 0.232 | 0 | 1 | 5679 |
| Type of health facility visited Private facility | 0.71 | 0.454 | 0 | 1 | 5679 |
| Public facility | 0.29 | 0.454 | 0 | 1 | 5679 |
| HH with an NCD | 0.139 | 0.346 | 0 | 1 | 3793 |
| HH with a smoker | 0.071 | 0.257 | 0 | 1 | 3793 |
| Unable to read and write | 0.409 | 0.492 | 0 | 1 | 5119 |
| Able to read and/or write | 0.591 | 0.492 | 0 | 1 | 5119 |
| Married monogamous | 0.425 | 0.494 | 0 | 1 | 3793 |
| Married polygamous | 0.075 | 0.264 | 0 | 1 | 3793 |
| Divorced/separated | 0.086 | 0.28 | 0 | 1 | 3793 |
| Widow/widower | 0.118 | 0.322 | 0 | 1 | 3793 |
| Never married | 0.296 | 0.457 | 0 | 1 | 3793 |
| Rural | 0.775 | 0.418 | 0 | 1 | 6147 |
| Urban | 0.225 | 0.418 | 0 | 1 | 6147 |
| Central region | 0.187 | 0.39 | 0 | 1 | 6147 |
| Eastern region | 0.364 | 0.481 | 0 | 1 | 6147 |
| Northern region | 0.262 | 0.44 | 0 | 1 | 6147 |
| Western region | 0.186 | 0.389 | 0 | 1 | 6147 |
| Pre-COVID-19 | 0.58 | 0.494 | 0 | 1 | 6147 |
| In-COVID-19 | 0.42 | 0.494 | 0 | 1 | 6147 |
| Pre-COVID-19 | In-COVID-19 | t-Test | |||||
|---|---|---|---|---|---|---|---|
| Expenditure Category | Mean | SD | N | Mean | SD | N | |
| (A) | (B) | A–B | |||||
| Consultation fees | 2181.9 | 11,642.7 | 3567 | 1796.7 | 9205.5 | 2580 | 385.3 |
| Medicines | 30,799.4 | 68,054.2 | 3567 | 32,333.3 | 206,838 | 2580 | −1533.9 * |
| Hospital/clinic charges | 4387.5 | 47,099.2 | 3567 | 4313.9 | 45,441.2 | 2580 | 73.6 |
| Traditional doctor’s fees | 1164.3 | 20,423.4 | 3567 | 864.1 | 13,792.4 | 2580 | 300.1 |
| Transport to and from facilities | 5854.2 | 21,072.6 | 3567 | 5048.9 | 22,183.5 | 2580 | 805.3 |
| Other expenses | 6034.9 | 34,969.6 | 3567 | 3915.1 | 18,671.9 | 2580 | 2119.9 *** |
| Expenses not broken down | 15,560.4 | 101,329.5 | 3567 | 13,811.7 | 62,946.5 | 2580 | 1748.8 |
| Total HH health exp | 65,986.9 | 156,887.7 | 3567 | 62,083.8 | 240,554.5 | 2580 | 3903.2 |
| Threshold Level () | 10% | 25% | 40% |
|---|---|---|---|
| Headcount: () | 37.74% | 33.55% | 28.71% |
| Poverty gap: () | 31.29% | 26.17% | 21.74% |
| 82.92% | 78.01% | 75.75% |
| Pre-COVID-19 | In-COVID-19 | |||||
|---|---|---|---|---|---|---|
| Threshold Level () | 10% | 25% | 40% | 10% | 25% | 40% |
| ) | 38.07% | 33.85% | 28.98% | 37.28% | 33.13% | 28.33% |
| ) | 32.18% | 26.99% | 22.52% | 30.07% | 25.03% | 20.68% |
| 84.53% | 79.76% | 77.70% | 80.67% | 75.55% | 72.99% | |
| Weighted Percentage (%) | ||
|---|---|---|
| Reason for Not Seeking Medical Care (Consultation) | Pre-COVID-19 | COVID-19 |
| Illness mild | 27.1 | 23.6 |
| Facility too far | 8.9 | 10.8 |
| Hard to get to facility | 1.2 | 1.2 |
| Available facilities are costly | 1.8 | 2.7 |
| No qualified staff present | 0.1 | 0.2 |
| Staff attitude not good | 0.4 | 0.2 |
| Too busy/long waiting time | 0.9 | 0.8 |
| Facility inaccessible | 0.1 | 0.2 |
| Facility is closed | 0.6 | 0.3 |
| Drugs not available | 3.0 | 2.5 |
| Had medicine/drugs at home | 21.8 | 19.4 |
| Used herbs/home remedies | 11.4 | 12.0 |
| Lack of money/funds for consultation | 18.6 | 21.5 |
| Other | 3.9 | 4.7 |
| Total (% approx.) | 100.0 | 100.0 |
| Quantile Regressions | |||||
|---|---|---|---|---|---|
| LogOOP | OLS | Tobit | 25th Q | 50th Q | 75th Q |
| HH with elder > 65 years | 0.439 *** | 0.374 *** | 0.416 *** | 0.445 *** | 0.251 *** |
| (0.099) | (0.079) | (0.123) | (0.109) | (0.085) | |
| Distance to consultation (0–<3 km) 3 to <5 km | 0.604 *** | 0.609 *** | 0.712 *** | 0.693 *** | 0.571 *** |
| (0.082) | (0.064) | (0.103) | (0.091) | (0.072) | |
| 5 to <8 km | 1.069 *** | 1.127 *** | 1.423 *** | 1.215 *** | 1.009 *** |
| (0.113) | (0.106) | (0.167) | (0.148) | (0.116) | |
| >8 km | 1.947 *** | 1.901 *** | 2.211 *** | 1.873 *** | 1.718 *** |
| (0.107) | (0.082) | (0.136) | (0.121) | (0.095) | |
| Health facility visited (Private) Public facility | −0.520 *** | −0.493 *** | −0.624 *** | −0.622 *** | −0.353 *** |
| (0.062) | (0.050) | (0.078) | (0.069) | (0.054) | |
| HH with an NCD | 0.292 *** | 0.292 *** | 0.286 *** | 0.303 *** | 0.282 *** |
| (0.079) | (0.065) | (0.103) | (0.092) | (0.072) | |
| HH suffered from malaria | 0.139 *** | 0.114 *** | 0.269 *** | 0.168 *** | −0.0217 |
| (0.052) | (0.043) | (0.071) | (0.063) | (0.049) | |
| Household size | 0.016 * | 0.028 *** | 0.023 * | 0.035 *** | 0.023 ** |
| (0.009) | (0.008) | (0.014) | (0.012) | (0.009) | |
| Female | 0.120 ** | 0.102 ** | 0.099 | 0.121 * | 0.069 |
| (0.053) | (0.046) | (0.075) | (0.067) | (0.052) | |
| Urban | 0.485 *** | 0.458 *** | 0.424 *** | 0.553 *** | 0.441 *** |
| (0.064) | (0.053) | (0.086) | (0.076) | (0.059) | |
| HH with a Smoker | −0.059 | −0.121 | −0.163 | −0.112 | −0.216 ** |
| (0.095) | (0.081) | (0.138) | (0.122) | (0.096) | |
| Marital status (Married monogamous) Married polygamous | −0.045 | −0.027 | −0.135 | 0.049 | 0.131 |
| (0.089) | (0.079) | (0.126) | (0.111) | (0.087) | |
| Divorced/separated | −0.205 * | −0.104 | −0.265 ** | −0.104 | 0.0122 |
| (0.107) | (0.084) | (0.134) | (0.119) | (0.093) | |
| Widow/widower | −0.284 *** | −0.223 *** | −0.295 ** | −0.176 | −0.175 ** |
| (0.104) | (0.081) | (0.127) | (0.113) | (0.088) | |
| Never married | −0.066 | −0.133 ** | −0.097 | −0.156 * | −0.149 ** |
| (0.062) | (0.053) | (0.091) | (0.081) | (0.063) | |
| Region (Central) Eastern | −0.443 *** | −0.475 *** | −0.567 *** | −0.431 *** | −0.382 *** |
| (0.075) | (0.064) | (0.103) | (0.091) | (0.072) | |
| Northern | −0.388 *** | −0.452 *** | −0.352 *** | −0.482 *** | −0.472 *** |
| (0.076) | (0.066) | (0.110) | (0.097) | (0.076) | |
| Western | 0.166 ** | 0.162 ** | 0.268 ** | 0.163 | 0.109 |
| (0.079) | (0.067) | (0.114) | (0.101) | (0.079) | |
| COVID-19 dummy | 0.063 | 0.054 | 0.097 | 0.106 * | 0.010 |
| (0.051) | (0.043) | (0.071) | (0.063) | (0.049) | |
| Constant | 9.577 *** | 9.617 *** | 8.628 *** | 9.613 *** | 10.67 *** |
| (0.090) | (0.080) | (0.130) | (0.116) | (0.091) | |
| Observations | 4061 | 4061 | 4061 | 4061 | 4061 |
| Log-likelihood | −6962.4 | ||||
| Var(e.LogOOP) | 1.81 *** (0.039) | ||||
| Pseudo R-squared | 0.063 | 0.106 | 0.117 | 0.123 | |
| R-squared | 0.208 | ||||
| Logfood Expenditure | OLS | 2SLS | |
|---|---|---|---|
| 1st Stage (LogOOP) | IV Model (Logfoodexp) | ||
| LogOOP | −0.039 *** (0.007) | ||
| Med. No. of times sick | 0.0513 *** | −0.256 *** | |
| (0.0092) | (0.098) | ||
| Controls | Yes | Yes | Yes |
| COVID-19 | Yes | Yes | Yes |
| Constant | 10.37 *** | 8.061 *** | 12.14 *** |
| (0.069) | (0.124) | (0.803) | |
| Observations | 4061 | 4061 | 4061 |
| R-squared | 0.564 |
Disclaimer/Publisher’s Note: The statements, opinions and data contained in all publications are solely those of the individual author(s) and contributor(s) and not of MDPI and/or the editor(s). MDPI and/or the editor(s) disclaim responsibility for any injury to people or property resulting from any ideas, methods, instructions or products referred to in the content. |
© 2025 by the authors. Licensee MDPI, Basel, Switzerland. This article is an open access article distributed under the terms and conditions of the Creative Commons Attribution (CC BY) license (https://creativecommons.org/licenses/by/4.0/).
Share and Cite
Mpuuga, D.; Nakijoba, S.; Yawe, B.L. Health Expenditure Shocks and Household Poverty Amidst COVID-19 in Uganda: How Catastrophic? Economies 2025, 13, 149. https://doi.org/10.3390/economies13060149
Mpuuga D, Nakijoba S, Yawe BL. Health Expenditure Shocks and Household Poverty Amidst COVID-19 in Uganda: How Catastrophic? Economies. 2025; 13(6):149. https://doi.org/10.3390/economies13060149
Chicago/Turabian StyleMpuuga, Dablin, Sawuya Nakijoba, and Bruno L. Yawe. 2025. "Health Expenditure Shocks and Household Poverty Amidst COVID-19 in Uganda: How Catastrophic?" Economies 13, no. 6: 149. https://doi.org/10.3390/economies13060149
APA StyleMpuuga, D., Nakijoba, S., & Yawe, B. L. (2025). Health Expenditure Shocks and Household Poverty Amidst COVID-19 in Uganda: How Catastrophic? Economies, 13(6), 149. https://doi.org/10.3390/economies13060149