Abstract
When governments have more revenue, they can invest in infrastructure, such as the provision of electricity or clean fuels, which is more effective in well-governed countries. Here, we use an equilibrium correction model to empirically investigate the relationship between government revenue per capita, six indicators of quality of governance, and the proportion of the population with access to electricity and clean fuels, using an unbalanced panel dataset that includes nearly all countries in the world. The results suggest a strong effect over time: as government revenue increases, the provision of electricity and clean fuels increases, and the magnitude of this influence is mediated significantly by a country’s quality of governance. This model offers the ability to demonstrate the impact of increases and decreases in government revenue in an individual country, while accounting for the impact of revenue on governance and on the provision of electricity and clean fuels.
1. Introduction
The 2030 Agenda for Sustainable Development was adopted by all countries in 2015 and has established a framework for the development of all people and the planet. The 17 Sustainable Development Goals (SDGs) provide countries and the global community with a blueprint for achieving these goals. Access to electricity and clean cooking fuels is critical for achieving SDGs and profoundly impacts economic and social well-being downstream. Recognising energy as a critical driver of economic growth and development, SDG 7 aims to achieve universal access to electricity and clean cooking solutions, particularly in underserved communities in developing countries.
However, as of 2022, there are almost 700 million people (9% of the global population, but with a decrease from 22% in 2000) that do not have access to electricity and 2.1 billion people (26% of the global population, but with a decrease from 36% in 2015) without access to clean fuels and cooking technologies (such as stoves powered by electricity, liquefied petroleum gas, natural gas, biogas, or ethanol) who use unprocessed biomass (wood, crop waste, and dung) (Tracking SDG 7, 2024). Clean cooking fuels are defined as those that emit less than the World Health Organization (WHO)-recommended amounts of air pollutants (specifically particulate matter).
Global and national disparities exist in energy access. Many people, particularly in Sub-Saharan Africa, do not have access; for example, in Niger, Chad, South Sudan, and the DRC, less than 20% of the population has access (Ritchie et al., 2024). In many countries, less than 10% of the population uses clean cooking fuels, exposing themselves to dangerous indoor air pollution that disproportionately affects women and children. This gap is especially stark in rural areas, where millions of people rely on candles or kerosene for light and use traditional biomass for cooking and heating.
Access to electricity has the potential to alleviate poverty (SDG 1) (Asghar et al., 2022), as it enables economic activities, creates job opportunities, and enhances productivity. Access to electricity is associated with improved health outcomes at the individual, household, community, and institutional levels, operating via multiple pathways (Irwin et al., 2020) (SDG 3). For example, access to electricity contributes to educational attainment (Kelly et al., 2023) (SDG 4) and is particularly beneficial for girls and women, promoting gender equality in education (SDG 5) (Acheampong et al., 2024). Electricity also drives economic growth and decent work (SDG 8) by attracting foreign direct investment (Atchike et al., 2020). Furthermore, it plays a vital role in fostering innovation and building resilient infrastructure (SDG 9), as modern industries depend on a reliable power supply for efficient operations. In urban settings, access to electricity is critical to the development of sustainable cities and communities (SDG 11). This improves living standards, facilitates smart city initiatives, and enhances urban resilience and sustainability. In addition, transitioning to renewable energy sources for electricity generation supports climate action (SDG 13) by reducing greenhouse gas emissions and aligning energy access with global climate goals.
However, there is little incentive for the private sector to provide electricity and clean energy universally, and, thus, it is a public good that requires government intervention and robust institutions (Borng et al., 2021).
2. A Review of the Empirical Literature on the Impact of Government Revenue and Governance on Access to Electricity and Clean Energy
2.1. Research Question
The purpose of this paper is to derive a set of equations for access to electricity and clean energy to be added to the large econometric model of the GRADE (Government Revenue and Development) project, which is available for development researchers to use online at St Andrews University. The models link government revenue and governance to access to electricity and clean energy. This literature review includes all papers which studied the relationship between government revenue, governance, and access to electricity and clean fuels found on Google Scholar.
The theoretical link between governance and electricity use and clean energy is straightforward. A well-governed country is able to allocate the total government revenue available to it in a more effective way than a poorly governed one. We use all six measures of the quality of governance available from the world governance indicators (WGIs), namely, the Control of Corruption, Government Effectiveness, Political Stability, Regulatory Quality, the Rule of Law and Voice, and Accountability. Potentially all of these can increase the efficiency in the use of a given level of government revenue: the Control of corruption will reduce the loss of revenue through direct corruption throughout the economy. Government Effectiveness will increase the efficiency of a government in implementing projects and obtaining a good value for money. Political Stability will also increase the efficiency of long-term planning and investments and in extreme cases avoid the destructive effects of civil war. Regulatory Quality will also help to create a stable environment for long-term investment. Voice and Accountability will help to create a system of an open and transparent government which will help to promote good governance generally. Of course, there is substantial overlap between these measures in terms of what they capture, and they often move together. We therefore adopt a pragmatic approach of initially including them all in a model and then letting the data decide which are most effective.
2.2. Governance and Electricity and Clean Energy
Governments play a central role in the provision of electricity as it is a natural monopoly and requires priority setting, the legal framework, regulations, long-term planning goals, and large-scale investments with public finance (Bhattacharyya, 2012) often requiring a combination of public spending, taxation, and sometimes partnerships with private enterprises. Governance mediates the relationship between government revenue and the electricity supply. Well-governed countries with robust economic institutions allocate public funds more effectively, whereas poorly governed countries lead to inefficiencies or corruption which impede economic and social development (Acemoglu et al., 2005).
Best and Burke used a cross-sectional regression approach for 135 low- and middle-income countries and found Government Effectiveness to be the most important aspect of governance in the transition to electrification (Best & Burke, 2017). Sarkodie and Adams used a nonparametric regression analysis with Driscoll–Kraay standard errors to study access to electricity, income inequality, and the political system in African countries between 1990 and 2017. They found that reduced income inequality positively impacts access to electricity, and good governance reduces income inequality which improves access (Sarkodie & Adams, 2020).
Acheampong et al. used a two-step generalised method of moments (GMM) estimator on panel data from 43 African countries from 1990 to 2017 and found that income inequality reduced access to electricity and that governments have been ineffective in improving it. They concluded that political will is required to reduce energy poverty in Africa (Acheampong et al., 2022). Ahlborg et al. studied 44 African countries from 1996 to 2009 using a regression analysis and found that institutional quality has a significant and positive effect on the per capita household electricity consumption (Ahlborg et al., 2015).
While most studies have focused on Africa and access to clean fuels at the national level, Acheampong et al. studied access to electricity and clean fuels by rural populations in Latin America and the Caribbean. They used panel data for 34 countries for the years from 2000 to 2020 and asked two questions: Does governance increase access to electricity and clean cooking fuels in rural areas, and what role does democracy play? They modelled the impact of the six indicators of the quality of governance from the Worldwide Governance Indicators (Kaufmann et al., 2010) on rural electricity poverty using a heteroscedasticity-based instrumental variable regression. The control variables included the GDP per capita, education, urbanisation, government expenditure, foreign direct investment, access to credit, and domestic savings. They find that the Control of Corruption, Government Effectiveness, the Rule of Law and Voice, and Accountability significantly reduce rural energy poverty (Acheampong et al., 2023). Aluko et al. studied access to electricity in 36 African countries using an instrumental variable approach with a GMM framework, and found that FDI and good governance positively impact access to electricity, and the impact of FDI is greater in well-governed countries (Aluko et al., 2023).
2.3. Democracy and Electricity and Clean Energy
While the role of improved governance in access to electricity and clean fuel seems clear, that of democracy is less clear. For example, a study by Acheampong et al. on rural electrification in Latin America and the Caribbean found that democracy indicators have an insignificant or negative impact on rural energy poverty, suggesting that the urban elite drives policy decisions in democracies (Acheampong et al., 2023). On the other hand, using a series of panel data and pooled OLS models, Trotter also found that increased democracy was associated with an increased rural electrification in Sub-Saharan Africa (Trotter, 2016), and Ahlborg et al. studied 44 African countries from 1996 to 2009, using a regression analysis and found that democracy has significant and positive effects on the per capita household consumption of electricity (Ahlborg et al., 2015). Borng et al. (2021) used a fractional logistic regression to study the impact of the number of years a country has been a democracy (1946–2002) and data on corruption in public administration on the proportion of the population living in unlit areas and found that democracy improved electrification, but only in countries with a low level of corruption.
Given the mixed evidence for an effect from democracy, we have decided not to include this in our general model especially as there is a large overlap between democracy and our six governance indicators.
2.4. Government Revenue and Electricity and Clean Energy
Thuy and Hoang studied the impact of government spending, the quality of governance (Government Effectiveness), and interactions between spending and governance on energy poverty in 77 countries across 5 continents. Indicators of energy poverty included the percentage of the population without access to clean fuels and technologies for cooking and the percentage of the population without access to electricity. They used a fixed-panel regression model and include several standard macroeconomic indicators as control variables. They found that government spending is negatively associated with energy poverty, and this effect is amplified in countries with more effective governments (Thuy & Hoang, 2023).
Nguea et al. studied the impact of FDI, foreign aid, and remittances on access to electricity in 36 African countries using panel data covering 2000–2017. They used a System GMM estimator to address potential endogeneity issues. They found that FDI and remittances increase access to electricity. Foreign aid reduces access in rural communities and increases rural–urban disparities, while remittances reduce disparities (Mbiankeu Nguea & Kaguendo, 2022).
Access to electricity also increases government revenue, as it increases tax morale, driving a virtuous circle. Blimpo et al. used data from the Afrobarometer survey, and an instrumental variable approach and found that access to reliable electricity improved the tax compliance attitudes of citizens in 36 countries in Sub-Saharan Africa (Blimpo et al., 2018). Mensah and Traore compared districts in Africa and explored the changes in FDI before and after the arrival of high-speed Internet via submarine cables with those not connected and found that FDI increased by 10–24%, particularly in the service sector (finance, technology, retail, and health services), and that FDI was higher where access to electricity was higher, as it is needed to power mobile phones and computers. Furthermore, they found that high-speed Internet was associated with an improved quality of governance which improves the scrutiny of citizens and the Accountability of governments (Mensah & Traore, 2024).
The literature indicates the important role of governance in access to electricity and clean fuel. Thuy and Hoang found that government spending reduces energy poverty; however, there are gaps in the understanding of how fiscal capacity and governance quality affect energy access outcomes at the level of an individual country.
3. Hypothesis, Rationale, and Aims
Hypothesis: If governments have additional revenue, the percentage of the population with access to electricity and clean energy increases, and this effect is amplified in countries with good governance.
Rationale: A model of the relationship between government revenue and governance on the access to electricity and clean fuels will allow an estimation of the increased coverage if an individual government has additional government revenue, if, for example, debt service or tax abuse is reduced or a government reduces tax expenditures.
Objective: To model the impact of government revenue and governance on access to electricity and clean cooking fuels at the country level.
4. The Data and the Model
The model estimated here is an unbalanced panel data model using data from 1980 to 2022 for 217 countries, that is almost every country in the world where any data exist. Of course, one weakness of this study is the raw data, which for some developing countries can be very sparse. All of the countries used have some data available, but, in some cases, this may be only for a few years. Given the panel nature of the estimation it was decided that it was better to have as many countries included as possible as this would improve the estimation of the governance effects from the very extreme countries even if there are only a few observations.
4.1. The Description of the Variables
4.1.1. Government Revenue
We used the latest update of the Government Revenue Database (GRD) (UNU-WIDER, 2023). The GRD has both the general and central government revenue (GR), and we use the latter. Data which include and exclude grants are available, and we use the total general GR, excluding grants, as this variable best reflects the capacity of domestic resource mobilisation. For the same reason, we used data that included social contributions, although these may be incomplete. The GRD expresses all data as a percentage of the GDP taken from the World Economic Outlook in Local Currency Units. We converted government revenue as a percentage of GDP into the government revenue per capita (GRpc) using the World Development Indicators for GDP per capita in the 2015 constant USD.
4.1.2. Governance Indicators
We employ six global governance indicators (WGIs). Each indicator is a composite score of multiple surveys, and each country is ranked on each indicator relative to the global average which is zero and ranges from −2.5 to +2.5 (Kaufmann & Kraay, 2023), see Appendix A for the definitions.
4.1.3. Electricity Use and Clean Fuels
We used the coverage of electricity from the World Development Indicators. This is the percentage of the population (both rural and urban) that has access to electricity. Electrification data were collected from industries, national surveys, and international sources. For access to clean fuels and technologies for cooking, we used the proportion of the total population primarily using clean cooking fuels and technologies for cooking from the World Development Indicators. According to WHO guidelines, kerosene is excluded from clean cooking fuels (World Bank, 2024).
4.2. The Model
In this section, we investigate the relationship between the government revenue per capita (GRpc) and the percentage of the population that has access to electricity and clean fuels. A standard linear model or log–log model with constant elasticities would be entirely inappropriate for these data. Such a model would suggest achieving rates above 100% for a sufficiently high GRpc, which is unacceptable. Furthermore, very low levels of government revenues would suggest the negative use of electricity and clean energy, which is also impossible. It is also likely that very-low-income countries would be unable to devote any resources to these factors, so that at very low levels of income, an increase in the GRpc would have little effect, while high-income countries would be close to a 100% provision, so further increases would also have virtually no effect. What we need, therefore, is a model with a broadly defined ‘S’ shape which starts with minimal effects for very low levels of GRpc and then has a period of rapid growth followed by a falling off as saturation is reached. This relationship is described by a broad family of functional forms, called sigmodals. The most widely used function in this family is the logistic function. Verhulst first used this function in a series of papers culminating in the main one in 1845. He was modelling population growth in Belgium; initially, the population was stable with no real change. As development starts, the population begins to grow increasingly rapidly, but then growth slows as a saturation point is reached, and, eventually, the population stabilises. This approach has found applications in many areas, including medicine, chemistry, physics, linguistics, agriculture, and economics. The basic form of the logistic function is
where
M is the maximum of the curve;
control the steepness and shape of the curve.
Therefore, the initial plan was to fit an unbalanced panel version of this logistic curve for electricity provision and clean fuels. This model worked reasonably well, but examining the fit for individual countries, we found that the model systematically overestimated low- and lower-middle-income countries. This finding suggests that the pooling assumption, that is, that the same curve can explain every country, does not hold in the data. Several options can be considered at this point. A standard approach within a panel data context is to add fixed effects to the model. However, this would violate the bounds of the logistic function, as if a country was to have a positive fixed effect and then the GRpc grew to the maximum of the curve, then the total would exceed 100%. Another possibility is to add additional exogenous variables to the model in a linear manner. Again, this could involve violating the bounds of the variables. Therefore, we adapted the basic logistic model by adding a set of exogenous variables to the function itself in the following way.
where is a k × 1 vector of exogenous variables and are 1 × k vectors of parameters. This allows the shape of the logistic curve to vary for each country depending on the variables in the vector.
We focus on the governance indicators from the WGIs, namely, the Control of Corruption, Government Effectiveness, Political Stability, Regulatory Quality, the Rule of Law and Voice, and Accountability. Our general approach was to enter all these variables into each equation for our three measures and then move from this general specification to a simpler one by eliminating all variables which proved insignificant. Therefore, we were able to determine which of these indicators of government quality was most relevant for each of our energy indicators.
A further issue which needs to be discussed is the causal nexus between governance and government revenue. Governance, SDGs, and government revenue are interlinked with a causality in all directions (Hall & O’Hare, 2023). The government revenue and development estimation (GRADE) model allows for this, as the SDGs and governance are fully endogenous in the complete model. However, in this estimation exercise, we may carry out a valid estimation under the assumption that the governance variables are weakly exogenous in the sense of Engle, Hendry, and Richard (Engle et al., 1983). They define three forms of exogeneity: weak, strong, and super exogeneity (a simple discussion of this may be found in Asteriou and Hall (Asteriou & Hall, 2021). Briefly, the variable Y is said to be weakly exogenous when, over time, it is affected by another variable, X, but that there is no contemporaneous feedback from X to Y. The variable Y is said to be strongly exogenous when, even over a period of time, there is no effect on Y from either contemporaneous or past values of X. And the variable Y is said to be super exogenous if the parameters of the true model generating Y do not vary when X changes. If a variable, such as governance, is weakly exogenous, then we do not need to allow for any feedback effects from government revenue or SDGs in the estimation, and we may treat it as an exogenous variable in the single-equation estimation. If a variable is not weakly exogenous, then a consistent estimation requires either a system estimator or an instrumental variable approach. Hall and O’Hare demonstrate that while governance responds to government revenue, it does so only slowly and over a long period of time (Hall & O’Hare, 2023). There is no contemporary effect of government revenue on governance variables. This is entirely intuitive, as governance clearly only changes slowly over time; hence, the governance variables are weakly exogenous and a single-equation estimation is a consistent estimation technique.
The final issue to discuss before turning to the empirical results is that we regard Equation (2) as a long-run relationship (formerly a non-linear cointegrating relationship; see Asteriou & Hall, 2021). This implies that we expect this relationship to hold over time, but not instantly. For example, if a poor country was suddenly given a very high level of GRpc, it would not be able to deliver the infrastructure to deliver more electricity provisions instantly, but would have to build this over time. This implies a process of dynamic adjustment, and we model it using the following dynamic adjustment equation:
where is either the electricity provision of clean energy use for country i in period t, is the fitted value from Equation (2) for that indicator, and is a standard error term . This is a simple form of an equilibrium correction model (ECM), which states that the change in the dependent variable is a function of the change in the last two periods and the discrepancy between where it was the last period and the long-run equilibrium. For stability, we require that should be negative and bigger than −1, which implies we are moving towards the long run equilibrium.
5. The Results
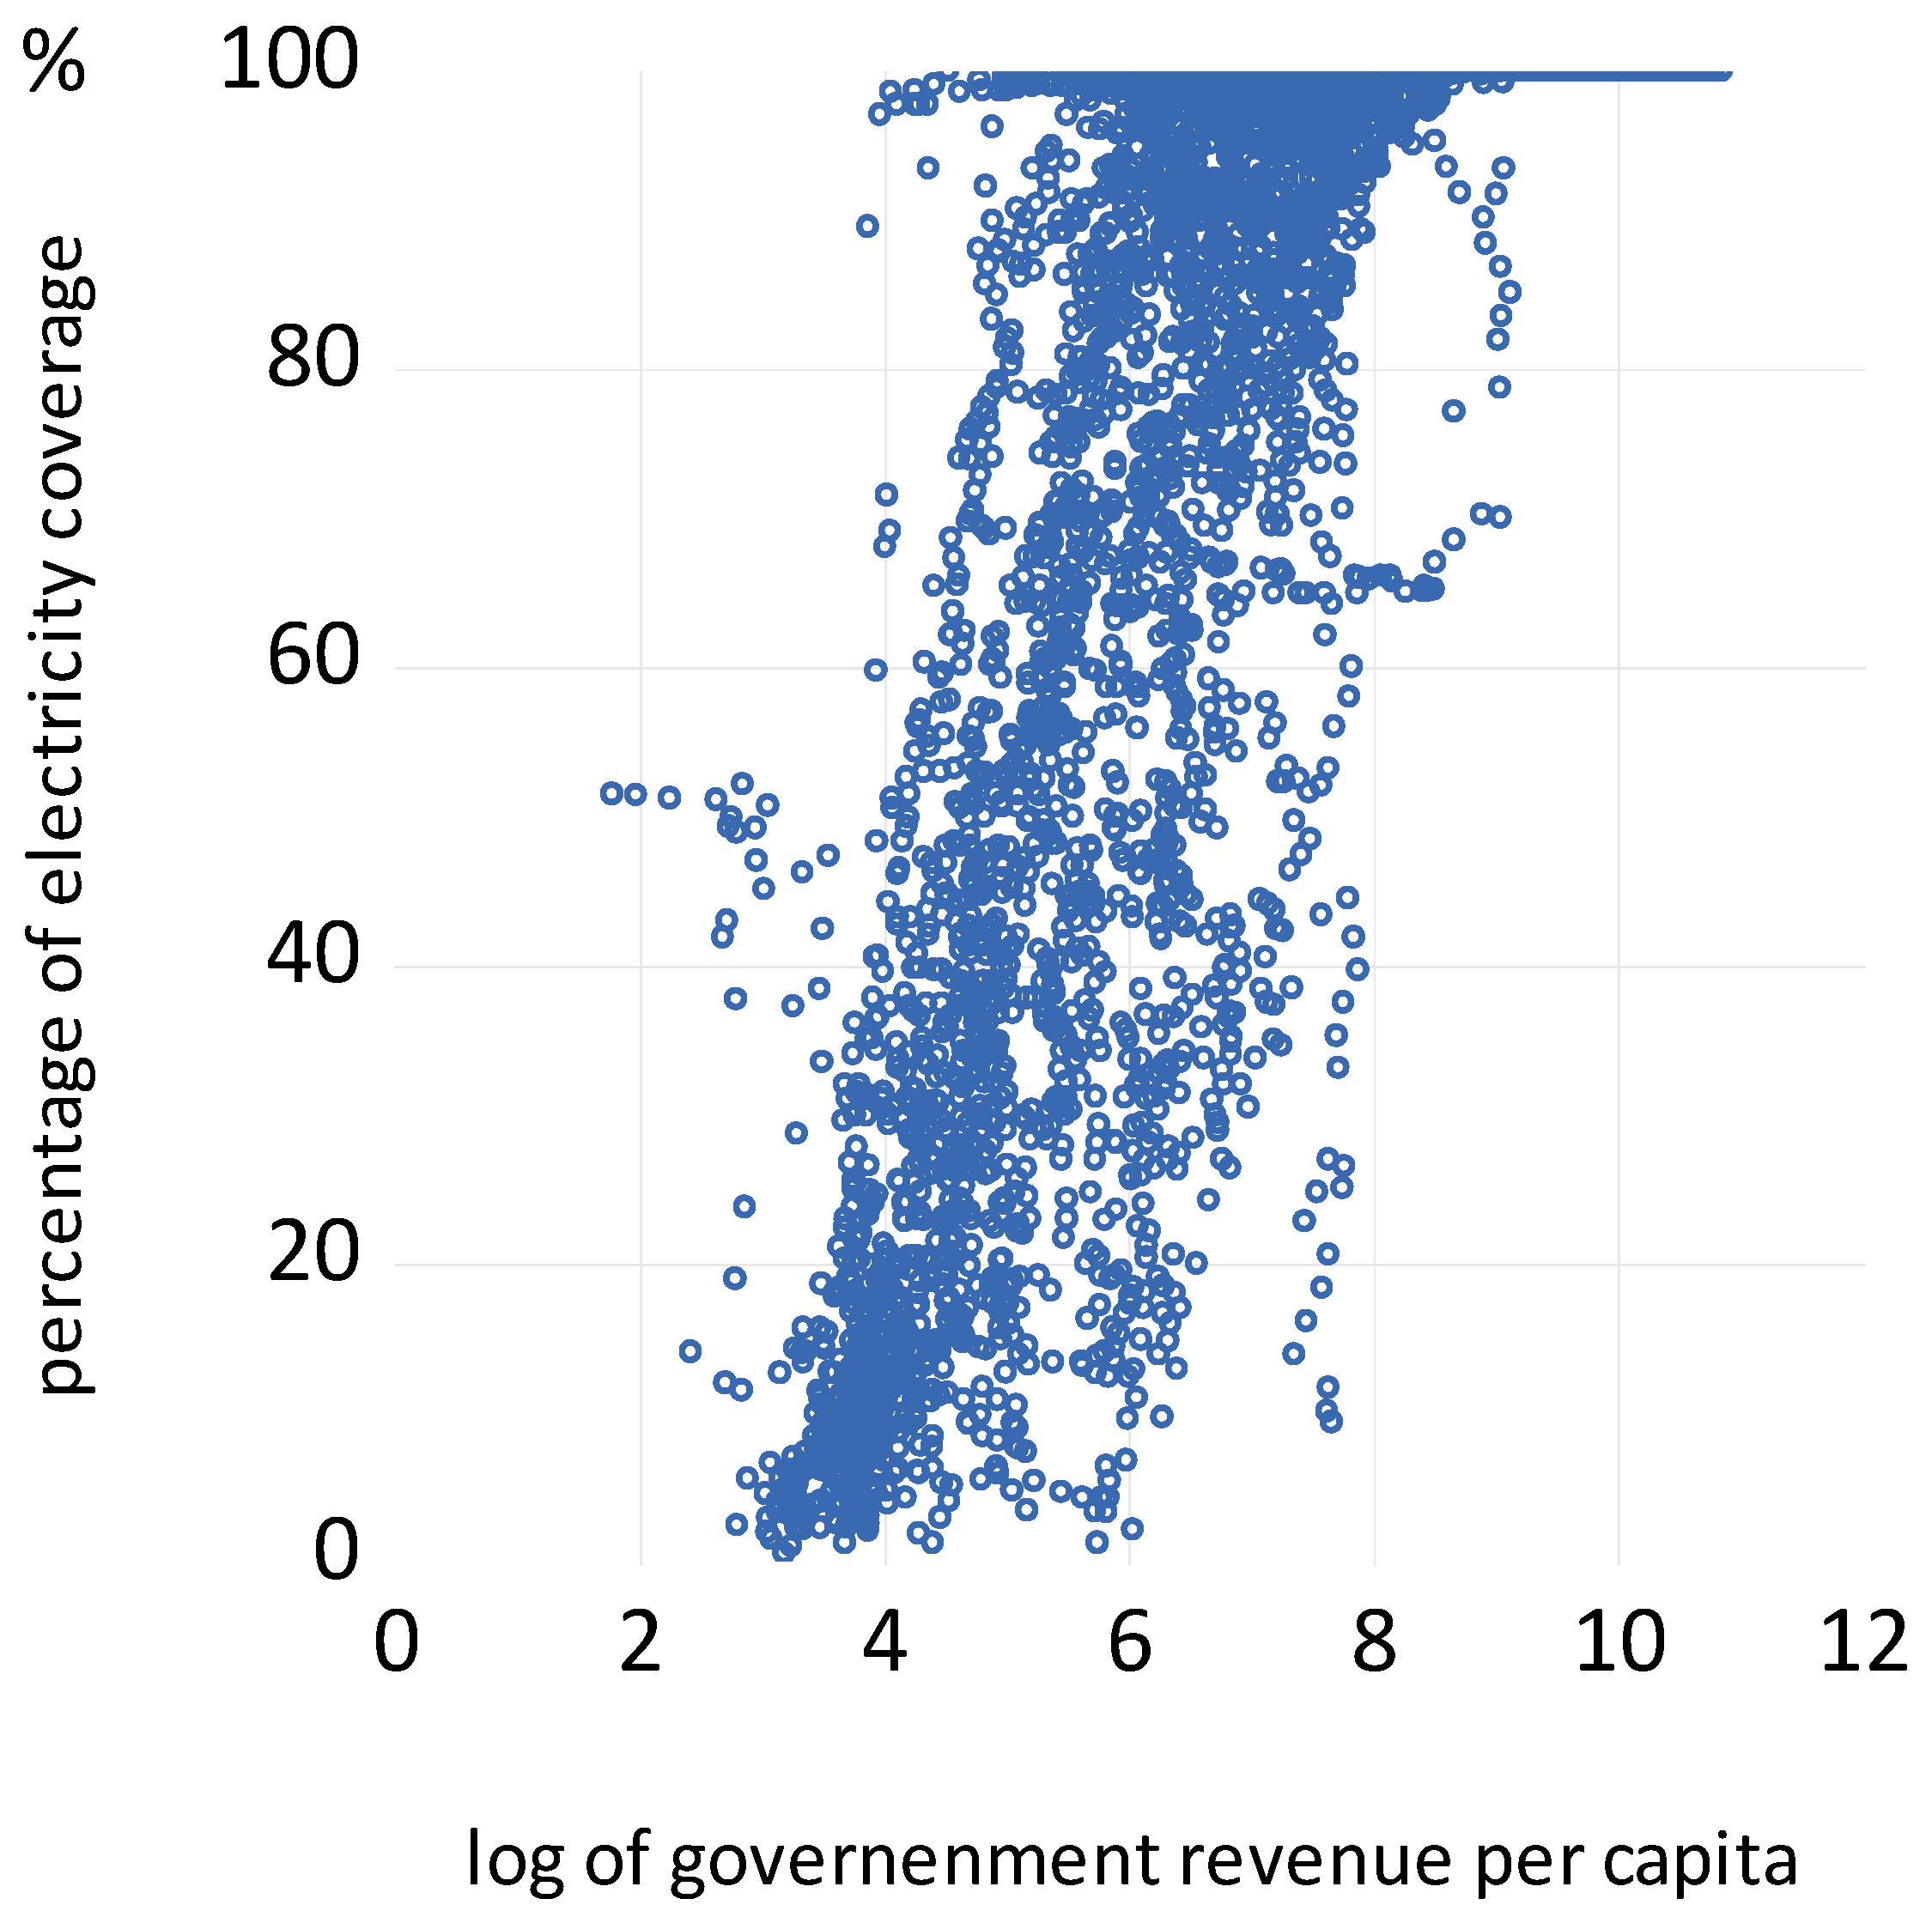
Here, we can see in Figure 1 and Figure 2 a clear positive relationship between the electricity coverage and clean fuel use and the log of the GRpc. The upper bound of one is very clear, and, thus, a linear relationship between these two would not be sensible as an estimation strategy.

Figure 1.
The non-linear relationship between the government revenue per capita and the provision of electricity.
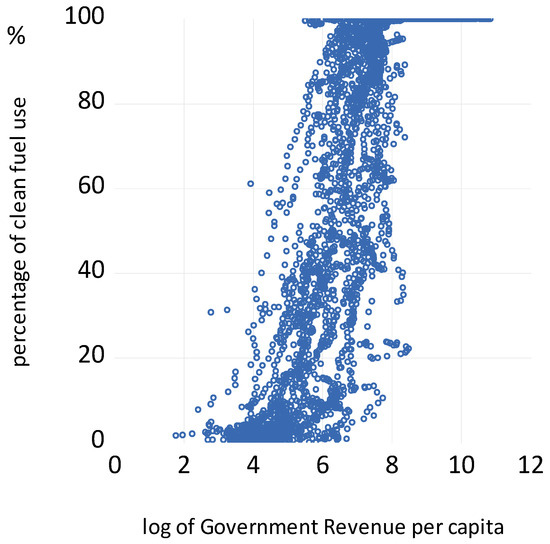
Figure 2.
The non-linear relationship between the government revenue per capita and the percentage of the population using clean fuel.
Table 1 presents the results of estimating Equation (2) for the two indicators. Each column of the tables provides the parameters set out in Equation (2). are the two basic parameters of the logistic function, and after each of these we show the governance indicators which modify the shape of the logistic curve for each individual country. Overall, both models seem to work well and have a high explanatory power. control the basic shape of the average ‘S’-shaped curve for all countries; both parameters are highly significant. The parameters then modify the shape of this curve for individual countries, making it either steeper or flatter as appropriate for each country. In the spirit of the dynamic modelling and the general to specific modelling approach, some of the parameters have been dropped as they were found to be insignificant, and in particular for the electricity equation Political Stability, the Rule of Law and Voice, and Accountability were dropped in the first part of the equation as their ‘t’ statistics were below two. Generally, all the other coefficients were highly significant. The R2 statistic is quite high for a panel data study.

Table 1.
The results for the logistic model for each health indicator.
Table 2 provides the details of the dynamic model (Equation (3)) for each indicator. The parameter which governs the stability of the equation () is in all cases negative and significant as required. The effect of the lagged change () is mostly quite large and highly significant. The R2 is very high, indicating a very good fit, and the DW statistic clearly shows no sign of serial correlation in the errors. As expected, these results suggest that it takes several years to adjust these indicators to their equilibrium values after a change in GRpc.
Table 2.
The dynamic models.
5.1. The Shape of the Curves and the Importance of Governance
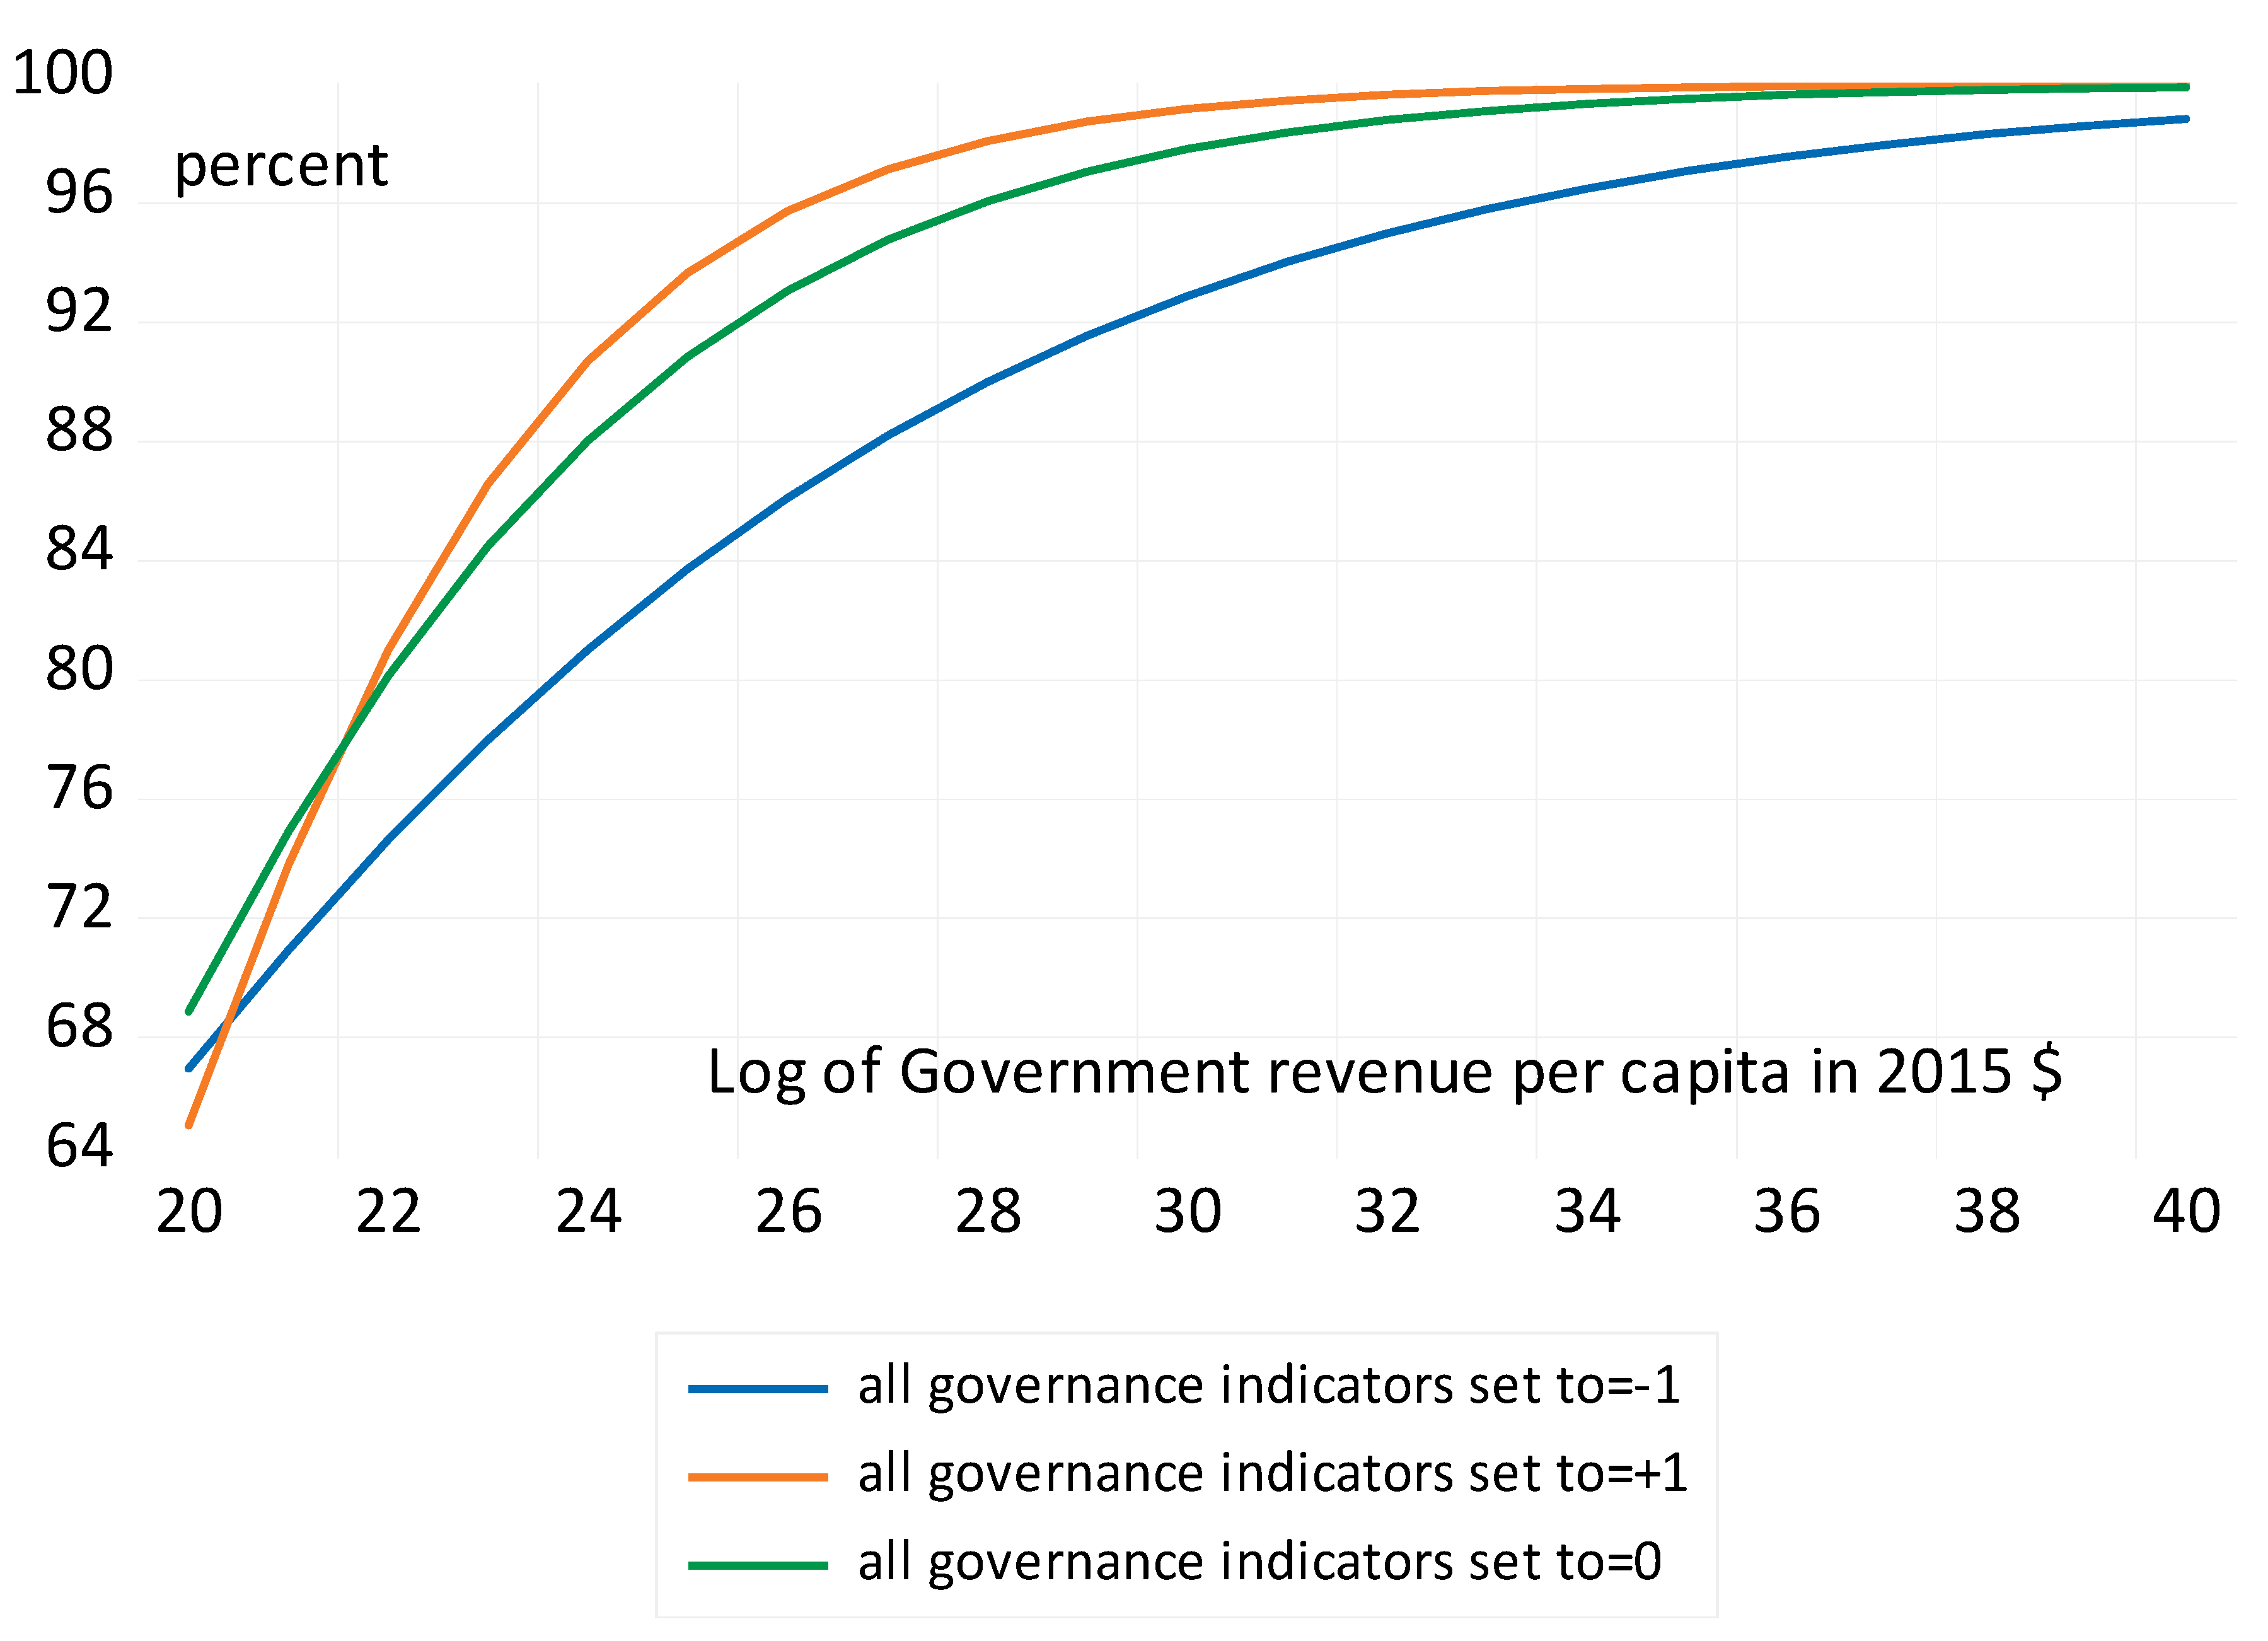
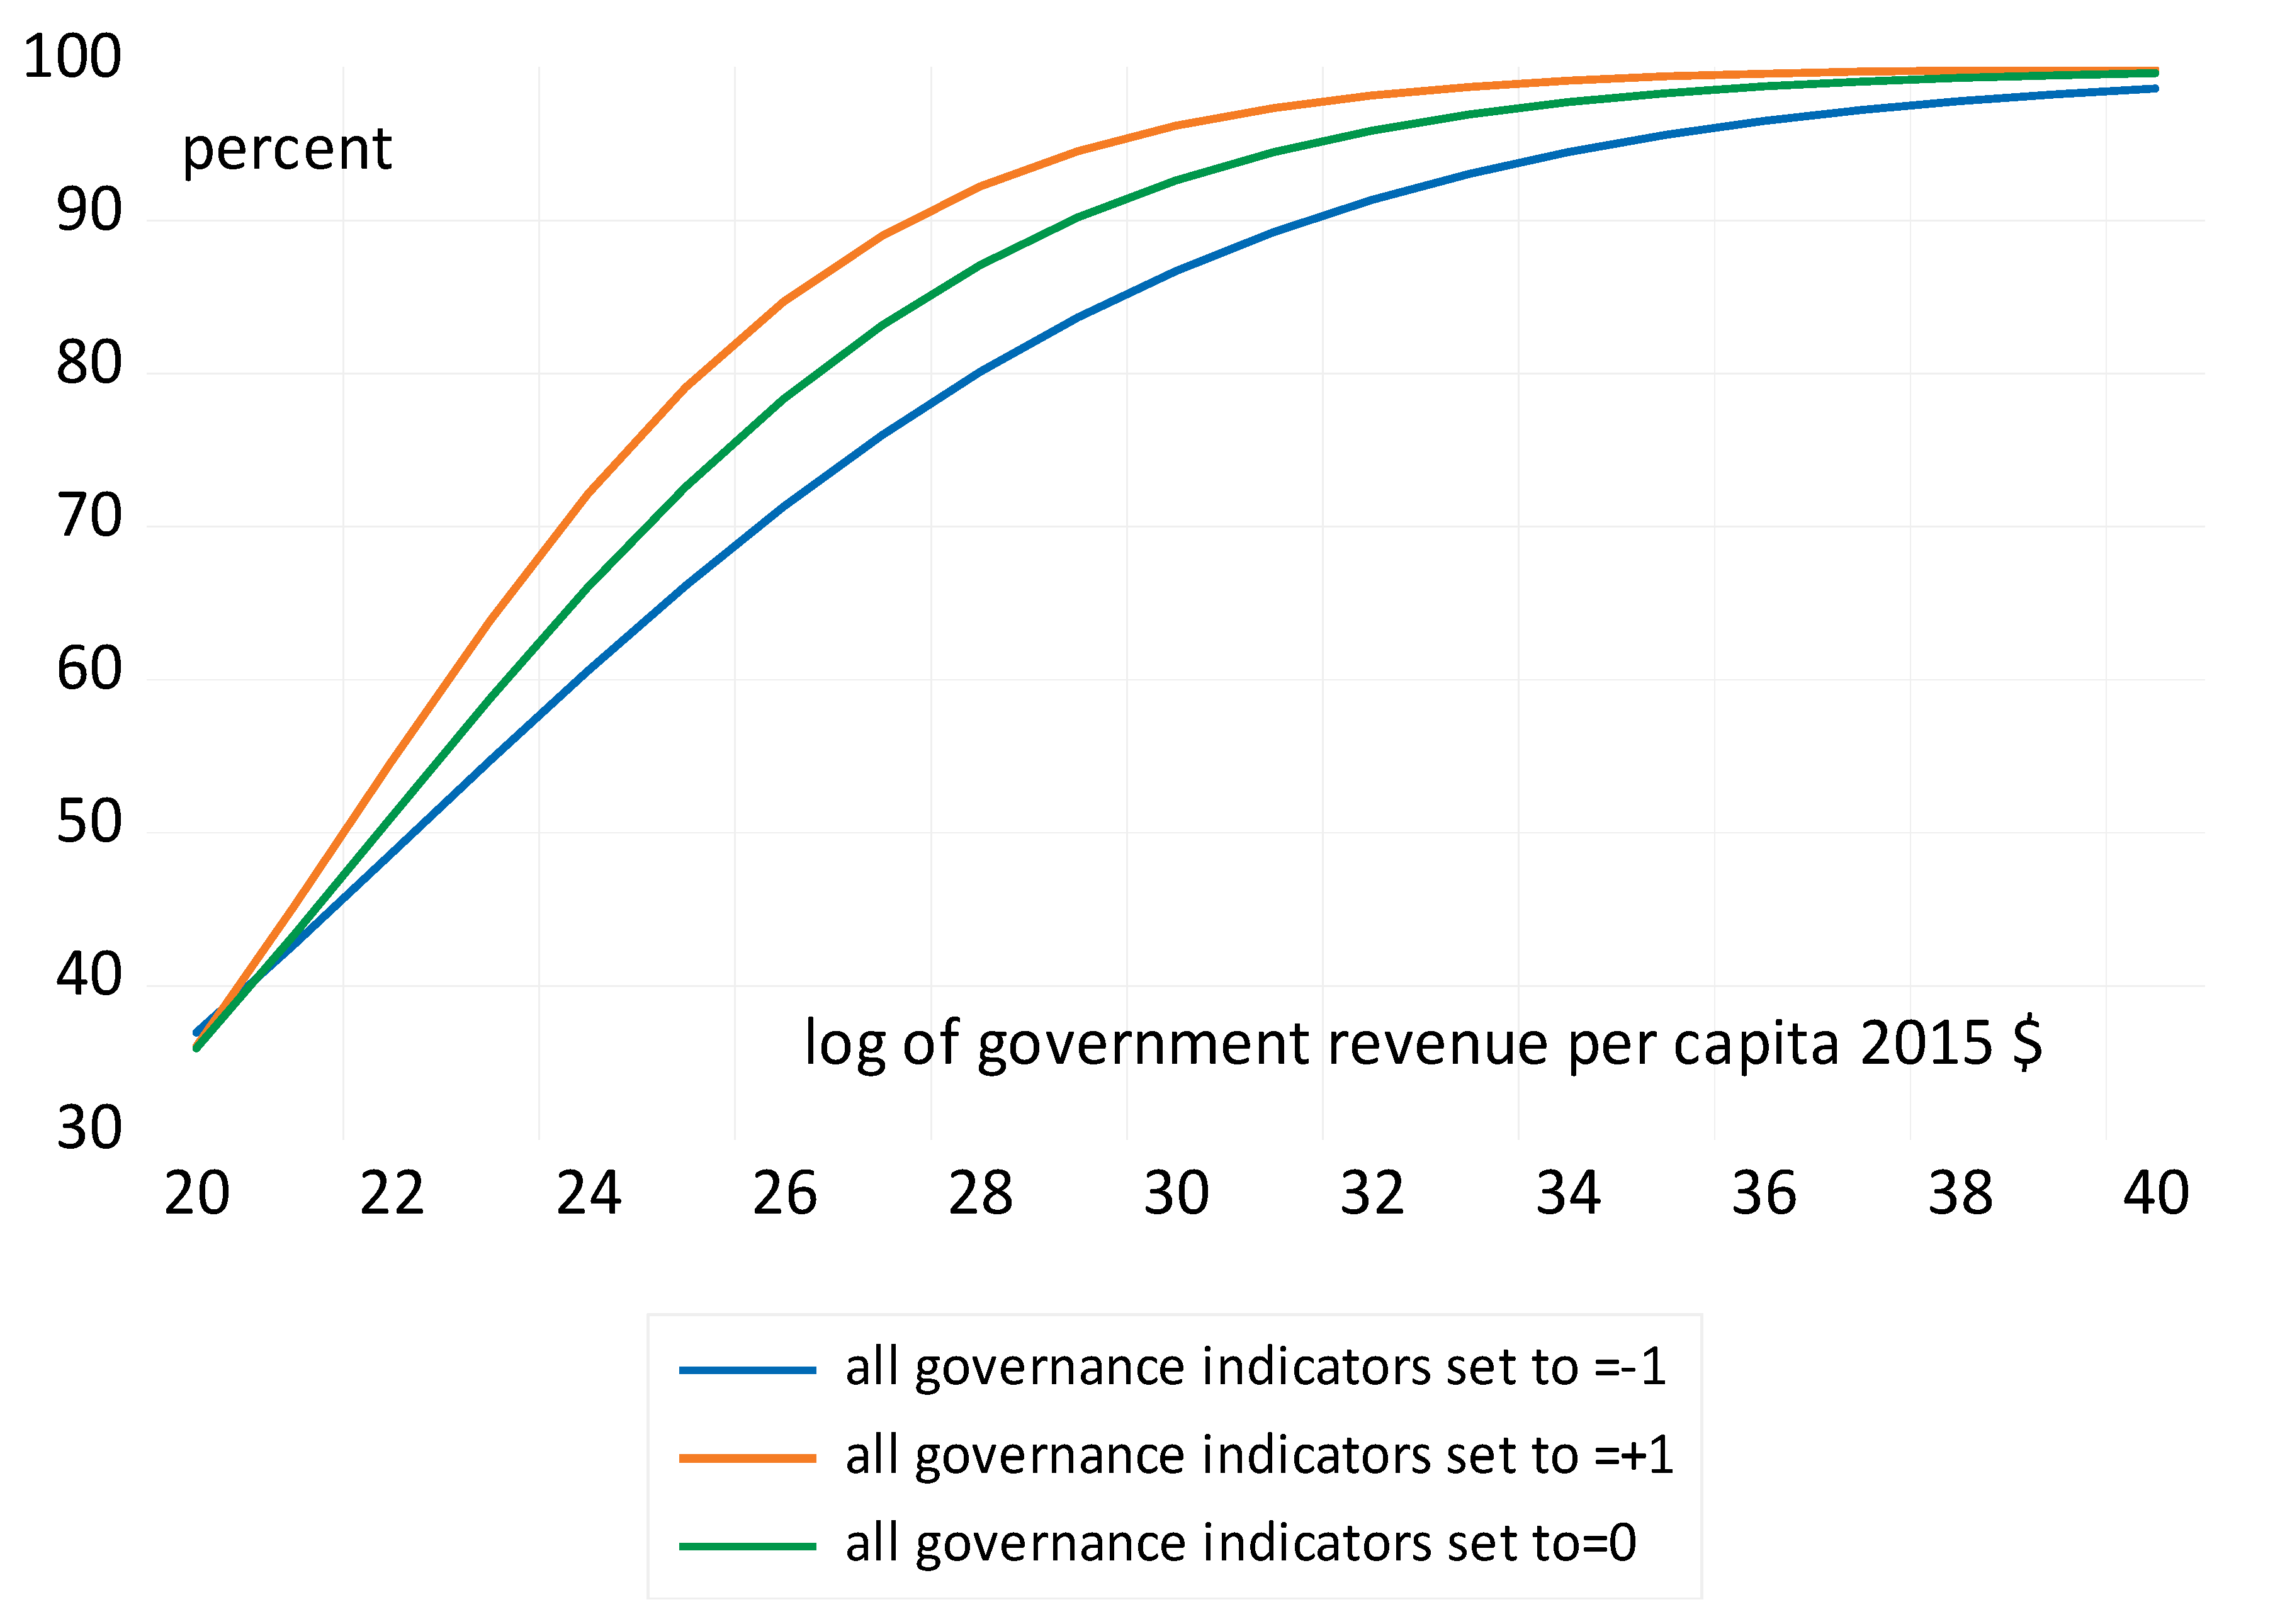
The estimates presented above seem reasonably satisfactory, but it is difficult to obtain a clear understanding of exactly what is going on purely from these estimates. This is partly because we have many countries and every country will be different, and space constraints make it impossible to show the behaviour of each country individually. Therefore, to help understand both the importance of governance effects and that of the GRpc, we conducted a simple set of experiments. We begin by setting all governance indicators to −1, which is generally a poor level of governance. We then calculated the long-run relationship between revenue and the provision of electricity and clean fuels. We then reset all governance indicators to zero, the midpoint of the range, and calculated the relationship between the GRpc and the two indicators. We then applied a further experiment in which we set all governance indicators to +1. We do not go all the way to setting the governance indicators at +2.5, as we recognise that this is a highly unrealistic goal. We then graph each set of relationships to observe the effect of an improvement in both governance and revenue. Figure 3 and Figure 4 show the graphs for this experiment for two measures: the log of the GRpc between 20 and 40 in 2015 prices.
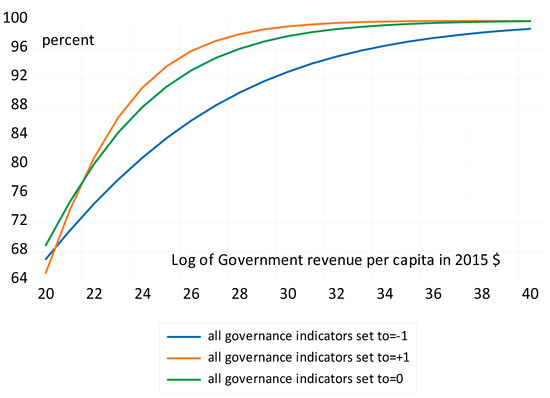
Figure 3.
The effect of governance and revenue per capita in 2015 USD (log) on the provision of electricity.
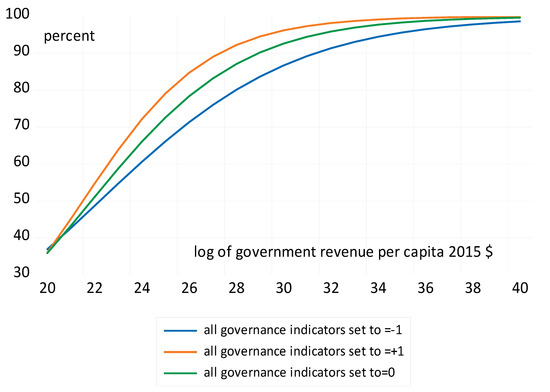
Figure 4.
The effect of governance and the revenue per capita in 2015 USD (log) on clean fuel provisions.
As the government revenue increases, access to electricity and clean fuels also increases, and this effect is amplified in well-governed countries. In both cases the relationship with the government revenue per capita is always positive regardless of the level of governance, so an increase in government revenue always improves electricity and clean fuel consumption. In these two figures we can see that an improvement in governance causes the shape and positioning of the curve to move upwards, thus improving the use of electricity or clean fuels considerably.
5.2. Comparison with Existing Literature
The findings of this study are aligned with the previous literature, and additional government spending and improved governance increases access to electricity and clean energy (Thuy & Hoang, 2023; Best & Burke, 2017; Sarkodie & Adams, 2020; Acheampong et al., 2022, 2023; Ahlborg et al., 2015). We have not studied the impact of democracy, but the literature on the impact of democracy is inconclusive and depends on the context and quality of institutions. The contribution of this work is to provide realistic estimates of the impact of additional revenue and the impact of additional revenue on governance and access to electricity and clean energy and make this available at the level of an individual country in an online visualisation (O’Hare et al., 2024).
5.3. Limitations and Future Research
The limitations of the econometric model include data constraints and the inability to capture certain dynamic effects (e.g., long-term adaptation strategies for climate change). We have not studied the role of government revenue and governance in adopting renewable energy, and future studies could address how additional stable revenue streams and governance enable investment in climate-resilient infrastructure or clean energy, thus supporting the achievement of SDG 13.
We have argued above that the governance indicators and government revenue may be treated as weakly exogenous in estimations, and hence issues of reverse causality do not affect the results presented here. Of course, in a simulation we would wish to treat governance as an endogenous variable, and this is achieved in the full GRADE model.
6. Conclusions and Recommendations
By investing in reliable electricity, governments lay the foundation for education, economic growth, social mobility, and public health. Without this active role, societies would face severe inequality, limited opportunities, and stagnant development. Governments also address market failures, situations in which private enterprises alone would not adequately provide services or infrastructure. For example, in rural areas, private companies may see little profit from providing electricity, and the government needs to ensure that the infrastructure and services necessary for access to electricity and clean cooking fuels are available.
An important distinction between our work and many studies of improvements in the SDGs is that our analysis does not assume that all the extra resources are spent on electricity or clean fuels. This study assumes that any increase in government revenue will be spent in roughly the same proportion on all categories of government spending. So, it is not a matter of spending on electricity rather than on child health, for example, but that both would be increased in line with historical spending. We would argue that this is a much more realistic approach
An important innovation of this paper is the use of the logistic ECM, which not only allows for important non-linearities, but which also obeys the natural boundaries of our dependent variables. That is to say that electricity use and clean fuels can not go below 0% or above 100%, yet the standard linear panel data estimators would not obey this restriction. A further innovation is to demonstrate exactly how other variables, such as our governance indicators, can be incorporated into the logistic model.
This model has been included in the full GRADE model which is online at St. Andrews University https://medicine.st-andrews.ac.uk/grade/ (accessed on 1 February 2025) as an online visualisation which can be used to predict the increase in rates and numbers of children in schools if governments have additional revenue. It can also be used to realistically show the opportunity costs, in terms of access to electricity and clean fuels, of revenue losses, including tax abuse and debt services.
Author Contributions
Conceptualisation, S.G.H. and B.O.; Methodology, S.G.H. and B.O.; Software, S.G.H. and B.O.; Validation, S.G.H. and B.O.; formal analysis, S.G.H. and B.O.; investigation, S.G.H. and B.O.; resources, S.G.H. and B.O.; data curation S.G.H. and B.O.; writing original draft preparation, S.G.H. and B.O.; writing-review and editing, S.G.H. and B.O.; visualisation, S.G.H. and B.O.; supervision, S.G.H. and B.O.; project administration, S.G.H. and B.O.; funding acquisition, S.G.H. and B.O. All authors have read and agreed to the published version of the manuscript.
Funding
This research received no external funding.
Institutional Review Board Statement
This study did not require ethical approval.
Informed Consent Statement
Not applicable.
Data Availability Statement
During the preparation of this study, the authors used the Open Paperpal software (free version) to edit the manuscript. The author reviewed and edited the content as needed and took full responsibility for the final content. Data sources are in the data Appendix A.
Conflicts of Interest
The authors declare no conflict of interest.
Appendix A
The GRADE model uses the Worldwide Governance Indicators (WGIs) to assess the quality of governance across countries. These indicators are composite measures that evaluate governance based on six key dimensions:
Control of Corruption: measures the extent to which public power is exercised for private gain, including both petty and grand forms of corruption.
Government Effectiveness: reflects the quality of public services, civil service, policy formulation, and the government’s commitment to policies.
Political Stability and Absence of Violence/Terrorism: captures perceptions of the likelihood that the government will be destabilised or overthrown by unconstitutional or violent means.
Regulatory Quality: assesses the government’s ability to create and enforce sound policies that promote private sector development.
Rule of Law: evaluates confidence in and adherence to societal rules, including the enforcement of contracts, property rights, and the judiciary.
Voice and Accountability: measures the extent to which citizens can participate in selecting their government, as well as their freedom of expression, association, and the presence of a free media.
References
- Acemoglu, D., Johnson, S., & Robinson, J. A. (2005). Chapter 6 institutions as a fundamental cause of long-run growth. In P. Aghion, & S. N. Durlauf (Eds.), Handbook of economic growth (Vol. 1, pp. 385–472). Elsevier. [Google Scholar] [CrossRef]
- Acheampong, A. O., Nghiem, X.-H., Dzator, J., & Rajaguru, G. (2023). Promoting energy inclusiveness: Is rural energy poverty a political failure? Utilities Policy, 84, 101639. [Google Scholar] [CrossRef]
- Acheampong, A. O., Opoku, E. E. O., Amankwaa, A., & Dzator, J. (2024). Energy poverty and gender equality in education: Unpacking the transmission channels. Technological Forecasting and Social Change, 202, 123274. [Google Scholar] [CrossRef]
- Acheampong, A. O., Shahbaz, M., Dzator, J., & Jiao, Z. (2022). Effects of income inequality and governance on energy poverty alleviation: Implications for sustainable development policy. Utilities Policy, 78, 101403. [Google Scholar] [CrossRef]
- Ahlborg, H., Boräng, F., Jagers, S. C., & Söderholm, P. (2015). Provision of electricity to African households: The importance of democracy and institutional quality. Energy Policy, 87, 125–135. [Google Scholar] [CrossRef]
- Aluko, O. A., Opoku, E. E. O., Ibrahim, M., & Kufuor, N. K. (2023). Put on the light! Foreign direct investment, governance and access to electricity. Energy Economics, 119, 106563. [Google Scholar] [CrossRef]
- Asghar, N., Amjad, M. A., ur Rehman, H., Munir, M., & Alhajj, R. (2022). Achieving sustainable development resilience: Poverty reduction through affordable access to electricity in developing economies. Journal of Cleaner Production, 376, 134040. [Google Scholar] [CrossRef]
- Asteriou, D., & Hall, S. G. (2021). Applied econometrics. Palgrave Macmillan. [Google Scholar]
- Atchike, D. W., Zhao, Z.-Y., & Bao, G. (2020). The relationship between electricity consumption, foreign direct investment and economic growth: Case of benin. International Journal of Energy Economics and Policy, 10(4), 507–515. [Google Scholar] [CrossRef]
- Best, R., & Burke, P. J. (2017). The importance of government effectiveness for transitions toward greater electrification in developing countries. Energies, 10(9), 1247. [Google Scholar] [CrossRef]
- Bhattacharyya, S. C. (2012). Energy access programmes and sustainable development: A critical review and analysis. Energy for Sustainable Development, 16(3), 260–271. [Google Scholar] [CrossRef]
- Blimpo, M., Mensah, J. T., Opalo, K. O., & Shi, R. (2018). Electricity provision and tax mobilization in Africa. World Bank. [Google Scholar] [CrossRef]
- Borng, F., Jagers, S. C., & Povitkina, M. (2021). In light of democracy and corruption: Institutional determinants of electricity provision. The Energy Journal, 42(2), 165–182. [Google Scholar] [CrossRef]
- Engle, R. F., Hendry, D. F., & Richard, J.-F. (1983). Econometrica journal of the econometric society. Econometrica, 51(2), 277–304. [Google Scholar] [CrossRef]
- Hall, S., & O’Hare, B. (2023). A model to explain the impact of government revenue on the quality of governance and the SDGs. Economies, 11(4), 108. [Google Scholar] [CrossRef]
- Irwin, B. R., Hoxha, K., & Grépin, K. A. (2020). Conceptualising the effect of access to electricity on health in low-and middle-income countries: A systematic review. Global Public Health, 15(3), 452–473. [Google Scholar] [CrossRef] [PubMed]
- Kaufmann, D., & Kraay, A. (2023). Worldwide governance indicators. Text/HTML. World Bank. Available online: www.govindicators.org (accessed on 1 February 2024).
- Kaufmann, D., Kraay, A., & Mastruzzi, M. (2010). The worldwide governance indicators: Methodology and analytical issues. Hague Journal on The Rule of Law, 3(2), 1–31. [Google Scholar] [CrossRef]
- Kelly, A. M., Yimele, B. L. T., Tchieu, N. L. W., & Rutazihana, P. N. (2023). Access to electricity and primary education nexus in central Africa. Journal of Regional Economics, 2(1), 26–41. [Google Scholar] [CrossRef]
- Mbiankeu Nguea, S., & Kaguendo, U. V. E. (2022). Are growth effects of foreign capital significant for increasing access to electricity in Africa? SSRN Scholarly Paper. Social Science Research Network. [Google Scholar] [CrossRef]
- Mensah, J. T., & Traore, N. (2024). Infrastructure quality and FDI inflows: Evidence from the arrival of high-speed internet in Africa. The World Bank Economic Review, 38(1), 1–23. [Google Scholar] [CrossRef]
- O’Hare, B., Murray, S., & Hall, S. (2024). GRADE. GRADE. Available online: https://medicine.st-andrews.ac.uk/grade/ (accessed on 2 February 2024).
- Ritchie, H., Rosado, P., & Roser, M. (2024, January). Access to energy. Our World in Data. Available online: https://ourworldindata.org/energy-access (accessed on 4 February 2024).
- Sarkodie, S. A., & Adams, S. (2020). Electricity access, human development index, governance and income inequality in sub-saharan Africa. Energy Reports, 6, 455–466. [Google Scholar] [CrossRef]
- Thuy, L. N. T., & Hoang, L. N. (2023). The impact of government spending and government quality on energy poverty—A global evidence. Journal of Economics, Management and Trade, 29(11), 167–176. [Google Scholar] [CrossRef]
- Tracking SDG 7. (2024). Progress towards sustainable energy. Available online: https://trackingsdg7.esmap.org/ (accessed on 6 February 2024).
- Trotter, P. A. (2016). Rural electrification, electrification inequality and democratic institutions in sub-saharan Africa. Energy for Sustainable Development, 34, 111–129. [Google Scholar] [CrossRef]
- UNU-WIDER. (2023). UNU WIDER: GRD—Government revenue dataset. Available online: http://www.wider.unu.edu/project/grd-government-revenue-dataset (accessed on 1 February 2024).
- World Bank. (2024). World development indicators|DataBank. Available online: https://databank.worldbank.org/source/world-development-indicators (accessed on 3 February 2024).

Disclaimer/Publisher’s Note: The statements, opinions and data contained in all publications are solely those of the individual author(s) and contributor(s) and not of MDPI and/or the editor(s). MDPI and/or the editor(s) disclaim responsibility for any injury to people or property resulting from any ideas, methods, instructions or products referred to in the content. |
© 2025 by the authors. Licensee MDPI, Basel, Switzerland. This article is an open access article distributed under the terms and conditions of the Creative Commons Attribution (CC BY) license (https://creativecommons.org/licenses/by/4.0/).