Abstract
The adoption of artificial intelligence by enterprises in the EU countries increased significantly between 2021 and 2024, but the recorded values were uneven and very small. This study analyzed the main characteristics of the artificial intelligence adoption process, its dynamics and patterns using principal component analysis and K-means clustering. The results highlighted a shift from using technologies for process automation to more advanced ones like natural language generation. The process was extended and gradually covered almost all business areas. The lack of relevant expertise, high costs and gaps in regulation of the development and use of artificial intelligence are the important barriers identified by 2024. The cluster analysis of EU countries highlighted the existence of two permanent clusters, one containing the leading countries and one containing the countries lagging behind, showing a large gap between them. The increasing dependence on externally developed solutions has characterized a maturing market for artificial intelligence. The equitable adoption of artificial intelligence at the level of EU countries must be based on specific workforce training, investments in infrastructure, financial incentives and, last but not least, on clear regulations. Only in this way can the gap in this area at the EU level be reduced.
1. Introduction
Artificial intelligence (AI) is rapidly transforming industries around the world, through the businesses that continuously integrate AI technologies to enhance efficiency, innovation and decision-making. The performance achieved by some AI technologies, like in the case of large language models, seen together with the first release of ChatGPT (based on GPT-3.5) in November 2022, amazed everybody. This rapid advancement of AI also presents unprecedented opportunities for economic growth and business innovation (Cazzaniga et al., 2024). Nowadays, every country in the world understands this enormous potential and wants to benefit from these advances.
The EU has recognized AI as a key driver of digital transformation (European Commission, 2018, 2024), but AI adoption across enterprises from EU countries remains uneven. While some countries and industries have rapidly started using AI-powered solutions, others lag due to barriers such as lack of expertise, cost constraints and regulatory uncertainty. Understanding these differences is vital for shaping policies that ensure equitable AI adoption across EU member states.
The adoption of AI is a complex process and its integration across EU countries faces several challenges. Overcoming these challenges is very important for the successful adoption and deployment of AI technologies. One primary obstacle is the considerable investment required for AI infrastructure, which includes both physical hardware and software systems. Furthermore, there is a pressing need for financial assistance to support AI research and development, alongside the establishment of educational frameworks to cultivate essential AI skills (Li, 2022; Zahidi et al., 2020). At the level of each country, this process must be implemented by enterprises and as well as the government in order to extract all the benefits for his citizens.
2. Literature Review
The integration of AI into companies around the world has brought significant improvements in the productivity of employees in various roles. This effect demonstrates the significant impact of AI adoption on business activities, but at the same time raises challenges in its implementation (Agrawal et al., 2018). AI has revolutionized business operations by automating repetitive and simple tasks, allowing employees to focus on more strategic and creative responsibilities. For instance, AI-powered tools in Management Information Systems (MIS) have reduced data processing time by 66% and operational costs by 20%, significantly boosting operational efficiency (Susilo & Susanto, 2024; Yi & Ayangbah, 2024). Similarly, in manufacturing and customer service sectors, AI systems have improved productivity by handling routine tasks, enabling employees to concentrate on solving complex problems and innovation (Santhosh et al., 2023; Manyika et al., 2017). AI’s capacity to process large amounts of data in a very short period of time has transformed decision-making processes in enterprises. Furthermore, as it can provide data-driven insights, AI can raise the quality of decisions and lead to better results, therefore increasing productivity. For example, AI in MIS has been shown to improve decision-making accuracy by 29% (Susilo & Susanto, 2024). This capability is particularly useful in sectors like healthcare, where AI and IoT combinations have reduced patient wait times by 50% (Mudholkar & Mudholkar, 2024).
The integration of AI stimulates the development of a culture of continuous learning and skill development within organizations. Employees are encouraged to adapt to new technologies, enhancing their AI skills such as machine learning and data analytics. This not only improves individual productivity but also strengthens AI–employee collaboration, leading to more efficient workflows (S. Kumar & Mittal, 2024; K. Y. Kumar & Das, 2024). AI-supported leadership plays a central role in driving productivity. Leaders who leverage AI tools can create a more skilled and engaged workforce, leading to improved team effectiveness and employee engagement. The case of Slovenian companies illustrates the cultural shift towards AI adoption. In their case, AI-supported leadership has positively impacted team performance. The study of Rožman et al. (2023) highlights the importance of developing AI capabilities to increase companies’ competitiveness, but it is limited only to a single country case and cannot be generalized to all EU countries.
AI adoption can also generate inconsistent results. For example, Brynjolfsson et al. (2018), showed in their study that AI implementation does not generate automatically an increase in labor productivity. Their study, based on data gathered until 2018, captures the early stages of AI adoption impact and cannot analyze later effects. Moreover, because it treats the economy as a whole, it does not detect adoption patterns at the country level and does not analyze the causes of the gap identified between the time of AI adoption and the time of the detection of labor productivity growth. The potential for bias or data privacy issues generated by the use of some AI technologies can diminish the trust of the employees and may reduce the use of AI at the workplace. Important ethical concerns can appear due to the use of AI technologies for surveillance or management. It is essential to take all the necessary measures in order to make sure that the adoption of AI technologies does not alter employee well-being or productivity.
Atkinson and Collins (2023) conducted a study that identified potential problems arising from the adoption of AI. The study provided limited empirical evidence on the prevalence or impact of the identified problems and focused on workplace rights, but did not propose a method for assessing or systematically addressing these concerns in practice. The approach used was conceptual rather than data-driven, focused on organizational policies and ethical principles, and did not quantify how widespread bias checks or privacy measures are in current AI implementations. The study of Kurniawan et al. (2024) analyzed the role and effects of AI adoption. It was focused only on the level of the human resources function of the companies and the behavior of the employees. While highlighting the benefits of using AI in the field of human resources, their study did not target the adoption of AI in other areas at the company or at the country level and did not fully capture trust or bias as organizational challenges.
The adoption of AI technologies can lead to the creation of new types of jobs in fields such as AI engineering and data science, but it also automatically leads to the replacement of other jobs such as those that involve performing repetitive tasks. To ensure that employees remain relevant in an AI-driven economy, companies must ensure that they are constantly adapted and retrained. Santhosh et al. (2023) investigated the impact of AI adoption on job automation and the role of AI technologies in creating new jobs or eliminating those that rely on repetitive tasks. Their study highlights the need to reskill the workforce to be ready for the AI era, but does not provide information on what types of skills are missing or how training should be prioritized across countries. Liang (2024) analyze AI’s impact on employment, wages and income inequality, highlighting the effects on job displacement and productivity enhancement. The findings show that AI adoption can generate job displacement even if it creates new ones, emphasizing the fact that retraining is necessary in order to keep employees relevant.
Analyzing the known effects at the level of companies that have already adopted AI technologies, it can be concluded that the adoption of AI leads to an increase in the number of jobs, especially for those requiring skilled workers, rather than to their overall reduction. Albanesi et al. (2023) conducted a study of AI adoption impact on jobs in Europe which showed that even if the adoption of AI leads to an increase in employment, it does not generate wage increases, and the discovered relationship between AI and wages appears to be, at least until 2019, rather negative and statistically insignificant. Their study stops in 2019 and does not capture the effect of the significant advancements made between 2022 and 2024 in the field of generative models. Their approach does not separate the effects generated by the adoption of AI from those generated by other types of technological innovations because it is based on aggregate information on the effects of new technologies, which include those generated by the adoption of AI, among others. The study also does not analyze differences between EU countries. It is becoming clear and obvious that, although it may lead to an increase in the number of jobs, the adoption of AI technologies does not lead to a consistent increase in salaries, even though it requires a higher level of qualification.
Relying on AI systems requires strong data protection measures. Ensuring the security of sensitive information is a critical pillar for maintaining trust and preventing potential breaches that could completely cancel the productivity gains.
Mudholkar and Mudholkar (2024) conducted a systematic analysis of the influences generated by the adoption of AI, including IoT, on performance management in organizations. One of the important conclusions summarized by the performed analysis is that AI can improve performance indicators, but the gains obtained are directly conditioned by addressing risks such as data security and system reliability. Their study emphasizes that issues such as inadequate data protection or unmanaged biases in AI systems could “cancel productivity gains” due to undermining user trust or generating compliance issues. Focusing on performance management, the study presents these risks in a general organizational context, without quantifying the relationship between adopting bias mitigation measures and increasing performance. Although it is a comprehensive review, it does not provide new empirical data on the extent to which companies meet these conditions. It emphasizes that bias and security are important but does not specify in which areas or which countries have succeeded or failed in these aspects.
If we use the Global AI Index values (Tortoise Media, 2024), one of the most comprehensive global indices, calculated at the level of 2024, to understand the positioning regarding the state of AI adoption of EU countries compared to other countries globally, it becomes very clear that none of the world’s countries can compare with the USA. There is a huge gap between the USA and all the other countries in the world. The country that follows the USA closest in this ranking is China. The highest position of any EU country is occupied by France. EU countries fail to close the gap between themselves and the USA, and this will lead to a development of potential dependency on the countries that are at the top of this race. The consequences of such a situation extend beyond economic potential and define their future.
The changes on the international stage over the past years have motivated the EU to adopt a new strategy in order to accelerate the recovery of its AI gap. This process has already started, and until 2023, excepting only one country, all EU countries have already developed AI strategies, reflecting strong engagement but also significant policy differences across countries. Woszczyna and Mania (2023) conducted a comparative overview of national AI strategies across EU countries. The scope of their study is limited to policy documentation and strategic commitments, without assessing the effectiveness of these policies in promoting AI adoption or measuring the actual outcomes. It is a comparative policy analysis, but it does not examine data on the adoption of AI, leaving a gap in understanding how these different strategies generate results at the country level.
The EU has produced the first regulation on AI: the AI Act. This act places the development and use of AI in an ethical framework to minimize risks, without unnecessarily limiting benefits (European Commission, 2024). It also encourages innovation, research and public–private collaboration in line with the EU’s fundamental values, such as human dignity and social justice. This act is the result of two actions: dialogue with stakeholders and the continuous adaptation of EU policies in this area. The study undertaken by Luise, (2024) showed that without these actions, it is not possible to keep up with technological advancements and correctly base decisions that support the interests of citizens. This study is conceptual and advocacy-oriented; it provides normative guidance but does not present any concrete analysis of the effects of AI adoption. Furthermore, it is focused solely on the policy-making process, and it leaves gaps in addressing issues such as measuring the speed of AI adoption or identifying areas that require immediate attention from regulators. The analysis highlights what should be done and provides limited evidence in this regard, requiring complementary studies to provide data-driven insights.
The AI adoption at EU level was the subject of many research studies on various fields and from different perspectives. Marino et al. (2022) prepared a SWOT analysis, based on 42 official European Commission reports, evaluating the transition towards AI adoption across the 27 EU member states from 2012 to 2021. The analysis revealed both positive and negative perspectives on AI, with strengths including strong support for digitalization and a focus on data ethics. However, several weaknesses were identified, such as limited AI implementation in healthcare, the absence of specific ethical frameworks and insufficient investment in AI transition. Their analysis is qualitative and covers the state of AI adoption only up to 2021, just before generative AI reaches its recent performance milestones. Moreover, as it is based on policy reports, the analysis may be biased towards an official point of view and does not take into account the perspectives of the private sector. The lack of a quantitative analysis leads to the impossibility of identifying the factors that strongly influence the process of AI adoption. The study does not measure the progress of adoption and does not provide post-2021 perspectives, showcasing the need for an updated, data-driven analysis.
Key concerns emerged regarding potential job losses due to AI adoption, along with issues related to data protection and insufficient national investment strategies. Despite these challenges, opportunities exist because many citizens hold positive views on AI and numerous countries have started integrating AI into their national strategies while planning dedicated research centers. Among the attempts to discover the key factor that can stimulate the spread of AI adoption within EU countries, one study, carried out by Gualandri and Kuzior (2024), used regression and correlation analysis to determine these factors, but the results found were not significant. The main limitation of their study is the lack of concrete results. The approach used did not lead to the identification of factors influencing the adoption of AI. Most likely, the choice of the type of model or the factors analyzed were not appropriate to assess the complexity of the AI adoption process. A cross-sectional analysis only for the years 2022–2023, based on a small number of factors measured at the country level, cannot detect more complex patterns, namely latent structures or influences in the adoption of AI at the level of EU countries, which leads to the need to use alternative analytical frameworks to discover them.
Other studies, like Popa (2024), were focused on other key aspects like promoting transparency regarding AI technologies and algorithms used in the public system to avoid problems caused by bias, for example, by creating a dedicated base for this purpose at EU level. The study of Popa (2024), does not address the challenges related to the adoption of AI in the private sector or in the economy in general, and does not analyze the factors that stimulate or inhibit the adoption of AI, nor the discrepancies or similarities between EU countries in the adoption process of AI.
This article provides a data-driven, enterprise-level analysis of AI technologies adoption across EU countries over the period 2021–2024 and addresses a number of limitations of previous studies. By using Eurostat data for all EU countries, principal component analysis (PCA) and K-means clustering, it goes beyond a single-country focus and reveals a pronounced cross-national specialization in AI adoption strategies. While Rožman et al. (2023) highlighted internal leadership as a determinant of accelerating AI adoption, our results show that external structural conditions, such as relevant skills shortages or cost pressures, represent the determinant factors of the AI adoption intensity. Furthermore, this article updates the debate on the productivity paradox initiated by Brynjolfsson et al. (2018). Although the adoption rate of AI in EU enterprises almost doubled from 2020 to 2024, the overall adoption rate still remains low. The explanation for the lag in the correlation between the adoption rate and productivity is given by the existence of three main barriers to the adoption of AI that slow down the productivity increases. These results highlight clear mechanisms, similar to those whose effects Brynjolfsson et al. (2018) observed, but which they did not identify. Responding to the concerns of Atkinson and Collins (2023) and Mudholkar and Mudholkar (2024), we quantitively assess enterprises’ bias-checking practices. By documenting how AI use has expanded from early use in HR (Kurniawan et al., 2024) to finance, R&D and cybersecurity, this article demonstrates that the same AI potential for transforming the HR sector is now generalizing across all business functions. As already signaled, on several occasions, with quantitative evidence of its severity and spatial distribution, the main obstacle remains the relevant skills gap, confirming the call made by Santhosh et al. (2023) for a large-scale upskilling.
The present paper has allowed for a better understanding of the complex effect of AI adoption on employment, highlighted by Liang (2024) and Albanesi et al. (2023). The multivariate methodological approach used in the present article overcomes the inconclusive results of the multiple linear regression approach used by Gualandri and Kuzior (2024). This approach allowed for the discovery of latent structures that a single-equation model could not have highlighted. The results of this quantitative study extend and clarify the policy-based analysis of Woszczyna and Mania (2023), Luise (2024) and Marino et al. (2022). Finally, by mapping ethical vigilance and transparency deficits, the study operationalizes Popa’s call for an EU transparency register, providing the empirical foundation on which such a framework can be built.
The main purpose of this study is to comprehensively analyze the adoption of AI technologies by enterprises in EU countries, during the period 2021–2024. The research aimed to uncover the distinct typologies of AI adoption, identify the important factors and barriers influencing the integration of AI in business and provide information on strategies and policies that can be used to facilitate a rapid and balanced process of AI adoption across the EU. Moreover, the analysis also involved studying the differences between the adoption models of AI technologies, as well as how these models have changed over time. To achieve this, the following objectives were set:
- Investigate the adoption models of AI in EU countries by analyzing the current state of AI adoption and assessing the extent and ways in which enterprises implement AI solutions, highlighting regional disparities in adoption rates and use cases.
- Identify clusters of countries with similar patterns by conducting a cluster analysis based on PCA of a large number of characteristics used to evaluate the AI adoption process and by analyzing the differences between the identified clusters.
- Analyze the changes in the AI adoption process from 2021 to 2024 by tracking the changes in the scale of AI technologies use, changes in the purposes of using AI technologies and the impact of recent innovations in the field of AI on adoption rates.
- Identify the main barriers influencing the adoption process of AI and their dynamics by discovering the main obstacles that hinder or slow down the adoption process of AI technologies in enterprises in EU countries and analyzing the dynamics of the perceived importance of these barriers until 2024.
- Identify differentiated policies, based on the characteristics of the identified clusters, that allow the adaptation of the adoption process of AI by enterprises in EU countries to become more efficient and equitable.
3. Methodology
The data used in this paper is based on the results of the annual EU survey on ICT usage and e-commerce in enterprises organized by Eurostat (Eurostat, 2024). Until 2021 there were recorded only data about how many AI technologies enterprises were used. Starting in 2021, the diversity of collected data increased. For 2022, no data regarding AI use in enterprises was recorded, but after ChatGPT was launched in November 2022, the collected data diversity regarding AI increased even more. In 2024, 157,000 of the 1.54 million enterprises in the EU were surveyed. Of the 1.54 million enterprises, approximately 83% were small enterprises, 14% were medium enterprises and 3% were large enterprises. The survey covered enterprises with at least 10 employees and self-employed persons (GE10).
From an initial set of 611 collected variables within the survey, 136 were selected as directly related to the AI adoption process and used in this paper. Moreover, as the set of collected variables changed during the years 2021, 2023 and 2024, the data were processed at the level of each year. The selected set of variables was split into many subsets, each with a specific goal. Variables with missing data at the level of each processed subset/year were eliminated from the dataset. Because some countries did not report the data on Eurostat until the end of 2024, the records for these countries with missing data at the level of a subset/year were also eliminated from the dataset.
In order to characterize the AI adoption process within EU countries, we studied this topic using a top-down approach, first at the EU level and second at the level of the individual EU countries. This approach allowed us to identify both the commonalities and the differences in AI adoption across EU countries. A preliminary data analysis highlighted that because there are many similarities between countries situated in different regions of the EU due to their cultural, economic and historical backgrounds, groups of countries with similar characteristics regarding the AI adoption process are formed. A cluster analysis is required in this case. We ran an initial cluster analysis for finding the characteristics of clusters to determine which type of clustering analysis is adequate, in a robust manner, using principal component analysis (PCA) visualization and the following four metrics:
- Silhouette score (Rousseeuw, 1987):where
- o
- a—mean intra-cluster distance;
- o
- b—mean nearest-cluster distance.
Values closer to 1 indicate well-separated spherical clusters.
- Statistic GAP (Tibshirani et al., 2001):where
- o
- —sum of intra-cluster variances for the observed data;
- o
- —sum of intra-cluster variances for the random (null) dataset;
- o
- B—number of times the null reference distribution is sampled.
The standard deviation of the GAP statistic is:
The optimal number of clusters is:
Higher GAP indicates that the clustering structure is stronger and better than random.
- Davies–Bouldin Index (Davies & Bouldin, 1979):where
- o
- —the average distance between points in cluster i and its centroid;
- o
- —the distance between centroids of clusters i and j.
Lower values indicate better-separated and compact clusters.
- Caliński–Harabasz Index (Caliński & Harabasz, 1974):where
- o
- k—number of clusters;
- o
- n—total number of data points.—Between-Cluster Variance:where
- ▪
- —the number of points in cluster i;
- ▪
- —the overall mean of the dataset.
—Within-Cluster Variance: - o
- where is a data point belonging to cluster .
Higher values indicate better-separated and compact clusters.
The results obtained indicated well-separated and relatively compact clusters (Silhouette score > 0.5, Davies–Bouldin Index ≤ 0.71, Statistic GAP ≥ 0.62, Caliński–Harabasz Index ≥ 10). These findings guided us to the use of K-Means algorithm.
K-means clustering works iteratively to assign data points to k clusters based on their similarity (MacQueen, 1967; Lloyd, 1982; Hartigan, 1975; Hartigan & Wong, 1979). The procedure consists of the following steps:
- Initialization: Select k initial cluster centroids, typically chosen randomly.
- Assignment Step: Assign each data point to the nearest centroid , using a chosen distance metric.
- Update Step: Compute new centroids by taking the mean of all points assigned to each cluster.
- Repeat: Iterate the assignment and update steps until centroids no longer change significantly or a stopping criterion is met (e.g., a maximum number of iterations).
Given a dataset X = {x1, x2, …, xn} with n observations, the K-means objective function seeks to minimize the total within-cluster variance, defined as:
where
- o
- k—the number of clusters;
- o
- —the set of points in cluster I;
- o
- —the centroid of cluster i, computed as:
- o
- represents the squared Euclidean distance between data point and centroid .
The most commonly used distance metric in K-means is Euclidean distance, defined as:
where and are two data points in an m-dimensional space.
The following arguments recommend the use of the K-means algorithm (Celebi et al., 2013; Ahmed et al., 2020; Ikotun et al., 2023):
- Computational efficiency: K-means is relatively fast and scales well with large datasets.
- Simple and intuitive: The algorithm is straightforward in terms of understanding and implementation.
- Scalability: Works well with large-scale datasets, making it a practical choice for clustering.
- Interpretability: Results are easy to interpret, especially with well-separated clusters.
The K-means algorithm assumes that clusters are convex and isotropic and it has a series of limits that must be taken into consideration before using it:
- Sensitive to initialization—Poorly chosen initial centroids can lead to suboptimal clusters.
- Based on a fixed number of clusters—The optimum number of clusters k must be fixed before using K-means algorithm, which can be challenging.
- Sensitive to outliers: Outliers can significantly affect cluster centroids, leading to distorted clustering.
With a focus on the interpretability of the resulting clusters, the optimal number of clusters required by the K-means algorithm was determined as the median value of the set formed by the values identified by the four metrics presented above, to which was added the value determined by the “Elbow” method. Given the differences between the metrics and taking into account the characteristics of the clusters determined by the preliminary analysis, we preferred this approach that provides more confidence in the optimal number of clusters chosen. Considering the fact that the K-means algorithm is sensitive to the initial position of the centroids, we ran the algorithm several times, using different random seeds, to ensure the stability of the results obtained. Knowing that possible outliers can influence the clustering result, we performed an assessment of the impact of these possible values on the cluster formation process. It was found that the main structure of the clusters was maintained even when these values were eliminated. The clustering process was repeated using different subsets of variables and it was observed that the main cluster structure remained, with small variations, almost the same.
Taking into account the characteristics of the clusters identified in the preliminary analysis, we used other algorithms, such as agglomerative clustering and spectral clustering, to identify the existing cluster structure and we obtained results that presented only small variations compared to the result obtained using the K-means algorithm. Finally, the main cluster structure identified proved to be stable.
The discovered AI adoption patterns were compared year-over-year to identify major shifts in enterprises’ preferences at the country level.
4. Results
4.1. The AI Adoption Analysis at EU Level
As Figure 1 shows at the EU level, enterprises had a very small rate of AI adoption, but comparing the values of 2024 with 2020, the AI adoption rate almost doubled, increasing from 7% to 13%.
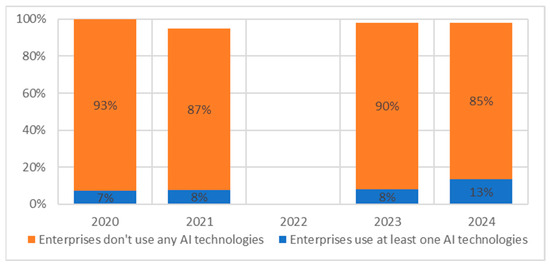
Figure 1.
AI adoption rate by GE10 enterprises at the EU level. Data source: (Eurostat, 2024). Note: No data was collected for 2022.
The analysis of the AI technologies’ source used by GE10 enterprises at the EU level revealed that 84% of the enterprises that adopted AI technologies used open source, commercial or externally developed software, compared with 16% that used their own created software. This shows that enterprises preferred to use externally created AI software instead of creating their own software (Figure 2).

Figure 2.
Source of AI technologies used by GE10 enterprises at the EU level. Data source: (Eurostat, 2024).
The enterprises’ interest in adopting different types of AI technologies is strongly connected to the specifics of each one. By analyzing the types of AI technologies adopted by enterprises, some aspects became relevant. In 2021, 3% of enterprises preferred process automation (PA), 2% machine learning (ML) and 2% text mining (TM), but these preferences were changed by the performances achieved by the AI technologies related to natural language generation (NLG) in 2022, proved by the launch of ChatGPT. After a slow change of AI adoption rate in 2023, these advances stimulate the increase in adoption of TM to 7%, NLG and speech recognition (SR) both to 5% and ML to 4% in 2024 (Figure 3).
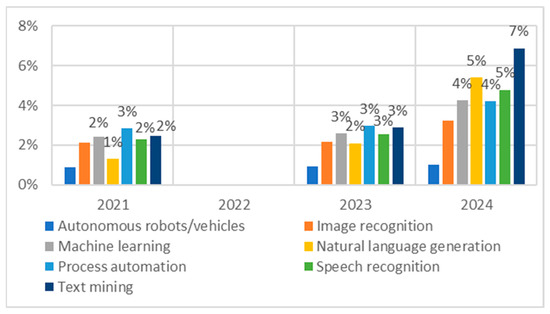
Figure 3.
Types of AI technologies used by GE10 enterprises at the EU level. Data source: (Eurostat, 2024). Note: No data was collected for 2022.
The analysis of the purpose for which enterprises used AI technologies at EU level highlighted a few characteristics (Figure 4).
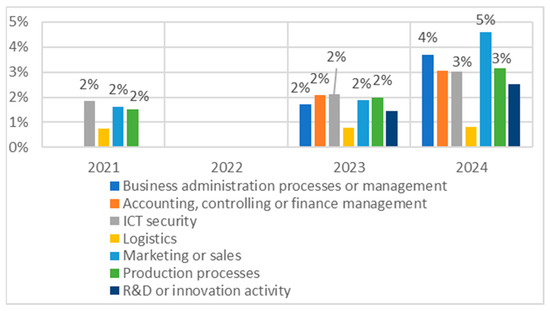
Figure 4.
For what purpose GE10 enterprises used AI technologies—EU level. Data source: (Eurostat, 2024). Note: No data was collected for 2022.
First, in 2021, the enterprises used AI technologies only for four purposes (ICT security, marketing or sales and production process) and in a very small percent (under 2%). Over time, the diversity of purposes increased rapidly, reaching seven in 2024. The enterprises became interested by other purposes like business administration processes or management, accounting, controlling or finance management and R&D or innovation activity. In 2021, ICT security was the dominant purpose (2%); this changed over time, and in 2024, the dominant purposes were marketing or sales (5%) and business administration processes or management (4%). There is only one purpose where the interest of enterprises remained low (under 1%) and constant over time: logistics.
In 2023, when it became very clear that the AI technologies would play a very significant role, the EU became interested in the factors that could make it harder for enterprises to use them. Several factors were identified, but the most important of these was the lack of relevant expertise (4.45%) (Figure 5).

Figure 5.
Main barriers encountered by GE10 enterprises in adoption of AI technologies. Data source: (Eurostat, 2024).
The following factors, ranked by importance, concern the availability and quality of data (3.09%), the lack or unclear legal regulations (3%) and concerns related to data protection and privacy (2.74%). In 2024, the situation changed; the influence of lack of relevant expertise increased to 7.10% and this time the identified factors, ranked by importance, were the lack of clarity about legal consequences (5%) and data protection and privacy (4.89%).
4.2. The AI Adoption Analysis at EU Countries Level
Figure 6 highlights a clear differentiation between the levels of adoption of AI technologies at the EU level. Denmark stood out as a leader among EU countries, with its adoption rate values varying from 15% to 27.6% for all analyzed years, significantly higher than that of all other EU countries. The next two countries ranked after Denmark were Sweden, with percentages between 10.3% and 25.1%, and Belgium, with percentages between 13.8% and 24.7%. At the other extreme, which had much lower and almost stable adoption rates of AI technologies over the period examined, were Romania (1.5% to 3.1%), Poland (2.9% to 3.9%) and Bulgaria (3.6% to 6.5%).

Figure 6.
Overall AI adoption rate for GE10 enterprises at EU countries level—2021, 2023, 2024. Data source: (Eurostat, 2024).
The analysis of the different types of AI technologies adopted across the EU countries has shown significant differences (Figure 7, Figure 8 and Figure 9).
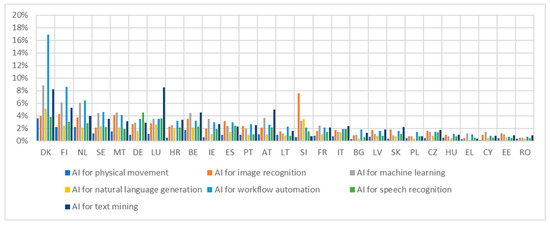
Figure 7.
Types of AI technologies adopted by GE10 enterprises at EU countries level—2021. Data source: (Eurostat, 2024).
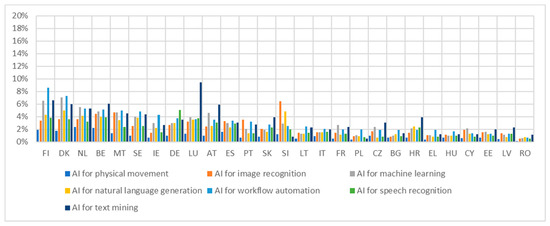
Figure 8.
Types of AI technologies adopted by GE10 enterprises at EU countries level—2023. Data source: (Eurostat, 2024).

Figure 9.
Types of AI technologies adopted by GE10 enterprises at EU countries level—2024. Data source: (Eurostat, 2024).
The use of the following types of AI technologies was analyzed: AI for Physical Movement (PM), AI for Image Recognition (IR), AI for ML, AI for NLG, AI for Workflow Automation (WA), AI for SR and AI for TM.
There was an obvious general trend of increasing AI integration by GE10 enterprises, but at the same time, the landscape was characterized by changes in leadership among EU countries and in priorities regarding AI technology. In 2021, Denmark stood out as a leader in most types of AI, especially in PA (16.9%), ML and TM, but in 2023, Finland (8.6%) became the leader, even surpassing Denmark for the exact same types of AI technologies. This fact indicated at least a convergence for the leading countries in the adoption of AI. By the end of 2024, countries’ priorities have shifted to integrating AI for NLG technology. Denmark, (18.5%) has reclaimed its leadership position, and the Netherlands (12.6%) and Belgium (12.7%) have consistently followed closely throughout the period, consolidating a group of countries that are leaders in NLG and TM use. It was also noted that Luxembourg (17.6%) was the leader for AI for TM and Slovenia (12%) for AI for IR during the period under review.
In the leading group countries, AI for WA has consistently maintained high levels of adoption, between 5% and 8.5% in 2023 and between 8.2% and 10.9% in 2024, highlighting its consistent and enduring importance as a core scope. AI for ML and AI for TM have stood out by increasing in importance and adoption rate faster and faster over the years. This indicated a greater focus on fundamental ML capabilities in the EU. In 2024, AI for NLG and AI for TM have become the main types of AI technologies integrated into enterprises across EU countries. There have been other types of AI technologies that have consistently shown lower adoption rates over time, indicating that they may be either less mature, too industry-specific or involve overcoming more consistent obstacles in the adoption process.
One feature of the adoption of AI technologies was clearly highlighted, namely that there was a significant gap between EU countries even though the pace of adoption and the degree of diversification of integrated AI technologies have increased over time. There was a group of countries that have recorded lower adoption rates (under 2%) for most types of AI technology and that have systematically lagged behind the leading group. This group consists of countries such as Romania, Latvia, Estonia and Cyprus. This systematic gap revealed the uneven spread of AI technologies within EU countries. Furthermore, it highlighted the need for more carefully targeted strategies that lead to uniform adoption of AI in all member states while allowing them to benefit equally from its potential.
By deepening the analysis at the level of EU countries through cluster analysis and PCA, we discovered some new common characteristics of the countries, as well as others that differentiate them.
First, the principal components analysis carried out based on the variables in which the types of AI technologies adopted by enterprises in EU countries were recorded over the studied period highlighted the existence of an increasingly intense trend. Across all three years, the first principal component (PC1) was strongly correlated with the overall level of AI technology adoption, indicating that enterprises with high PC1 scores demonstrated widespread integration of various AI technologies, particularly ML and NLG (Table 1).

Table 1.
PCA for AI technologies types used by EU countries.
The second principal component (PC2) represented a contrast dimension and highlighted a growing divergence between businesses specializing in AI for IR and those focusing on AI for TM, AI for WA, and AI for PM. Notably, the positive loading for IR strengthens over time, suggesting a more specialized application of this technology. This strengthening differentiation implies that enterprises are increasingly choosing to specialize in IR rather than maintaining a more balanced portfolio of AI technologies (Figure 10).
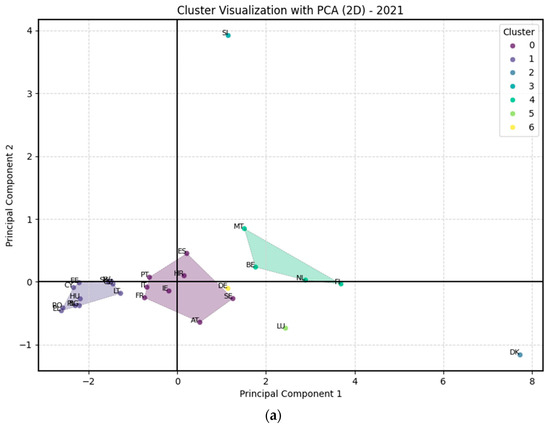
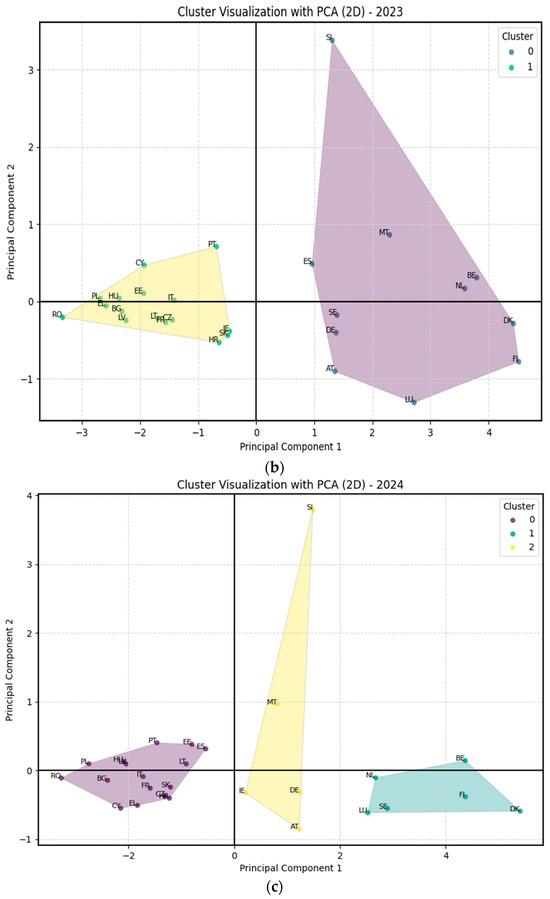
Figure 10.
Countries clusters by AI technologies types adopted by GE10 enterprises: (a) 2021, (b) 2023, (c) 2024. Data source: (Eurostat, 2024).
Countries on the right, with high PC1 values, were generally advanced in overall AI adoption. Denmark, a clear outlier, showed exceptionally high adoption across all AI technologies measured. The vertical position (PC2) further contrasted countries based on their emphasis on IR. For example, countries such as Slovenia or Malta, which recorded high values on the PC2 axis, had a higher adoption rate in AI for IR than other countries. The clustering effectively highlighted not only how much, but also what kind of AI technologies were being adopted across EU countries, revealing nuanced patterns of technological specialization.
Second, using K-means clustering, it was revealed that the process of adopting AI technologies at the level of EU countries is dynamic. In 2021, the distribution of countries was carried out in seven clusters. This was due to the different degrees of adoption and specialization of EU countries in AI technologies. By 2023, the landscape had simplified greatly, with the analysis highlighting the formation of only two main groups: one containing EU countries with a low overall rate of adoption of AI technologies and the second including EU countries with a higher adoption rate and a greater diversity of adopted AI technologies. In 2024, the structure of the clusters continued to evolve, with the analysis highlighting three well-defined clusters. The first cluster identified included EU countries characterized by a systematically lower rate of adoption of AI technologies. The second group contains countries specializing mainly in AI for IR, which is especially evident in the case of Malta and Slovenia. The last cluster contained countries with high overall adoption of AI technologies and included countries such as Denmark, Belgium, Finland and Sweden. This dynamic suggested a trend of increasing divergence in AI adoption strategies. Some countries preferred to focus on specific types of AI technologies, while others opted for a broader and more comprehensive approach. Denmark had a special status as a leader in the integration of AI technologies throughout all years analyzed.
The analysis of the AI technologies adoption purposes by the EU countries, carried out for the years 2023 and 2024, highlighted, on one hand, their consistency, and on the other hand, important changes in their priorities. In both years, AI for Business Administration or Management (BAM) and AI for marketing or sales (MS) emerged as the main technologies for all EU countries. This indicated a special and systematic attention paid to capitalizing on the advantages offered by AI technologies to improve core business operations and active customer engagement. It was also observed that the use of AI technologies for Production Processes (PP) and AI for accounting, controlling or finance management (ACFM) also remained important goals, especially in the case of the countries in the leading group, which highlights the efforts to continuously improve the efficiency of production and operational processes with the help of AI technologies (Figure 11 and Figure 12).
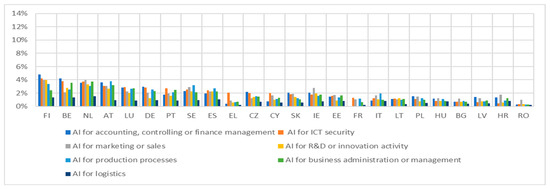
Figure 11.
Purposes of AI technologies adopted by GE10 enterprises at EU countries level—2023. Data source: (Eurostat, 2024).
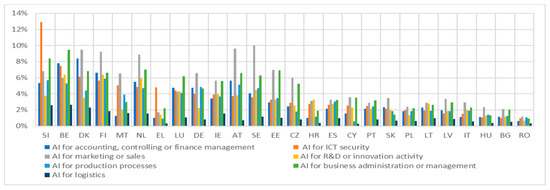
Figure 12.
Purposes of AI technologies adopted by GE10 enterprises at EU countries level—2024. Data source: (Eurostat, 2024).
A main change observed between 2023 and 2024 was the consistent increase in the adoption rate of AI for ICT security. Although moderately present in 2023, it grew rapidly, becoming a primary focus in 2024, particularly in countries such as Slovenia, Belgium and Denmark. This shift signaled a growing recognition of the critical role of AI in cybersecurity and a greater focus on AI-based solutions to counter growing digital threats. In contrast, while still relevant, the use of AI for PP became less dominant in 2024 compared to the increased emphasis on AI for ICT security. This indicated either a possible shift in priority or reaching a ceiling in its relative growth. AI for research and development or innovation (RDI) and AI for logistics consistently remained the least adopted purposes in both years.
Across both 2023 and 2024, a clear pattern of countries leadership persisted, with Finland, Belgium and the Netherlands consistently demonstrating strong adoption rates across multiple AI purposes. Denmark also maintained a leading position, particularly across a wide variety of AI technologies. Conversely, a group of countries including Romania, Bulgaria and others consistently recorded lower adoption rates across almost all AI purposes, highlighting a persistent digital divide in the EU regarding the application of AI technologies to diverse business functions. This persistent gap underscores the need for targeted initiatives to promote more equitable access to and implementation of AI across all EU member states and for varied purposes.
The analysis of the AI adoption purposes at the level of EU countries for 2023 and 2024, using PCA, revealed that PC1 consistently represented the overall level of purpose-based AI adoption, showing that enterprises with higher PC1 scores generally integrate AI across a wide range of business functions (Table 2).
Table 2.
PCA for purposes of AI technologies adopted by EU countries.
The second principal component identified (PC2) represented the dimension that contrasts countries in terms of their specialization in the use of AI technologies for specific purposes. This component suffered consistent change from one year to the next. In 2023, PC2 highlighted the contrast between companies that prioritized the use of AI technologies for ACFM versus those that prioritized their use in ICT security and PP. In 2024, PC2 changed its structure, and this time contrasted companies that prioritized the use of AI technologies in ICT security and logistics with those that prioritized the use of AI technologies in PP and RDI. This temporal variation in the structure of PC2 highlighted the dynamics of AI adoption strategies, meaning that companies change their focus, on the one hand, in line with their priorities and, on the other hand, depending on emerging opportunities.
The clusters’ visualization for 2023 and 2024, when viewed alongside the PCA interpretations, revealed distinct patterns in the adoption of AI for specific purposes across EU countries (Figure 13).

Figure 13.
Countries’ clusters by purposes of AI technologies adopted by GE10 enterprises: (a) 2023 (b) 2024. Data source: (Eurostat, 2024).
In both years, the size of the clusters, from left to right in the graphs, was remarkably stable and included thirteen, eight and five EU countries. Their composition did not change much either.
In 2023, the cluster analysis showed a clear separation based on PC1 and PC2, where cluster 2 represented countries with a high overall adoption rate of AI for various purposes, while clusters 0 and 1 showed a differentiation based on their focus on financing/administration versus ICT security/production. This was consistent with the meanings of PC1 as the overall level of adoption and PC2 as the dimension of specialization contrasting these two areas.
In 2024, almost the same countries formed the three clusters. While cluster 1, which contained countries like Denmark, Belgium and the Netherlands, showed a widening purpose for AI technology adoption, cluster 2, which contained countries like Sweden, Austria, Germany or Malta showed a narrowed strategy for AI adoption purposes. For this year, the cluster 0 contained the countries that preferred the use of AI technologies for ICT security and logistics and had the lowest overall adoption rate of AI technologies. Among these were countries such as Romania, Bulgaria and Poland. Cluster 2 was formed by those that had a slightly higher overall adoption rate of AI technologies but preferred their use more for PP and RDI, such as Germany, Malta, Luxembourg and Sweden. Cluster 1 contained the countries like Slovenia, Belgium, Denmark, the Netherlands and Finland, with the highest overall adoption rate of AI technologies and that preferred a much wider spectrum of their use than those in cluster 2 or 0. Another observation that stands out from the graph is that the countries in cluster 1 had a greater inclination to use AI technologies in the field of ICT security and logistics than for PP and RDI. The change in the composition of clusters from one year to the next showed the different and dynamic adaptation of EU countries taking into account the identified opportunities and the priorities they have assumed. The strongest change in strategy was highlighted in the case of Slovenia. This was the country that made the leap from cluster 0 in 2023 to cluster 1 in 2024 and, at the same time, strongly changed the strategy for adopting AI technologies on the dimension related to PC2, focusing strongly on their use in the field of ICT security and logistics in 2024 more than for ICT security and PP in 2023. Another change was observed in the case of Austria, which almost maintained its level of overall adoption rate of AI technologies but changed the strategy and direction of its leap opposite the one of Slovenia.
The analysis of the breadth of EU countries’ AI adoption strategies for 2023 and 2024 highlighted a significant increase in the rate of AI adoption at their level (Figure 14 and Figure 15).
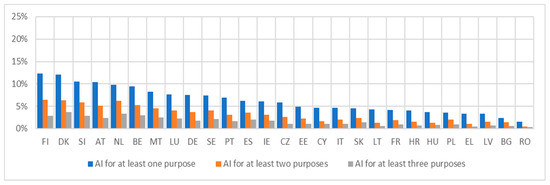
Figure 14.
Number of purposes of AI technologies adopted by GE10 enterprises at EU countries level—2023. Data source: (Eurostat, 2024).
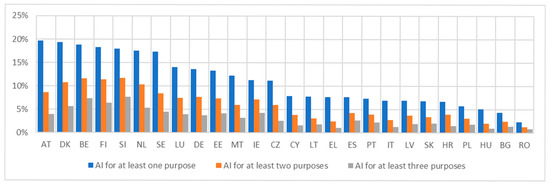
Figure 15.
Number of purposes of AI technologies adopted by GE10 enterprises at EU countries level—2024. Data source: (Eurostat, 2024).
The percentage of companies that have adopted AI for at least one, two or even three purposes has increased significantly over the two years analyzed, which supports the previous statement. Denmark and Finland played the role of leaders in 2023, but in 2024, Austria and Belgium had a higher adoption rate of AI technologies for at least one purpose and surpassed them. An increase in the pace of adoption of AI technologies for at least two or three purposes was noted across all EU countries. This increase signified a change in the adoption strategy towards a more integrated one and was especially visible within the countries in the leading group. However, the formation of distinct groups of countries was again observed, between which a leader group and a laggard group stand out, between which the gap was very clear and worrying. Countries in the laggard group (Romania, Bulgaria, Poland and Hungary, for example) systematically presented the lowest adoption rates in both years. The existing gap was not only obvious but also amplified due to the faster year-on-year growth in the adoption rate of AI technologies in the leader group countries compared to the almost stationary rates in the laggard group countries. This different reality, which was accentuated for the two groups, highlights the need to create and adopt differentiated support mechanisms through specific policies to create a fair framework for access to AI technologies for all EU countries. In this way, the creation of a significant and permanent two-tier differentiation in the use of AI technologies across EU countries could be prevented. The two statistical graphs indicate a cluster structure of EU countries.
The PCA revealed in both years that PC1 represented the overall extent of multi-purpose AI adoption, effectively separating countries based on their broad integration of AI across various purposes (Table 3).
Table 3.
PCA for number of purposes of AI technologies adopted by EU countries.
PC2 also showed consistency across the two years and differentiated between amplitude and depth of AI adoption.
The cluster visualizations for 2023 and 2024, combined with the PCA equations, clearly illustrate the consistent patterns of multi-purpose AI adoption within EU countries (Figure 16).
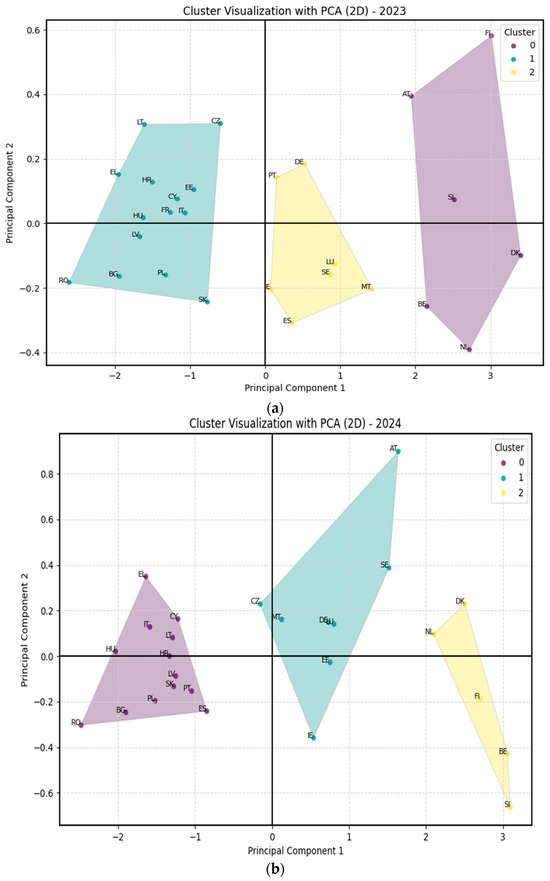
Figure 16.
Countries’ clusters by number of purposes of AI technologies adoption by GE10 enterprises: (a) 2023, (b) 2024. Data source: (Eurostat, 2024).
The rightmost cluster in both visualizations consistently grouped countries with the highest PC1 scores, indicating a greater tendency to adopt AI for multiple purposes. Denmark, Belgium, Slovenia and Finland were the countries that adopted AI technologies for more than one purpose. At the other end, we found Romania, Bulgaria and Greece as countries where the adoption of AI technologies had the lowest rates, signaling that the talent of programmers or the good Internet infrastructure, as in the case of Romania, were not enough to stimulate the AI adoption rate.
In both visualizations there were countries that focused on wider AI adoption (like Slovenia, Ireland or the Netherlands), while other countries focused on the adoption of AI for at least one purpose (like Lithuania, Czechia or Greece). This visual separation reinforced the PCA’s finding that PC2 effectively contrasted these two approaches to AI adoption. The stability of cluster compositions and their alignment with the PCA equations highlighted a consistent structure in how countries approached the number of AI applications they implement.
The analysis of AI technology sources from 2021 to 2024 highlighted other important changes in EU countries’ strategy for adopting AI technologies (Figure 17, Figure 18 and Figure 19).
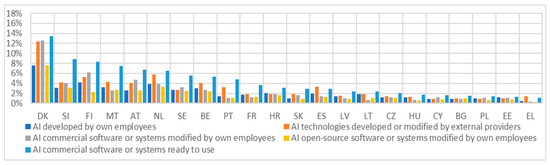
Figure 17.
Source of AI technologies adopted by GE10 enterprises across EU countries—2021. Data source: (Eurostat, 2024).

Figure 18.
Source of AI technologies adopted by GE10 enterprises across EU countries—2023. Data source: (Eurostat, 2024).
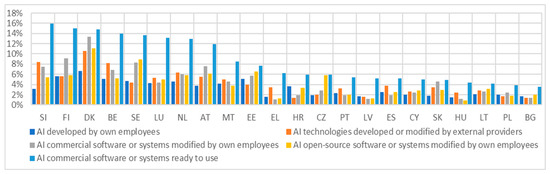
Figure 19.
Source of AI technologies adopted by GE10 enterprises across EU countries—2024. Data source: (Eurostat, 2024).
The analysis of AI technologies’ sources of origin used by enterprises in EU countries at the level of the three years analyzed showed that external suppliers occupy the most important place. In this way, enterprises in EU countries presented a systematic dependence on external expertise and ready-made software solutions. A secondary, but still significant, place was occupied by internally modified commercial software and open-source ones. The least used source of supply for AI technologies was through the modification of open-source software solutions. The leading countries in the adoption of AI technologies preferred to diversify their supply strategies the most. They chose a more complex approach through which to use, on one hand, the advantages of an accelerated internal development of AI technologies and, on the other hand, to develop them based on external partnerships. In the case of the supply of AI technologies, the existence of groups of countries was also observed, but also the existence of a significant and systematic gap between EU countries. The EU countries in the lagging group that showed low overall adoption rates of AI technologies also recorded the lowest intensity of supply from all sources analyzed in the period 2021–2024. As observed, the countries that formed the leading group were on the path to developing their own, internal AI technology generation capacities. The countries in the lagging group still faced fundamental challenges regarding all aspects of AI technology adoption, including those related to supply sources. The growing gap between these groups of countries once again highlighted the need for differentiated policies at the EU level to stimulate equitable access to AI technologies and support the development of internal AI technology generation capacities in all EU countries, regardless of the stage reached at a given time.
Countries like Luxembourg, Germany, France, Ireland, Italy and Romania had not reported any values for these indicators or had only reported partially until the end of 2024, and this influenced the results of PCA and cluster analysis.
The PCA for the countries that reported values regarding the analyzed indicators revealed a clear evolution in countries AI adoption strategies. Initially, the focus was on the choice between in-house modification and external reliance (Table 4).
Table 4.
PCA for sources of AI technologies adopted by EU countries.
Over time, the emphasis shifted towards a broader choice between building AI internally versus relying on external providers for development. Finally, in 2024, a significant shift occurred towards adopting ready-made AI solutions, indicating a potential maturity in the AI market and a preference for readily available technologies. The changes in the PC2 component highlighted that the countries tend to change their strategy regarding the AI development methods.
The cluster visualizations, in conjunction with the PCA interpretations, revealed a dynamic evolution in AI development and modification of countries strategies across the three years (Figure 20).

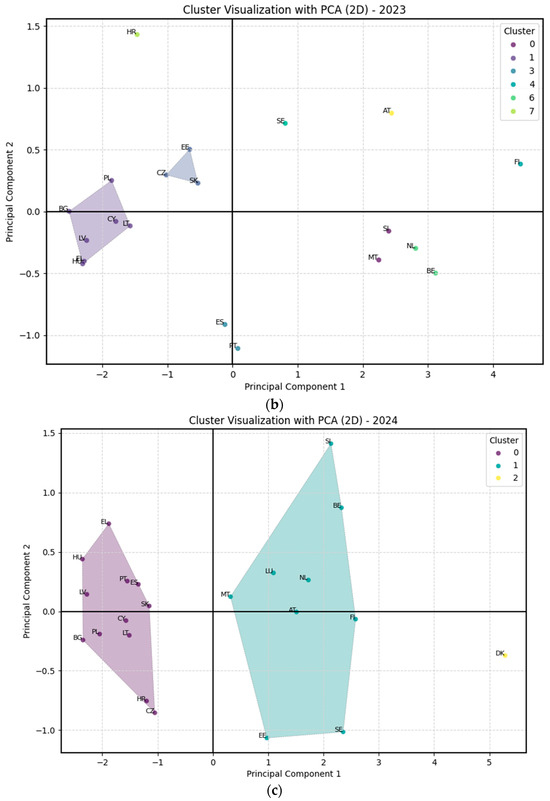
Figure 20.
Countries’ clusters by sources of AI technologies adoption by GE10 enterprises: (a) 2021, (b) 2023, (c) 2024. Data source: (Eurostat, 2024).
In 2021, the three existing clusters were very clearly separated along PC1 and, at the same time, highlighted a differentiation between countries regarding the sources of AI technology adopted by enterprises, contrasting the internal modification of AI and the use of AI from external sources, as indicated by PC2. However, by 2023, the cluster structure had changed, consistent with the PCA’s observation that PC2 changed over time to differentiate between internal versus external development and modification and showed a different strategy of countries in AI adoption. Most countries changed their strategies this year, choosing particular variants. The transition was also obvious regarding the change in the composition of clusters, especially cluster 1, which has increasingly grouped countries with a focus on external development and change. Denmark retained its outlier status throughout the analyzed period, demonstrating its unique approach to AI development and modification.
The analysis to identify the barriers that block or slow down the process of AI adoption in EU countries, using the PCA analysis, highlighted the main aspects and changes at the level of EU countries (Table 5).
Table 5.
PCA analysis of barriers perceived in adoption of AI technologies across EU countries.
PC1 systematically represented, in all three analyzed years, the general level of barriers perceived by enterprises that slow down or block the adoption of AI. High values for PC1 showed a wider range of reported reasons for not using AI. The interpretation of PC1 as the general level of barriers perceived by companies was stable over time, even if the exact loads changed slightly from year to year. PC2 changed its meaning throughout 2021 and 2023. It contrasted ethical values and concerns (such as ethical considerations, utility, legal clarity) with practical and technical barriers (such as expertise, data, and incompatibility), in other words, it represented a qualitative differentiation in the nature of the barriers. In 2024, the meaning of PC2 changed again and highlighted the contrast between cost as the dominant barrier and a wider set of other barriers (the most significant of which are lack of expertise and data protection/privacy concerns). It was observed that, in 2024, the main obstacle perceived by companies in the adoption of AI was the level of costs.
Across the three years, a trend towards simplification in cluster structure was observed (Figure 21).
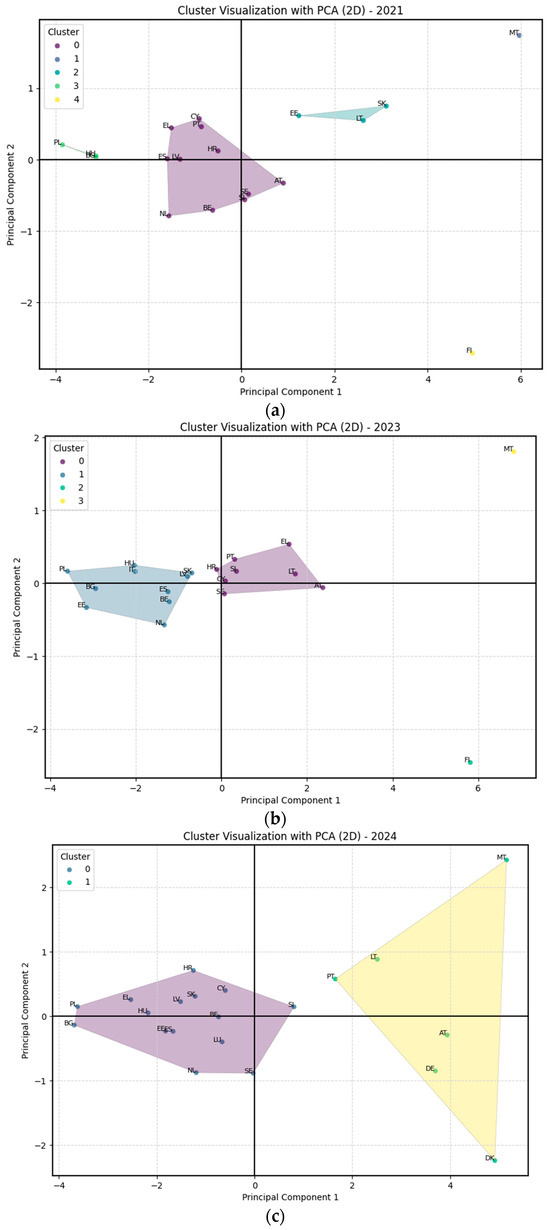
Figure 21.
Countries’ clusters by principal barriers perceived in AI technologies adoption by GE10 enterprises: (a) 2021, (b) 2023, (c) 2024. Data source: (Eurostat, 2024).
In 2021 and 2023, cluster analysis led to a higher optimal number of clusters, highlighting more finely differentiated groupings of countries based on the reasons why they did not adopt AI. The optimal number of clusters decreased significantly in 2024, indicating a simpler and clearly separated clustering structure along the PC1 dimension. Throughout all years, Malta and Finland consistently appear as isolated points, suggesting unique profiles in terms of barriers to AI adoption compared to other EU countries. In 2024, the clear two-cluster structure showed the clear difference in the overall barriers perceived at the level of the contained countries. Cluster 0 indicated countries that did not encounter high values for the overall barriers level in the AI adoption process, in contrast with cluster 1. Also, inside of both clusters existed countries that were contrasting by PC2 dimension. Countries like the Netherlands, Sweden or Luxembourg from cluster 0 and Germany, Austria, and Denmark from cluster 1 recorded negative PC2 values, indicating a greater relative emphasis on cost as a primary barrier to AI adoption. This evolution over the three years highlighted a potential shift in the main barrier types to AI adoption across EU countries, with cost emerging as a main differentiator in the most recent year, potentially reflecting changes in economic conditions or a growing awareness of AI implementation costs.
The adoption of AI technologies by enterprises across EU countries cannot be achieved by ignoring the potential risks associated with it. One of the biggest risks associated with the development of AI technologies, such as NLG, for example, but not only, is the risk of bias. This risk significantly became more important after the launch of ChatGPT. The annual EU survey on the use of ICT and e-commerce addressed this type of risk in enterprises at the EU level, beginning in 2024.
The PCA analysis revealed two components (Table 6). PC1 showed positive and quite similar loadings across all types of bias checking approaches, irrespective of how the AI was developed or modified, meaning that PC1 indicated the overall level of attention to bias checking across all AI approaches.
Table 6.
PCA analysis regarding bias check in adoption of AI technologies across EU countries.
Enterprises with higher PC1 scores generally placed more emphasis on bias checking in their AI systems, regardless of whether the AI was developed internally, externally or purchased as ready-to-use.
PC2 revealed a more differentiated pattern. It showed positive loadings for “Bias check—AI modified in-house” and “Bias check—AI modified externally”, and negative loadings for “Bias check—AI developed externally” and “Bias check—Ready-made AI”. “Bias check—AI developed in-house” has a small negative loading. This suggested that PC2 contrasted two tendencies in bias checking:
- Positive side: emphasis on bias checking for modified AI systems, whether modifications are done in-house or externally.
- Negative side: emphasis on bias checking for externally developed and ready-to-use AI systems, potentially less emphasis on bias checking for systems developed in-house.
This could indicate a lack of trust in AI procured from external sources or bought ready-to-use, and hence the need for a more rigorous assessment of the risk of bias.
The cluster analysis of EU countries based on their bias-checking practices across different AI development and acquisition methods in 2024 revealed a nuanced landscape (Figure 22).

Figure 22.
Countries’ clusters by bias check in AI technologies adoption done by GE10 enterprises—2024. Data source: (Eurostat, 2024).
The main observation was that countries seem to differ in the overall scale of bias testing efforts and the relative focus on bias testing for different types of AI sources. Denmark and Belgium appear as notable outliers. Denmark stood out with its high overall extensiveness and a distinct accent on bias checking for AI that is modified in-house from commercial or open-source software. Malta, in contrast, showed the highest overall range of bias checking across all categories of AI source, without a strong differentiation in focus based on AI origin.
These findings suggested diverse strategic approaches to AI bias management across EU countries, with some countries demonstrating more comprehensive practices overall and others prioritizing bias checks depending on how AI solutions are developed or acquired.
5. Discussion
The analysis of AI adoption trends across EU enterprises from 2021 to 2024 revealed important information about the dynamics of AI integration, the factors influencing adoption and the specialization strategies emerging in different countries. The cluster analysis carried out highlighted clear patterns of differentiation of the adoption strategies of AI technologies related to EU countries. It also uncovered the existence of groups of countries whose adoption strategies are similar and convergent, but also the differentiation between the strategies of countries in different groups. The progress made, as well as the challenges encountered along the way and which still persist in some cases, characterized the dynamics of the adoption process of AI technologies by enterprises in EU countries. The most important feature of this process was the significant increase in the intensity and degree of diffusion regarding the adoption of AI technologies by enterprises in EU countries during the analyzed period. Enterprises have managed to increasingly integrate AI technologies into their business processes, but although it showed an increase, the overall adoption rate still remained in the range of low values. Even if an evolution has been observed, it is still much too slow compared to the global leader, the USA.
One of the most obvious conclusions is that most enterprises in EU countries still prefer to rely heavily on externally developed AI technologies rather than investing in developing their own capabilities internally. By showing this preference for commercial or open-source AI software, it also becomes clear that the enterprises actually prefer ease of implementation and low costs to the difficulties generated by developing internal capabilities. In other words, the enterprises use innovations made by others externally in the field of AI technologies to accelerate their adoption but without incurring high research and development costs.
Another conclusion identified from this study is the dynamics of preferences in the adoption of various types of AI technologies. At the beginning of the analyzed period, enterprises preferred to use AI technologies for PA, ML and TM. Later, after reaching a level of progress considered useful in the case of advanced NLG technologies, highlighted with the launch of ChatGPT, the preferences of enterprises changed significantly. Thus, in 2024, enterprises preferred to use more NLG, TM and SR AI technologies than other types of technologies. Content generation, communication and automation based on AI became a solid foundation for their business processes. Regarding the purposes for which enterprises in EU countries used AI technologies, the conclusions drawn describe an increase in the diversity of the palette of purposes in their use. Initially in 2021, AI technologies were used primarily for ICT security, MS and PP, but later, by 2024, the use of AI technologies was diversified and the focus shifted slightly to their use for BAM, ACFM and RDI. The basis of this diversification lays in the fact that the enterprises recognized the importance of using AI technologies in other processes, not only in those considered traditional, and took an important step towards developing internal AI-based decision-making processes.
The progress made by EU enterprises in adopting AI technologies has been slowed down by a number of barriers. The most important of all the barriers, identified at the company level, was the lack of relevant expertise. Overcoming this requires the creation of training programs in the development of AI technologies in EU countries that do not yet have them, better focusing but also diversifying them towards relevant technologies across all EU countries. It is also necessary to adopt initiatives for talent development and recruitment.
The second most important barrier identified at the EU company level was the high cost of developing and implementing AI technologies. Even if it was not initially perceived as such a difficult barrier, the importance of cost became increasingly important by 2024, especially for small- and medium-sized enterprises.
Other barriers identified concerned the availability and quality of data, regulatory uncertainties and data protection issues.
The analysis carried out at the EU country level showed the existence of significant differences in the adoption of AI technologies. There are two stable groups of countries, noted in all aspects analyzed: a leading group in the adoption of AI technologies, which includes a smaller number of countries, formed by countries such as Denmark, Finland, the Netherlands or Belgium and a larger group of countries lagging behind, typically formed by countries such as Romania, Poland, Bulgaria Hungary, Croatia or Lithuania and which have shown significantly lower adoption rates of AI technologies. Between these extreme groups, one or more groups frequently appear, depending on the subject of the analysis, which are formed by countries showing adoption rates of AI technologies with intermediate values, such as the Czech Republic, Austria, Germany, Greece, Portugal or Spain.
Grouping countries based on their AI adoption strategies showed that there are countries that have relied on AI technologies used for IR, while others have relied on AI used for PP, TM or PM. The existence of these differences showed that AI technology adoption strategies were carried out under the influence of country-specific policies and not unitary at the EU level and, in addition, depend on the existing ICT infrastructure and economic conditions. It is precisely the existence of these differences between countries with a high degree of adoption of AI technologies and those with a low degree of adoption that allows for the policies to be implemented in the field of AI, the digital infrastructure, and, last but not least, the incentives for investment in AI technology to become the main factors in the future acceleration of AI development and the expansion of its use in EU countries.
Another observation highlighted by this study was the different dynamics of AI bias checking. As with other aspects analyzed, countries showed significant differences in the attention paid to bias checking. Countries in the leading group in the adoption of AI technologies, such as Denmark and Belgium, were also leaders in this case. Analyzing the data at the EU country level, it can be concluded that bias checking becomes important, not at early levels of adoption of AI technologies, but after a threshold is exceeded from which the negative effects of bias become visible. Regarding the way in which the checking is carried out depending on the source of origin of AI technologies, a preference for bias checking was observed, especially in the case of externally developed AI systems. A possible explanation is that the enterprises perceived the externally developed AI solutions as being more susceptible to bias than the internally developed models. The lack of a clear legal framework regulating the ethical practices for the development of AI technologies, specifically a set of minimum standards to ensure the fairness and transparency of AI, becomes evident.
The cluster analysis of the AI adoption level in EU countries identified three distinct clusters: countries with a high level of AI adoption, lagging countries with a low level of AI adoption and niche-focused countries which adopted specialized AI. Each of the clusters presents different challenges and requires tailored digital policy and strategic interventions to accelerate AI adoption. Specific recommendations for each cluster are presented below:
- Countries with a high level of AI adoption. This cluster includes countries with a broad and advanced integration of AI across all sectors, such as Denmark, Finland, Belgium, the Netherlands or Sweden. Recommended policies for this group aim to maintain the gained advantage and address advanced challenges to further stimulate innovation:
- –
- Continuous development of highly specialized AI skills and attracting talent globally. The shortage of highly specialized skills in leading AI fields occurs even in their case. Ensuring a permanent resource of expertise to support innovation is achieved by funding advanced AI degree programs at national level, which certify AI professionals and by facilitating partnerships between industry and academics for the continuous improvement of relevant high skills.
- –
- Investment in R&D and in the creation of environments for testing innovations. To translate this into reality, it is necessary to apply policies that balance innovation with AI regulation and control. Recommended measures include increasing funding for AI research and development and creating specialized regulatory testing environments for emerging AI solutions. Countries with high levels of AI adoption should continue to push the boundaries by supporting experimental AI projects in cutting-edge areas. Creating controlled environments with relaxed sandbox regulations allows companies to test their innovations under supervision, while also contributing to the development of better future regulations.
- –
- Improving AI governance and ethical frameworks. As AI is already widely adopted in these countries, the next logical step is to increase regulatory clarity on data privacy, AI ethics and risk management. It is recommended to update national AI strategies by including robust ethical guidelines and clear standards on transparency, safety and responsibility in AI. An example would be the implementation and popularization of mandatory guidance on algorithmic transparency and bias mitigation to help companies innovate with confidence, while ensuring public trust in AI systems.
- –
- Supporting SME adoption and sectoral diffusion. Even in leading countries, there will be SMEs or sectors that will experience gaps in the use of AI. It is necessary to create a system of specific financial incentives in the form of grants or tax credits to encourage the adoption of AI among SMEs and in areas lagging behind. Expanding the system of digital innovation centers to provide access to tools and expertise in the field of AI to SMEs.
- –
- Integrating artificial intelligence in the public sector and sharing data. Translating this recommendation into reality requires the continuous updating of digital government strategies with the aim to implementing AI and developing smart infrastructure in the field of healthcare or public administration. Another recommendation is to create national platforms for sharing high-quality, confidential datasets with AI innovators, thereby improving public services and generating the data resources needed by researchers and companies to develop new AI solutions.
- Countries with a low level of AI adoption. This cluster consists of EU countries with consistently low rates of AI adoption in most technologies and business functions, such as Romania, Bulgaria, Poland. To support faster and more effective adoption of AI, comprehensive measures are needed and to strengthen the foundations of their digital transformation strategies and policies:
- –
- Investments in digital infrastructure and connectivity. To support AI adoption, it is essential, first of all, to strengthen digital infrastructure, which can be achieved by improving connectivity and access to high-speed internet. Governments should prioritize investments in expanding networks in industrial areas, facilitating access of enterprises to cloud computing and high-performance computing services by implementing national programs or through European funds.
- –
- Implementation of a national AI strategy with funding. To accelerate the adoption of artificial intelligence, it is very important that each country, if it does not already have one, to develop a well-defined national AI strategy, based on adequate funding, and to implement it. The strategy should set clear objectives and budgets through concrete support programs, aimed at increasing the use of AI, especially among enterprises. The real involvement of enterprises should be stimulated using European funds and state aid to offer grants or tax incentives to companies that invest in AI solutions, while linking these financial benefits to the achievement of concrete measurable results.
- –
- Workforce training and digital skills programs. The lack of relevant expertise for AI is a major barrier in these countries, which is why large-scale upskilling is of utmost importance. Governments should implement measures to stimulate the organization of free or subsidized courses aimed to development of digital skills and specialized AI competencies, addressed to employees and job seekers, but also the integration of AI specialization modules in university programs and vocational education.
- –
- Promote awareness and success stories related to AI. Many companies in countries with low AI adoption are unaware of the benefits of using AI, while others are hesitant due to perceived complexity. To stimulate AI adoption, awareness of the benefits of using AI must be actively promoted and measures taken to reduce the fear of complexity. Implementing information campaigns and pilot projects in key sectors, such as industry or public services, practically popularizes the positive impact of AI. Officially promoting success stories with clear results, such as reducing downtime through predictive maintenance, inspires companies to try using AI solutions and encourages them to expand their adoption.
- –
- Regulatory clarity and testing environments. The lack of legislative clarity in the field of AI use does not encourage its adoption, especially in sensitive areas such as data protection or legal liability. Therefore, the implementation of clear guidelines on the application of existing regulations and aligning national legislation with EU legislation can help overcome this obstacle. The creation of sandbox environments for registering and testing AI systems under appropriate monitoring, without immediate compliance obligations, provides companies with a safe environment for innovation and reduces uncertainty and compliance costs, encourages investments in AI solutions and helps authorities to adapt existing regulations.
- –
- Public sector as an AI enabler. The state can have a more important role in promoting the adoption of AI by implementing government services based on AI solutions, such as automatic detection of tax fraud, chatbots supporting online administration or optimizing road traffic in cities. In this way, more efficient services are provided to the population, but also provide concrete examples for the private sector to follow. Another measure by which the state can stimulate the adoption of AI can be the launch of public procurement based on a bidding system or competition of solutions that explicitly request the development of AI solutions for real needs.
- –
- Regional and European collaboration. Countries in this cluster must integrate into a European AI ecosystem to reduce the gap and to more easily benefit from a fair digital transformation. Therefore, they should make the best use of European initiatives and partnerships to overcome the barriers encountered in the adoption process of AI. Active participation in European programs such as Digital Europe, Horizon Europe or European Digital Innovation Hubs gives them access to funding, relevant expertise and essential tools to accelerate the adoption of AI. Also, the adoption of AI can be accelerated by establishing regional collaborations based on partnerships with countries with a high level of AI adoption or by implementing joint infrastructure projects for the development of AI.
- Niche-focused countries. This cluster includes countries with moderate overall adoption of AI and strong specialization in certain AI technologies, such as Malta and Slovenia. These countries have achieved high adoption level in specific areas of AI and lagged behind in others, leaving them with specialized expertise only in the areas where they excel. Their AI policies and strategy should aim to expand the use of AI, while capitalizing on their expertise in areas of excellence:
- –
- Update the digital transformation and AI strategies by policymakers to diversify AI adoption in other fields. The updated strategies should ensure continued support for highly developed AI areas, set clear goals to ensure the expansion of AI use in other new sectors, allocate R&D funds to more AI areas and develop a system of incentives, not just financial, for developers of AI projects in new areas.
- –
- Capitalize on existing strengths by establishing centers of excellence or innovation clusters for the specialized field of AI excellence. Attracting other companies and highly qualified researchers strengthens the countries’ reputation for excellence and generates indirect benefits, such as foreign investment and highly skilled jobs. Implementing this recommendation involves creating a system of grants or tax breaks for companies operating in areas of AI excellence, with the aim of developing regional AI centers specialized in AI areas of excellence, thus turning specialization into a competitive advantage.
- –
- Encourage knowledge transfer and partnership building. Facilitate partnerships with leading AI countries to import know-how in areas other than those of excellence by participating in innovation networks developed by the EU. In this way, local companies and regulators come into direct contact with a wide range of AI use cases and accelerate the learning process.
- –
- Develop specific skills in new AI areas. Launching government-specific training initiatives to develop expertise beyond the niche domain by introducing specialized courses into the educational offer of universities, bootcamps or retraining programs in other disciplines, stimulating students through scholarships to study AI abroad in various fields and their employment in local companies.
- –
- Developing an adaptive regulatory framework. Implementing clear regulations, namely a system of sandbox testing environments for new domains, so that companies can safely innovate in new AI domains and at the same time not be discouraged by legal uncertainty.
6. Conclusions
This study conducted a comprehensive analysis of the main characteristics of the adoption of AI technologies by enterprises in EU countries from 2021 to 2024, highlighting the strategic directions chosen by the countries, the dynamics of the process, and the challenges encountered. The main conclusions drawn are presented below.
A first conclusion is that the adoption of AI technologies has intensified, the adoption rate of AI technologies has almost doubled compared to 2020, but compared to other countries, such as the USA, the overall adoption rate was still very low. In some EU countries, enterprises have quickly embraced AI technologies, while in others the adoption process has been delayed and slow due to economic, but especially structural, constraints.
The vast majority of enterprises in EU countries preferred to rely on externally developed AI technologies rather than invest in the development of their own AI technologies. This preference highlights a strong need for access to high-quality AI solutions that can potentially be easily implemented.
The enterprises have quickly understood the benefits of AI technologies across all industries and have increased the diversity of business processes in which they have used AI technologies, covering processes ranging from ICT security and marketing to financial management and research and development.
The lack of expertise in the development of AI technologies was the most difficult barrier faced by enterprises in the adoption process. The need for specialized training and adaptation of skills in this area for the workforce was evident.
Weak regulation and data privacy issues slowed the adoption of AI technologies. If for a long time the barriers related to technical and regulatory capacities were the main problems encountered in the implementation process, by 2024, especially in the case of SMEs, a new main factor represented by cost has emerged.
The analysis of patterns in the adoption of AI technologies highlighted divergent approaches across EU countries. Some EU countries preferred to specialize in using AI for IR, for example, while others preferred to use AI for TM or WA. This divergence suggests that a one-size-fits-all policy on AI might not be effective for all EU countries. Differences were also recorded between enterprises from different countries in terms of assessing the bias of AI technologies, with a clear preference for checking the externally developed AI solutions.
The applied importance of this study is evident in the way it provides a data-driven foundation for strategic decisions that will shape the adoption of AI at a European level. The tailored recommendations at the level of the identified clusters constitute fundamental components for a practical roadmap for policymakers, helping to improve digital transformation programs and better tailor AI regulatory policies to reality.
Considering the limitations of this study, it would be better to extend the time frame beyond 2024 to determine whether the patterns identified persist. It is foreseeable that the advancement in the field of AI will continue to accelerate and this could generate new patterns. The inclusion of additional indicators, such as the degree of use of AI at the level of each sector, indicators that assess the capacity for innovation or indicators for assessing human capital, would complement and improve the present analysis. Also, a more detailed analysis of cross-national comparisons through longitudinal studies or in-depth case studies would better clarify how national policies and market conditions influence the characteristics of AI adoption over time.
Funding
This research received no external funding.
Institutional Review Board Statement
Not applicable.
Informed Consent Statement
Not applicable.
Data Availability Statement
Data used in this paper are freely available on EUROSTAT: https://ec.europa.eu/eurostat/web/digital-economy-and-society/database/comprehensive-database, accessed on 26 January 2025.
Conflicts of Interest
The author declares no conflicts of interest.
Abbreviations
The following abbreviations are used in this manuscript:
| AI | Artificial intelligence |
| BAM | Business Administration or Management |
| EU | European Union |
| GE10 | Enterprises with at least 10 employees |
| ICT | Information and Communication Technology |
| IR | Image Recognition |
| MIS | Management Information Systems |
| ML | Machine Learning |
| MS | Marketing or Sales |
| NLG | Natural language generation |
| PA | Process automation |
| PCA | Principal component analysis |
| PM | Physical Movement |
| PP | Production Processes |
| RDI | R&D or innovation |
| SME | Small and medium-sized enterprises |
| SR | Speech recognition |
| TM | Text mining |
| WA | Workflow Automation |
References
- Agrawal, A., Gans, J., & Goldfarb, A. (2018). Prediction machines: The simple economics of artificial intelligence. Harvard Business Review Press. Available online: https://www.hachettebookgroup.com/titles/ajay-agrawal/prediction-machines/9781633695672/ (accessed on 3 February 2025).
- Ahmed, M., Seraj, R., & Islam, S. M. S. (2020). The k-means algorithm: A comprehensive survey and performance evaluation. Electronics, 9(8), 1295. [Google Scholar] [CrossRef]
- Albanesi, S., Silva, A. D. d., Jimeno, J. F., Lamo, A., & Wabitsch, A. (2023). New technologies and jobs in Europe. Social Science Research Network. [Google Scholar] [CrossRef]
- Atkinson, J., & Collins, P. (2023). Artificial intelligence and human rights at work. Available online: https://academic.oup.com/oxford-law-pro/book/57647/chapter-abstract/472191970?redirectedFrom=fulltext (accessed on 5 February 2025). [CrossRef]
- Brynjolfsson, E., Rock, D., & Syverson, C. (2018). Artificial intelligence and the modern productivity paradox: A clash of expectations and statistics. American Economic Association Papers and Proceedings, 108, 18–22. Available online: https://www.aeaweb.org/articles?id=10.1257/pandp.20181090 (accessed on 5 February 2025).
- Caliński, T., & Harabasz, J. (1974). A dendrite method for cluster analysis. Communications in Statistics, 3(1), 1–27. [Google Scholar] [CrossRef]
- Cazzaniga, M., Jaumotte, F., Li, L., Melina, G., Panton, A. J., Pizzinelli, C., Rockall, E., & Tavares, M. M. (2024). Gen-AI: Artificial intelligence and the future of work. IMF Staff Discussion Note SDN2024/001. International Monetary Fund. [Google Scholar] [CrossRef]
- Celebi, M. E., Kingravi, H. A., & Vela, P. A. (2013). A comparative study of efficient initialization methods for the k-means clustering algorithm. Expert Systems with Applications, 40(1), 200–210. [Google Scholar] [CrossRef]
- Davies, D. L., & Bouldin, D. W. (1979). A cluster separation measure. IEEE Transactions on Pattern Analysis and Machine Intelligence, PAMI-1, 224–227. [Google Scholar] [CrossRef]
- European Commission. (2018). European approach to artificial intelligence. Available online: https://ec.europa.eu/digital-single-market/en/artificial-intelligence (accessed on 3 February 2025).
- European Commission. (2024). EU-AI act. Available online: https://digital-strategy.ec.europa.eu/en/policies/regulatory-framework-ai (accessed on 3 February 2025).
- Eurostat. (2024). Digital economy and society, comprehensive database. Available online: https://ec.europa.eu/eurostat/web/digital-economy-and-society/database/comprehensive-database (accessed on 3 February 2025).
- Gualandri, F., & Kuzior, A. (2024). Drivers of AI adoption in enterprises: A European-wide analysis. Materials Research Proceedings, 45, 240–248. [Google Scholar] [CrossRef]
- Hartigan, J. A. (1975). Clustering algorithms. John Wiley & Sons, Inc. ISBN 0-471-35645-X. [Google Scholar]
- Hartigan, J. A., & Wong, M. A. (1979). Algorithm AS 136: A K-means clustering algorithm. Journal of the Royal Statistical Society, Series C (Applied Statistics), 28(1), 100–108. [Google Scholar] [CrossRef]
- Ikotun, A. M., Ezugwu, A. E., Abualigah, L., Abuhaija, B., & Heming, J. (2023). K-means clustering algorithms: A comprehensive review, variants analysis, and advances in the era of big data. Information Sciences, 622, 178–210. [Google Scholar] [CrossRef]
- Kumar, K. Y., & Das, V. T. (2024). Role of artificial intelligence in enhancing productivity and human-machine integration-industry 5.0-an empirical analysis. EPRA International Journal of Economics, Business and Management, 7, 1–9. [Google Scholar] [CrossRef]
- Kumar, S., & Mittal, S. (2024). Employee learning and skilling in AI embedded organizations—Predictors and outcomes. Development and Learning in Organizations, 38(4), 11–15. [Google Scholar] [CrossRef]
- Kurniawan, A., Khuzaini, K., & Shaddiq, S. (2024). Application of artificial intelligence in increasing the effectiveness of HR behavior in the era of industry 4.0. Systematic literature review method. Proceeding: Islamic University of Kalimantan. [Google Scholar] [CrossRef]
- Li, L. (2022). Reskilling and upskilling the future-ready workforce for Industry 4.0 and beyond. Information Systems Frontiers, 26(5), 1697–1712. [Google Scholar] [CrossRef] [PubMed]
- Liang, Y. (2024). The impact of artificial intelligence on employment and income distribution. Journal of Education, Humanities and Social Sciences, 27, 166–171. [Google Scholar] [CrossRef]
- Lloyd, S. (1982). Least squares quantization in PCM. IEEE Transactions on Information Theory, 28(2), 129–137. [Google Scholar] [CrossRef]
- Luise, G. (2024). The European path to artificial intelligence: The innovation of the 21st century. Perspective Politice. [Google Scholar] [CrossRef]
- MacQueen, J. B. (1967). Some methods for classification and analysis of multivariate observations. In Proceedings of the 5th Berkeley symposium on mathematical statistics and probability, volume 1: Statistics (pp. 281–297). University of California Press. Available online: http://projecteuclid.org/euclid.bsmsp/1200512992 (accessed on 5 February 2025).
- Manyika, J., Chui, M., Miremadi, M., Bughin, J., George, K., Willmott, P., & Dewhurst, M. (2017). A future that works: Automation, employment, and productivity. McKinsey Global Institute. Available online: https://www.mckinsey.com/~/media/mckinsey/featured%20insights/digital%20disruption/harnessing%20automation%20for%20a%20future%20that%20works/mgi-a-future-that-works-full-report-updated.pdf (accessed on 3 February 2025).
- Marino, A., Pariso, P., & Picariello, M. (2022). Transition towards the artificial intelligence via re-engineering of digital platforms: Comparing European Member States. Entrepreneurship and Sustainability Issues, 9(3), 350. [Google Scholar] [CrossRef]
- Mudholkar, P., & Mudholkar, M. (2024). Revolutionizing performance management: A Comprehensive review of AI and IoT impacts. Journal of Informatics Education and Research, 4(1), 602–611. [Google Scholar] [CrossRef]
- Popa, D. M. (2024). Frontrunner model for responsible AI governance in the public sector: The Dutch perspective. AI and Ethics. [Google Scholar] [CrossRef]
- Rousseeuw, P. J. (1987). Silhouettes: A graphical aid to the interpretation and validation of cluster analysis. Journal of Computational and Applied Mathematics, 20(1), 53–65. [Google Scholar] [CrossRef]
- Rožman, M., Tominc, P., & Milfelner, B. (2023). Maximizing employee engagement through artificial intelligent organizational culture in the context of leadership and training of employees: Testing linear and non-linear relationships. Cogent Business & Management, 10(2), 2248732. [Google Scholar] [CrossRef]
- Santhosh, A., Unnikrishnan, R., Shibu, S., Meenakshi, K. M., & Joseph, G. (2023). AI impact on job automation. International Journal of Engineering Technology and Management Sciences, 7, 410–425. [Google Scholar] [CrossRef]
- Susilo, B. W., & Susanto, E. (2024). Employing artificial intelligence in management information systems to improve business efficiency. Journal of Management and Informatics, 3(2), 212–229. [Google Scholar] [CrossRef]
- Tibshirani, R., Walther, G., & Hastie, T. (2001). Estimating the number of clusters in a data set via the gap statistic. The Journal of the Royal Statistical Society, Series B (Statistical Methodology), 63(2), 411–423. [Google Scholar] [CrossRef]
- Tortoise Media. (2024). The global AI index. Available online: https://www.tortoisemedia.com/intelligence/global-ai#rankings (accessed on 23 February 2025).
- Woszczyna, K., & Mania, K. (2023). The European map of artificial intelligence development policies: A comparative analysis. International Journal of Contemporary Management, 59(3), 78–87. [Google Scholar] [CrossRef]
- Yi, Z., & Ayangbah, S. (2024). The impact of AI innovation management on organizational productivity and economic growth: An analytical study. International Journal of Business Management and Economic Review, 7, 61–84. [Google Scholar] [CrossRef]
- Zahidi, S., Ratcheva, V., Hingel, G., & Brown, S. (2020). The future of jobs report 2020. World Economic Forum. Available online: https://www3.weforum.org/docs/WEF_Future_of_Jobs_2020.pdf (accessed on 3 February 2025).

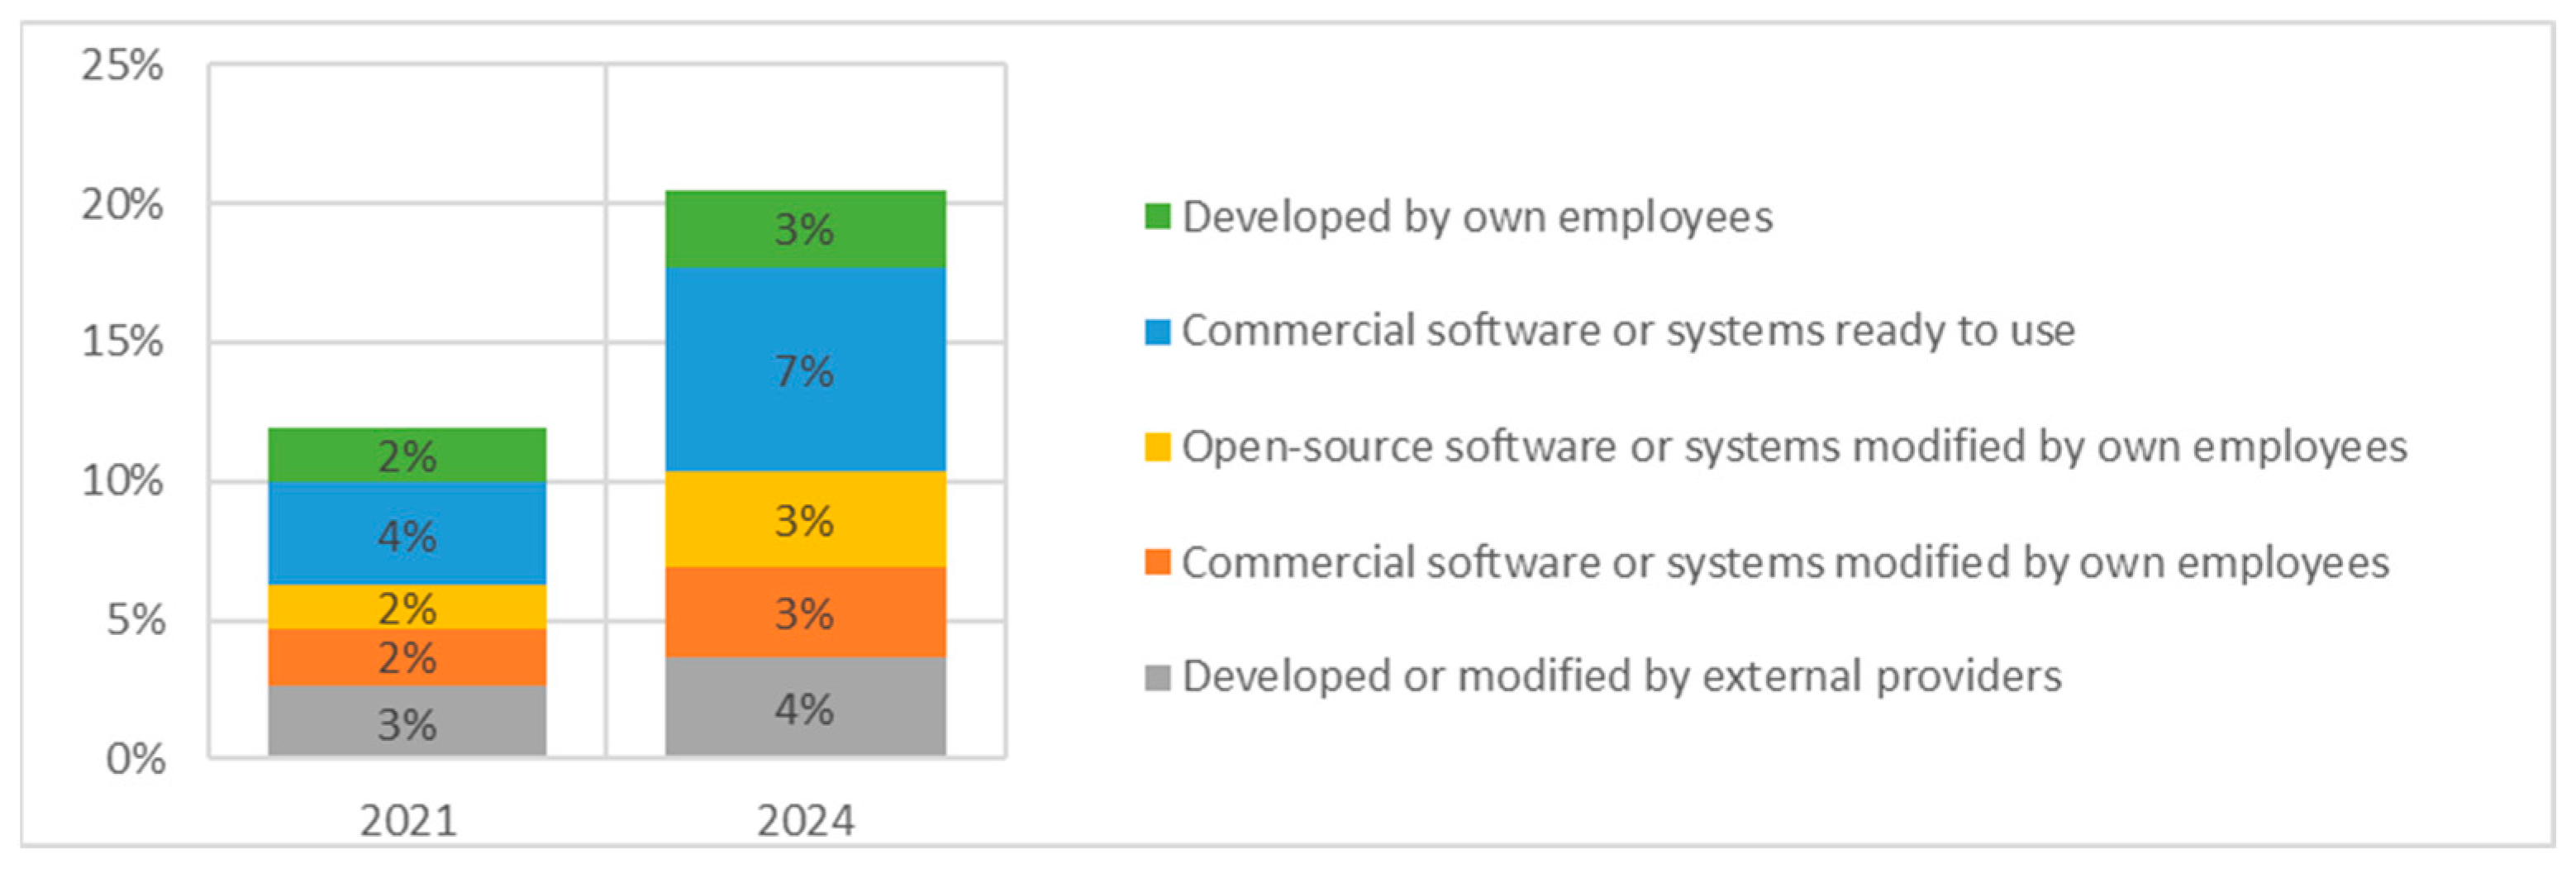


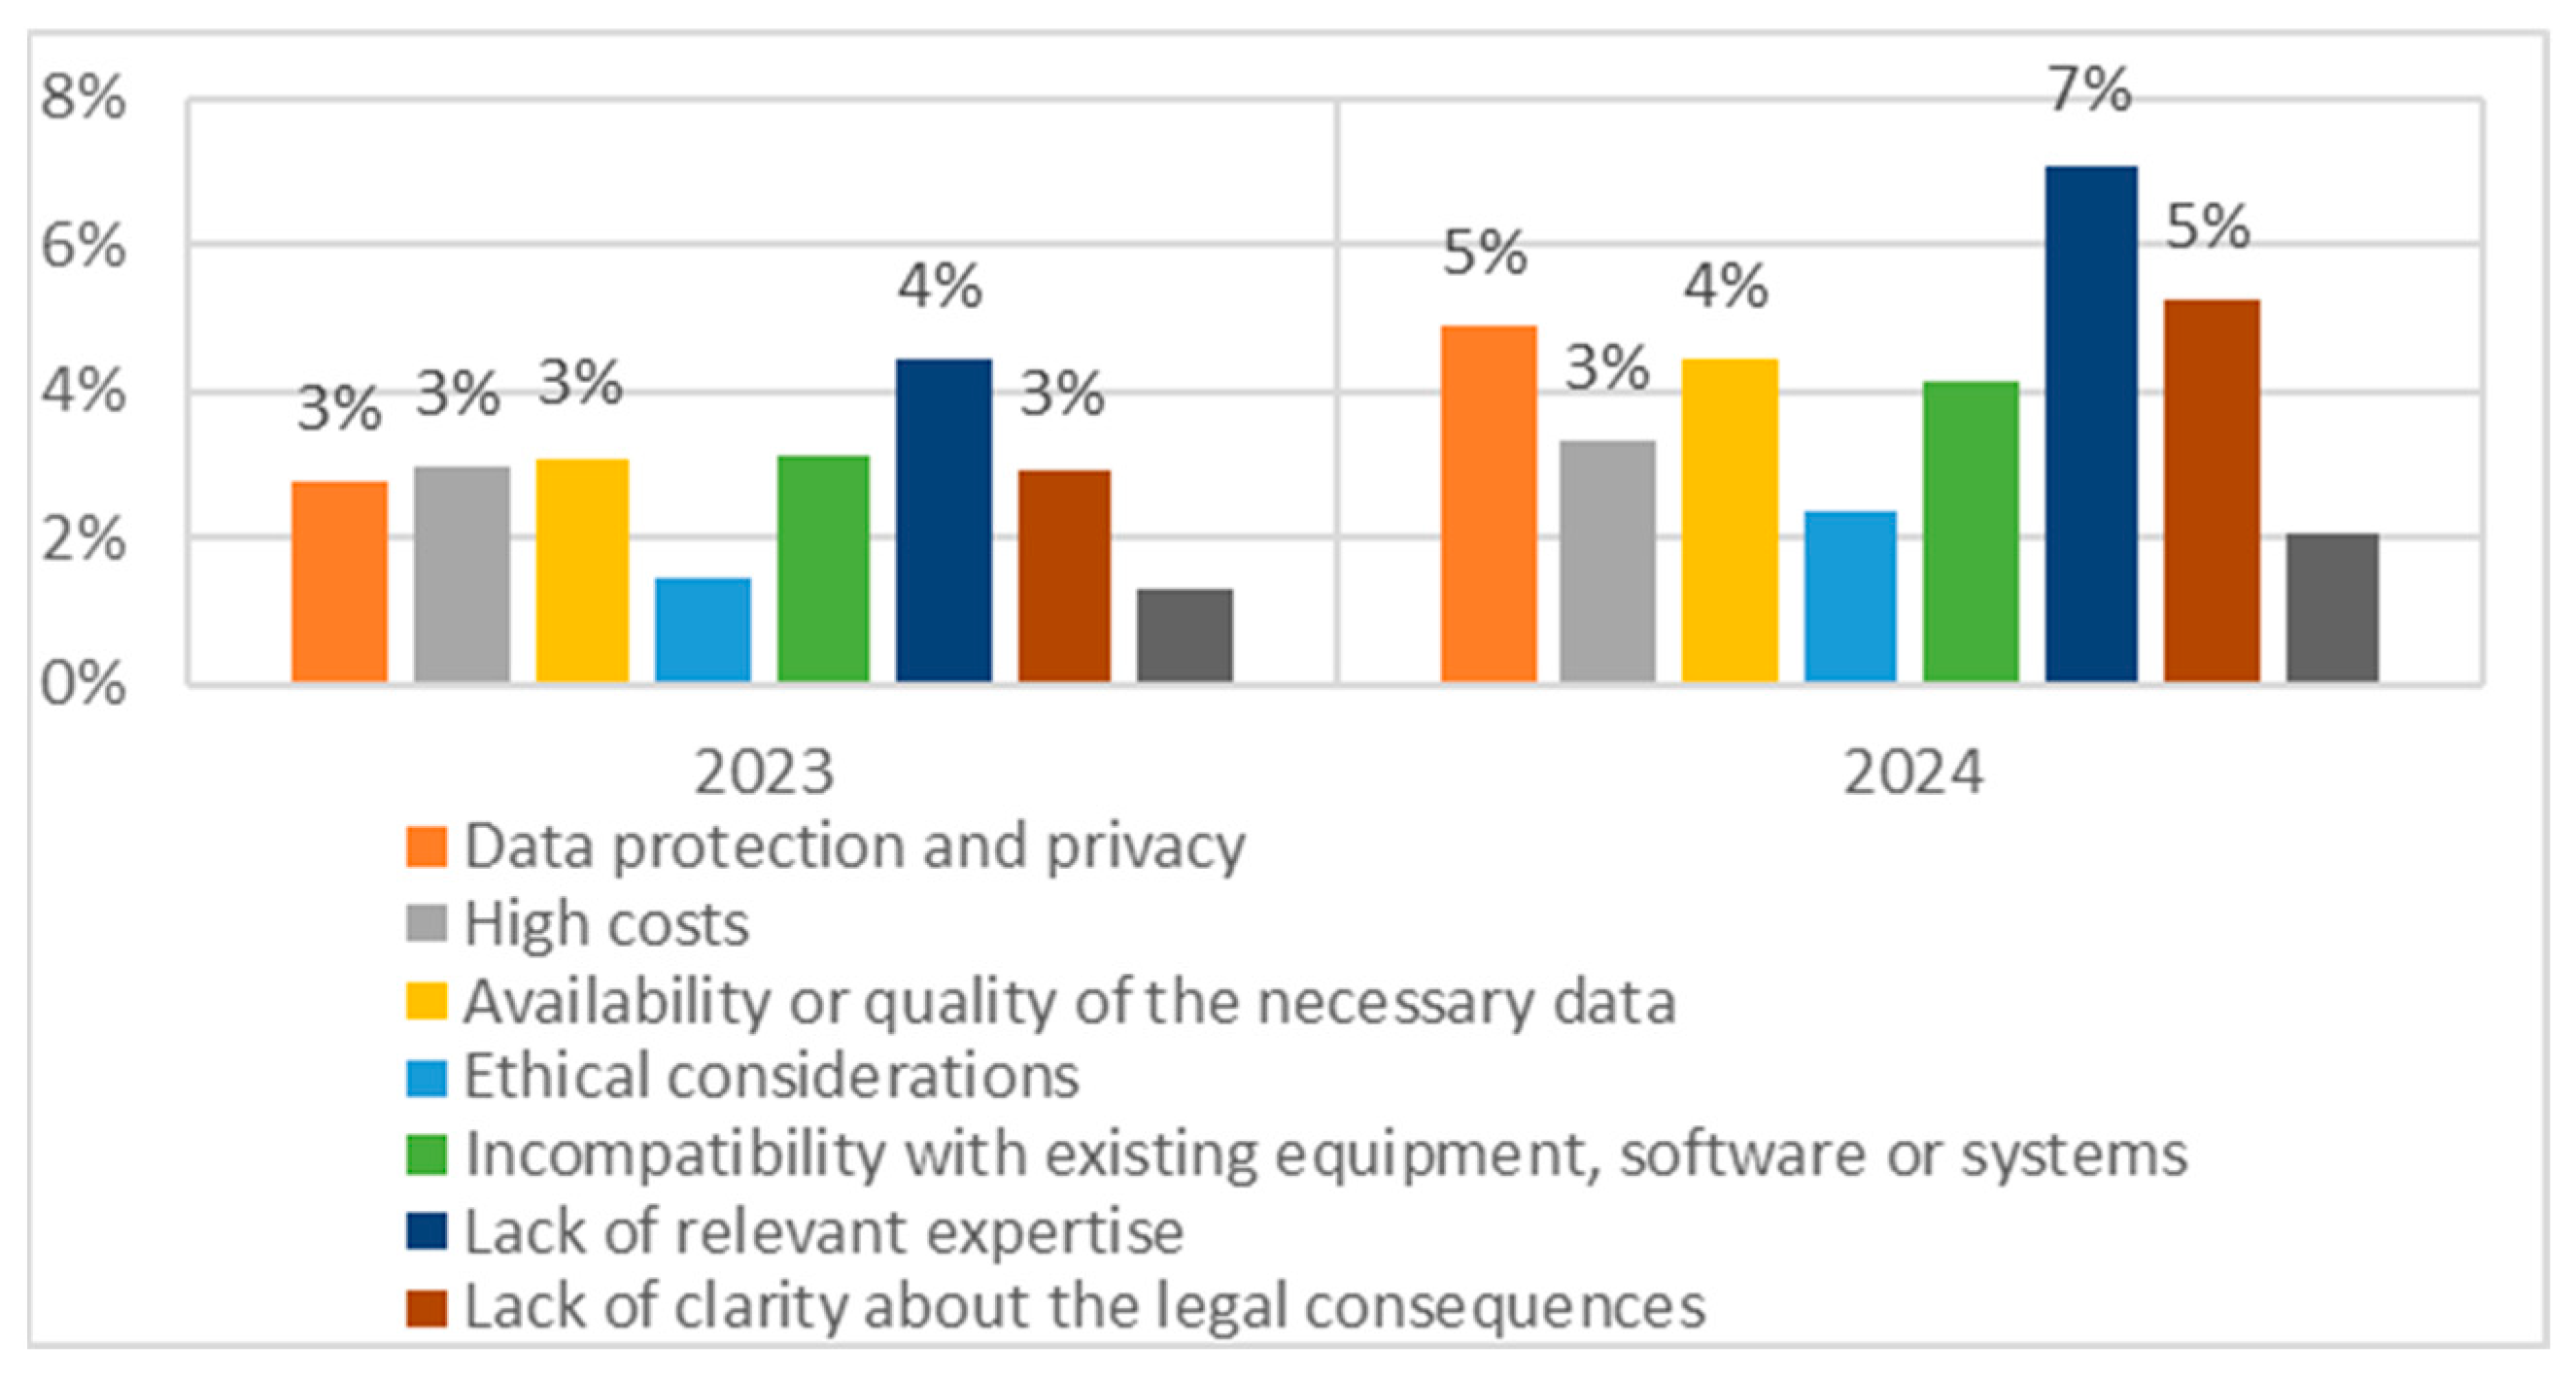
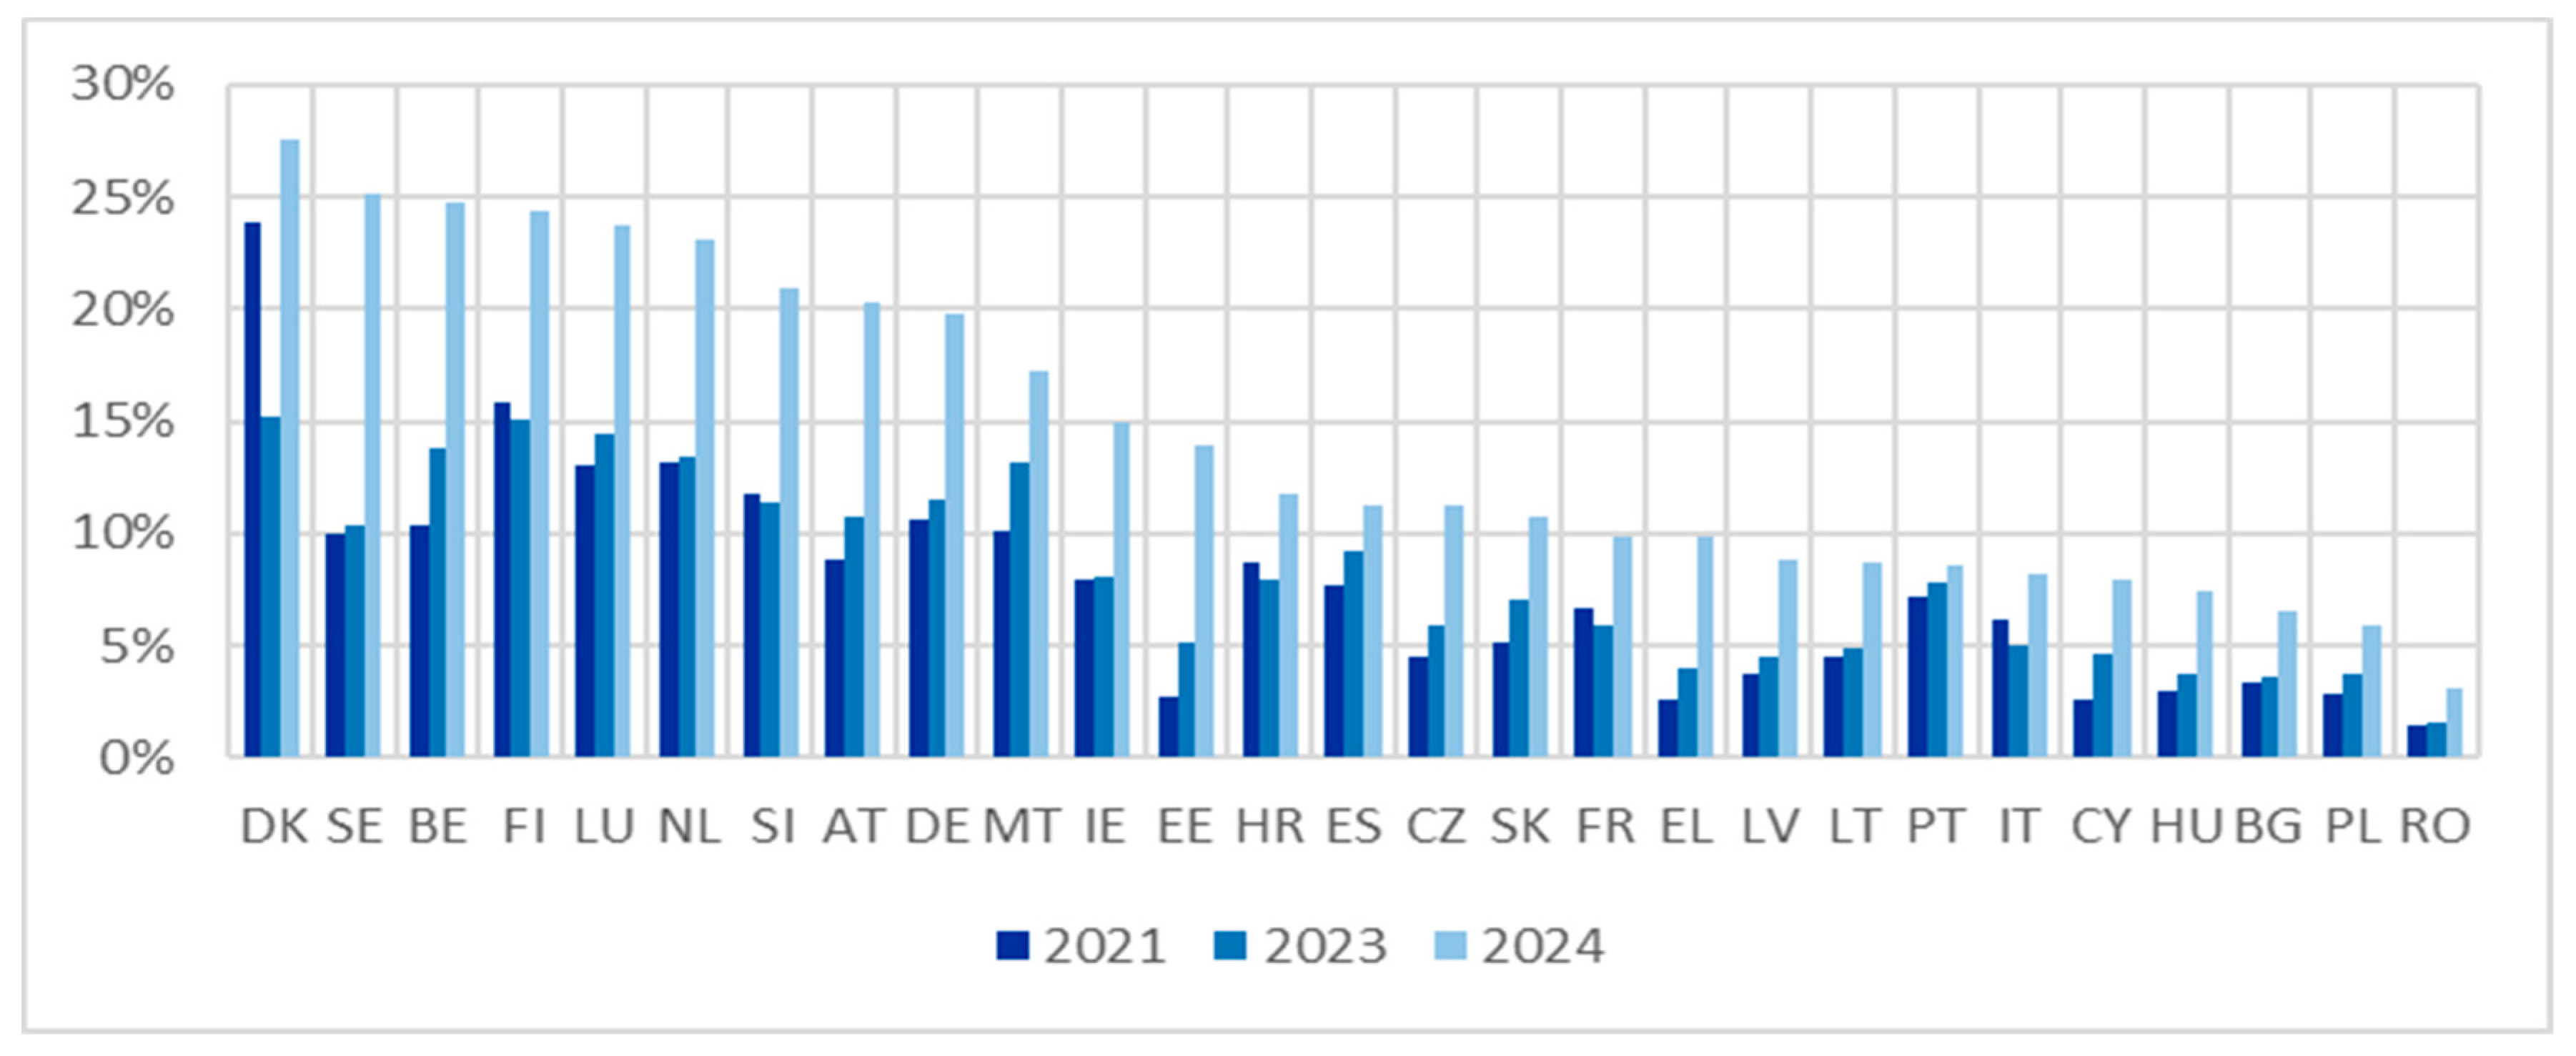

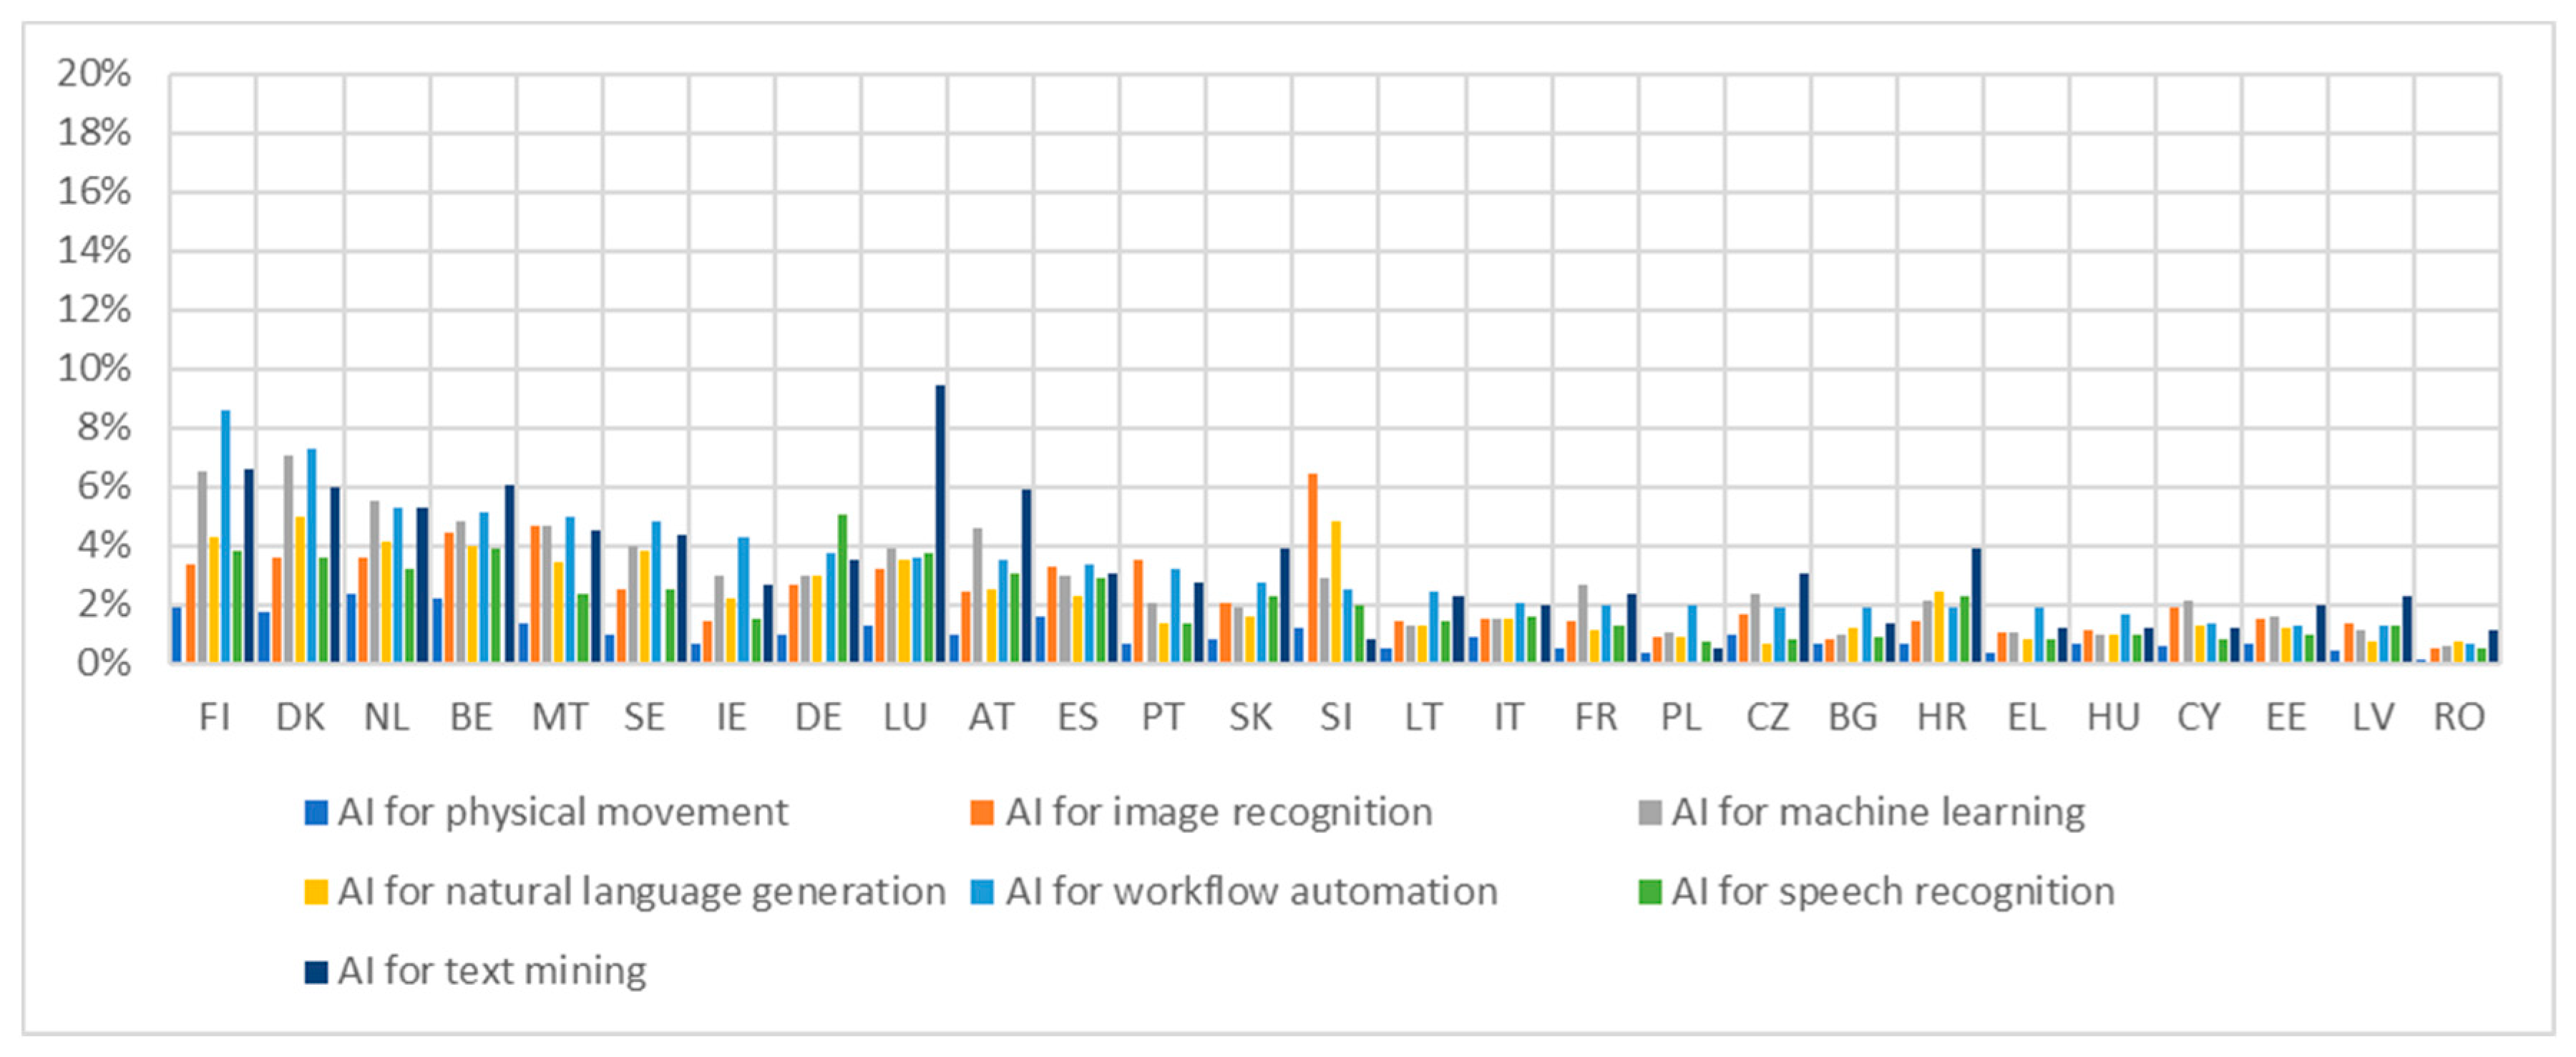
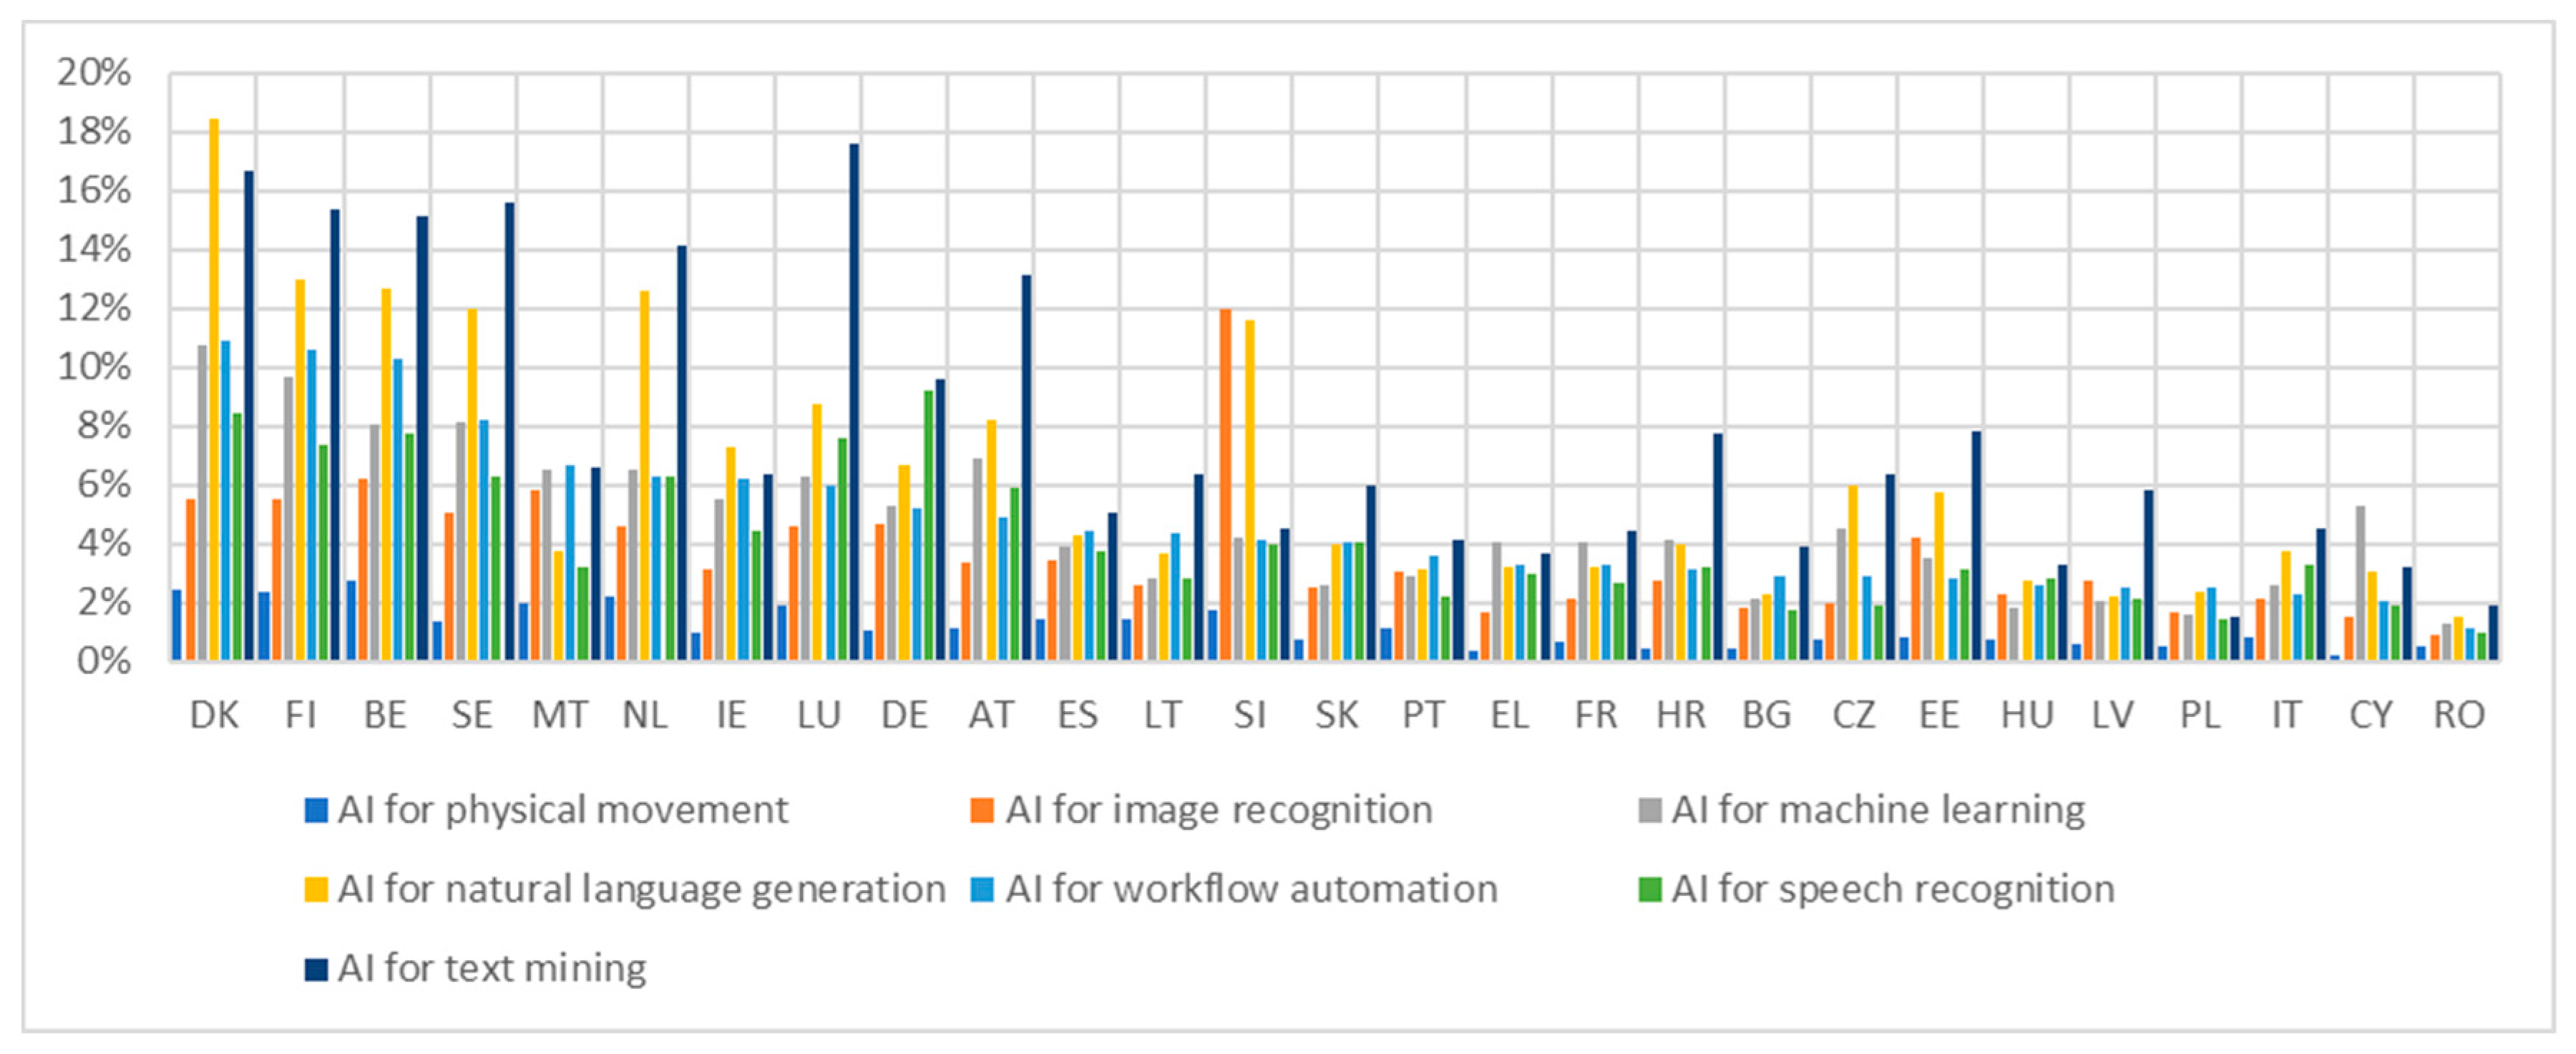


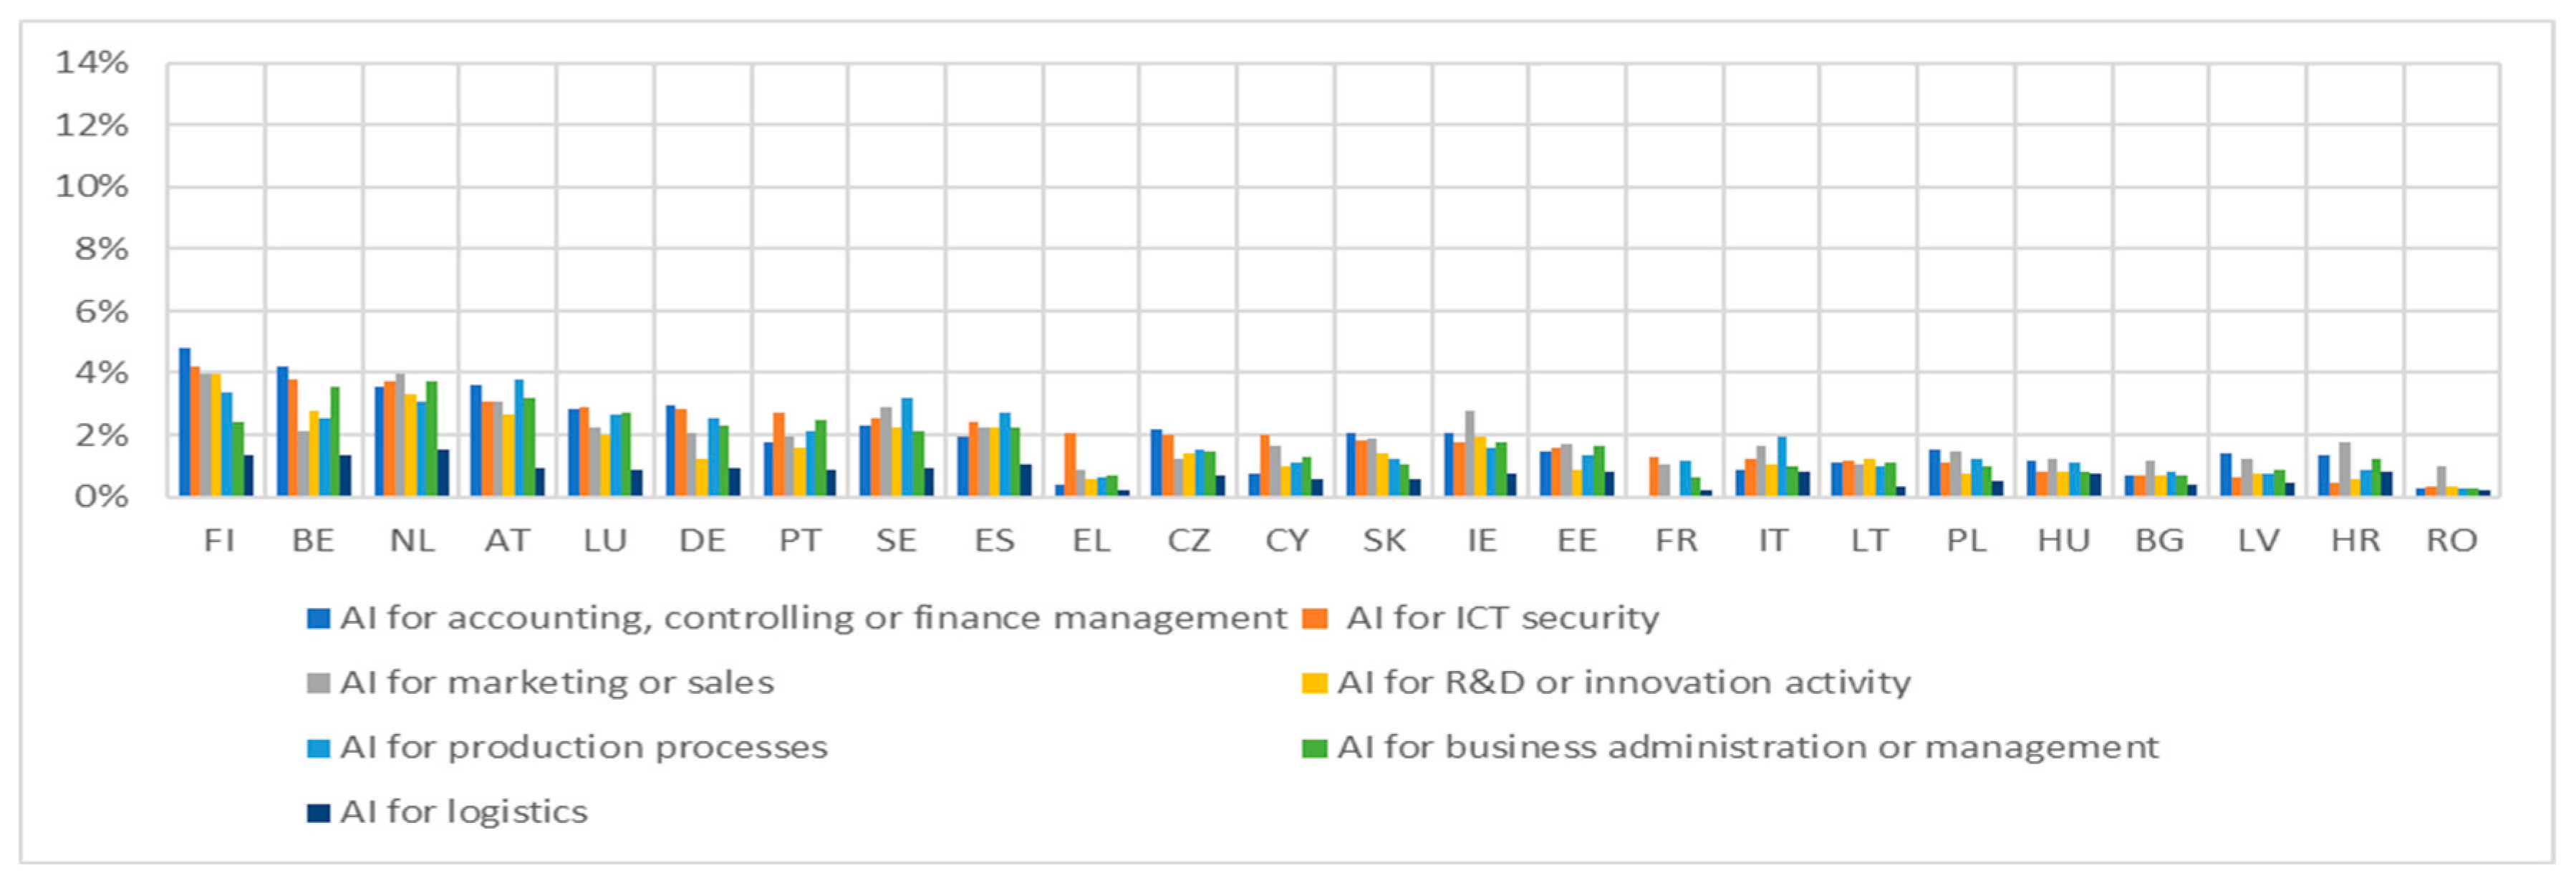
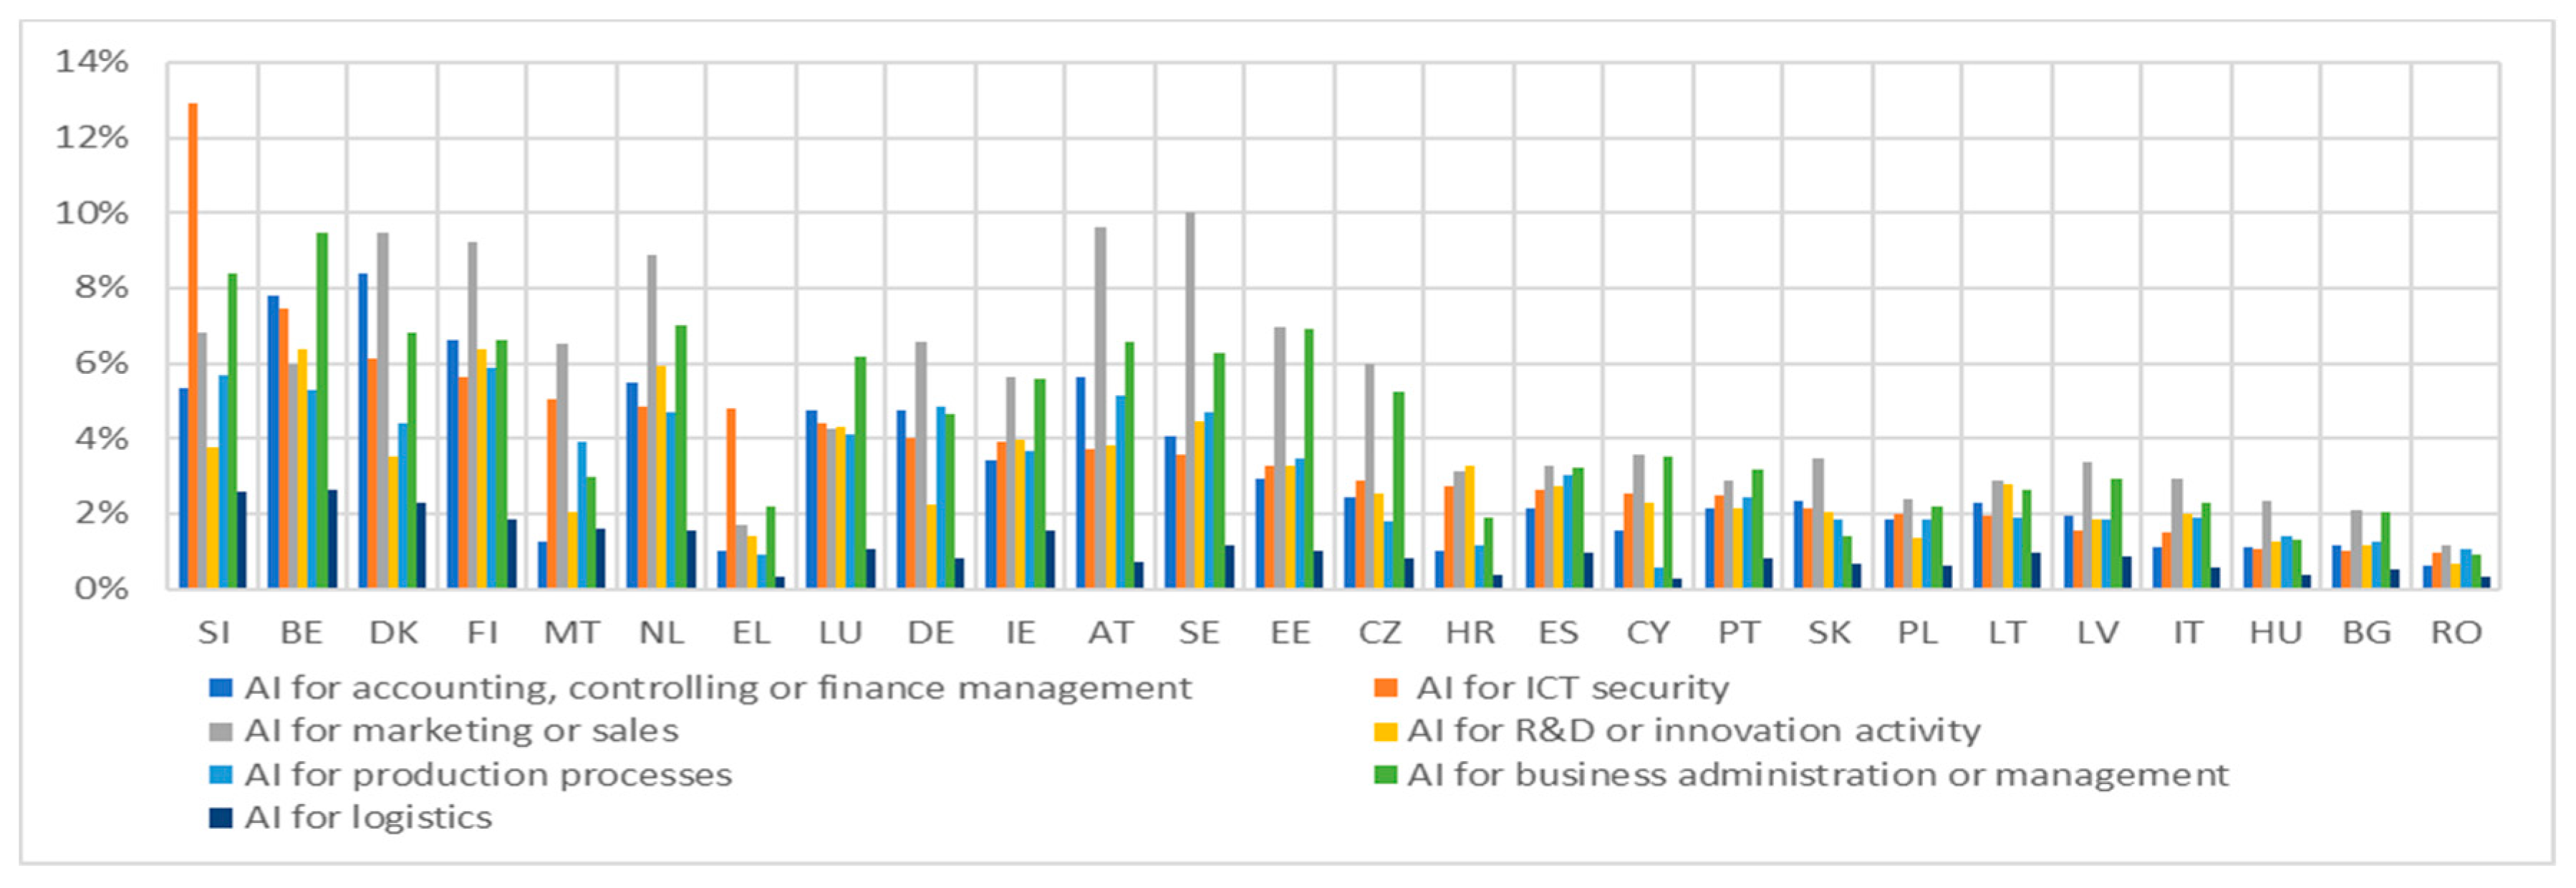
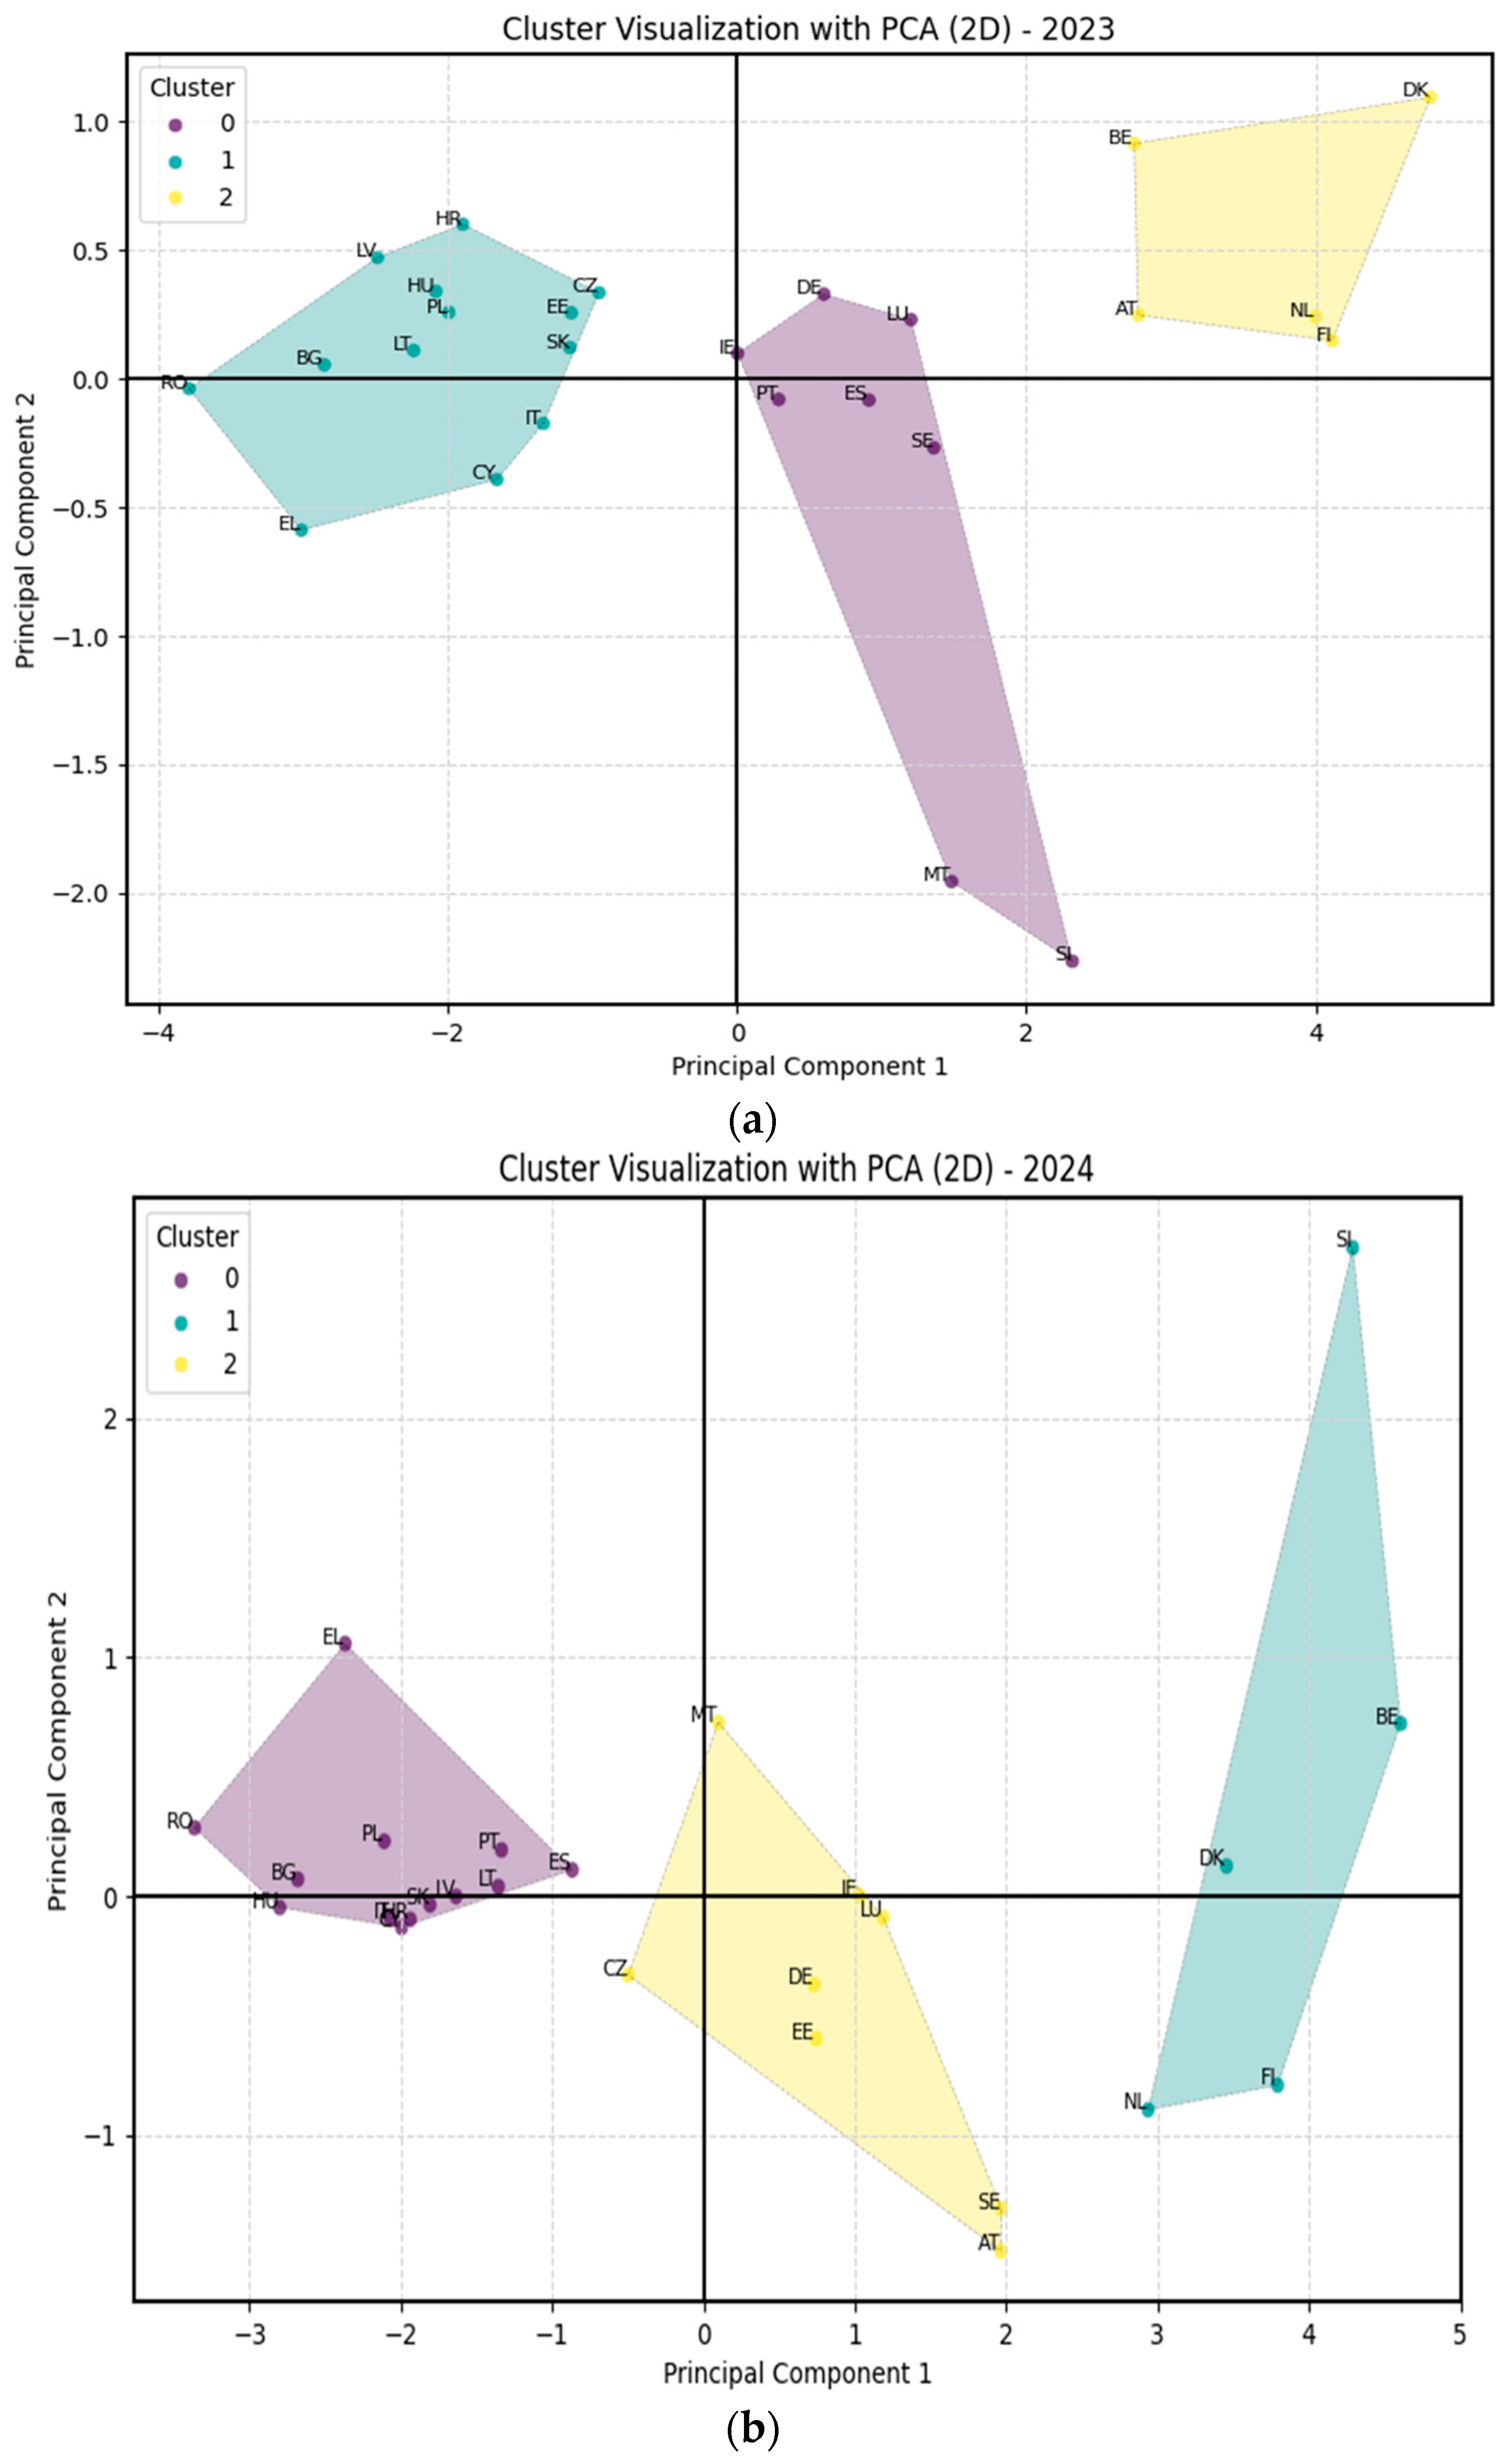
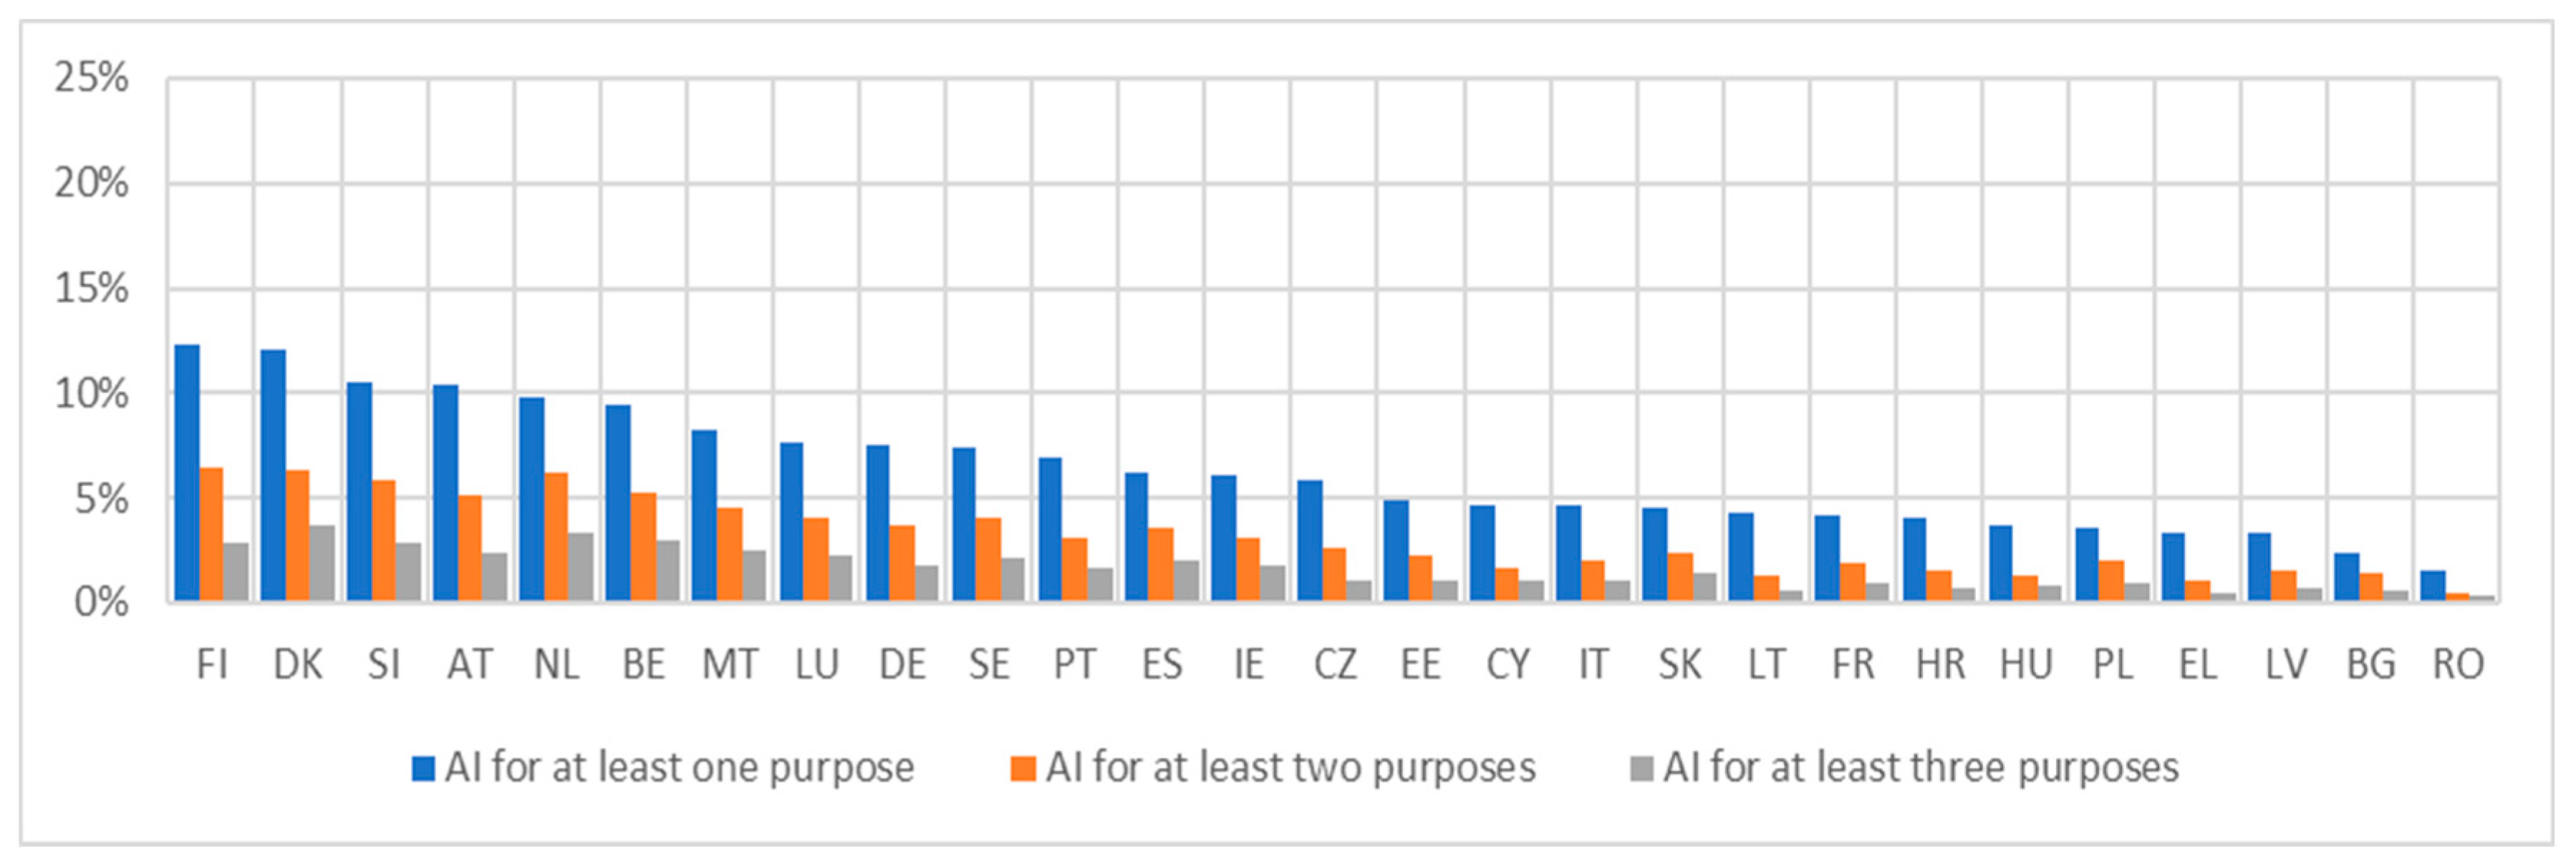
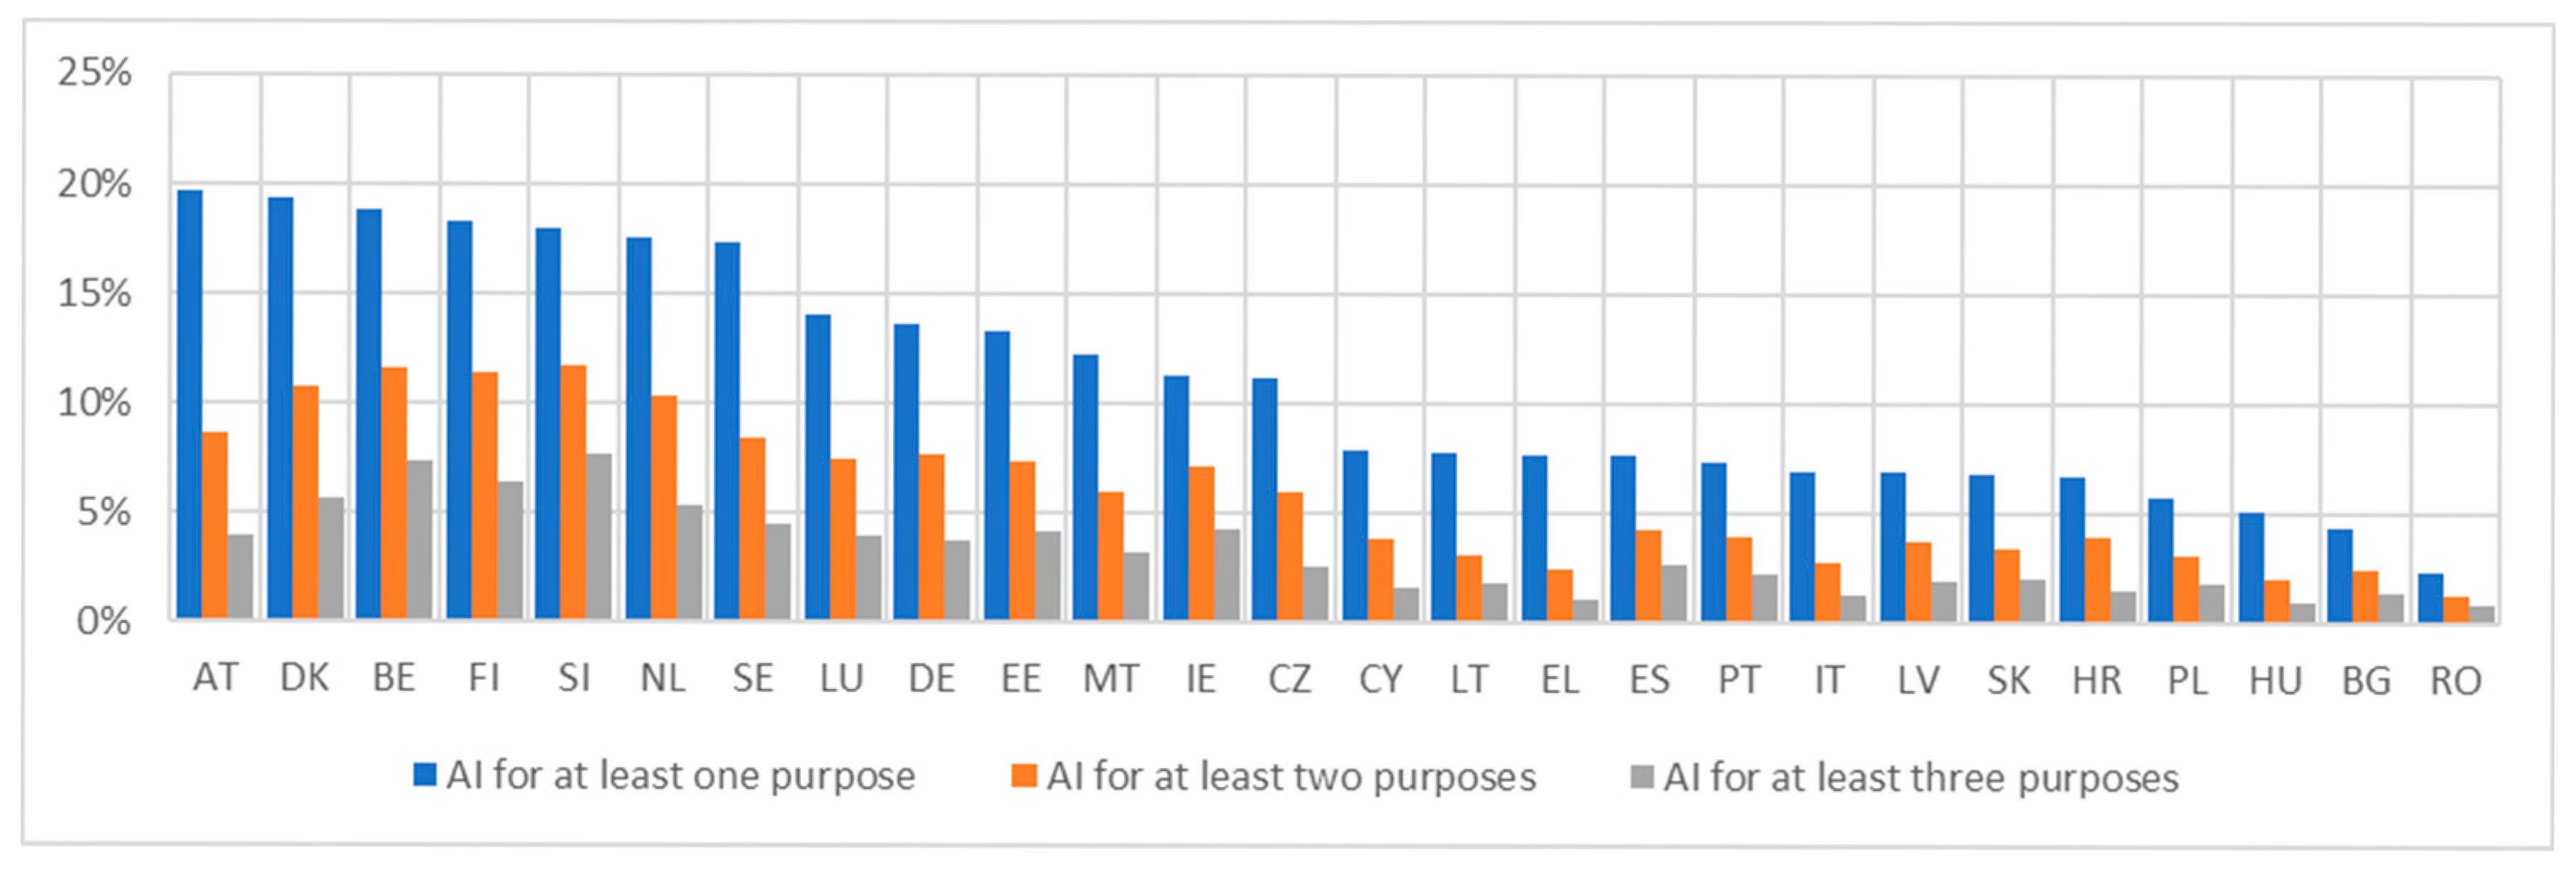
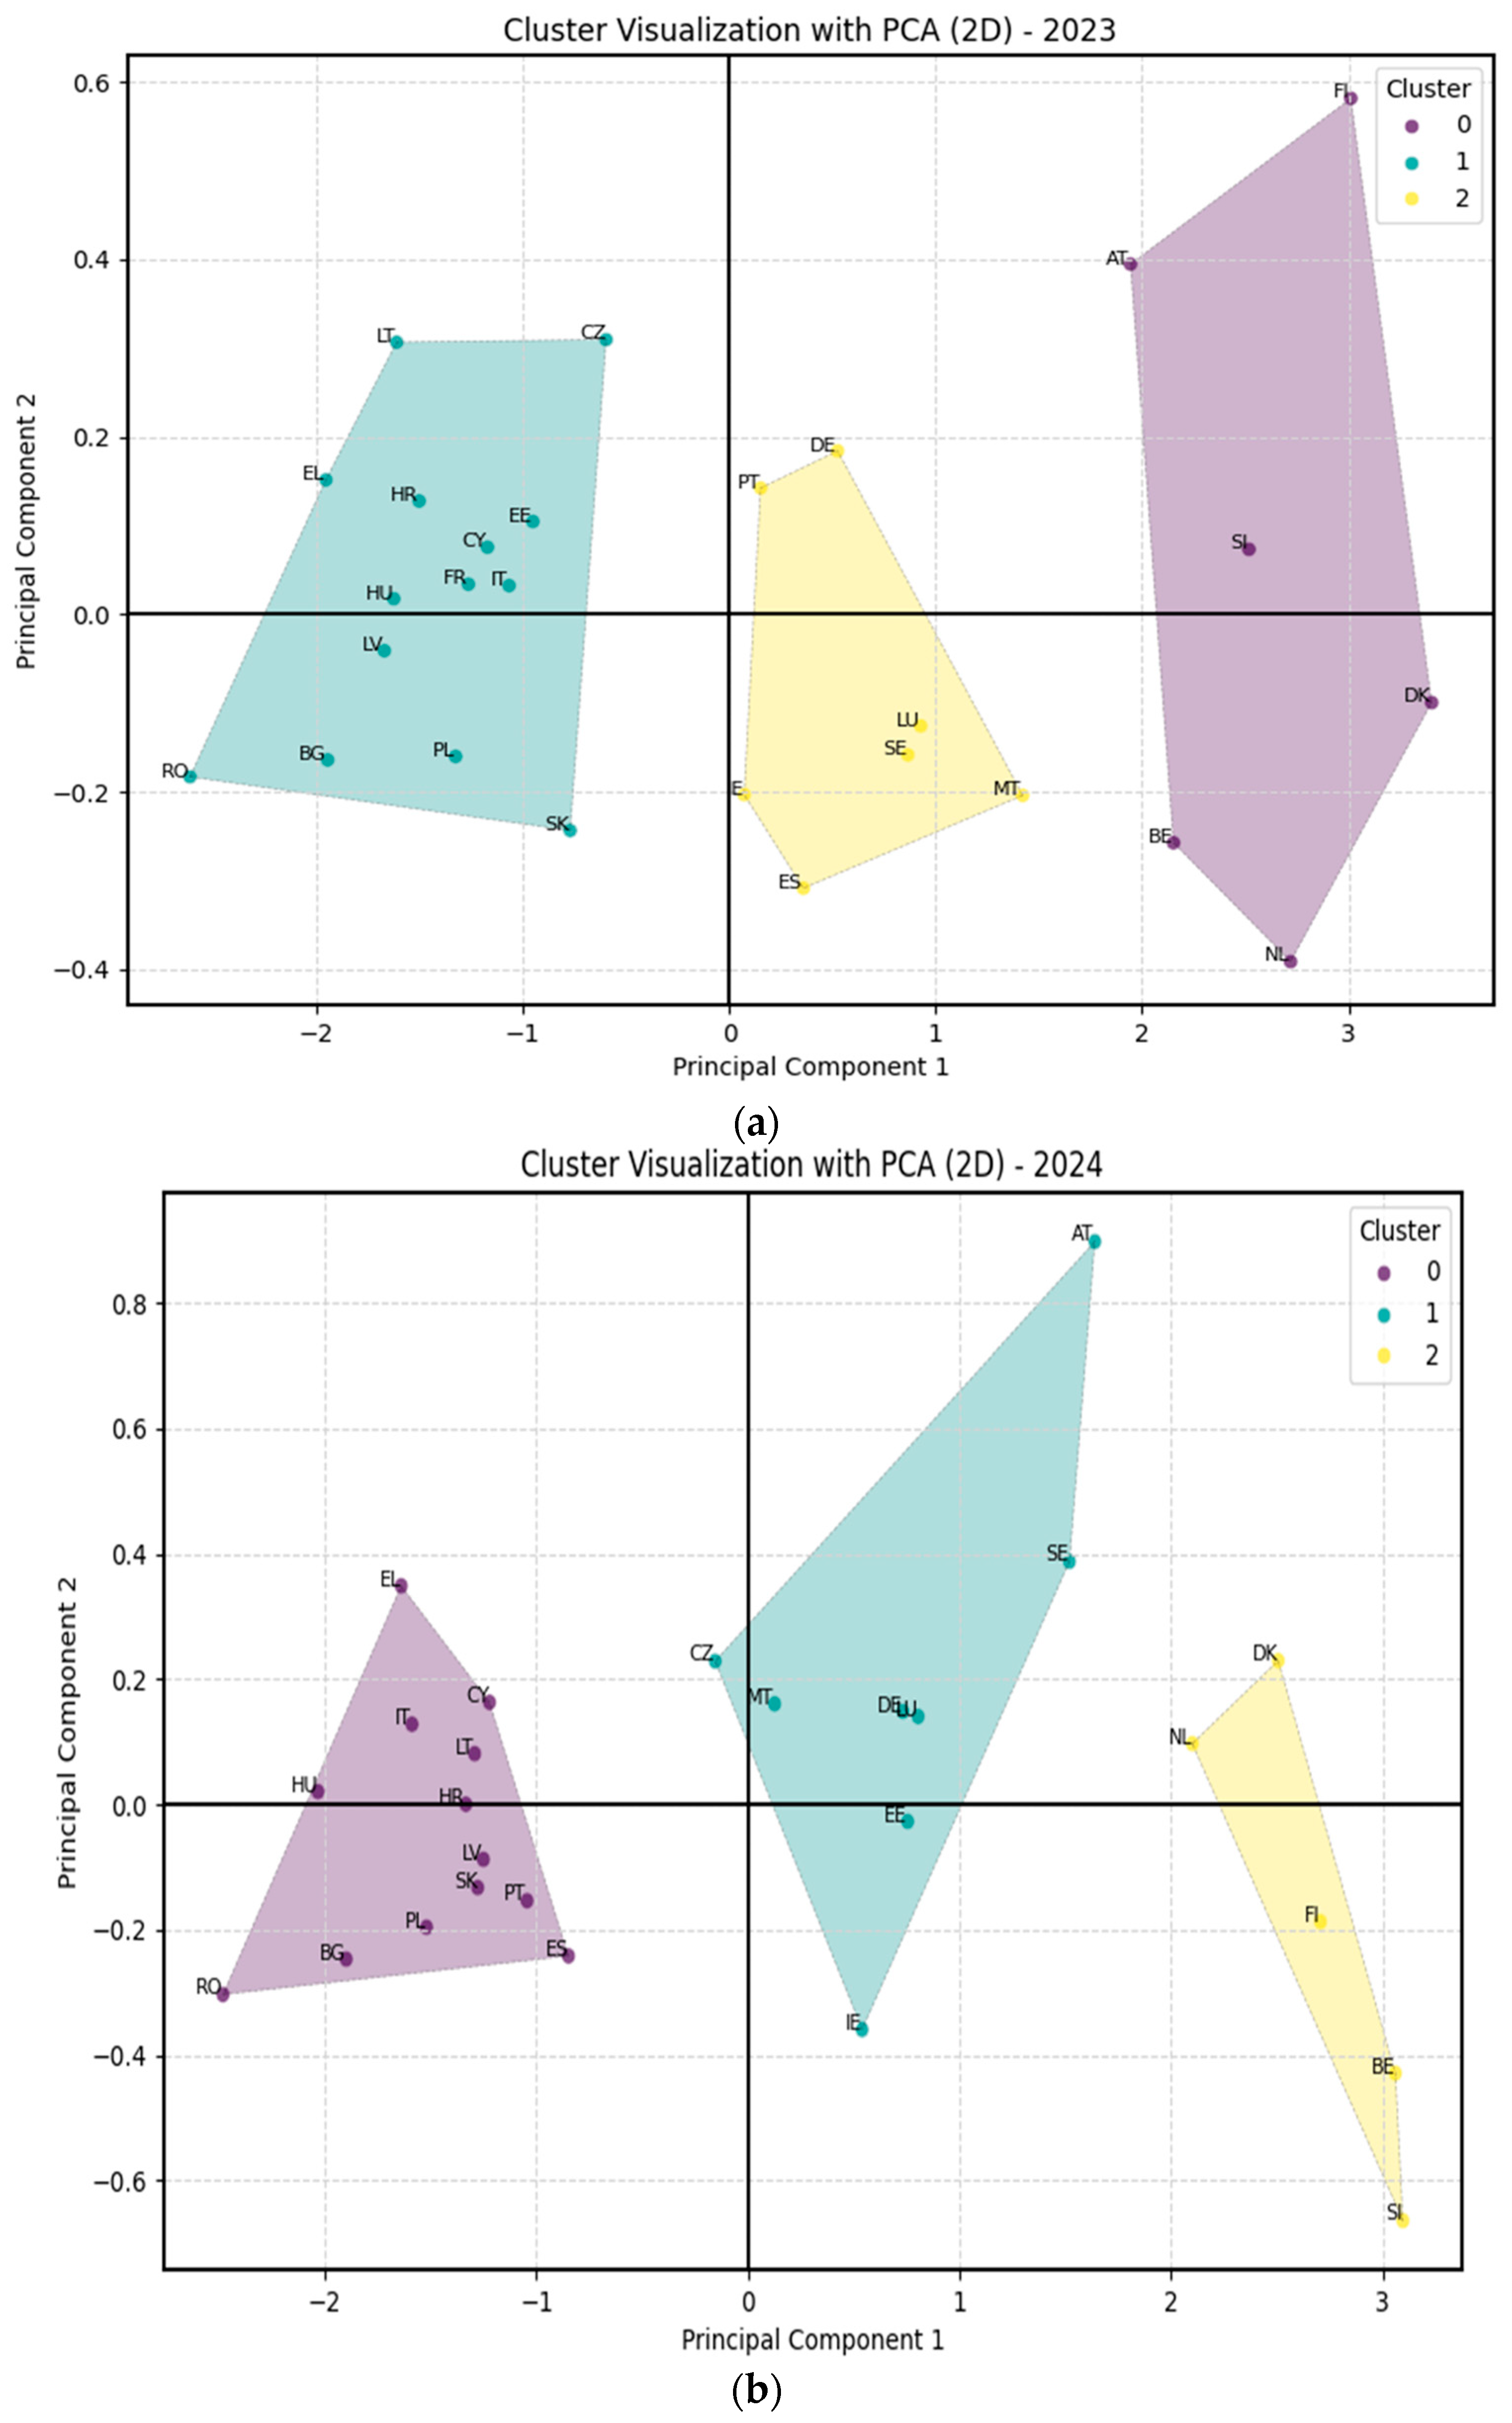
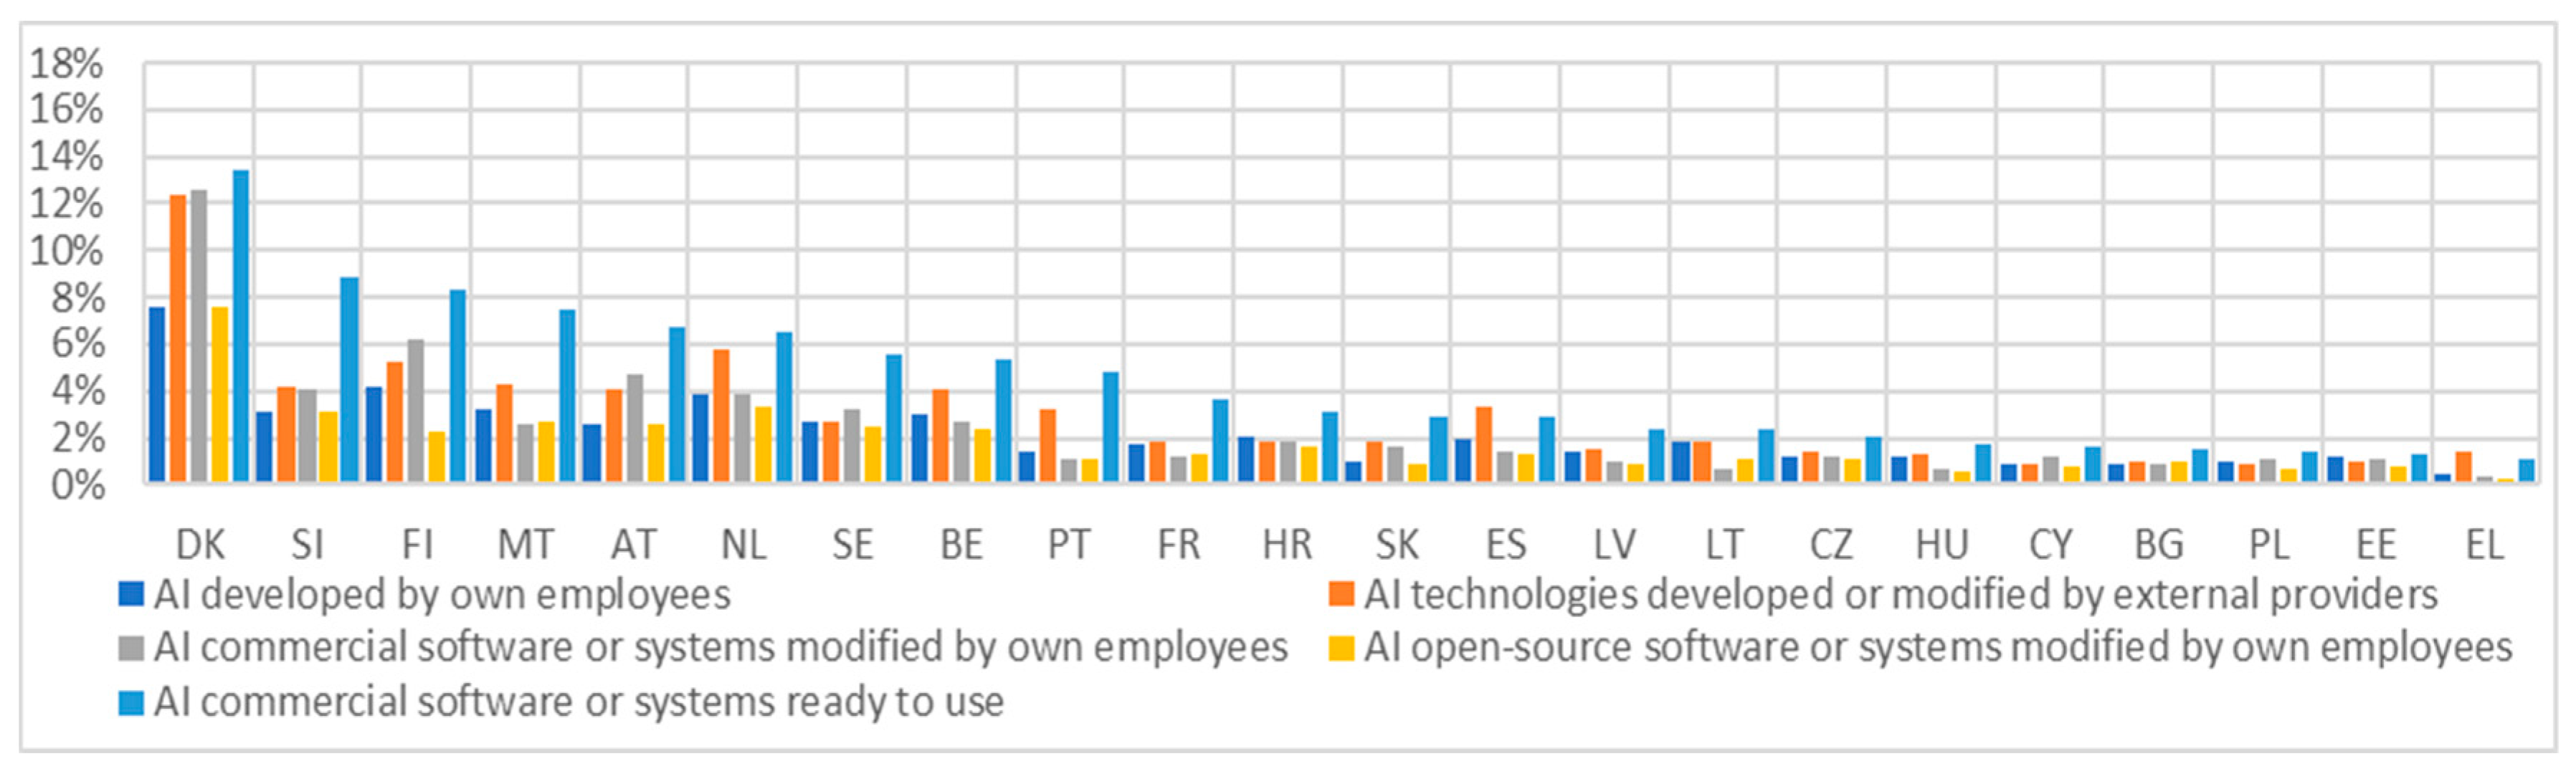
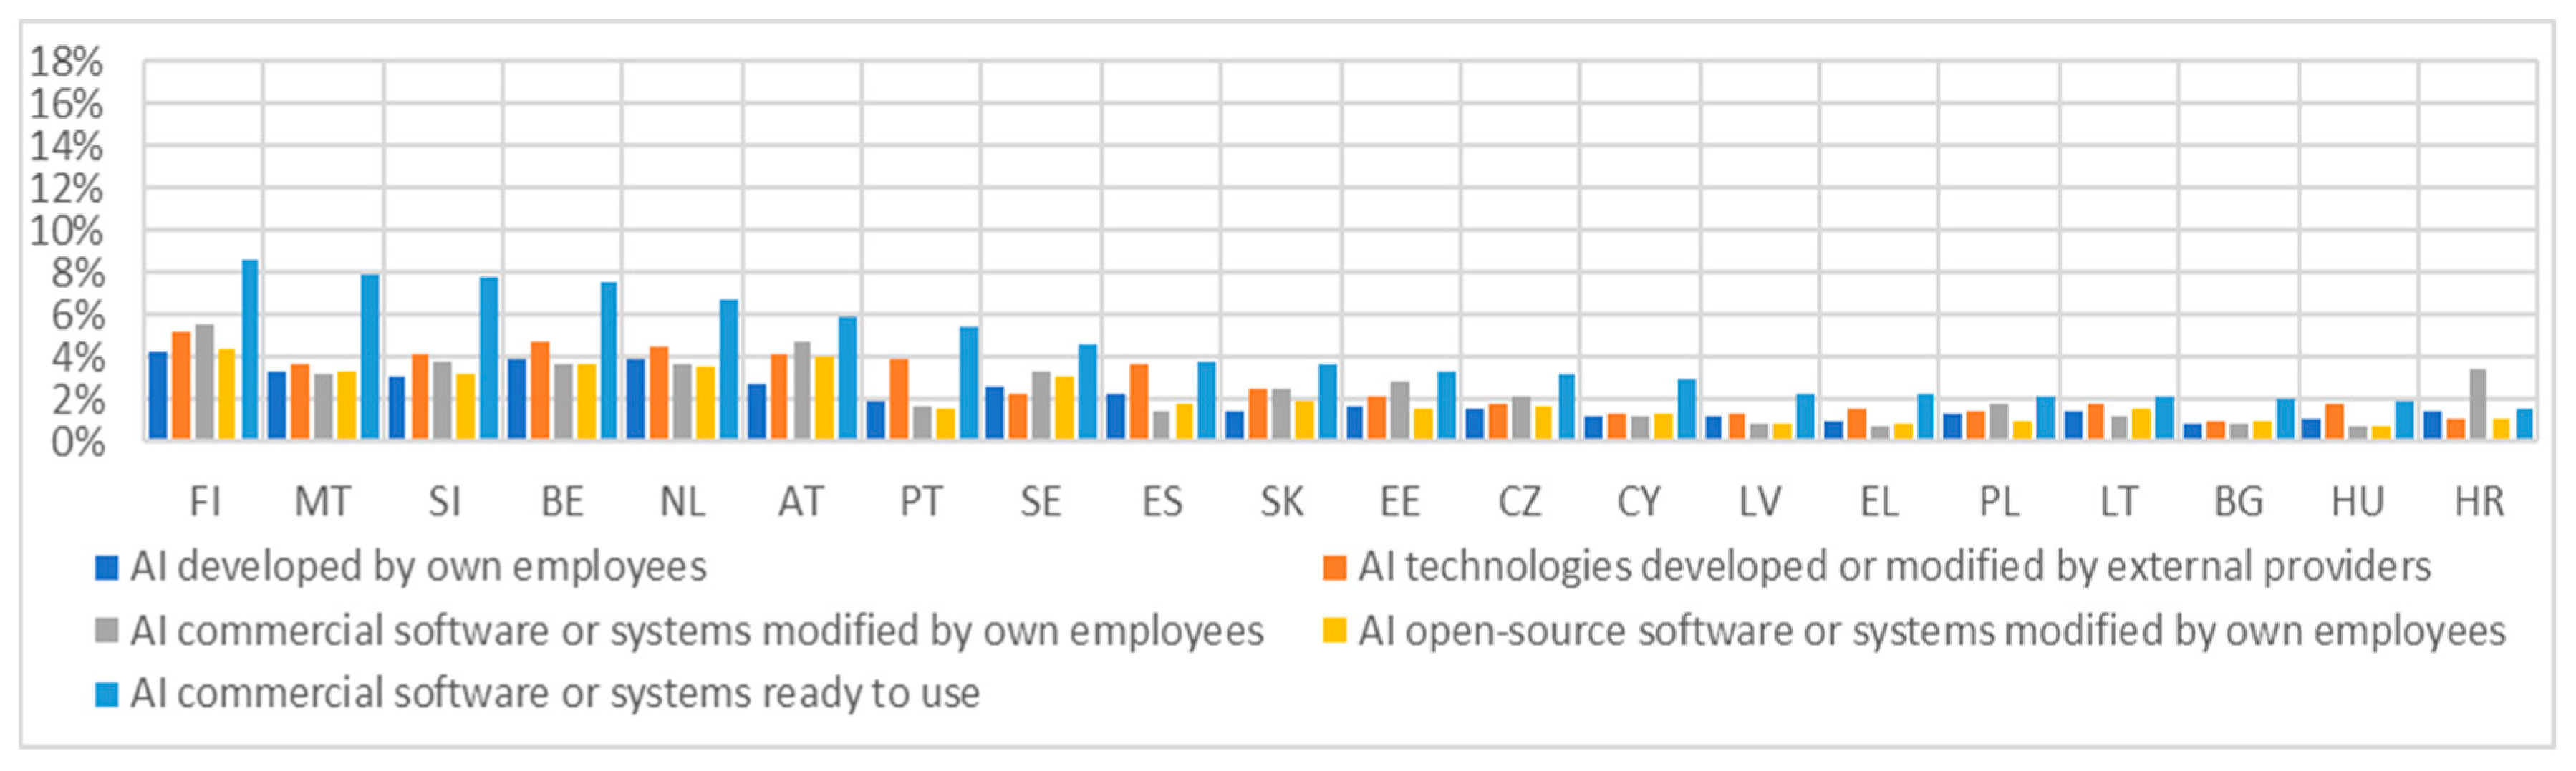

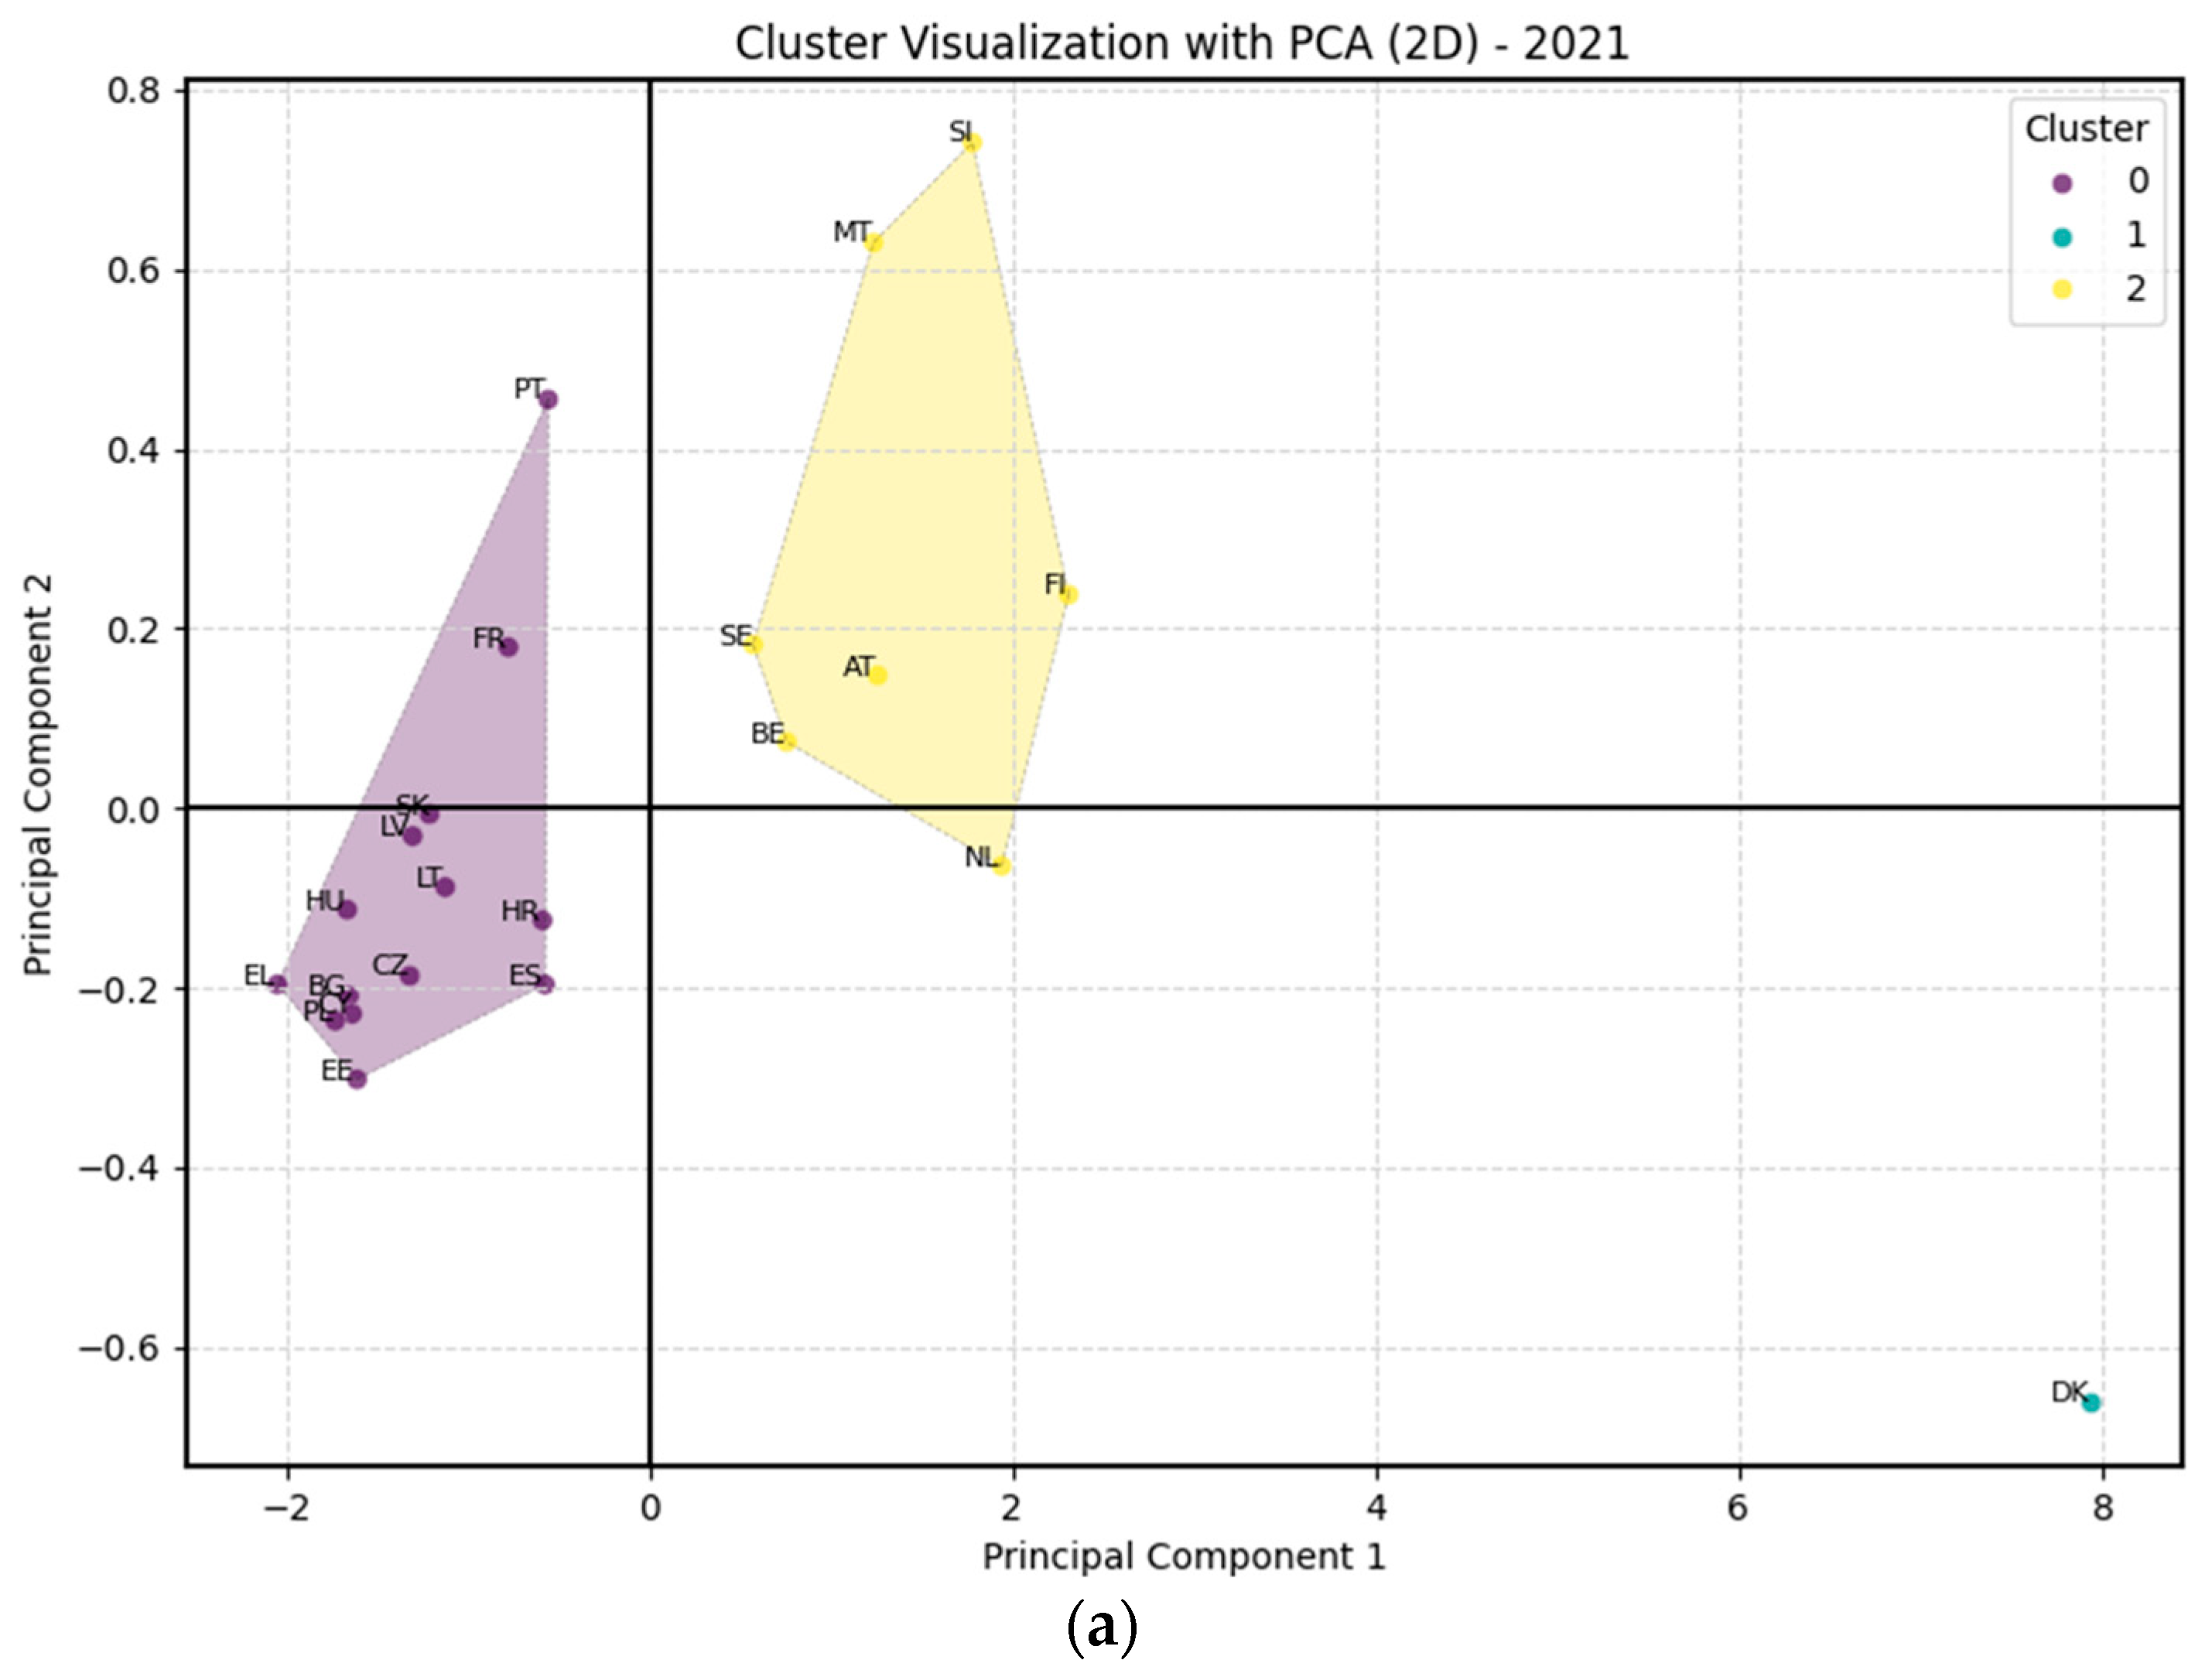

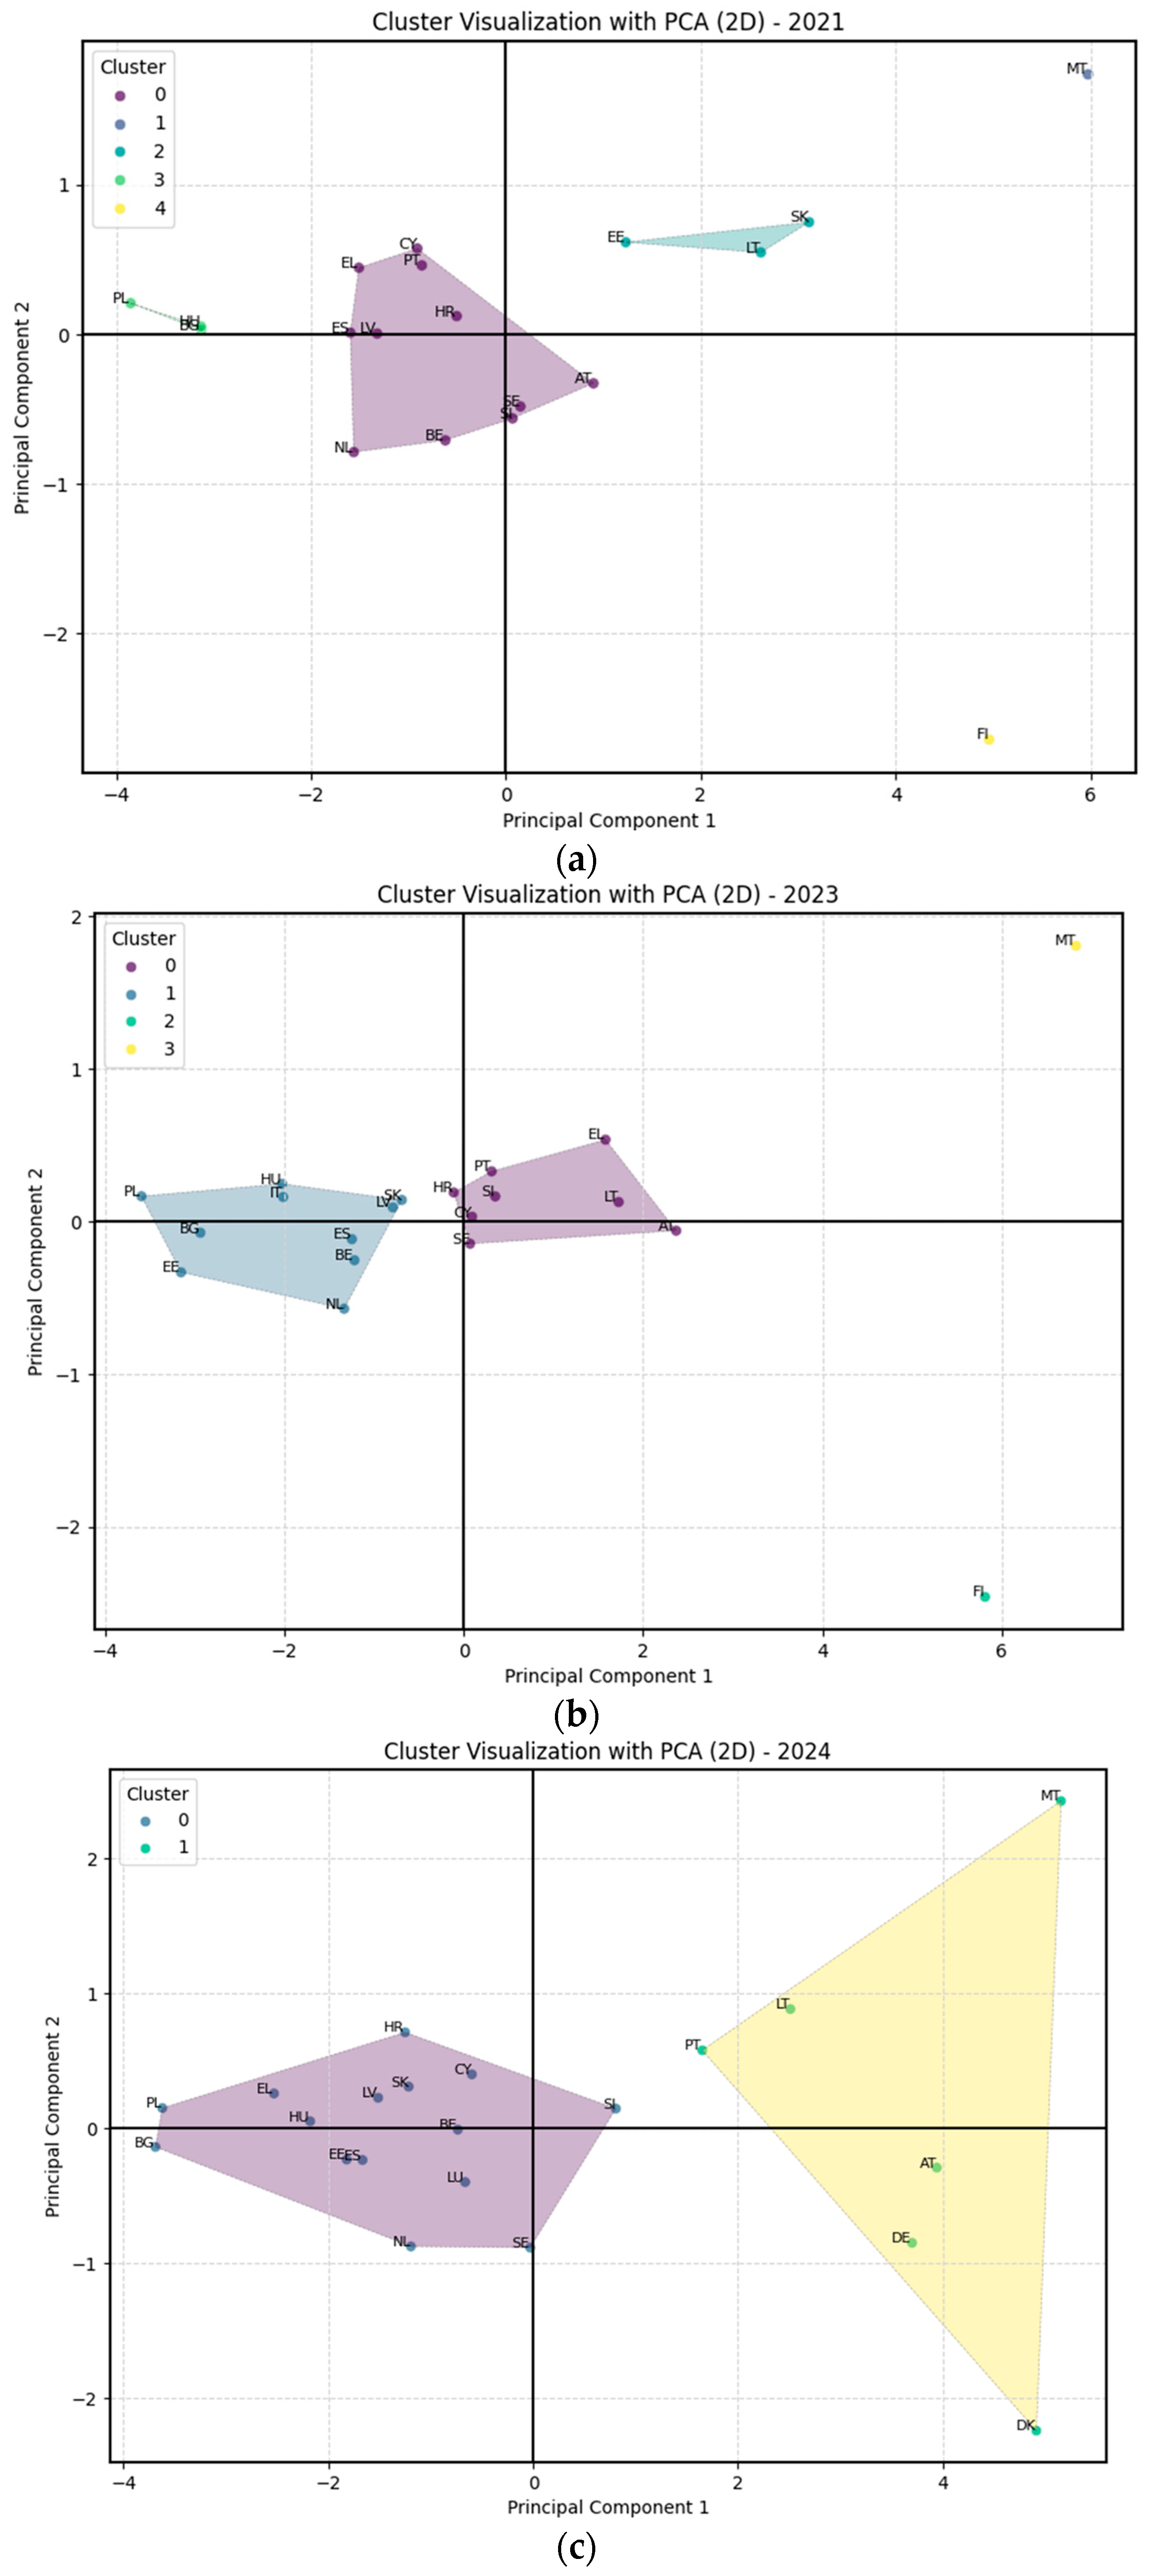
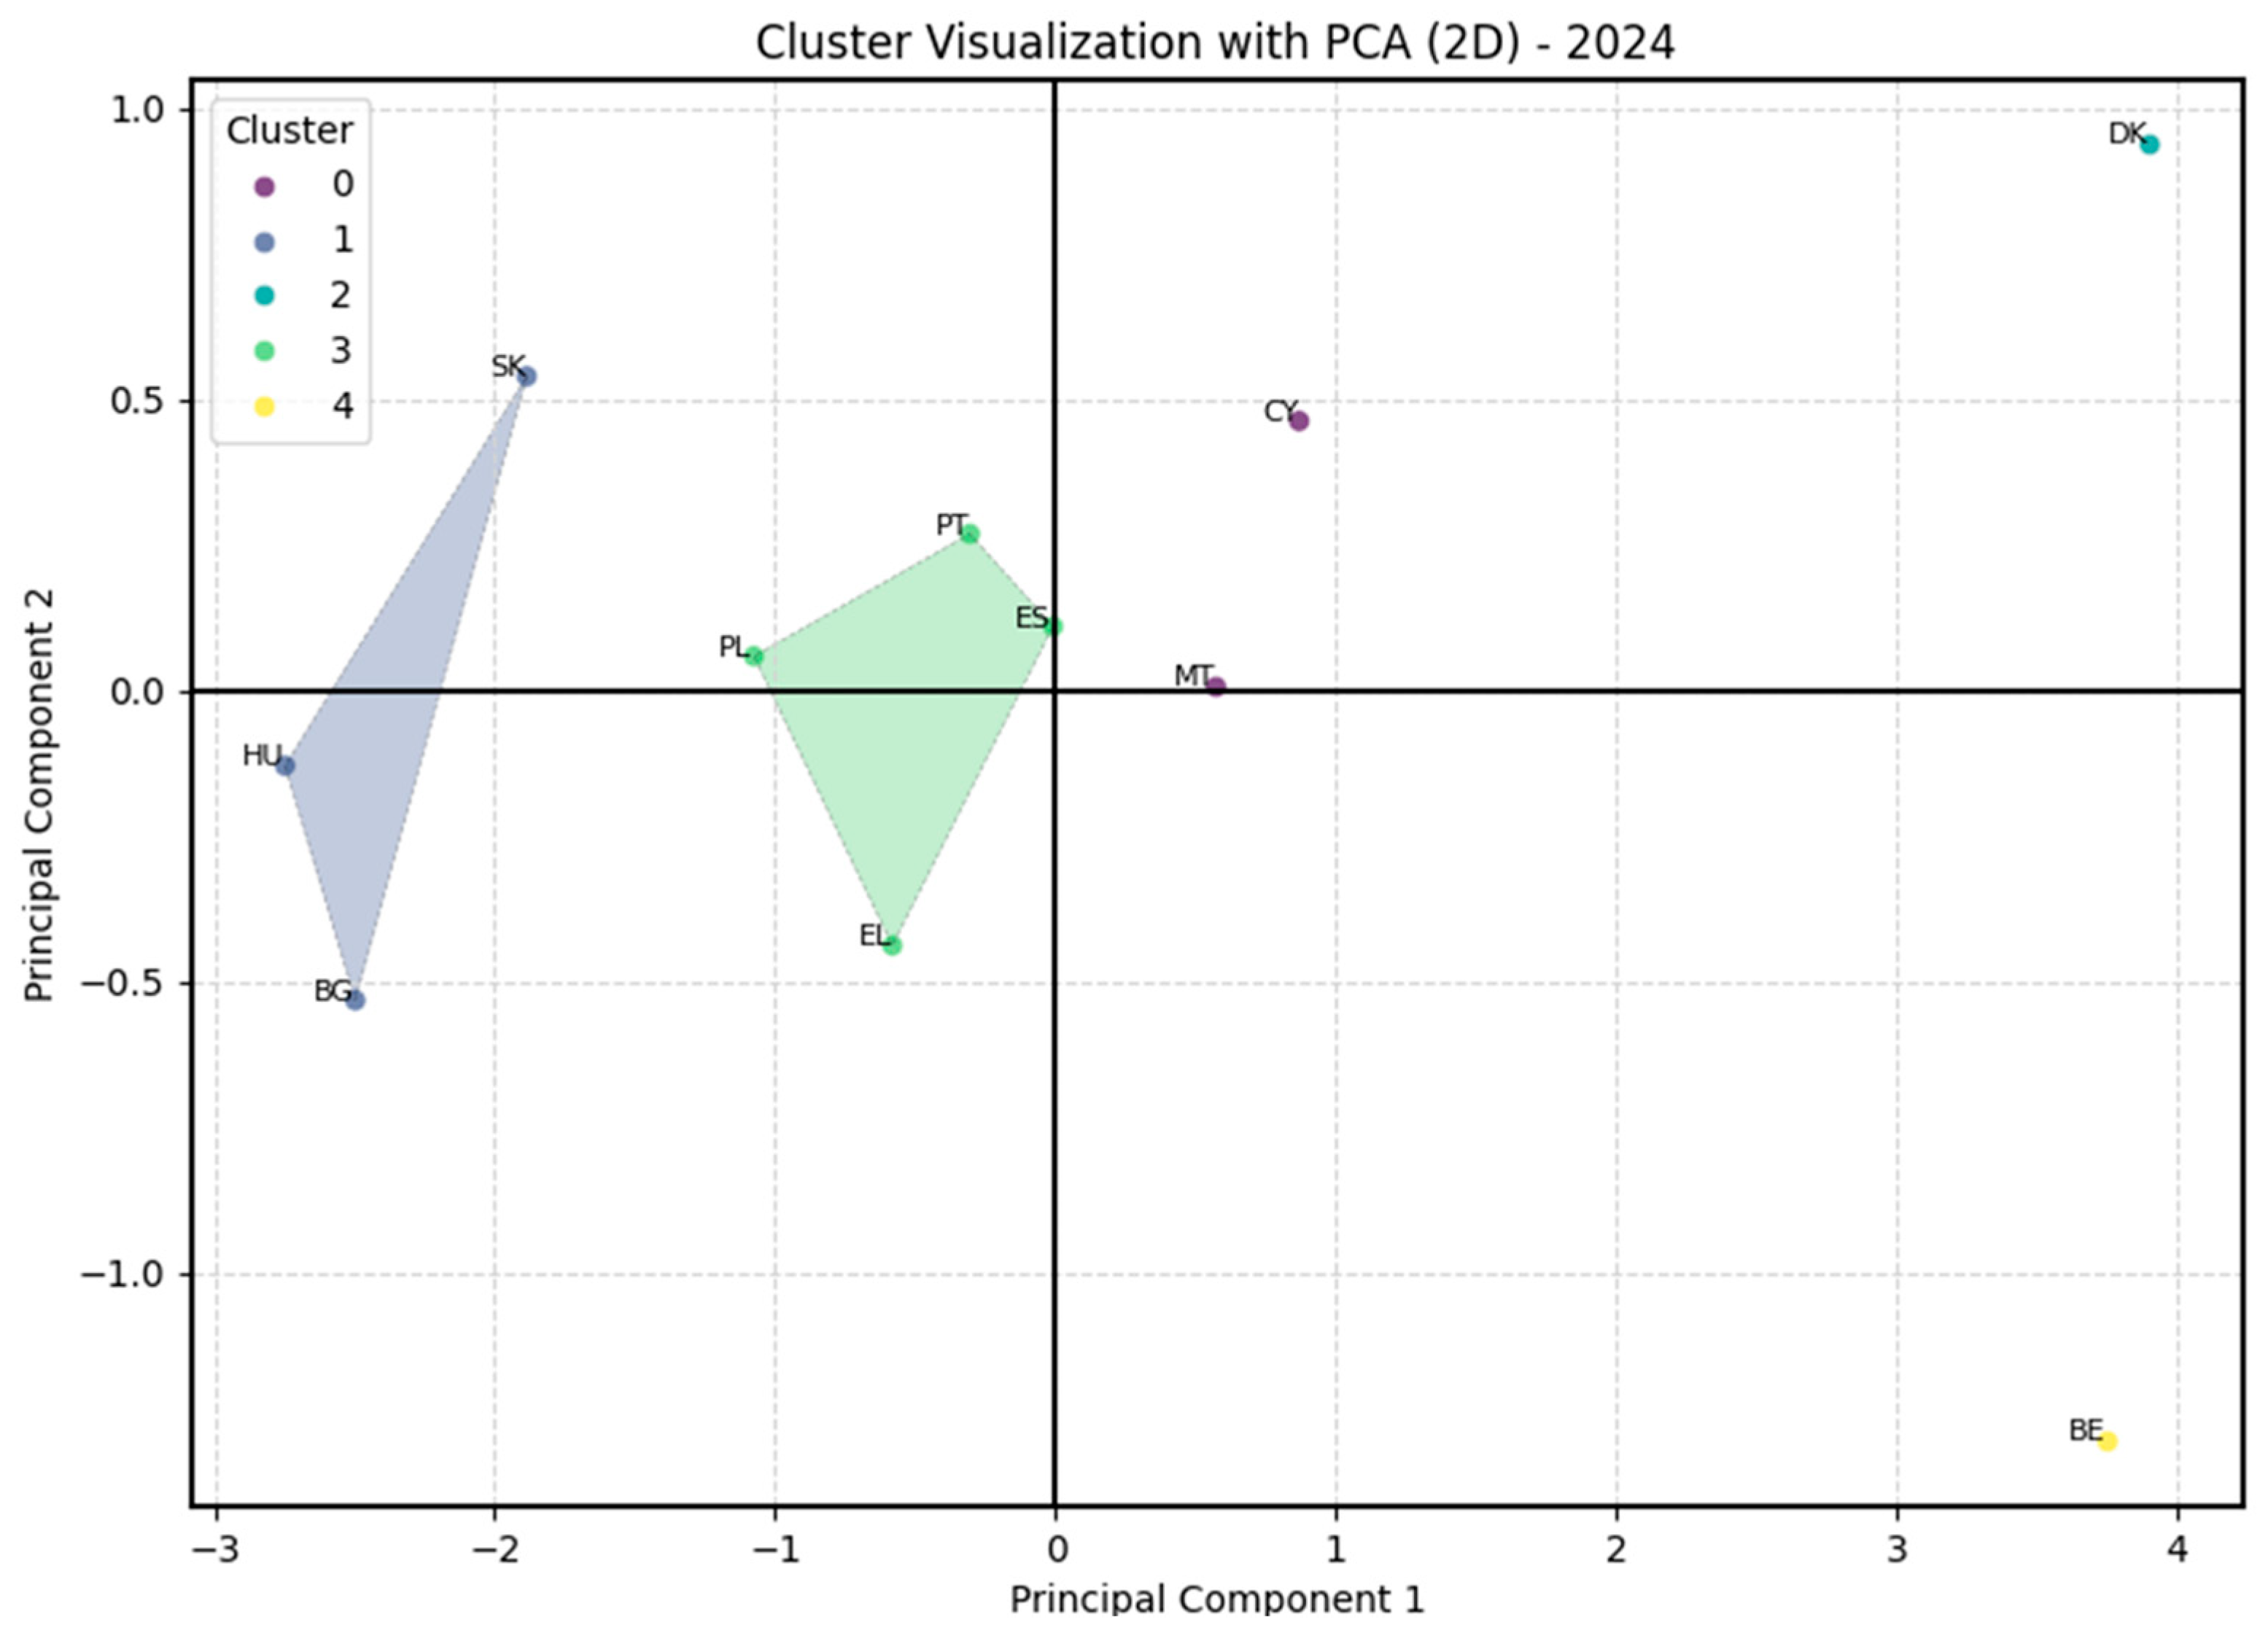
Disclaimer/Publisher’s Note: The statements, opinions and data contained in all publications are solely those of the individual author(s) and contributor(s) and not of MDPI and/or the editor(s). MDPI and/or the editor(s) disclaim responsibility for any injury to people or property resulting from any ideas, methods, instructions or products referred to in the content. |
© 2025 by the author. Licensee MDPI, Basel, Switzerland. This article is an open access article distributed under the terms and conditions of the Creative Commons Attribution (CC BY) license (https://creativecommons.org/licenses/by/4.0/).