Abstract
Understanding the drivers of regional economic growth requires examining the mesoeconomic conditions that influence the ability of small firms to scale. This study investigates how the local composition of firms—by size and sector—along with socio-economic and geographic characteristics, affects the prevalence of Scaled Firms across U.S. labor market areas. Using cross-sectional data from 2022, the analysis applies a log-linear regression model to examine the relationship between the density of micro, midsize, and large firms and the share of Scaled Firms (defined as employing 5–99 workers) within industry sectors. Covariates include household wealth, educational attainment, unemployment, population diversity, and metropolitan classification. The results show that the presence of midsize and large firms, along with regional human capital and economic context, is significantly associated with higher levels of small firm scaling. These findings suggest that the mesoeconomic context plays an important role in shaping regional economic growth outcomes and that the composition of local firm ecosystems may influence a region’s capacity for resilience and inclusive development.
Keywords:
regional economic growth; firm scaling; mesoeconomics; labor markets; small business development; human capital; economic development policy; cross-sectional analysis JEL Classifications:
R11; R58; L26; O43; L25
1. Introduction
Scaling small businesses is vital for regional economic development, as small and midsize enterprises (SMEs) play a key role in job creation and innovation, particularly in developing and emerging economies. In the context of business, scaling refers to a firm’s ability to grow revenue, output, or the customer base at a rate that outpaces the growth of its costs or resource inputs. This involves expanding operations efficiently and sustainably, often through systems, strategies, and structures that enable the firm to manage increased demand without a proportional increase in expenses (Coviello et al., 2024).
As these firms expand, they generate employment opportunities while diversifying and strengthening local economies, making them more resilient (Wen & Fang, 2024). Small firms are often hubs of innovation, introducing new products and services that enhance regional competitiveness in both national and global markets (Tula et al., 2024). Their growth stimulates local supply chains, creating positive spillover effects for other businesses. Furthermore, the tax revenue generated by expanding small firms supports regional infrastructure, education, and social services, reinforcing the broader economy (Tippmann et al., 2023). Therefore, policies and strategies that promote the growth of small firms have the potential to deliver substantial long-term economic benefits to entire regions.
1.1. Micro-, Meso-, and Macroeconomic Perspectives on Scaling Small Firms
Understanding what factors influence small firm scaling requires distinguishing among microeconomic, mesoeconomic, and macroeconomic perspectives, as each highlights distinct determinants of growth (Audretsch et al., 2024). The microeconomic perspective focuses on internal firm characteristics, such as management expertise, entrepreneurial skills, organizational structure, access to finance, and operational efficiency. It examines firm-level decisions and behaviors that directly affect growth, with research showing that strong leadership and innovation increase a firm’s likelihood of scaling. In contrast, the macroeconomic perspective looks at broader economic conditions, including national policies, interest rates, inflation, market access, and international trade. These factors shape the business environment and provide opportunities for business investment and expansion. However, this view often overlooks regional conditions that can impact a firm’s scaling ability (Dopfer et al., 2004).
Here, the mesoeconomic perspective bridges the gap between the microeconomic and macroeconomic domains by focusing on local and regional sector-specific factors, conditions and structures that influence small firm scaling (Elsner & Heinrich, 2011). In doing so, mesoeconomic research at this level of analysis captures the intermediate forces shaping individual perceptions, which, in turn, form the foundation for entrepreneur attitudes, subjective norms, and behaviors that facilitate scaling within a regional context (Ofem et al., 2020).
1.2. Guiding Research Questions
In exploring the growth potential of small firms, the current study first seeks to understand scalability across different sectors. In so doing, the guiding research question is as follows: How does the scalability of small firms vary across different sectors? Findings from this inquiry could uncover whether some industries inherently offer better opportunities for small firm growth than others. Building on this, the current study then examines the role of mesoeconomic factors that may influence a small firm’s ability to scale. In this process, the guiding research question is as follows: What mesoeconomic factors influence a small firm’s scalability within the context of its sector? Findings from this inquiry may identify what factors hinder, facilitate, or have no effect on scalability. By addressing these questions, the current study sheds light on the broader regional and sectoral conditions that shape small firms’ growth trajectories.
1.3. Importance of the Current Study
The research literature on scaling small firms has largely emphasized microeconomic factors, such as firm-level characteristics and individual entrepreneur traits, as well as macroeconomic factors like government policies or national economic conditions (Mazzoni, 2024). However, mesoeconomic determinants that lie between the firm and the broader national economy remain underexplored, particularly with respect to their role in scaling small firms. The current study is important because it seeks to fill this gap in the research literature by integrating into one analysis a variety of exogenous factors that studies have identified separately as important to small firm scalability.
More so, mesoeconomic factors are often more tangible, actionable, and influential for policymakers and regional development agencies than macroeconomic factors in determining whether small firms can successfully scale. For example, governments can directly influence the local business climate by providing access to infrastructure, fostering industry clusters, or offering targeted financial incentives (Mazzoni, 2024). By focusing on mesoeconomic determinants, the current study seeks to inform and guide regional policymakers in creating more prescriptive effective strategies to nurture firm scaling within their specific contexts.
1.4. Background
Endogenous Growth Theory and New Economic Geography provided the theoretical framework for this study in contextualizing selected mesoeconomic determinants of regional economic development. A key limitation of neoclassical growth models is their assumption of diminishing returns to capital (Lucas, 1988). In contrast, Endogenous Growth Theory emphasizes the role of human capital, innovation, and knowledge spillovers in sustaining long-term economic growth (Romer, 1990). In so doing, the theory posits that investments in education, research and development (R&D), and technology diffusion generate increasing returns, thereby driving sustained regional economic performance (Aghion & Howitt, 2025).
Pioneered by Krugman (1991), New Economic Geography explains the spatial concentration of economic activity through increasing returns to scale, agglomeration effects, and transportation costs. Its core-periphery model suggests that economic activity tends to cluster in core regions, while peripheral areas experience slower development due to weaker market access and limited infrastructure (Fujita & Mori, 2005).
Building on these theoretical foundations, this study identifies key mesoeconomic determinants and examines their implications for policy and practice in scaling small firms—thereby unlocking regional economic growth.
1.4.1. Industrial Sector
A small firm’s ability to scale depends on the industry sector in which it operates. In sectors like telecommunications, manufacturing, and energy, high entry barriers, such as capital costs and economies of scale, make scaling difficult for small firms (Hvolkova et al., 2019). Additionally, in capital-intensive industries like construction, technology, and healthcare, the costs of expansion can be prohibitive (Li et al., 2023). Regulatory and compliance costs further hinder scaling, particularly in highly regulated sectors like pharmaceuticals and finance (N. Singh et al., 2023). However, digital technologies offer scaling opportunities, especially in industries like retail, technology, and professional services. Online platforms such as e-commerce and cloud computing allow small firms to reach global markets with minimal investment compared to traditional sectors that require substantial physical infrastructure (Pelletier & Cloutier, 2019).
1.4.2. Micro Firms
Micro Firms are essential drivers of innovation and job creation, serving as a “nursery” for businesses that may scale into larger enterprises (V. Singh, 2010). However, small firm scaling is not guaranteed—the density of small firms within the sector is a key factor. A higher concentration of Micro Firms creates a competitive environment that fosters innovation and operational improvements, both critical for scaling (Munyo & Veiga, 2024; Ofem et al., 2020).
1.4.3. Midsize Firms
The scaling potential of small firms is also influenced by the presence of Midsize Firms (MSFs) (Cheah et al., 2023). MSFs foster small firm growth by providing knowledge spillovers, such as technical expertise, management practices, and industry insights, which help small firms scale more effectively (Kraus et al., 2021; Munyo & Veiga, 2024). They also act as customers, suppliers, partners, or investors, granting access to markets and capital (Fotopoulos, 2023). In so doing, the number and activity level of MSFs supports small firm scaling by creating stable demand and a competitive yet collaborative environment (Ahsan et al., 2021).
1.4.4. Large Firms
Large firms can support the scaling of small firms through their market power, resources, and networks. They create demand for the goods and services provided by smaller firms (Sutrisno, 2023) and offer opportunities for knowledge and technology transfer, which are essential for small firm growth (Matray, 2021). However, not all large firms support small firm growth equally. Industries dominated by vertically integrated businesses may provide fewer scaling opportunities, as these firms rely less on external suppliers (Xin & Park, 2024). In contrast, sectors with fragmented value chains offer more opportunities for small firms to grow independently or collaborate with larger firms (Crouzet & Mehrotra, 2020). Thus, the number and type of large firms in a region are critical factors in determining small firm scaling potential.
1.4.5. BA+ Degrees
A well-educated workforce is a valuable asset for small firms, driving innovation, productivity, and improved decision-making, which are crucial for scaling (Arshed et al., 2024). Employees with higher education levels also contribute technical expertise, creativity, and problem-solving skills, essential in knowledge-intensive industries (Bauman & Lucy, 2021). However, challenges may arise when regions have a saturated labor market with highly educated individuals. Small firms, with limited financial resources, may struggle to offer competitive salaries to attract and retain top talent, leading to high turnover or staffing challenges (Bakhtiari et al., 2020). Additionally, the expectations of college-educated employees, who often seek greater career advancement, may not align with the limited growth opportunities in small firms, further complicating scaling efforts (Brown, 2024).
1.4.6. Household Wealth
Household wealth in a region plays a crucial role in small firm scaling potential. Higher household wealth can lead to increased consumer purchasing power, boosting demand for goods and services, which helps small firms generate higher revenues and reinvest in growth (Malik et al., 2024). Additionally, regions with higher household wealth typically have better financial infrastructure, offering access to venture capital and loans, which is essential for small firms to scale (Belitski et al., 2023).
However, high household wealth in a region can paradoxically inhibit the scaling of small firms. In regions with high household incomes, individuals may have less incentive to start their own businesses, as wealthier populations often have more stable and secure income streams which discourage risk-taking (Bouchouicha & Vieider, 2019). The availability of financial capital among wealthier individuals may also lead to a preference for passive investment strategies, such as real estate or stock market investments, rather than active engagement in the operational challenges of starting and growing a small business (Clayton et al., 2024).
1.4.7. Unemployment Rate
Regional unemployment rates can significantly impact the scaling potential of small firms. High unemployment often leads to reduced consumer demand, as lower household incomes decrease purchasing power, making scaling difficult (O’Leary, 2022). Additionally, while higher unemployment increases the labor pool, the skill mismatch between available workers and the specific needs of small firms can hinder innovation and expansion (Lee, 2017). However, high unemployment can also present opportunities. Displaced workers may seek employment in small firms, offering businesses access to a larger, more cost-efficient labor force willing to accept lower wages or flexible conditions (Gupta, 2024). This flexibility can reduce operational costs, helping small firms scale and invest in growth.
1.4.8. Diversity Index
Workforce diversity can both benefit and challenge the scaling potential of small firms, depending on factors like management practices and communication strategies (Rafaqat et al., 2022). Diverse teams bring a variety of problem-solving approaches, which can foster innovation and help small firms create differentiated or niche products. This diversity also enables firms to better understand and address customer needs, particularly when expanding into global markets. However, challenges arise when diverse teams experience misunderstandings due to differences in language, communication styles, and cultural norms (Hanifzadeh et al., 2024; Lane et al., 2024). Without proper management, these issues can lead to employee disengagement and higher turnover, undermining the stability needed for scaling operations.
1.4.9. Metro Type
The type of metropolitan area—whether rural, suburban, or urban—can influence a small firm’s ability to scale. Rural areas often present challenges such as a smaller customer population, limited skilled labor, and poor infrastructure (e.g., internet and transportation), which can hinder scaling (Beckmann et al., 2021). In contrast, suburban areas offer a balance of access to urban markets and more affordable living costs but may still face skill mismatches and competition from larger firms (Hartman & Kear, 2024; McGuinness et al., 2018). Urban areas, with larger customer populations, diverse labor markets, and access to critical infrastructure, provide the most favorable environment for scaling small firms, offering resources like technology hubs and financial institutions (Saputra & Darmawan, 2023). However, high operating costs in urban areas, such as rent and wages, can still pose significant challenges for small firms seeking to scale their business (Barnett et al., 2024).
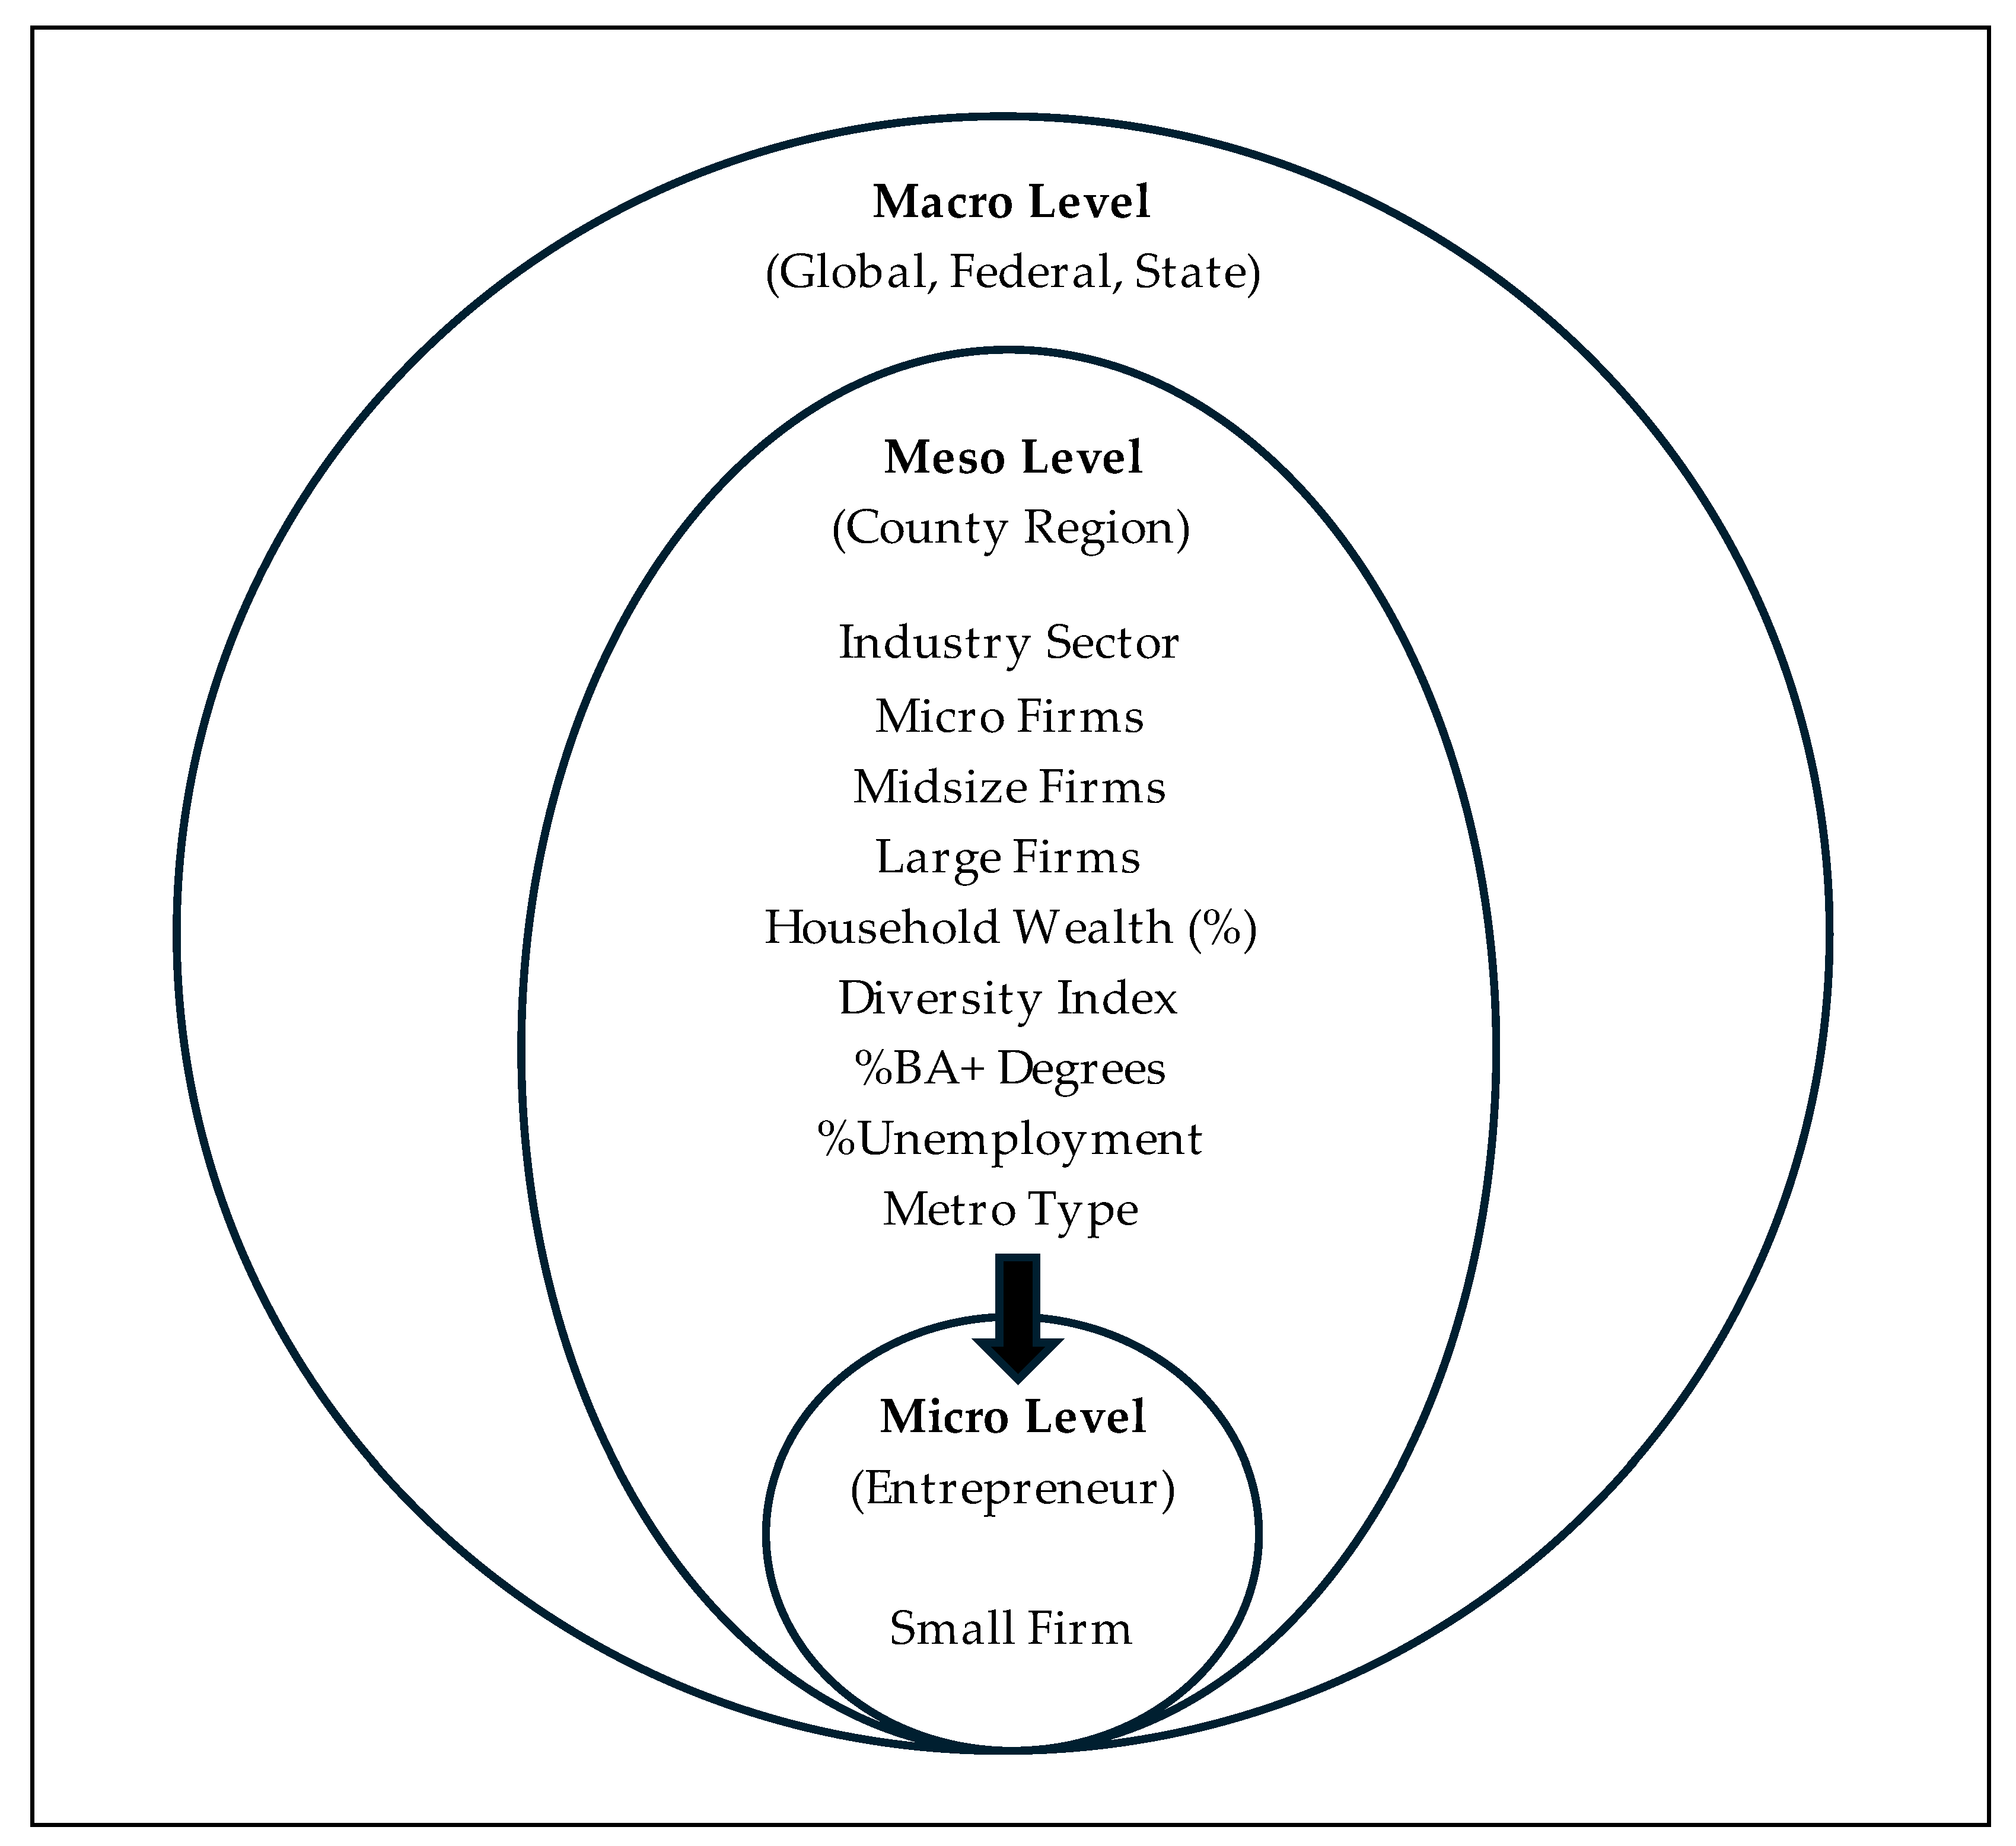
Based on this background of the current study, Figure 1 shows a multi-level framework that places the industry sector and mesoeconomic determinants relative to macro and micro levels of influence. The Macro Level (Global, Federal, State) captures broad institutional and policy environments, including national and international economic trends, federal and state policies, and structural factors that shape the operating context for firms of all sizes. The Meso Level (County, Region) is the focus of the current study, and consists of county regional dynamics such as household wealth distribution, diversity index, educational attainment (% BA+ degrees), unemployment rates, and metro type that may influence the opportunities and constraints for firm growth and entrepreneurial activity. The Micro Level (Entrepreneur) focuses on individual entrepreneurs and small firms operating within specific industry sectors. This level emphasizes firm-specific characteristics and localized actions that directly affect scaling potential.
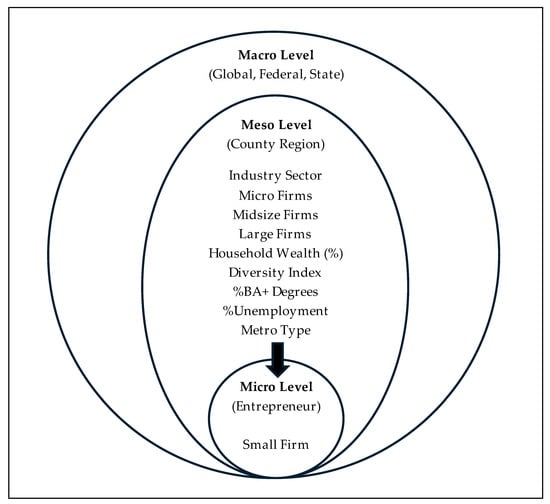
Figure 1.
Mesoeconomic model of scaling small firms.
2. Methods
The current study examined how selected mesoeconomic factors influence the scaling of small firms within a region using a cross-sectional research design. The analysis was based on data from a single point in time (2022) and did not include a longitudinal or time-series component. The methodological approach, data sources, and research design are outlined in this section.
2.1. Data Sources and Variables
The data for this study were obtained from the U.S. Census Bureau (2020), specifically from the County Business Patterns (CBP) files, which provide firm counts across 13 size categories based on the total employee numbers (e.g., 50 to 99 employees). These counts are available at various industry levels, classified according to the North American Industry Classification System (NAICS), a standard used by federal statistical agencies to organize business establishments for data collection and analysis. Using Federal Information Processing Standard (FIPS) codes for states and counties, a unique five-digit county ID was created for each record. For each county, firm counts were aggregated by size category within each unique four-digit NAICS code, representing industries with similar processes for producing goods or services (U.S. Census Bureau, 2022a, p. 15). From this firm count summary, four numerical variables were created for each record: Micro Firms (fewer than 5 employees), Scaled Firms (5 to 99 employees), Midsize Firms (100 to 999 employees), and Large Firms (1000+ employees). While the CBP data identified the Micro and Large Firms categories, the current study used Gartner’s (2025) definitions for the Scaled (small) and Midsize firm categories.
From the processed CBP data, two additional variables were created for this study. The first was %Scaled Firms, a county-level measure calculated by dividing the number of Scaled Firms by the combined total of Micro and Scaled Firms, then multiplying by 100. The second variable, NAICS Sector, was derived from the NAICS industry code. The first two digits of the four-digit NAICS code represent the sector, which classifies industries into 23 broad categories of economic activities (U.S. Census Bureau, 2022a, p. 16). Using SAS 9.4 procedures, the NAICS Sector variable was created by extracting the first two digits from the four-digit NAICS industry code. Thus, while the four-digit NAICS codes defined the unit of analysis, the 23 two-digit NAICS sectors determined the level of analysis and organized the current study’s results.
Using demographic data from the U.S. Census Bureau (2021a), a county-level Diversity Index was calculated for this study. The Diversity Index measures the likelihood that two randomly selected individuals in a county will belong to different ethnic/racial groups. To develop this measure, demographic data from 1 July 2020, was selected for individuals aged 25 to 64 years (AGEGRP categories 6 through 13). The data, which was categorized by gender, was then combined by adding the male and female counts for each ethnic/racial group (U.S. Census Bureau, 2021b). To calculate the index, the square of each ethnic/racial group’s percentage of the total population was summed. This sum was subtracted from one and then multiplied by 100 to convert the probability into a percentage, making the result easier to interpret. The formula can be expressed as follows:
where each racial/ethnic group’s percentage is squared and summed before being subtracted from 1. The index ranges from 0 to 100, where a value of 0 signifies no diversity (all individuals belong to the same ethnic or racial group), and a value closer to 100 represents high diversity (individuals are distributed across multiple ethnic or racial groups) (U.S. Census Bureau, 2021c).
Diversity Index = (1 − ∑(%Race/Ethnicityi2)) × 100
The current study used county-level data from the U.S. Department of Agriculture (U.S. Department of Agriculture, 2020) to obtain other mesoeconomic variables. The %BA+ Degree variable, which represents the percentage of the county population with a bachelor’s degree or higher, was obtained from a file on educational attainment for adults aged 25 to 65 years from 1970 to 2020. The %Unemployment and Household Wealth variables were derived from the USDA’s data on unemployment and median household income for 2000–2021. Household Wealth is defined by the ratio of a county’s median household income to the state’s median household income. Additionally, the USDA file included a rural–urban continuum code, a categorical variable ranging from 1 to 9, which classifies counties based on core population size and their integration with adjacent communities (U.S. Census Bureau, 2022b). For the current study, these 9 codes were redefined into a Metro Type variable, where the smallest core population (2500, not adjacent to a metro area) was assigned a value of 0, and the largest core population (1 million or more) was assigned a value of 8.
Using SAS procedures, these data collections processed for the current study were then merged by county ID. The final dataset for analysis consisted of 178,106 observations representing 272 four-digit NAICS industries distributed across the 23 two-digit NAICS sectors.
2.2. Research Design
This study employed a cross-sectional research design, analyzing firm scaling determinants across U.S. counties for a single year (2022). The dependent variable in the regression model is the natural logarithm of Scaled Firms, which corrects for skewness in the count distribution. The regression equation is specified as follows:
where i represents a county regional unit; the intercept term, β0, defines the regression constant; and εi is the error term, capturing unobserved factors affecting Scaled Firms in county i. The predictor variables consist of Micro Firms, Midsize Firms, Large Firms, Household Wealth, Diversity Index, %BA+ Degrees, %Unemployment, and Metro Type. For a select predictor variable, its regression estimate b multiplied by 100 defines for a one-unit change in the predictor, a b percentage change in Scaled Firms in natural form, after holding all other covariates constant. Thus, for a given industrial sector, a positive β estimate suggests that the predictor facilitates firm scaling, while a negative β estimate suggests it hinders scaling (Bazen, 2011). Since this is a cross-sectional study, the findings represent relationships at a single point in time (2022) and do not infer causality over time. However, future research could incorporate panel data to track firm growth over multiple years and control for time-invariant factors.
ln(Scaled Firmsi) = β0 + β1Micro Firmsi + β2Midsize Firmsi + β3Large Firmsi +
β4Household Wealthi + β5Diversity Indexi + β6%BA Degreesi +
β7%Unemploymenti + β8Metro Typei + εi
β4Household Wealthi + β5Diversity Indexi + β6%BA Degreesi +
β7%Unemploymenti + β8Metro Typei + εi
3. Results
Table 1 shows descriptive statistics for the select variables. Of the 3143 U.S. counties identified by the U.S. Census Bureau (2022c), 3094 (98.4%) were included in the current study. The dataset comprising 178,106 observations, represented 272 distinct four-digit NAICS industries across 23 industry sectors. The total number of firms across these industries was 6,658,923, distributed by size as detailed in the table under the CBP Firm Measures label. For each NAICS industry, the average number of Micro, Scaled, and Midsize Firms was 20.8 (SD = 57.2), 16.0 (SD = 59.9), and 0.6 (SD = 4.1), respectively. Large Firms had the fewest, with an average of 0.02 (SD = 0.4) per NAICS industry.

Table 1.
Description statistics: regression model variables (N = 178,106).
Among the County Level Measures (n = 3094) presented in Table 1, the average household wealth was 90.3 (SD = 19.3). The median value of 87.7 suggested that more than half of the counties had household incomes below their state’s median. The average Diversity Index was 31.5 (SD = 18.3), with values ranging from 4.0 to 78.0, reflecting a broad spectrum of diversity levels from low to high across the counties. The percentage of adults with a bachelor’s degree or higher (%BA+ Degrees) had an average of 22.7 percent (SD = 9.7%), with values ranging from 1.5 to 79.1 percent for adults aged 25 to 65. The median of 20.2 percent indicates that more than half of the counties had approximately one in five working adults with at least a bachelor’s degree. The average unemployment rate (%Unemployment) was 6.8 percent (SD = 2.3%), and the median of 6.6 percent suggests that more than half of the counties had unemployment rates at the lower end of the range, which spanned from 6.6% to 22.8%.
Lastly, the Metro Type categorical variable ranged in values from 0 to 8, as defined further below in the table showing the distribution of counties across the nine categories. The average category was 4.0 (SD = 2.7) indicating counties were generally urban populations of 20,000 or more, not adjacent to a metro area. Still, the median value of 3 implied that more than half of the counties had core populations of less than 20,000.
3.1. Small Firms Scalability by Sector
The current study’s first guiding research question asked: How does the scalability of small firms vary across different sectors? A county-level measure, the %Scaled Firms variable consisted of the percentage of Scaled Firms among micro and Scaled Firms by four-digit NAICS industry (n = 272). Using the SAS Univariate procedure, Table 2 shows select percentiles of the %Scaled Firms values by NAICS Sector.
Table 2.
%Scaled Firms at select percentiles by two-digit NAICS sector.
The interpretation of the findings for a given sector consisted of two factors: the magnitude of %Scaled Firms, as well as the percentile location where it first occurred as a non-zero value. Thus, while %Scaled Firms indicated the proportion of Scaled Firms among micro and Scaled Firms for a given NAICS industry in a county, the percentiles pointed to a sector’s distribution of NAICS industries falling below and above a particular %Scaled Firms value. Among the 23 industry sectors, small firms were most scalable in the sectors of Store Retailers (44), Management (55), and Health/Social Services (62) because the existence of Scaled Firms (i.e., non-zero %Scaled Firms) occurred as early as the 25th percentile—unlike the other 20 sectors.
For instance, the Store Retailers (44) sector consisted of 20,754 industry observations across 2792 counties. With %Scaled Firms sorted in ascending order, at the 25th percentile, the first 5189 industry observations had 30 percent or less Scaled Firms while the upper remaining 15,565 industry observations above the 25th percentile had industry observation percentages equal to or greater than 30 percent.
Moving up to the median, the results provided three distinct findings. First, the sectors of Store Retailers (44), Management (55), and Health/Social Services (62) continued to expand in the number of industry observations indicating a greater presence of Scaled Firms. Second, many other sectors now showed a presence of Scaled Firms, as shown by non-zero %Scaled Firm values that widely ranged from 8.9 to 58.1 percent. Third, small firms at the median were least scalable in the sectors of Agriculture (11), Utilities (22), Transportation (48), Real Estate/Rental (53), and Arts/Entertainment (71) because the existence of Scaled Firms (i.e., non-zero %Scaled Firms) was still zero. However, the %Scaled Firms for these five sectors increased ranging from 10.7 to 52.4 percent by the 75th percentile.
3.2. Small Business Scalability by Regional Context
The current study’s second guiding research question asked: What mesoeconomic factors influence a small firm’s scalability within the context of its sector? To address this question, the current study ran the proposed model regressing the natural log of Scaled Firms by the predictor variables consisting of Micro Firms, Midsize Firms, Large Firms, Household Wealth, Diversity Index, %BA+ Degrees, %Unemployment, and Metro Type. The following narrative highlights the results by predictor.
Table 3 shows the estimates from the regression model for Micro Firms, Midsize Firms, and Large Firms by NAICS Sector. For Micro Firms, the estimates were positive and statistically significant for all NAICS sectors. Micro Firms had the greatest effect on scaling small businesses in Primary Metal Manufacturing (33) with an estimate of 0.0344 (p < 0.0001), indicating for every additional Micro Firm, Scaled Firms increased by 3.44 percent in this sector. In comparison, Micro Firms had the smallest positive effect on scaling small businesses in Real Estate/Rental (53) with an estimate of 0.0064 (p < 0.0001), suggesting that for every additional Micro Firm, Scaled Firms increased by only 0.64 percent in this sector.
Table 3.
Micro Firms, Midsize Firms, and Large Firms estimates by NAICS sector.
For Midsize Firms, the estimates were positive and statistically significant in all sectors, except for two, Store Retailers (44) and Non-Public Services (81). Even so, Midsize Firms had the greatest positive effect on scaling small businesses in Agriculture (11) with an estimate of 0.2910 (p < 0.0001), indicating for every additional Midsize Firm, Scaled Firms increased by 29.1 percent in this sector. In comparison, Midsize Firms had the smallest positive effect on scaling small businesses in Accommodations Services (72) with an estimate of 0.0144 (p < 0.0001), suggesting that for every additional Midsize Firm, Scaled Firms increased by only 1.44 percent in this sector.
Although the estimates were mixed, Large Firms had the greatest positive effect on scaling small firms in Transportation (48) with an estimate of 0.1667 (p < 0.01), suggesting for every additional large firm, Scaled Firms increased by 16.67 percent in this sector. Otherwise, many of the remaining sector estimates were negative and statistically significant. Of these, Large Firms had the greatest negative effect on scaling small businesses in Store Retailers (44) with an estimate of −3.2530 (p < 0.0001), indicating for every additional Large Firm, Scaled Firms decreased by 325.3 percent in this sector. In comparison, Large Firms had the least negative effect on scaling small firms in Management (55) with an estimate of −0.0907 (p < 0.01), i.e., for every additional large firm, Scaled Firms decreased by about 9.1 percent in this sector.
As shown in Table 4, for %BA+ Degrees, the estimates were positive and statistically significant, except for three sectors. For instance, %BA+ Degrees had the greatest positive effect on scaling small firms in Professional Sciences/Technical Services (54) with an estimate of 0.0363 (p < 0.0001), indicating for every percentage increase in BA+ degrees, Scaled Firms increased by 3.63 percent in this sector. In comparison, %BA+ Degrees had the smallest positive effect on scaling small firms in Primary Metal Manufacturing (33) with a statistically significant estimate of 0.0035 (p < 0.05), for every percentage increase in %BA+ Degrees, Scaled Firms increased by only 0.35 percent in this sector.
Table 4.
BA+ Degree, Household Wealth, %Unemployment estimates by NAICS sector.
As cited earlier, Household Wealth (HH Wealth) defined the county’s median household income to state’s ratio. As shown in Table 4, the sector household wealth estimates were mixed but mostly indicating negative estimates with statistical significance. The greatest negative effect on scaling small firms occurred in Management (55) with an estimate of −0.0081 (p < 0.001), indicating for every unit increase in household wealth, Scaled Firms decreased by 0.81 percent in this sector. In comparison, household wealth had the least negative effect on scaling small firms in General Merchandising (45) with an estimate of −0.0020 (p < 0.01), indicating for every unit increase in HH Wealth, Scaled Firms decreased by 0.20 percent in this sector.
Table 5 also showed the %Unemployment estimates were positive and statistically significant, except for the sectors Wood Product Manufacturing (32), Warehouse/Storage (49), Information (51), and Accommodation Services (72). Even so, %Unemployment had the greatest positive effect on scaling small firms in Real Estate/Rental (53) with an estimate of 0.0817 (p < 0.0001), suggesting for every percentage increase in unemployment, Scaled Firms increased by 8.17 percent in this sector. In comparison, %Unemployment had the smallest positive effect on scaling small businesses in Agriculture (11) with an estimate of 0.0221 (p < 0.05), suggesting that for every percentage increase in unemployment, Scaled Firms increased by 2.21 percent in this sector.
Table 5.
Diversity Index, Metro Type, Model R2, and dependent mean by NAICS Code.
As shown in Table 5, for the Diversity Index the estimates were positive and statistically significant, except for three sectors: Primary Metal Manufacturing (33), Warehouse/Storage (49), and Arts/Entertainment (71). Even so, the Diversity Index indicated the greatest positive effect on scaling small firms in Wholesale Trade (42) with an estimate of 0.0125 (p < 0.0001), suggesting for every percentage increase in Diversity Index, Scaled Firms increased by 1.25 percent in this sector. In comparison, Diversity Index had the smallest positive effect on scaling small businesses in Transportation (48) with an estimate of 0.0025 (p < 0.001), indicating that for every percentage increase in Diversity Index, Scaled Firms increased by only 0.25 percent in this sector.
Also shown in Table 5, the Metro Type estimates were positive and statistically significant, except for two sectors: Agriculture (11) and Mining/Oil Gas (21). Even so, Metro Type had the greatest positive effect on scaling small businesses in Management (55) with a statistically significant estimate of 0.2561 (p < 0.0001), indicating for every unit increase along the Metro Type scale (0–8), Scaled Firms increased by about 25.6 percent in this sector. In comparison, Metro Type had the smallest positive effect on scaling small businesses in Fabrication/Textile Manufacturing (31) with an estimate of 0.0482 (p < 0.05), indicating that for every unit increase along the Metro Type scale, Scaled Firms increased by 4.82 percent in this sector.
Table 5 also provides the associated R2 values from the regression models. The R2 value represents the proportion of the variation in the LN (Scaled Firm) dependent variable explained by the regression model predictors. Agriculture (11) had the smallest R2 value with 0.152 suggesting the predictors explained only about 15.2 percent of the variation in scaling small firms in this sector. In comparison, Professional Sciences/Technical Services (54) had the largest R2 value with 0.601 suggesting the predictors explained about 60 percent of the variation in scaling small businesses in this sector. Real Estate/Rental (53), Management (55), and Construction (23) also had comparable R2 values of 0.581, 0.551, and 0.547, respectively.
The last column in Table 5 provides the exponentiated mean of the dependent variable defined by the natural log of Scaled Firms. Agriculture (11) had the smallest exponentiated mean with 1.5 Scaled Firms, while Accommodation Services (72) had the largest exponentiated mean at 9.2 Scaled Firms. Management (55), Health/Social Services (62), and Store Retailers (44) also had comparable exponentiated means of 7.3, 6.6, and 6.3 Scaled Firms, respectively.
4. Discussion
The current study explored regional mesoeconomic factors influencing the scalability of small firms within U.S. counties. The current study’s first guiding research question is as follows: How does the scalability of small firms vary across different sectors? The results indicated that the scalability of small firms was not uniform across sectors, a finding that aligns with previous research implying that a small firm’s ability to scale depends on the industry sector in which it operates (e.g., Hvolkova et al., 2019; Pelletier & Cloutier, 2019; N. Singh et al., 2023).
The current study’s second guiding research question is as follows: What mesoeconomic factors influence a small firm’s scalability within the context of its sector? The current study found that a higher percentage of Micro Firms in a region positively impacted the growth of Scaled Firms, which aligns with prior research on the scalability of small businesses (e.g., Munyo & Veiga, 2024; Ofem et al., 2020; V. Singh, 2010). In 21 of the 23 sectors, a higher percentage of Midsize Firms (MSFs) in a region also positively influenced the growth of Scaled Firms, as supported by prior studies (Ahsan et al., 2021; Cheah et al., 2023; Fotopoulos, 2023; Munyo & Veiga, 2024). In contrast, higher percentages of large firms negatively impacted the scalability of small firms in nearly half of the sectors. This can happen in industries dominated by large vertically integrated firms, which limits opportunities for Micro Firm suppliers to scale as external suppliers, as these large firms rely on internal supply chains (Xin & Park, 2024).
The current study also found that a higher percentage of college-educated individuals (%BA+) positively impacted the scalability of small firms in 21 of the 23 sectors. This supports the literature highlighting the importance of a well-educated workforce for business growth (e.g., Arshed et al., 2024; Bauman & Lucy, 2021). In contrast, the results showed household wealth in a region having negative effects in small firm scaling potential in 15 of the 23 sectors, suggesting that the higher the household income the less likely the scaling of small firms occurred in the select sector. This may happen because wealthier populations often enjoy more stable and secure incomes, which can reduce the motivation for entrepreneurial risk-taking (Bouchouicha & Vieider, 2019). Furthermore, affluent individuals may prefer passive investments, such as real estate or stocks, rather than actively engaging in the operational challenges of starting or growing a small business (Clayton et al., 2024).
The current study also found that regional unemployment rates positively impacted the scalability of small firms across 19 of the 23 sectors, suggesting that higher unemployment contributes to the growth of Scaled Firms. This may be due to displaced workers seeking employment in small firms, offering businesses access to a larger, more cost-efficient labor force willing to accept lower wages or flexible conditions (Gupta, 2024). Such labor market conditions can help reduce operational costs, facilitating the scaling and investment in growth for small firms.
Access to a diversified workforce also had a positive effect on scalability in 20 of the 23 industrial sectors. Diverse teams bring different problem-solving perspectives, fostering innovation and enabling Micro Firms to develop niche products (Rafaqat et al., 2022). This diversity also enhances a small firm’s ability to understand and address customer needs, especially when expanding into global markets.
The current study also showed that the type of metropolitan area—e.g., rural, suburban, or urban—had a significant positive effect on the scalability of small firms in 21 of the 23 sectors. Although scaling small firms can be challenging in rural (Beckmann et al., 2021) and suburban areas (Hartman & Kear, 2024; McGuinness et al., 2018), the results suggest that urban areas offer the most favorable conditions for scaling small firms. Based on the literature, urban environments provide larger customer populations, diverse labor markets, and access to critical infrastructure, such as technology hubs and financial institutions, which are key resources for scaling small firms (Saputra & Darmawan, 2023).
An additional insight comes from the exponentiated mean of the dependent variable, defined as the natural log of Scaled Firms in Table 5. The results indicated that the Agriculture (11) sector had the smallest exponentiated mean, with 1.5 Scaled Firms, while the Accommodation Services (72) sector had the largest exponentiated mean, at 9.2 Scaled Firms. This finding reinforces the sector analysis in Table 2, which indicated that the scalability of small firms was not uniform across sectors—a finding that aligns with previous research implying that a small firm’s ability to scale depends on the industry sector in which it operates (e.g., Hvolkova et al., 2019; Pelletier & Cloutier, 2019; N. Singh et al., 2023).
To further highlight this point, consider that the Agriculture (11) sector encompasses businesses primarily involved in growing crops, raising animals, harvesting timber, and harvesting fish or other animals (U.S. Census Bureau, 2022a, p. 16). In contrast, the Accommodation Services (72) sector includes businesses providing lodging and/or preparing meals, snacks, and beverages for immediate consumption (U.S. Census Bureau, 2022a, p. 16). Thus, while the Agriculture (11) sector faces constraints such as limited land, high capital intensity, and challenging market dynamics (Begimkulov & Darr, 2023), the Accommodations (72) sector benefits from replicable business models, demand-driven growth, and flexible strategies for scaling (Cheah et al., 2023).
4.1. Assumptions and Limitations
These findings should be interpreted in light of the following assumptions and limitations. The data in this study were derived from survey samples, which offer timely and cost-effective estimates of demographic and economic characteristics. Analysts then applied estimation techniques to extrapolate these sample estimates to the entire U.S. population (e.g., U.S. Census Bureau, 2022d). As a result, the current study assumed the findings were applicable to all counties represented in the data.
In the current study, the unit of analysis was defined by NAICS industries, while the level of analysis was determined by the 23 NAICS sectors. It was assumed that the predictor effects—or lack thereof—observed for a given two-digit sector applied across its NAICS industries at the four-digit code level. Results may have varied across industries within a sector; however, the study was constrained by practical limitations in the research design. Analyzing the data at the NAICS industry level would have resulted in tables with findings for 272 unique four-digit industry codes, which would have exceeded the space available for publication.
Lastly, the current study acknowledges the limitations of the results from the absence of other regional mesoeconomic predictor variables in the regression model that might increase the R2 value and thereby, further explain the variation in scaling small firms for select NAICS sectors. Examples of such predictors known to impact small business growth include factors like the regulatory environment (Solano et al., 2023), cultural attitudes about entrepreneurship, risk-taking, and innovation (Arrak et al., 2020), and a region’s political stability and governance structure (Abegaz et al., 2023).
4.2. Contributions to Regional Development: Policy and Practice
Despite the assumptions and limitations, the current study’s findings provide valuable insights into the relationship between mesoeconomic factors and small business scalability within regional development, emphasizing the transformative role of place in fostering entrepreneurial growth (Cainelli et al., 2022). In particular, the findings highlighted the importance of MSFs as key enablers of small firm scalability, supporting the concept of interfirm interdependence within regional ecosystems. These collaborative relationships stimulate innovation, resource sharing, and economic growth (Daniel et al., 2022; Munyo & Veiga, 2024; Qian & Acs, 2023). Policymakers should harness these dynamics by promoting industry partnerships, incubators, and innovation hubs that connect small and Midsize Firms to enhance small business scalability and strengthening regional economies (Audretsch et al., 2024).
The current study also revealed spatial disparities between urban, suburban, and rural areas in supporting small business scalability. Urban regions, with their advanced infrastructure, skilled labor, and market access, provide distinct advantages over rural areas (Hartman & Kear, 2024; Saputra & Darmawan, 2023). However, the entrepreneurial potential of rural regions can be unlocked through targeted policies, such as broadband expansion, infrastructure improvements, and funding initiatives to bridge these gaps (Beckmann et al., 2021; McGuinness et al., 2018). By fostering cross-regional integration—such as digital networks, supply chain collaborations, and knowledge-sharing platforms—policymakers can create synergies between urban centers and rural areas, enhancing regional economic resilience (Barnett et al., 2024).
As noted earlier, human capital and workforce diversity were critical drivers of scalability and regional competitiveness. Regions with a highly educated and diverse workforce demonstrate greater entrepreneurial innovation, aligning with human capital theories linking skills and diversity to firm growth (Arshed et al., 2024; Bauman & Lucy, 2021). Policymakers can leverage this advantage by investing in education, workforce development, and diversity initiatives tailored to local industry needs. Inclusive hiring practices and support for immigrant entrepreneurship, for example, can further stimulate innovation and economic vibrancy within regions (Rafaqat et al., 2022). When combined with sector-specific interventions aligned with regional strengths, these strategies can address scalability challenges faced by small firms and promote long-term economic development (Hvolkova et al., 2019; Pelletier & Cloutier, 2019).
Overall, the current study highlights the dynamic interplay between place, entrepreneurship, and regional development. Effective place-based policies that address spatial disparities, strengthen regional ecosystems, and prioritize human capital development can unlock small business scalability across diverse regions. By aligning policies with local contexts and fostering urban–rural complementarities, policymakers can enhance their region’s resilience and competitiveness, driving sustainable and inclusive economic growth (Cheah et al., 2023; Hartman & Kear, 2024). To summarize, specific policy recommendations include the following:
- Urban Regions: Policymakers should support Midsize Firms through public–private innovation clusters that foster collaboration between universities, government agencies, and businesses. While urban areas benefit from dense business networks, they may also require policies to reduce congestion costs and improve access to skilled labor.
- Suburban Regions: Policymakers should develop advanced skill-based workforce training programs that align with regional industry needs to address labor mismatches and enhance small firm scalability. As transition zones with mixed industry compositions, suburban areas may also require flexible business support services to sustain long-term economic growth.
- Rural Regions: Policymakers should prioritize infrastructure investments, particularly in broadband access, transportation networks, and targeted funding to stimulate entrepreneurial activity. However, rural areas face challenges such as low population density and limited financial resources, necessitating public investments in digital infrastructure and local entrepreneurship initiatives.
4.3. Future Research Within the Context of the Latest Studies on Scaling Firms
Researchers have increasingly viewed small firm scaling through multifaceted lenses that incorporate structural, strategic, and contextual elements. For example, Audretsch et al. (2024) proposed a dual-level framework that distinguished between firm-specific (micro) and ecosystemic (macro) influences. They argue that scaling depends on aligning internal capabilities—such as leadership and innovation—with external conditions like policy, capital access, and regional ecosystems. The current study supports the researchers’ premise by advancing the notion that a firm’s embeddedness in a broader socio-economic context at the mesoeconomic level is also a factor in scaling. In comparison, Belitski et al. (2023) introduced the concept of “accelerated firm growth”, highlighting temporal agility as a key factor. Their findings suggest that firms capable of quickly sensing and seizing growth opportunities outperform peers, regardless of initial resources. The current study’s industry-sector analysis complements this by showing how sectoral context may shape firms’ agility and access to growth opportunities. In a similar manner, Mansikkamäki (2023) introduced a life-cycle perspective, asserting that firm age and size significantly shape scaling trajectories. He categorized firms into different growth–profitability configurations, revealing that younger firms often prioritize growth over profitability, whereas mature firms shift toward sustainable profit margins. This model suggests that scaling strategies must be age-contingent and dynamic, adjusting as firms transition through stages of development. The current study’s mesoeconomic determinants could add further context to this model to explain when such transitions best occur.
Other researchers have sought to bring more order and clarity to the study of scaling small firms. For example, Garcia-Martinez et al. (2023) conducted a meta-analysis on SME growth, identifying inconsistencies in how scaling is defined and measured. They call for longitudinal and configurational research designs that can capture episodic or non-linear growth paths. Their recommendation aligns with the current study’s focus on mesoeconomic factors, which could serve as regression mediators in future research. In contrast, Coviello et al. (2024) clarify the distinction between scalability and scale-up, framing scalability as an intentional design principle. They emphasize aligning business models and operations with growth readiness from the outset. Together, these most recent studies articulate a more nuanced understanding of small firm scaling by incorporating ecosystem influences, time sensitivity, life-cycle stages, and structural preparedness. Future research should continue integrating these dimensions. In this context, the current study’s mesoeconomic determinants may serve as a useful framework for identifying how external regional factors shape diverse scaling trajectories.
Building on the results presented here, future research could expand the regression model to include additional regional-level predictor variables to illuminate further what mesoeconomic factors influence small firm scaling per sector. However, possibilities for more immediate research exist using the study’s data collection. The findings suggested a positive relationship between Scaled Firms and Micro Firms based on the regression estimates in Table 2. How the presence of Scaled Firms and the mesoeconomic factors relate to Micro Firm formation by sector would contribute to the current study’s findings. Similarly, the findings suggested an overall positive relationship between Scaled Firms and Midsize Firms based on the regression estimates in Table 2. How the presence of Scaled Firms and the mesoeconomic factors relate to Midsize Firm expansion by sector would also contribute to the current study’s findings.
Future research might then examine the mesoeconomic factors as determinants of large firm sustainability. The current study showed mostly an inverse relationship between scaled and large firms based on the negative regression estimates in Table 2. Even so, how the presence of Scaled Firms and the mesoeconomic factors relate to Large Firm sustainability by sector would complement the current study’s findings.
5. Conclusions
This study provides new insights into how mesoeconomic factors—such as Midsize Firm collaboration, workforce diversity, and regional economic conditions—shape small firm scalability across industry sectors and geographic regions. Based on Endogenous Growth Theory and New Economic Geography, the findings highlighted the role of Midsize Firms, workforce diversity, human capital, and regional economic conditions in shaping small business growth.
The findings underscore that small firm scalability is shaped by both industry sector dynamics and regional economic conditions. Sectors such as retail, management, and healthcare offer greater expansion opportunities, while agriculture and utilities face structural constraints. These challenges are further compounded by regional disparities, where urban areas benefit from dense business networks and infrastructure advantages, whereas rural regions struggle with limited financial resources, labor availability, and connectivity. Midsize firms emerged as key enablers of small firm scalability, fostering interfirm interdependence that drives innovation and resource-sharing. However, large firms, particularly in vertically integrated industries, can act as barriers by limiting supplier and market entry opportunities. Moreover, regional disparities exacerbate these challenges, with urban centers benefiting from business networks and infrastructure, while rural regions contend with labor shortages and limited financial resources. These findings underscore the need for targeted, place-based policies to support small firm growth across diverse economic landscapes.
From a policy and practice standpoint, this study outlines key strategies for regional economic development. Urban policymakers should strengthen public–private innovation clusters to enhance collaboration between universities, businesses, and government agencies. Suburban regions benefit from advanced workforce training programs aligned with industry demands, reducing skill mismatches and improving small firm scalability. For rural regions, investments in digital infrastructure, broadband expansion, and targeted financial incentives are critical to overcoming barriers and fostering entrepreneurship. Additionally, cross-regional integration strategies—such as digital supply chains and knowledge-sharing platforms—can help bridge the urban–rural divide, enhancing economic resilience.
The study also provided a foundation for future research on small firm scalability by emphasizing mesoeconomic determinants that influence entrepreneurial ecosystems. Further research should explore how Scaled Firms contribute to new small firm formation and Midsize Firm expansion, offering a more comprehensive view of business ecosystem evolution. Additionally, incorporating regulatory, cultural, and institutional factors into future models could provide deeper insights into broader regional economic competitiveness.
In summary, this study’s findings provide direct implications for policymakers, entrepreneurs, and economic developers seeking to foster inclusive and sustainable regional growth. Unlocking regional economic growth requires targeted, data-driven policies that bridge sectoral and regional disparities. By strengthening workforce development, expanding infrastructure investment, and fostering interfirm collaboration, policymakers can directly support small firm scalability—unlocking regional economic growth and ensuring long-term economic resilience.
Funding
This research received no external funding.
Institutional Review Board Statement
Not applicable.
Informed Consent Statement
Not applicable.
Data Availability Statement
The data presented in this study are available in the public domain and accessible online via URLs included in the Reference section, cited by source identified in the Methods section.
Conflicts of Interest
The author declares no conflict of interest.
References
- Abegaz, M. B., Debela, K. L., & Hundie, R. M. (2023). The effect of governance on entrepreneurship: From all income economies perspective. Journal of Innovation and Entrepreneurship, 12(1), 1–18. [Google Scholar] [CrossRef]
- Aghion, P., & Howitt, P. W. (2025). The economics of growth. MIT Press. [Google Scholar]
- Ahsan, M., Adomako, S., & Mole, K. F. (2021). Perceived institutional support and small venture performance: The mediating role of entrepreneurial persistence. International Small Business Journal, 39(1), 18–39. [Google Scholar] [CrossRef]
- Arrak, K., Kaasa, A., & Varblane, U. (2020). Regional cultural context as a determinant of entrepreneurial behaviour: The case of Germany. The Journal of Entrepreneurship, 29(1), 88–118. [Google Scholar] [CrossRef]
- Arshed, N., Rauf, R., & Bukhari, S. (2024). Empirical contribution of human capital in entrepreneurship. Global Business Review, 25(3), 683–704. [Google Scholar] [CrossRef]
- Audretsch, D. B., Belitski, M., & Theodoraki, C. (2024). Micro and macro factors of firm scaling. Technological Forecasting and Social Change, 202, 123312. [Google Scholar] [CrossRef]
- Bakhtiari, S., Breunig, R., Magnani, E., & Zhang, Y. (2020). Financial constraints and small and medium enterprises: A review. IZA Discussion Papers #12936. Institute of Labor Economics (IZA). Available online: https://hdl.handle.net/10419/215332 (accessed on 10 January 2025).
- Barnett, M. L., Gilbert, B. A., Post, C., & Robinson, J. A. (2024). Strengthening our cities: Exploring the intersection of ethics, diversity and inclusion, and social innovation in revitalizing urban environments. Journal of Business Ethics, 189(4), 647–653. [Google Scholar] [CrossRef]
- Bauman, A., & Lucy, C. (2021). Enhancing entrepreneurial education: Developing competencies for success. The International Journal of Management Education, 19(1), 100293. [Google Scholar] [CrossRef]
- Bazen, S. (2011). Econometric methods for labour economics. Oxford University Press. [Google Scholar]
- Beckmann, M., Garkisch, M., & Zeyen, A. (2021). Together we are strong? A systematic literature review on how SMEs use relation-based collaboration to operate in rural areas. Journal of Small Business & Entrepreneurship, 35(4), 515–549. [Google Scholar] [CrossRef]
- Begimkulov, E., & Darr, D. (2023). Scaling strategies and mechanisms in small and medium enterprises in the agri-food sector: A systematic literature review. Frontiers in Sustainable Food Systems, 7, 1169948. [Google Scholar] [CrossRef]
- Belitski, M., Stettler, T., Wales, W., & Martin, J. (2023). Speed and scaling: An investigation of accelerated firm growth. Journal of Management Studies, 60(3), 639–687. [Google Scholar] [CrossRef]
- Bouchouicha, R., & Vieider, F. M. (2019). Growth, entrepreneurship, and risk-tolerance: A risk-income paradox. Journal of Economic Growth, 24(3), 257–282. [Google Scholar] [CrossRef]
- Brown, P. (2024). Education, opportunity and the future of work in the fourth industrial revolution. British Journal of Sociology of Education, 45(4), 475–493. [Google Scholar] [CrossRef]
- Cainelli, G., Giannini, V., & Iacobucci, D. (2022). How local geography shapes firm geography. Entrepreneurship & Regional Development, 34(9–10), 955–976. [Google Scholar] [CrossRef]
- Cheah, J., Leong, S. Y., & Fernando, Y. (2023). Innovation strategies and organizational performance: The moderating role of company size among small-and medium-sized companies. Benchmarking: An International Journal, 30(9), 2854–2868. [Google Scholar] [CrossRef]
- Clayton, P., Feldman, M., & Montmartin, B. (2024). Entrepreneurial finance and regional ecosystem emergence. Small Business Economics, 62(4), 1493–1521. [Google Scholar] [CrossRef]
- Coviello, N., Autio, E., Nambisan, S., Patzelt, H., & Thomas, L. D. (2024). Organizational scaling, scalability, and scale-up: Definitional harmonization and a research agenda. Journal of Business Venturing, 39(5), 106419. [Google Scholar] [CrossRef]
- Crouzet, N., & Mehrotra, N. R. (2020). Small and large firms over the business cycle. American Economic Review, 110(11), 3549–3601. Available online: https://www.aeaweb.org/articles?id=10.1257/aer.20181499 (accessed on 10 January 2025). [CrossRef]
- Daniel, L. J., de Villiers Scheepers, M. J., Miles, M. P., & de Klerk, S. (2022). Understanding entrepreneurial ecosystems using complex adaptive systems theory: Getting the big picture for economic development, practice, and policy. Entrepreneurship & Regional Development, 34(9–10), 911–934. [Google Scholar] [CrossRef]
- Dopfer, K., Foster, J., & Potts, J. (2004). Micro-meso-macro. Journal of Evolutionary Economics, 14(3), 263–279. [Google Scholar] [CrossRef]
- Elsner, W., & Heinrich, T. (2011). Coordination on “meso”-levels: On the co-evolution of institutions, networks and platform size. In S. Mann (Ed.), Sectors matter! (pp. 115–163) Springer. [Google Scholar] [CrossRef]
- Fotopoulos, G. (2023). Knowledge spillovers, entrepreneurial ecosystems and the geography of high growth firms. Entrepreneurship Theory and Practice, 47(5), 1877–1914. [Google Scholar] [CrossRef]
- Fujita, M., & Mori, T. (2005). Frontiers of new economic geography. Papers in Regional Science, 84(3), 377–405. [Google Scholar] [CrossRef]
- Garcia-Martinez, L. J., Kraus, S., Breier, M., & Kallmuenzer, A. (2023). Untangling the relationship between small and medium-sized enterprises and growth: A review of extant literature. International Entrepreneurship and Management Journal, 19, 455–479. [Google Scholar] [CrossRef]
- Gartner. (2025, March 20). Small and midsize business (SMB). Available online: https://www.gartner.com/en/information-technology/glossary/smbs-small-and-midsize-businesses (accessed on 20 March 2025).
- Gupta, R. (2024). Untangling the nexus of entrepreneurship and unemployment: A bibliometric review. Journal of Global Entrepreneurship Research, 14(1), 1–15. [Google Scholar] [CrossRef]
- Hanifzadeh, F., Talebi, K., & Jafari-Sadeghi, V. (2024). Scalability of startups: The impact of entrepreneurial teams. Journal of Global Entrepreneurship Research, 14(1), 1–21. [Google Scholar] [CrossRef]
- Hartman, J. B., & Kear, M. T. (2024). Governing by entrepreneurship: Entrepreneurial ecosystems and socio-spatial difference. Competition & Change, 28(1), 209–227. [Google Scholar] [CrossRef]
- Hvolkova, L., Klement, L., Klementova, V., & Kovalova, M. (2019). Barriers hindering innovations in small and medium-sized enterprises. Journal of Competitiveness, 11(2), 51–67. [Google Scholar] [CrossRef]
- Kraus, S., McDowell, W., Ribeiro-Soriano, D. E., & Rodríguez-García, M. (2021). The role of innovation and knowledge for entrepreneurship and regional development. Entrepreneurship & Regional Development, 33(3–4), 175–184. [Google Scholar] [CrossRef]
- Krugman, P. (1991). Increasing returns and economic geography. Journal of Political Economy, 99(3), 483–499. [Google Scholar] [CrossRef]
- Lane, J. N., Leonardi, P. M., Contractor, N. S., & DeChurch, L. A. (2024). Teams in the digital workplace: Technology’s role for communication, collaboration, and performance. Small Group Research, 55(1), 139–183. [Google Scholar] [CrossRef]
- Lee, Y. S. (2017). Entrepreneurship, small businesses and economic growth in cities. Journal of Economic Geography, 17(2), 311–343. [Google Scholar] [CrossRef]
- Li, Q., Chen, H., Chen, Y., Xiao, T., & Wang, L. (2023). Digital economy, financing constraints, and corporate innovation. Pacific-Basin Finance Journal, 80, 102081. [Google Scholar] [CrossRef]
- Lucas, R. E. (1988). On the mechanics of economic development. Journal of Monetary Economics, 22(1), 3–42. [Google Scholar] [CrossRef]
- Malik, S., Alkhaldi, A., Salamzadeh, A., & Mantas, C. (2024). A systematic literature review on home-based businesses: Two decades of research. Journal of Family Business Management, 14(6), 1136–1152. [Google Scholar] [CrossRef]
- Mansikkamäki, S. (2023). Firm growth and profitability: The role of age and size in shifts between growth–profitability configurations. Journal of Business Venturing Insights, 19, e00372. [Google Scholar] [CrossRef]
- Matray, A. (2021). The local innovation spillovers of listed firms. Journal of Financial Economics, 141(2), 395–412. [Google Scholar] [CrossRef]
- Mazzoni, C. (2024). Firms, industries, markets: The micro, meso, and macro relationships in economic thought and “turning points. Palgrave Macmillan. [Google Scholar] [CrossRef]
- McGuinness, S., Pouliakas, K., & Redmond, P. (2018). Skills mismatch: Concepts, measurement and policy approaches. Journal of Economic Surveys, 32(4), 985–1015. [Google Scholar] [CrossRef]
- Munyo, I., & Veiga, L. (2024). Entrepreneurship and economic growth. Journal of the Knowledge Economy, 15(1), 319–336. [Google Scholar] [CrossRef]
- Ofem, B., Arya, B., Ferrier, W. J., & Borgatti, S. P. (2020). Entrepreneurial orientation, collaborative engagement, and performance: Evidence from rural economic development organizations. Economic Development Quarterly, 34(3), 269–282. [Google Scholar] [CrossRef]
- O’Leary, D. (2022). Unemployment and entrepreneurship across high-, middle- and low-performing European regions. Regional Studies, Regional Science, 9(1), 571–580. [Google Scholar] [CrossRef]
- Pelletier, C., & Cloutier, L. M. (2019). Conceptualizing digital transformation in SMEs: An ecosystemic perspective. Journal of Small Business and Enterprise Development, 26(6/7), 855–876. [Google Scholar] [CrossRef]
- Qian, H., & Acs, Z. J. (2023). Entrepreneurial ecosystems and economic development policy. Economic Development Quarterly, 37(1), 96–102. [Google Scholar] [CrossRef]
- Rafaqat, S., Rafaqat, S., Rafaqat, S., & Rafaqat, D. (2022). The impact of workforce diversity on organizational performance: A review. Journal of Economics and Behavioral Studies, 14(2), 39–50. [Google Scholar] [CrossRef]
- Romer, P. M. (1990). Endogenous technological change. Journal of Political Economy, 98(5), S71–S102. [Google Scholar] [CrossRef]
- Saputra, R. M., & Darmawan, H. (2023). Effects of urbanization and the growth of micro, small, and medium enterprises as supports for the economy of Indonesia in an urban context. Journal of Social Political Sciences, 4(2), 201–214. [Google Scholar] [CrossRef]
- Singh, N., Alshibani, S. M., Misra, P., Nawaz, R., & Gupta, B. (2023). Unravelling barriers in high-tech technology start-ups: Practical insights and solutions for healthcare enterprises. Journal of Enterprise Information Management, 36(6), 1708–1726. [Google Scholar] [CrossRef]
- Singh, V. (2010). MSME: ‘Nursery for entrepreneurship’: A legal perspective [Paper presentation]. National Conference—Energy Conference 2010 on “Innovation, Entrepreneurship and Business Incubation in the Universities” on 3rd and 4th April 2010 at University of Petroleum and Energy Studies, Dehradun. Available online: https://ssrn.com/abstract=2973036 (accessed on 12 February 2025).
- Solano, G., Ram, M., & Rath, J. (2023). Regulation of migrant entrepreneurship: The strained conjunction of laws, policies and practices. International Migration, 61(2), 3–8. [Google Scholar] [CrossRef]
- Sutrisno, S. (2023). The role of partnerships and business networks in the growth of MSMEs in the digital age. Technology and Society Perspectives, 1(3), 122–131. [Google Scholar] [CrossRef]
- Tippmann, E., Monaghan, S., & Reuber, R. A. (2023). Navigating the paradox of global scaling. Global Strategy Journal, 13(4), 735–773. [Google Scholar] [CrossRef]
- Tula, S. T., Ofodile, O. C., Okoye, C. C., Nifise, A. O. A., & Odeyemi, O. (2024). Entrepreneurial ecosystems in the USA: A comparative review with European models. International Journal of Management & Entrepreneurship Research, 6(2), 451–466. [Google Scholar] [CrossRef]
- U.S. Census Bureau. (2020). County business patterns 2020. Available online: https://www.census.gov/data/datasets/2020/econ/cbp/2020-cbp.html (accessed on 7 July 2024).
- U.S. Census Bureau. (2021a). CC-EST2021-ALL data file. Available online: https://www2.census.gov/programs-surveys/popest/datasets/2020-2021/counties/asrh/ (accessed on 7 July 2024).
- U.S. Census Bureau. (2021b). Annual county resident population estimates by age, sex, race, and Hispanic origin (April 1, 2020 to July 1, 2021). Available online: https://www2.census.gov/programs-surveys/popest/technical-documentation/file-layouts/2020-2021/cc-est2021-alldata.pdf (accessed on 7 July 2024).
- U.S. Census Bureau. (2021c). Measuring racial and ethnic diversity for the 2020 census. Available online: https://www.census.gov/newsroom/blogs/random-samplings/2021/08/measuring-racial-ethnic-diversity-2020-census.html (accessed on 12 August 2024).
- U.S. Census Bureau. (2022a). North American industry classification system. Available online: https://www.census.gov/naics/reference_files_tools/2022_NAICS_Manual.pdf (accessed on 12 August 2024).
- U.S. Census Bureau. (2022b). Metropolitan area standards review project. Available online: https://www.census.gov/programs-surveys/metro-micro/about/masrp.html (accessed on 12 August 2024).
- U.S. Census Bureau. (2022c). Geographic levels. Available online: https://www.census.gov/programs-surveys/economic-census/guidance-geographies/levels.html#par_textimage (accessed on 12 August 2024).
- U.S. Census Bureau. (2022d). Sampling estimation and survey inference. Available online: https://www.census.gov/topics/research/stat-research/expertise/survey-sampling.html (accessed on 28 August 2024).
- U.S. Department of Agriculture. (2020). County-level data sets. Available online: https://www.ers.usda.gov/data-products/county-level-data-sets/county-level-data-sets-download-data/ (accessed on 13 June 2024).
- Wen, Y., & Fang, L. (2024). How does innovation collaboration network structure influence regional economic resilience? Economic Development Quarterly, 38(4), 271–287. [Google Scholar] [CrossRef]
- Xin, S., & Park, T. (2024). The roles of big businesses and institutions in entrepreneurship: A cross-country panel analysis. Journal of Innovation & Knowledge, 9(1), 1–15. [Google Scholar] [CrossRef]
Disclaimer/Publisher’s Note: The statements, opinions and data contained in all publications are solely those of the individual author(s) and contributor(s) and not of MDPI and/or the editor(s). MDPI and/or the editor(s) disclaim responsibility for any injury to people or property resulting from any ideas, methods, instructions or products referred to in the content. |
© 2025 by the author. Licensee MDPI, Basel, Switzerland. This article is an open access article distributed under the terms and conditions of the Creative Commons Attribution (CC BY) license (https://creativecommons.org/licenses/by/4.0/).