Article

The Impact of Out-of-Pocket Health Expenditure and Public Health Expenditure on Poverty in Sub-Saharan Africa

1
Auckland Park Kingsway Campus, University of Johannesburg, Johannesburg 2006, South Africa
2
Department of Economic, University of Kinshasa, Kinshasa 012, Democratic Republic of the Congo
3
Department of Economic and Econometrics, College of Business and Economics, Johannesburg 2006, South Africa
*
Author to whom correspondence should be addressed.
Economies 2025, 13(5), 134; https://doi.org/10.3390/economies13050134
Submission received: 6 March 2025 / Revised: 10 April 2025 / Accepted: 21 April 2025 / Published: 14 May 2025
(This article belongs to the Special Issue Public Health Emergencies and Economic Development)

Abstract

:
The modern world is confronting interconnected challenges, such as achieving sustainable health system financing for poverty reduction, amid limited guidance for stakeholders. Adhering to SDG-3 guidelines for good health and well-being could aid in accomplishing SDG-1 for eradicating poverty. This roadmap requires scientific validation. Therefore, this study aims to investigate the effect of out-of-pocket health expenditure (OOPHE) and government health expenditure (GHE) on poverty in sub-Saharan Africa (SSA) using Fully Modified Ordinary Least Squares (FMOLS) from 1990 to 2022. The results reveal that OOPHE increases poverty in the long run. In addition, the results also show that GHE augments poverty in the long run. Moreover, it is observed that GHE reinforces the positive impact of OOPHE on poverty in the long run. Additionally, the study’s empirical results support the conclusion that policymakers should advocate for the effective management of government health expenditure.

1. Introduction

The Abuja Declaration of 2001 represents a significant commitment by African governments to prioritize healthcare funding, aiming to enhance health outcomes and alleviate poverty across the continent in alignment with United Nations objectives. In sub-Saharan Africa, high out-of-pocket (OOP)1 household health expenditures are a major contributor to persistent poverty, hindering progress towards Sustainable Development Goal 1 (No Poverty) and Sustainable Development Goal 3 (Good Health and Well-being). Many families face substantial healthcare costs that consume a significant portion of their income, forcing them to forgo essential medical services and exacerbating health disparities (World Bank, 2021a). Despite the Abuja Declaration’s requirement for member states to allocate at least 15% of their annual budgets to healthcare, public health spending in the region remains insufficient and poorly managed, failing to provide essential financial protection and accessible healthcare services to the population (African Development Bank, 2023). However, adherence to this commitment has been limited. As of 2021, only two countries—South Africa and Cabo Verde—met this target. In 2020, domestic general government spending on health as a percentage of total government expenditure varied significantly across sub-Saharan Africa, ranging from 2.1% to 12% (WHO, 2020). These figures indicate that, on average, sub-Saharan African countries allocate less than half of the 15% target to health, highlighting a substantial deviation from the Abuja Declaration’s objectives. The COVID-19 pandemic has further highlighted these deficiencies, emphasizing the urgent need for increased and more effective public health investments to mitigate the impact of out-of-pocket expenses on impoverished households and accelerate progress towards SDG1 and SDG3 (IMF, 2022). Comprehensive policy reforms are urgently needed to strengthen public health expenditure, improve healthcare infrastructure, and implement robust financial protection mechanisms to prevent healthcare costs from further impoverishing vulnerable populations (UNESCO, 2024; UNDP, 2020).
In comparison to other regions, government health expenditure in Africa, particularly in sub-Saharan Africa, is relatively low. The region’s average health expenditure as a percentage of GDP is around 5.6%, which is significantly lower than that of high-income countries. For instance, many African countries spend less than USD 44 per capita on health, which is below the minimal level defined by international standards. This is partly due to higher out-of-pocket expenditures and limited budget allocations to the health sector (World Bank, 2024). As for Average GHE by Region, GHE varies significantly across different regions: The average health expenditure for OECD is approximately 9.2% of GDP, with some countries reaching up to 10% or more. Health expenditure for East Asia and the Pacific averages around 5.2% of GDP. Health expenditures for Latin America and the Caribbean ranges between 6% and 8% of GDP. These figures highlight substantial disparities in health spending, with developed regions typically allocating a higher percentage of their GDP to health compared to developing regions (World Bank, 2024).
Before the Abuja Declaration of 2001, many African countries, including Nigeria, had limited healthcare policies that struggled with inadequate funding, poor infrastructure, and unequal access to services. The focus was on Primary Health Care (PHC), inspired by the Alma-Ata Declaration, but it was often underfunded and lacked proper implementation. Governments spent little on healthcare, often relying on donor aid and international organizations, which led to fragmented programs. Health systems were weak, with significant disparities between urban and rural areas. The Abuja Declaration aimed to address these issues by urging African governments to allocate at least 15% of their national budgets to healthcare, signaling a shift toward more substantial and sustained domestic investment in health (WHO, 2001).
Sub-Saharan Africa (SSA) shows significant variations across its sub-regions, each facing distinct health and economic challenges. East Africa, with countries like Kenya and Ethiopia, has seen rapid economic growth and improvements in healthcare access, but struggles with high poverty rates, underfunded health systems, and over 50% of health expenditure coming from out-of-pocket payments (WHO, 2020). Southern Africa, including South Africa and Botswana, has a more developed healthcare system but faces inequality and high HIV/AIDS rates, with disparities in healthcare access exacerbating poverty (Geyer, 2019). West Africa, which includes countries like Nigeria and Ghana, faces challenges such as low per capita health spending, high infant mortality, and health-related costs that exacerbate poverty. According to the World Bank (2018), nearly 30% of the population in West Africa is pushed into poverty each year due to healthcare expenses. Central Africa, including Cameroon and the DRC, grapples with instability, poor infrastructure, and limited health funding, leading to high rates of preventable diseases and maternal mortality. In contrast, North and West African countries, while having better health financing, still struggle with political and economic instability, affecting health outcomes. These regional disparities highlight the need for tailored approaches to improving health systems and reducing poverty in SSA.
Despite these efforts, sub-Saharan Africa continues to face significant challenges in healthcare accessibility and affordability, with out-of-pocket household health expenditure often imposing a substantial financial burden on households, particularly those living in poverty (Wagstaff & Doorslaer, 2003). The region continues to have the highest rates of poverty, with approximately 40% of its population living below the international poverty line of USD 1.90 per day (World Bank, 2021b). Understanding the dual impact of out-of-pocket expenditures and public health spending on poverty is essential for evaluating the effectiveness of health financing policies in achieving sustainable development goals. While public health expenditure aims to enhance healthcare access and reduce financial barriers, excessive out-of-pocket costs can exacerbate poverty by pushing households further into economic hardship and widening socioeconomic inequalities (Van Doorslaer et al., 2007). Moreover, the combined influence of these expenditures within the Abuja Declaration framework remains underexplored, underscoring a critical research gap that must be addressed to guide evidence-based policymaking and promote health equity in the region.
Recent studies have provided varying perspectives on the relationship between government health expenditure and poverty reduction in sub-Saharan Africa, a topic often studied separately for out-of-pocket (OOP) expenditures or public health spending. Anyanwu and Erhijakpor (2020) found a negative correlation, indicating that higher public investment in healthcare significantly reduces poverty by improving access to essential health services and lowering OOP expenses. Their analysis, using fixed effects and random effects models, revealed that a 1% increase in government health expenditure correlates with a 0.5% decrease in poverty rates. However, they also highlighted inefficiencies and corruption in public health spending as potential barriers to poverty alleviation, particularly in countries with weak governance structures. This underscores the importance of effective policy implementation and accountability to ensure that increased health spending effectively reduces poverty. In contrast, Gupta et al. (2002) identified a positive relationship between government health expenditure and poverty reduction using dynamic panel data analysis and the Generalized Method of Moments (GMM) approach. They found that in certain contexts, a 1% rise in government health expenditure was associated with a 0.2% increase in poverty rates. This paradoxical finding was attributed to inefficiencies, misallocation of resources, and corruption, which hindered the efficient delivery of healthcare services, especially in countries with weak institutional frameworks. These studies highlight the critical role of governance and accountability in shaping the impact of health expenditure on poverty alleviation.
Diarra et al. (2021) explored the impact of OOP health expenditures on poverty in Burkina Faso using propensity score matching (PSM) and regression analysis. They observed a significant negative correlation between OOP health expenditures and poverty alleviation, indicating that high healthcare costs drive households deeper into poverty. Their analysis demonstrated that households with higher OOP expenditures were 1.5 times more likely to fall below the poverty line compared to those with lower expenditures, particularly affecting vulnerable groups such as individuals with chronic illnesses or without health insurance. However, the study also noted instances where OOP spending on preventive care and effective treatments led to positive health outcomes, potentially reducing long-term healthcare costs and economic hardship (Diarra et al., 2021). Idris et al. (2024) investigated the role of insurance coverage in mitigating the impact of OOP health expenditures on poverty across low- and middle-income countries. Their analysis, using regression and propensity score matching, showed that households without health insurance were more susceptible to catastrophic health expenditures, contributing significantly to poverty. Conversely, in countries with robust health insurance systems, OOP expenditures did not substantially affect poverty rates due to the protective financial coverage provided (Idris et al., 2024). These findings underscore the dual nature of OOP health expenditures, emphasizing the need for comprehensive health insurance and effective public health policies to protect households from falling into poverty due to healthcare costs.
The combined impact of household out-of-pocket health spending and public health expenditure on poverty is critically important within the context of the 2001 Abuja Declaration. This Declaration, adopted by African Union countries, mandates that signatory nations allocate a minimum of 15% of their annual budgets to healthcare with the aim of improving health outcomes and reducing poverty. Out-of-pocket payments for healthcare disproportionately burden low-income households, exacerbating poverty through catastrophic health costs. Public health expenditure, when effectively implemented according to the Abuja Declaration, aims to alleviate these financial burdens by expanding access to affordable healthcare services and reducing out-of-pocket expenses. This strategic allocation of resources not only aims to enhance healthcare utilization but also seeks to alleviate poverty by ensuring that healthcare costs do not destabilize household economic security. By integrating principles of equity and access aligned with the Abuja Declaration’s objectives, public health expenditure can significantly contribute to addressing health inequalities and promoting sustainable development across African nations.
This study aims to examine the impact of out-of-pocket health expenditure (OOPHE) and government health expenditure (GHE) on poverty in sub-Saharan Africa over the period from 1990 to 2022. Specifically, the study seeks to:
(i)
Investigate the long-term effects of OOPHE on poverty in sub-Saharan Africa;
(ii)
Explore how GHE influences poverty reduction in sub-Saharan Africa;
(iii)
Examine the interaction between OOPHE and GHE, assessing how government expenditure may reinforce or mitigate the impact of OOPHE on poverty in SSA.
The study’s contribution is particularly valuable in addressing a key gap in the existing literature on healthcare financing and poverty reduction in sub-Saharan Africa (SSA). While much of the existing research focuses on the isolated impacts of either out-of-pocket health expenditure (OOPHE) or public health spending (government health expenditure, GHE), this study offers a more comprehensive approach by analyzing the combined effect of both OOPHE and GHE on poverty in SSA. By integrating these two perspectives, the study is able to highlight the nuanced and potentially conflicting impacts of healthcare financing on poverty dynamics. Furthermore, the study’s methodological rigor strengthens its contribution. The use of advanced econometric techniques, such as the Pesaran (2004, 2015) tests for cross-sectional dependence, the CIPS test (Cross-sectional Augmented Im, Pesaran, and Shin) for cointegration, and the Dumitrescu and Hurlin test for causality, is particularly noteworthy. These approaches allow the study to handle the complexities of panel data and country-specific heterogeneity, which are common in SSA. The application of the Fully Modified Ordinary Least Squares (FMOLS) technique, which addresses endogeneity and identifies long-run relationships, is an important methodological advance that enhances the robustness of the study’s findings.
This combination of comprehensive theoretical analysis, sophisticated empirical methods, and a focus on both public and private health spending provides new insights into how health financing policies can effectively reduce poverty in SSA. Additionally, by bridging the gap between the Abuja Declaration’s health funding targets and their impact on poverty reduction, the study offers valuable evidence for policymakers in SSA to refine strategies for health financing that are both sustainable and poverty-reducing. The findings could inform future health financing reforms and help align actual expenditure with the goals outlined in the Abuja Declaration, ultimately contributing to better health outcomes and poverty alleviation in the region. In sum, the study makes a significant contribution by filling a critical research gap, offering new empirical evidence on the joint impact of OOPHE and GHE, and employing cutting-edge econometric techniques to explore the long-term relationships between health expenditure and poverty in SSA.
Section 2 reviews the pertinent literature. Section 3 discusses the data and econometric model. The results are presented in Section 4, while Section 5 provides the conclusion and policy recommendations.

2. Literature Review

2.1. Out-of-Pocket Household Health Expenditure and Poverty

Out-of-pocket household health expenditure (OOPHE) is widely recognized as a significant driver of poverty, particularly in low- and middle-income countries (LMICs). A substantial body of research has highlighted how catastrophic health expenditures contribute to impoverishment, with health-related financial burdens often pushing vulnerable households deeper into poverty (Wagstaff & Doorslaer, 2003; Xu et al., 2003b). The World Health Organization (WHO, 2021) estimates that nearly 100 million people are pushed into poverty each year due to out-of-pocket health expenses, with LMICs being disproportionately affected. This phenomenon is especially critical in sub-Saharan Africa, where health systems are underfunded and most people rely on private health services for critical care.
In many developing nations, including those of sub-Saharan Africa, the share of out-of-pocket health expenditure can exceed 40% of total health spending, leaving many families vulnerable to financial hardship when they face medical emergencies (Wagstaff, 2010). Studies show that catastrophic health expenditures are particularly prevalent in low-income households, where a substantial portion of income is spent on healthcare (Xu et al., 2003a). For instance, in Ghana, it was found that medical costs were responsible for pushing over 2 million people below the poverty line in 2012, with rural households bearing a disproportionate burden (Novignon, 2012). This phenomenon underscores the relationship between healthcare access and economic vulnerability, where unexpected health expenses limit households’ ability to meet essential needs like food, education, and housing.
The Theory of Catastrophic Health Expenditure posits that health costs become catastrophic when they exceed a specified threshold of household income, often estimated to be around 10% of total income (Xu et al., 2003b). Once this threshold is breached, households face severe financial strain, forcing them to make difficult choices, such as reducing food consumption or withdrawing children from school, in order to pay for medical treatment (Xu et al., 2003a). In some instances, households are forced to liquidate assets, such as land or livestock, further exacerbating their poverty. Additionally, health shocks, including sudden illness or injury, can disrupt household productivity and employment, deepening economic deprivation. In countries like Nigeria and Tanzania, individuals with chronic illnesses have reported a significant loss of income due to time spent away from work for treatment (Ataguba et al., 2015). This loss of income, compounded by high OOPHE, forms a vicious cycle that perpetuates poverty and limits opportunities for social mobility.

OOPHE as a Poverty Trap Mechanism

The concept of health as a poverty trap is crucial in understanding how OOPHE can perpetuate cycles of poverty. Poor health directly impacts labor force participation, productivity, and educational outcomes, all of which are critical to breaking the poverty cycle. For example, sub-Saharan African countries with high OOPHE also experience low levels of human capital development, as families often prioritize healthcare costs over educational investments for children, thereby limiting future income-earning potential (Gage & Crouse, 2017). These intergenerational impacts compound poverty levels and contribute to the persistence of inequities.
In terms of policy interventions, the importance of financial protection mechanisms cannot be overstated. Health insurance schemes or social health protection systems can play a critical role in reducing the catastrophic effects of OOPHE. Countries like Kenya and Rwanda have made significant strides in implementing community-based health insurance (CBHI) schemes, which have shown promising results in reducing financial barriers to care. In Rwanda, for example, the expansion of the community-based health insurance scheme has contributed to increased access to healthcare and a reduction in the financial strain faced by households (Ntaganira et al., 2011).
However, despite such efforts, inefficiencies in public health systems and the lack of universal coverage remain persistent challenges. In some countries, even where national health insurance systems exist, the scope and coverage are often limited, leaving large portions of the population exposed to financial risk (Bump et al., 2017). Moreover, high out-of-pocket payments remain a significant feature of health systems, particularly in rural areas, where people often lack access to health insurance schemes or government-supported health facilities (Wagstaff, 2010).
Recent studies continue to emphasize the need for broader reforms in health financing, particularly in how public funds are allocated. For example, public–private partnerships (PPPs) have been identified as a potential solution for scaling up health insurance coverage and improving the affordability of healthcare services. However, critics argue that without effective regulation, PPPs may deepen inequalities by favoring the wealthier segments of the population (Bump et al., 2017). The growing evidence on the inequitable distribution of government health spending—with urban areas receiving disproportionately more funds than rural areas—further highlights the need for targeted interventions that ensure equitable access to healthcare services for all populations. Additionally, health system strengthening is critical in addressing the root causes of high OOPHE. Several studies argue that improving health infrastructure, increasing health workforce capacity, and enhancing service delivery efficiency could help mitigate the burden on households (Yates, 2009). Countries with better-functioning health systems, such as Botswana and Mauritius, have shown that targeted investments in public health services can significantly reduce reliance on OOPHE (Bump et al., 2017).
The literature firmly establishes the damaging link between OOPHE and poverty in low- and middle-income countries. Health expenditures, when catastrophic, contribute significantly to impoverishment, exacerbating existing inequalities and creating a poverty trap for vulnerable households. While the Theory of Catastrophic Health Expenditure provides a useful framework for understanding this dynamic, the evidence underscores the importance of financial protection mechanisms, such as health insurance and effective public health financing, in mitigating the negative impact of high OOPHE. As such, policymakers must prioritize health system reforms and invest in financial protection schemes to shield households from the economic consequences of high medical costs.

2.2. Public Health Expenditure and Poverty Reduction

Public health expenditure plays a central role in improving healthcare access and alleviating the financial burdens faced by households, particularly in developing countries. A higher allocation of government spending toward healthcare infrastructure, services, and public health programs is strongly linked to better health outcomes, and a reduction in poverty rates, especially among vulnerable populations (Anand & Bärnighausen, 2004; Kruk et al., 2018). In sub-Saharan Africa, where the population often relies on private healthcare services due to weak public health systems, government spending is critical in ensuring equitable access to essential health services.
According to the World Health Organization (WHO, 2020), countries that invest in public health infrastructure see marked improvements in key health indicators, such as maternal and child mortality, life expectancy, and disease prevention, all of which are tightly linked to poverty alleviation. Increased public health expenditure also provides opportunities to reduce health inequities by targeting disadvantaged communities, which often face significant barriers to accessing care. For instance, in Rwanda, an ambitious expansion of the national health insurance program alongside increased public health spending has significantly increased healthcare access, with an estimated 95% of the population now covered by insurance (Kruk et al., 2018). This kind of financial protection reduces the burden of out-of-pocket expenses on households, leading to fewer people falling into poverty due to health-related costs.
However, the impact of public health expenditure in isolation is not sufficient to address the broader issue of poverty. In many countries, especially those in sub-Saharan Africa, the share of public health spending in national budgets remains insufficient. For instance, Nigeria, one of the largest economies in the region, spends just about 5% of its annual budget on health, well below the 10–15% target set by the Abuja Declaration of 2001 (WHO, 2018). This underfunding limits the ability of governments to provide universal access to healthcare, leaving populations vulnerable to catastrophic health expenditures. As a result, even where public health spending has increased, out-of-pocket expenses remain a significant driver of poverty in the region.
Recent studies focusing specifically on sub-Saharan Africa provide deeper insights into the intricate link between health expenditures and poverty in the region. Nabyonga-Orem et al. (2023) analyzed data from 20 low-income sub-Saharan African countries between 2000 and 2019 and found that increased domestic health spending significantly reduces under-five mortality rates. Specifically, a 1% increase in domestic health expenditure was associated with a 5.3-unit decrease in under-five mortality rates. Similarly, O’Donnell et al. (2022) examined the effects of public and external health spending on out-of-pocket (OOP) payments across 43 sub-Saharan African countries from 2000 to 2017. The study revealed that increases in public health spending were more effective in reducing OOP payments compared to external health spending, highlighting the importance of domestic funding in achieving financial protection in healthcare.
Furthermore, Chuma et al. (2021) assessed catastrophic health expenditure (CHE) across sub-Saharan Africa. The review found that CHE was prevalent, with up to 95.2% incidence in lower-middle-income countries, leading to impoverishment and exacerbating poverty cycles. This underscores the need for policies aimed at reducing CHE to protect vulnerable populations. Additionally, Mmbaga et al. (2024) investigated the financial burden of noncommunicable diseases (NCDs) through OOP expenditures in sub-Saharan Africa. The study highlighted that NCDs impose significant financial hardships on households, with coping strategies such as asset liquidation and incurring debt being common, thereby pushing many deeper into poverty.
Lastly, Nwosu and Nwosu (2020) analyzed panel data from 1995 to 2010 across 44 sub-Saharan African countries to examine the effects of health expenditure on health status. The study found that both public and private health expenditures positively influenced health outcomes, including increased life expectancy and reduced infant mortality rates, emphasizing the role of health spending in improving population health and potentially reducing poverty.

2.3. Combined Impact and Policy Implications

The Theory of Catastrophic Health Expenditure is an essential framework for understanding the interplay between out-of-pocket health expenditure (OOPHE), public health expenditure, and poverty. Catastrophic health expenditure occurs when health-related costs consume an excessive portion of a household’s income, often exceeding 10% of total household income (Xu et al., 2003b). Such expenditures can push vulnerable households below the poverty line or exacerbate existing poverty by forcing families to make difficult trade-offs between healthcare and other essential needs such as food, education, or shelter.
Public health expenditure, when appropriately targeted, can alleviate the catastrophic impact of OOPHE by providing financial protection. For instance, government-funded health systems or subsidized healthcare services can shield households from excessive out-of-pocket expenses. In Mauritius, government health spending has significantly reduced OOPHE, resulting in lower levels of impoverishment due to health costs. The country’s healthcare system provides comprehensive coverage for all citizens, reducing reliance on private healthcare spending and ensuring greater health equity (Choudhury et al., 2016).
In the context of sub-Saharan Africa, addressing the combined influence of both OOPHE and public health expenditure is crucial for promoting health equity and reducing poverty. Increased public spending on health can improve healthcare access, reduce the economic burden of health expenses, and lower the incidence of catastrophic health expenditures. However, the effectiveness of these efforts hinges on the integration of financial protection measures, such as universal health coverage (UHC) and health insurance schemes, which can mitigate the adverse effects of high out-of-pocket payments.
Empirical evidence supports the idea that combining higher public health expenditure with targeted financial protection mechanisms can lead to sustainable poverty reduction. For example, Kenya’s National Hospital Insurance Fund (NHIF) has provided affordable health coverage to millions of citizens, helping reduce the economic vulnerability of households and improving overall health outcomes (Ntaganira et al., 2011). Moreover, social protection programs, including cash transfers for vulnerable groups, can further support these efforts by reducing the economic shocks caused by health-related expenses.
While the Abuja Declaration (2001) set a goal for African governments to allocate 15% of their budgets to health, progress in meeting this target has been slow. As noted earlier, countries such as Nigeria have not met this target, and many others continue to fall short. As of 2018, only about 6 out of 47 sub-Saharan African countries were allocating at least 10% of their national budgets to healthcare, well below the 15% target (WHO, 2018). Without greater political will and sustained investments in health, achieving the health-related Sustainable Development Goals (SDGs), particularly SDG 1 (No Poverty) and SDG 3 (Good Health and Well-being), will remain a challenge for the region.

3. Methodology and Data

In this section, we also briefly discuss the dependent and independent variables and justify their inclusion in the empirical models. Poverty headcount is used as a dependent variable in this study. Table 1 describes the variables.
  • Independent Variables
    • Higher out-of-pocket health expenditures (OOPHE) are generally associated with an increase in poverty headcount, as individuals and households may be pushed into poverty due to high medical costs (Van Doorslaer et al., 2007; Wagstaff, 2002).
    • Increased government health expenditure (GHE) tends to reduce the poverty headcount, as public health spending can alleviate the financial burden on households (Gupta et al., 2003).
  • Control variables include:
    • Life Expectancy: Higher life expectancy is typically linked to a lower poverty headcount, as longer, healthier lives can contribute to economic stability and reduced poverty (Acemoglu & Johnson, 2007).
    • Educational Inequality: Greater educational inequality is associated with higher poverty headcount, as disparities in education can limit economic opportunities and perpetuate poverty (Castelló & Doménech, 2002).
    • External Health Expenditure (EXHE): External health expenditures can have a positive impact on reducing poverty headcount by supplementing domestic health financing and improving health outcomes (Lu et al., 2010).
    • Institution Quality (INSTQ): Higher institutional quality is generally associated with lower poverty headcount, as effective institutions can promote economic growth and equitable distribution of resources (Kaufmann et al., 2009).
    • GDP per Capita (GDPpc): Higher GDP per capita is linked to lower poverty headcount, as increased economic output typically translates to higher incomes and reduced poverty (Dollar & Kraay, 2002).
    • Information Communication Technologies (ICT): Improved access to ICT can reduce poverty headcount by enhancing access to information, education, and economic opportunities (Vu, 2011).

3.1. Empirical Specification

To empirically investigate the joint effect of OOPHE and GHE on poverty in 30 SSA countries from 1990 to 2022, this study followed Gupta et al. (2002) and Diarra et al. (2021). However, our model differs from these studies. While Gupta assesses the connection between GHE and poverty, Diarra et al. examine the relationship between OOPHE and poverty, this article addresses a gap in the economic development studies by analyzing the moderating role of GHE in the association between OOPHE and poverty. It is important to note that the selection of the specific time period and countries included was driven by data availability. Our equation is written as follows:
P O V i t = β 1 l n O O P H E i t + β 2 l n G H E i t + β 4 l n O O P H E i t G H E i t + β 5 l n X i t + ϵ i t
where POV is poverty headcount; OOPHE represents out-of-pocket health expenditure; GHE describes government health expenditure; and X denotes control variables, which include life expectancy, educational inequality, external health expenditure (EHE), institution quality (INSTQ), GDPpc and Information Communication Technologies (ICT). OOPHE*GHE is the interaction between OOPHE and GHE. To ensure the model is coherent and effective for meaningful interpretation, Equation (1) utilizes the natural logarithm. This study also acknowledges the presence of missing data, which was addressed using interpolation and extrapolation techniques. Ensuring a continuous time series is essential for robust statistical analysis, particularly when using dynamic panel data models like the System Generalized Method of Moments (SGMM). Interpolation fills gaps within the observed data range, ensuring each time point has a corresponding value and maintaining the integrity of time-series analysis (Baltagi, 2008). Extrapolation extends the data beyond the observed range, allowing for the examination of historical trends and the impact of past events on present conditions, which is crucial for understanding long-term policy impacts and economic cycles (Greene, 2012). Furthermore, missing data can introduce bias and reduce the efficiency of econometric models. Interpolation helps minimize estimation errors caused by data gaps, leading to more reliable and valid inferences (Little & Rubin, 2019). Extrapolation also allows for the inclusion of unobserved future values, providing a more complete dataset for forecasting and policy simulation (Baltagi, 2008), which is essential for evaluating the long-term effects of OOPHE and public health expenditure on poverty in sub-Saharan Africa.

3.2. Estimation Technique

This study examined the impact of out-of-pocket health expenditure (OOPHE) and Government Health Expenditure (GHE) on poverty in sub-Saharan Africa (SSA). To account for significant variations among countries, which are critical when analyzing inter-country heterogeneity, panel data were used instead of cross-sectional data (Ali et al., 2018). Consequently, the commonly used estimation techniques such as OLS, fixed effects (FE), and random effects (RE) were not considered due to their inability to address endogeneity issues. Instead, Fully Modified Ordinary Least Squares (FMOLS) was utilized, which not only addresses endogeneity but also evaluates the long-term equilibrium relationship between the variables.

3.3. Long-Run Equilibrium Association

This study employs the Fully Modified Ordinary Least Squares (FMOLS) method developed by Pedroni (2000) to analyze the long-term equilibrium relationship between variables. FMOLS effectively addresses the serial correlation of the residuals and endogeneity issues while accounting for significant heterogeneity within each sample unit. Additionally, it is robust to omitted variables not included in the cointegrating relationship. Before detailing the FMOLS approach, we first present the standard form of the pooled OLS panel equation as follows:
Y i , t = α i + θ X i , t + μ i , t
where Y i , t describes a matrix (1,1) and is our regressand (poverty).   α i describes a vector of cross-unit factor heterogeneity, θ represents a vector coefficient (K,1), and μ i , t is a vector of the stationary idiosyncratic error term. Hence, X i , t is a vector of regressors of the first order for all units (i), where X i , t = X i , t 1   + ε i , t
According to Phillips (1995), the FMOLS estimator is built to correct two OLS econometric issues: serial correlation and endogeneity.
Thus, the FMOLS estimator can be presented as follows:
β ^ i F M O L S = N 1   i = 1 N i = 1 T x i t x ¯ i 2 1   i = 1 T x i t x ¯ i   y i t * T γ ^ i
where y i t * is a changed version of y i t . This changed version is made to perform the endogeneity correction by including leads and lags. γ ^ i is a term that corrects the effect of serial correlation produced by heterogeneity dynamics in the short-run process, which determines y and x. This study utilized both regressions (FMOLS and Dynamic OLS) to test for robustness. However, our focus is on data provided by FMOLS rather than DOLS. According to Maeso-Fernández et al. (2004), one of the reasons is that DOLS reduces the degrees of freedom by including leads and lags. In contrast to DOLS, FMOLS produces consistent results.
β ^ D O L S * = N 1   i = 1 N t = 1 T z i t z i t i 1 t = 1 T z i t   y i t *
To estimate FMOLS techniques, some requirements need to be met. As we can notice: (i) the panel data should have a sufficient time dimension (from 1990 to 2022) to allow for long-run dynamics to be captured. (ii) The majority of the series employed in this paper are integrated of order one, indicating that all variables are stationary (iii) There is evidence of a cointegrating relationship among the variables. Hence, to overcome the issues of a heterogeneous slope and endogeneity, this study uses a FMOLS method developed by Pedroni (2000). FMOLS analyzes long-term equilibrium by focusing on the concept of cointegration and the long-term relationships between variables. When two or more time series are cointegrated, it indicates a stable long-term relationship, even though the variables may show independent movements in the short term. FMOLS estimates this stable long-run equilibrium by correcting for short-term variations and ensuring that the focus is on long-term dynamics. Particularly suited for studying long-term equilibria, FMOLS highlights how variables interact over time, offering valuable insights into their equilibrium behavior without distortion from short-term shocks or random fluctuations.
The FMOLS technique is also used in the existing literature, demonstrating the validity of this technique. Voto and Ngepah (2024) used FMOLS to analyze the effects of public education expenditure and information and communications technology on income inequality in sub-Saharan Africa. Recent studies have used the FMOLS technique to explore various economic and environmental relationships. For instance, Hailemariam et al. (2022) examined the impact of R&D investments in renewable energy on greenhouse gas emissions in the long run.

3.4. Empirical Strategy

The empirical analysis in this study follows several methodological steps. First, it uses the Pesaran (2004) CD (Cross-Sectional Dependence) test to check for Cross-Sectional Dependence (CSD) across countries, assessing whether cross-sectional independence is present. Then, the study employs the Pesaran (2015) CD test to determine the strength of error dependence, with the null hypothesis assuming weak dependence. If CSD is detected, the Cross-Sectionally Augmented Im–Pesaran–Shin (CIPS) test, developed by Pesaran (2007), is applied. To evaluate cointegration among the series, the study utilizes the Westerlund (2007) approach, which accounts for CSD and structural breaks in the data. To assess the causal direction between OOPHE, GHE and poverty in SSA countries, this paper utilized the Dumitrescu and Hurlin test. Once cointegration is established, the Fully Modified Ordinary Least Squares (FMOLS) method is used to analyze the long-run relationships among the variables.

4. Results

4.1. Cross-Sectional Dependence Results

Our findings indicate that there is cross-sectional dependence (CSD) among our series across countries in sub-Saharan Africa (SSA), as evidenced by p-values below the 5% significance level, rejecting the null hypothesis of independence. This strong CSD in the errors is further confirmed by the rejection of the null hypothesis of weak dependence at the 1% significance level. Table 2 describes the results for CSD tests

4.2. Stationarity Test Results

The significance of the CD test lies in its ability to determine the relevance of first-generation tests (Levin et al., 2002; Im et al., 2003) or the Cross-Sectionally Augmented Im–Pesaran–Shin (CIPS) test (Pesaran, 2007) for this study. Due to the presence of CSD, we employ second-generation stationarity tests to avoid potential misleading conclusions. Our findings indicate that the test statistics for the series are below the critical values at the 1% significance level for first differences, confirming stationarity. The CIPS test rejects the null hypothesis of non-stationarity for the variables in first differences, indicating that all series are integrated of order one (I(1)). Table 3 presents CIPS panel unit root results.

4.3. Panel Cointegration Results

This study utilizes the Westerlund (2007) panel cointegration test, accounting for cross-sectional dependence and heterogeneous slopes, to assess cointegration among variables. Table 4 results reject the null hypothesis of no panel cointegration. Specifically, two out of four test statistics ( G t , P t ,) are statistically significant at the 1% level, suggesting long-run cointegration between income disparity and the regressors. Therefore, Fully Modified Ordinary Least Squares (FMOLS) estimation is necessary to analyze the long-term relationship among cointegrated variables.

4.4. Dumitrescu and Hurling Results

To observe the directional causality, we perform a panel causality between our main variables by including EHE, as this variable plays a key role in complementing GHE specifically in SSA. The results from Table 5 reveal a bidirectional causality between OOPHE and poverty. In other words, a change in OOPHE may affect poverty and vice versa. Out-of-pocket health expenses (OOPHE) and poverty show a bidirectional causality relationship, where substantial OOPHE can lead to poverty, and poverty can heighten dependence on out-of-pocket health spending due to insufficient insurance and affordable healthcare options (Jones & Smith, 2021). Therefore, the causality results in SSA revealed possible endogeneity issues in the model. The results also reveal a unidirectional causality running from GHE to poverty. In SSA, reduced Government Health Expenditure (GHE) correlates with heightened poverty levels, as insufficient funding for healthcare leads to poorer health outcomes and economic challenges for the populace. This connection is underpinned by research that underscores the impact of governmental health spending on poverty alleviation efforts.
Explaining the unidirectional causality running from external health expenditure to poverty in SSA involves understanding how financial inflows specifically targeted at health systems can impact poverty levels. It is also observed that EHE and poverty shows a unidirectional causality running from GHE to poverty. Therefore, the unidirectional causality observed suggests that higher levels of external health expenditure can potentially mitigate poverty by improving health outcomes and enhancing economic opportunities in SSA.

5. Basic Results

Table 6 provides summary statistics indicating significant levels of income poverty in Africa, with a mean of 47.66 and a standard deviation of 21.38. This underscores the persistent challenge of income poverty in the region, consistent with the emphasis of A. Smith et al. (2023) on the necessity of addressing poverty to achieve Sustainable Development Goal 1. Additionally, out-of-pocket health expenditure (OOPHE) shows a mean of 51.98 and a high standard deviation of 72.86, reflecting substantial variation in healthcare spending patterns among individuals. In contrast, government health expenditure (GHE) exhibits a mean of 1.86 and a standard deviation of 1.22, highlighting considerable heterogeneity in the allocation of public health resources across the sample. This heterogeneity underscores the complex nature of health financing in Africa, where disparities in government spending can impact access to essential healthcare services and health outcomes (J. Smith et al., 2023). The same interpretation is applied to all series. However, Figure 1 reveals a negative correlation while Figure 2 shows a slight positive correlation. Table 7 shows the correlation matrix, revealing that both OOPHE and GHE individually have a negative correlation with poverty. Even though Figure 1 and Figure 2 show the correlation between our variables, they do not give directional causality. To estimate the association between OOPHE, GHE, and poverty using FMOLS, we first examine the descriptive statistics, correlation matrix, Variance Inflation Factor (VIF) (Table 8), and Ramsey RESET test for our variables of interest. To detect multi-collinearity in the regression analysis, this study uses the Variance Inflation Factor (VIF). The results indicate no multi-collinearity, as all VIF values are less than 10, demonstrating the reliability of the regression models. To ensure the robustness and appropriate specification of the model, this study performs the Ramsey RESET test. The Ramsey RESET test results show a p-value of 0.854, which is greater than the chosen significance level of 0.05. Thus, we fail to reject the null hypothesis, indicating no strong evidence of omitted variables or model misspecification.

FMOLS Results

Table 9 displays the outcomes of Equation (1) using the POLS, FE, and RE estimation methods. Initially, we estimate the model with each method without the interaction term between OOPHE and GHE to verify that the effects of these factors align with existing studies (R. D. Smith, 2007). Consequently, Table 9 comprises columns 1–6, with columns 1, 3, and 5 presenting results without the interaction term. Specifically, the findings using the POLS, RE, and FE techniques indicate that OOPHE and GHE are individually insignificant in reducing poverty in SSA. This is because the basic FE, RE, and POLS methods are not suitable for estimating Equation (1) due to the likely endogenous nature of several regressors, particularly OOPHE, GHE, their interaction, and GDP per capita. Column 5, using the RE estimator, reveals that OOPHE and GHE have an overall insignificant and negative impact on poverty individually. When the interaction term is included (see column 6), the insignificant effect on poverty persists. As the POLS, FE, and RE results are inappropriate, this study emphasizes the FMOLS results to examine the long-term relationship between our variables. Indeed, the interaction term of OOPHE with GHE significantly amplifies the effect of OOPHE on poverty. Thus, GHE enhances the impact of OOPHE on poverty, with the interaction term having a positive and significant effect that is more substantial than the individual impacts of OOPHE and GHE.
Table 10 presents the long-run FMOLS estimates for the coefficients on OOPHE, GHE, and other variables. For SSA countries, the results in column 2 show that the coefficients on OOPHE and GHE are positive and statistically significant. Specifically, a 1% increase in OOPHE and GHE results in a 0.051% and 0.072% rise in income poverty, respectively, in the long run. Conversely, EHE has a negative and significant effect; a 1% increase in EHE reduces poverty by 0.064% over the long term. The GDP per capita and life expectancy are positive but not significant. Additionally, the estimated coefficient for institutions is positive and significant, suggesting that a 1% improvement in institutional quality increases poverty by 0.043% in SSA in the long run. However, the coefficient for ICT is indicates that a 1% increases in ICT reduces poverty by 0.026% over time. The study also shows that educational inequality is positively and significantly associated with increased poverty, where a 1% rise in educational inequality leads to a 0.048% increase in poverty in the long run. The interaction term between OOPHE and GHE reinforce the positive effect of OOPHE on poverty in the long run. A 1% increase in interaction leads to an 0.84% higher level of poverty. Both FMOLS and DOLS techniques produced largely consistent results regarding long-term relationships among the variables. We focused on FMOLS for evaluating the results because it makes fewer assumptions and yields consistent findings.

6. Discussion

The results presented in column 2 of 
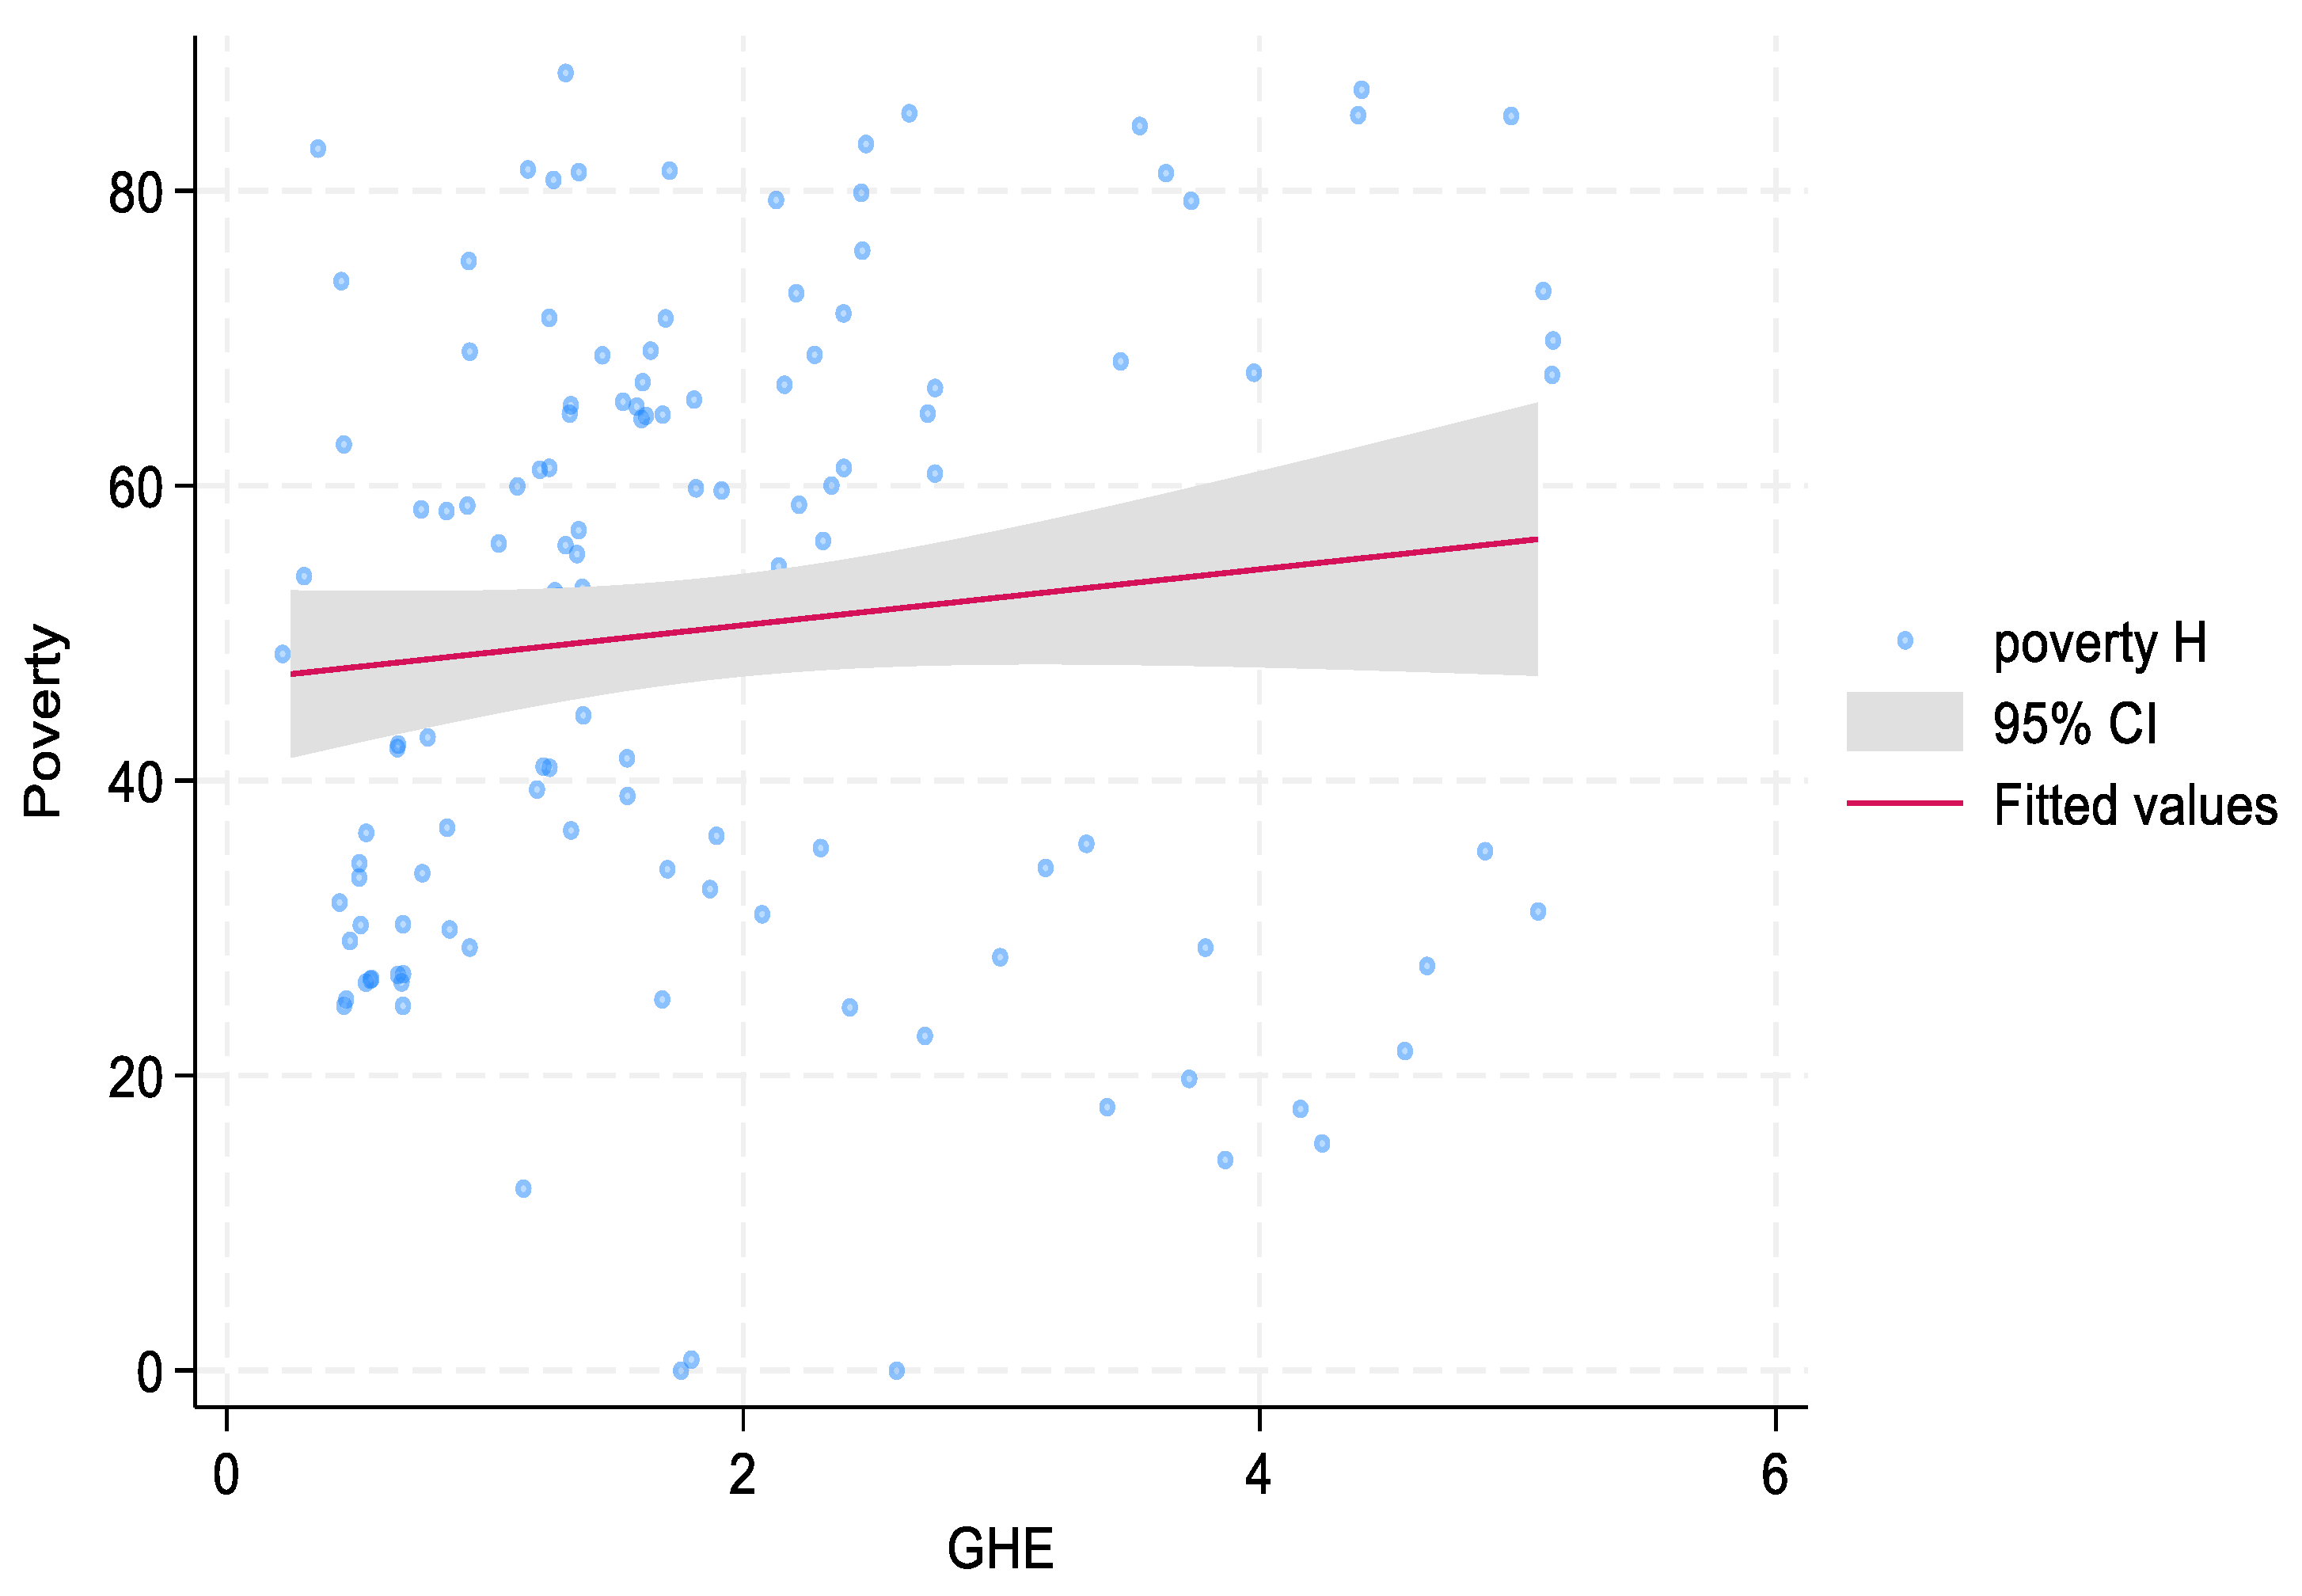
Table 10 indicate that both out-of-pocket health expenditure (OOPHE) and government health expenditure (GHE) have significant positive long-run effects on poverty in sub-Saharan Africa (SSA). Specifically, a 1% increase in OOPHE results in a 0.051% increase in poverty, while a 1% increase in GHE leads to a 0.072% rise in poverty. These findings suggest that both private and public health expenditures are associated with increased poverty levels over time. However, the relationship between GHE and poverty is more complex than anticipated. While we expected that higher government spending on health would reduce poverty, the positive association with poverty could reflect inefficiencies in the allocation of resources within the health sector. The explanation for this relationship is not straightforward. As noted in existing literature, high government health expenditures do not always translate into better health outcomes or broader access to healthcare, particularly in regions where corruption, poor governance, and mismanagement hinder the effective use of resources (World Bank, 2022). Therefore, the positive correlation between GHE and poverty may be driven by inefficient spending, rather than a lack of expenditure itself. This confirms the causality results. It is essential to note that GHE’s effectiveness depends on how funds are managed and directed to the most vulnerable populations. Without addressing governance challenges and ensuring targeted interventions, increased GHE may fail to alleviate poverty and could even exacerbate economic inequality. To mitigate these issues, it is essential for governments to focus on improving the governance of health systems and ensuring that health expenditures are directed toward targeted interventions that address the needs of the most vulnerable populations. Strengthening institutional frameworks to reduce corruption, enhance accountability, and improve transparency can help ensure that public health funds are used efficiently. Moreover, capacity building in health management and the establishment of robust monitoring and evaluation systems are crucial steps toward improving the effectiveness of GHE. Gupta et al. (2020) suggests that the targeting of health interventions is key to ensuring that increased public health spending translates into tangible benefits for the poor. Directing funds toward primary healthcare, preventive measures, and community-based healthcare programs can ensure that health services reach the poorest segments of society, thereby helping to reduce poverty. In addition, policies aimed at reducing out-of-pocket expenditures (OOPHE) can help prevent the poor from being financially burdened by healthcare costs, further alleviating poverty.
The Abuja Declaration of 2001 emphasized the need for African Union countries to allocate at least 15% of their national budgets to health to reduce reliance on OOPHE and reduce poverty. However, many SSA countries have struggled to meet this target, and the gap between actual and targeted health spending is still wide. This underscores the importance of not only increasing GHE but also improving its efficiency and targeting. Enhanced accountability, transparency, and better governance in the health sector are crucial for ensuring that public health spending leads to meaningful improvements in healthcare access and poverty reduction (
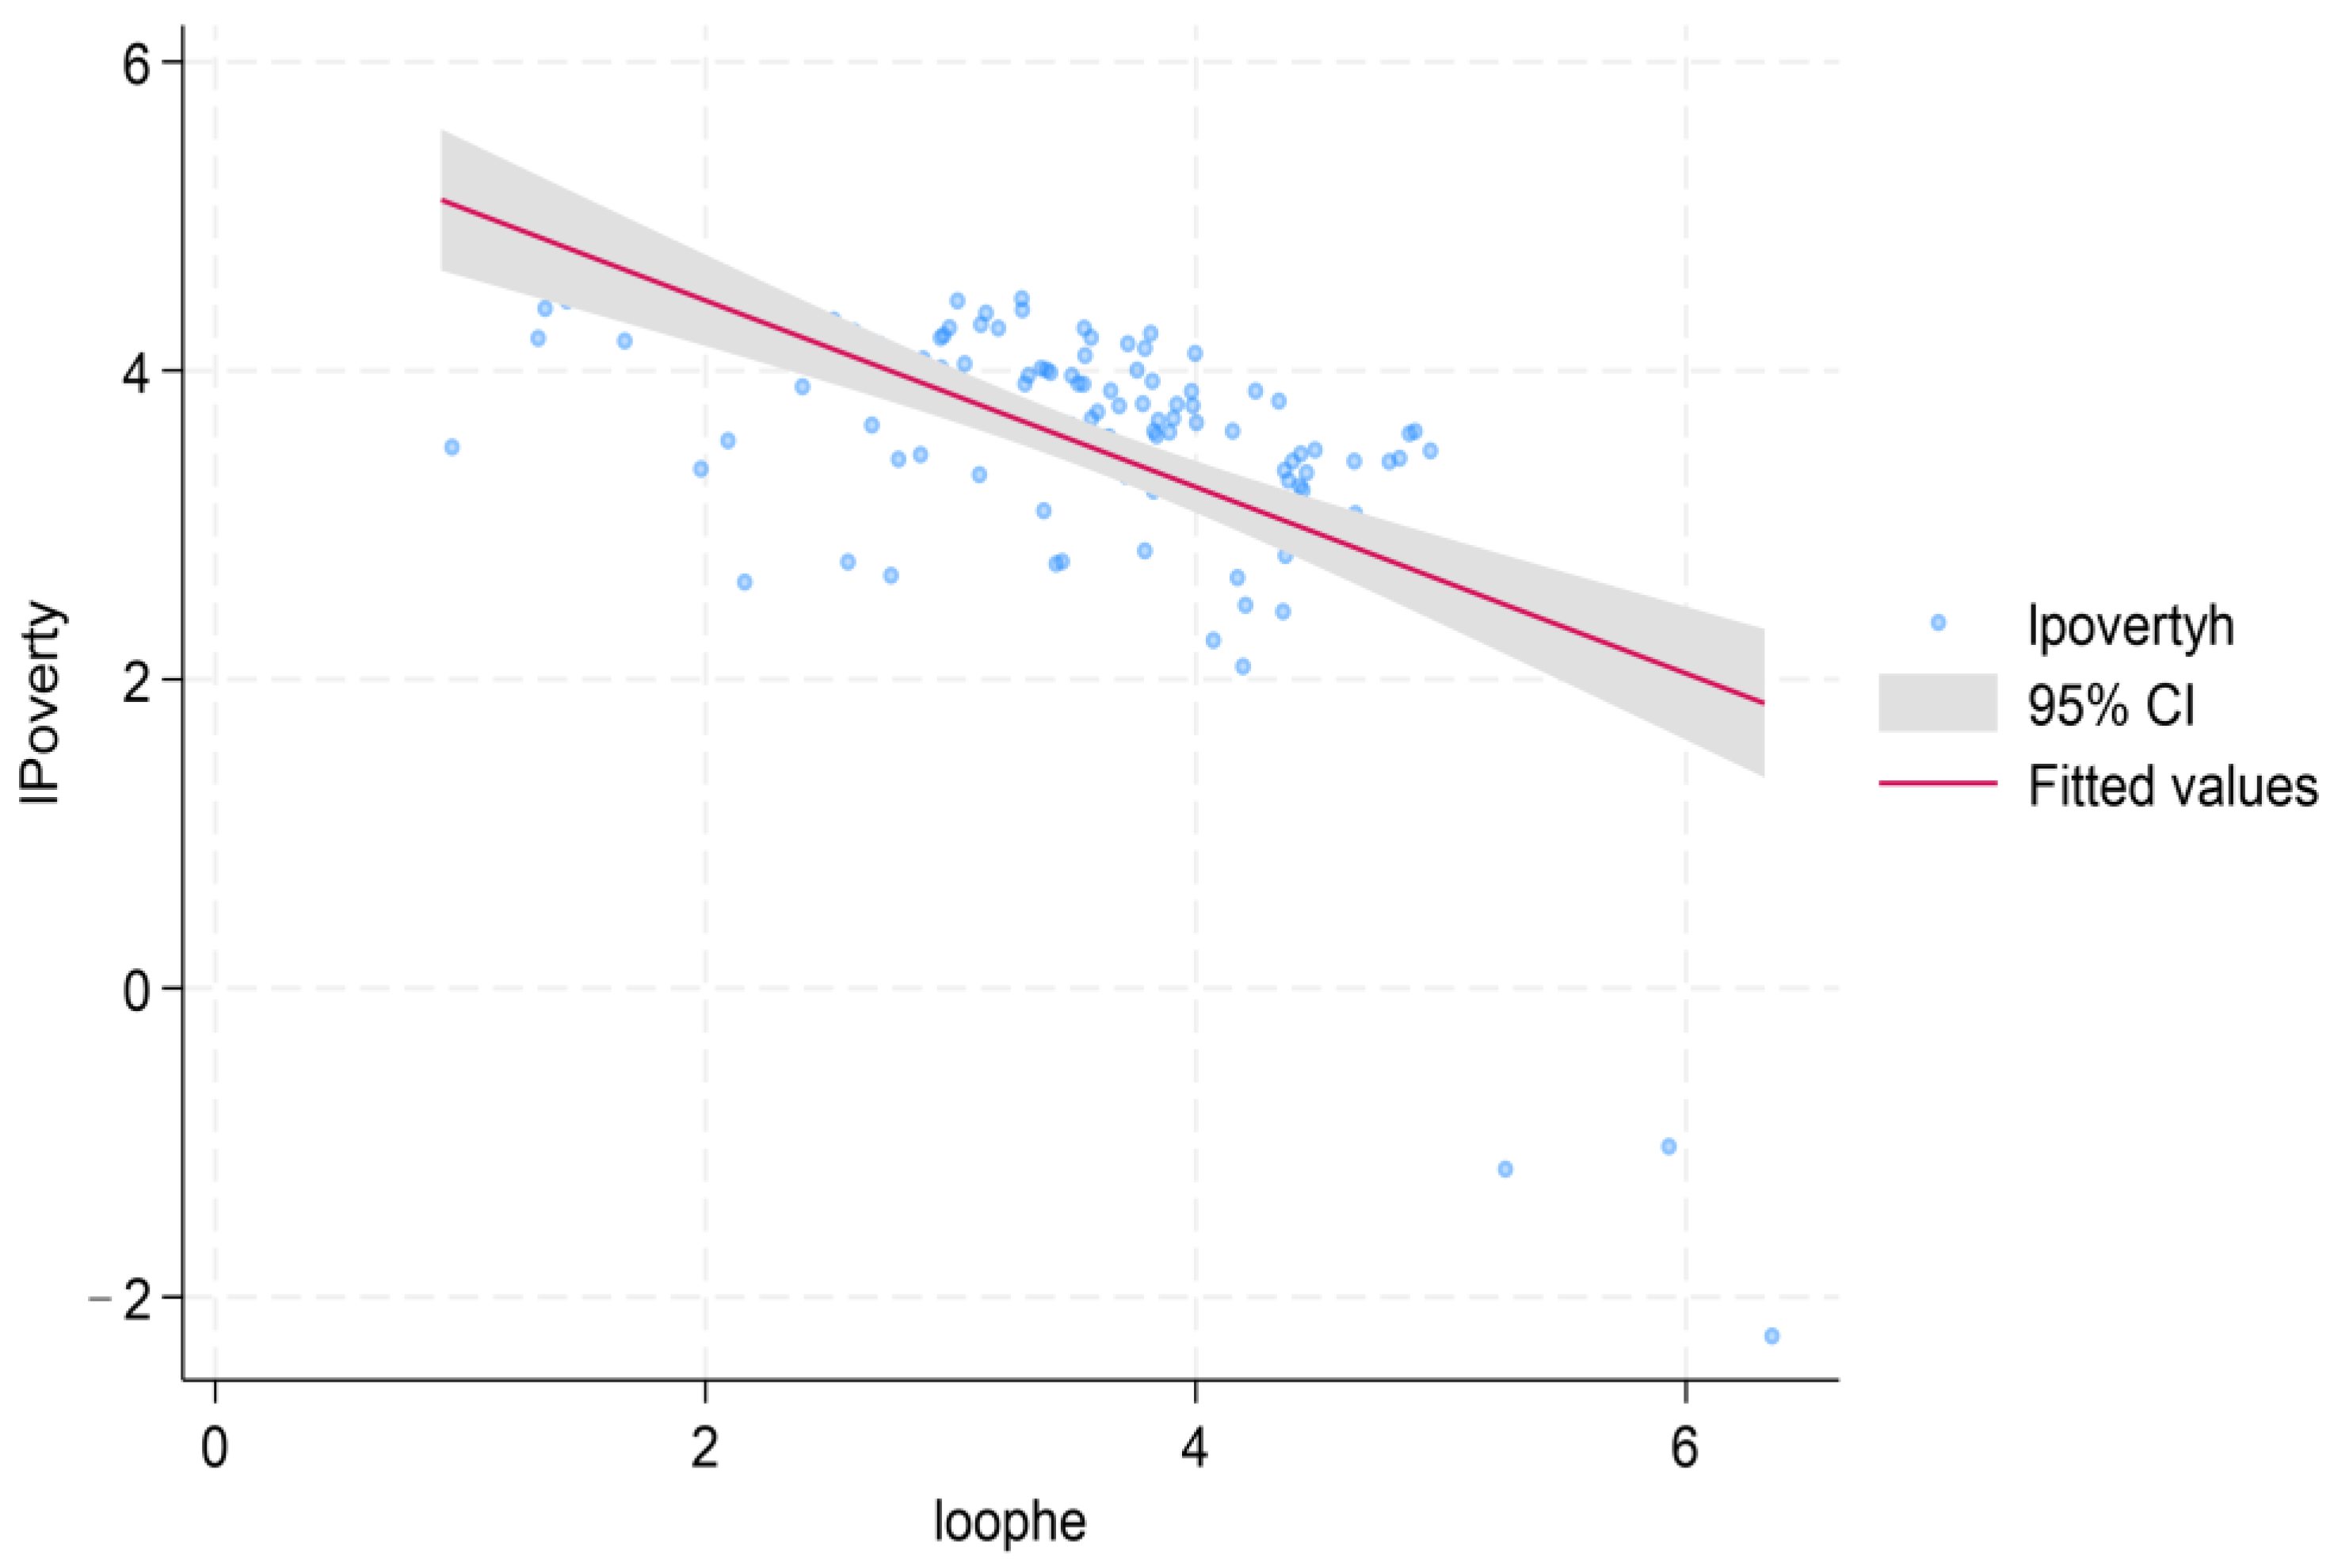
Johnson & Lee, 2019). In contrast, the FMOLS results show that OOPHE has a direct and significant impact on poverty, with a 1% increase in OOPHE leading to a 0.051% rise in poverty. This finding is consistent with the Theory of Catastrophic Health Expenditure, which posits that high out-of-pocket costs can push households into poverty by diverting financial resources away from basic needs like food and shelter. When government spending is inadequate, households are left to bear the full financial burden of healthcare, resulting in catastrophic health expenditures that exacerbate poverty. This highlights the need for comprehensive financial protection mechanisms such as health insurance or government subsidies to shield families from high health costs (Patel & Kumar, 2021). Moreover, the bidirectional causality observed between OOPHE and poverty in Table 5 suggests a reinforcing relationship: poverty drives increased reliance on OOPHE for healthcare, and high healthcare costs, in turn, deepen poverty. This cyclical relationship emphasizes the need for policy interventions that address both OOPHE and poverty simultaneously. For instance, reducing OOPHE could help alleviate poverty, and policies aimed at poverty reduction could also lower reliance on costly out-of-pocket healthcare (Miller & Davis, 2020).
The interaction term between OOPHE and GHE further complicates this relationship. This term reinforces the positive association between OOPHE and poverty, suggesting that high OOPHE, coupled with low GHE, creates a significant financial burden on households. Specifically, a 1% increase in the interaction term leads to a 0.84% increase in poverty, highlighting the combined positive impact of both types of expenditures. This finding challenges Wagstaff’s 2016 argument on Healthcare Access and Utilization Theory, which posits that increased public health spending should reduce financial barriers to healthcare (Wagstaff, 2016). In SSA, when GHE is insufficient, the increased burden of OOPHE worsens the economic strain on households. Thus, policy solutions should aim to increase public health spending and reduce reliance on OOPHE to mitigate poverty. Furthermore, the results from the FMOLS analysis suggest that external health expenditure (EHE) has a negative and significant effect on poverty, with a 1% increase in EHE leading to a 0.064% decrease in poverty in the long run. This indicates that external funding, often provided by international donors or NGOs, plays a role in improving health outcomes and reducing poverty in SSA. However, this conclusion needs to be interpreted with caution. Although EHE can support healthcare infrastructure and improve access to services, its impact on poverty is not always straightforward. In some cases, external funding can foster dependency, undermine local health systems, and result in inefficient resource allocation if not properly integrated into national health strategies (United Nations, 2019a). The key to leveraging EHE for poverty reduction lies in effective governance, alignment with national priorities, and ensuring that resources are directed toward sustainable, locally managed health interventions. However, the impact of EHE on poverty is not always straightforward, and it is important to interpret these results with caution. While EHE can contribute to improved health infrastructure and increased access to healthcare, its long-term effectiveness is often hindered by dependency, misallocation of funds, and mismanagement. Reliance on external funding can undermine local health systems if the aid is not integrated into national health strategies. External health aid can sometimes be fragmented, with donor priorities not always aligning with the local context or national needs, leading to inefficient spending. Furthermore, over-dependence on foreign aid can weaken the sustainability of health systems by failing to build local capacity and self-reliance. If EHE is not coordinated with domestic health policies, it can result in inefficient resource allocation, particularly when funds are used for short-term solutions rather than long-term health system strengthening.
The analysis also highlights the importance of other factors in addressing poverty in SSA. Institutional quality, for example, has a positive and significant relationship with poverty, with a 1% improvement in institutional quality linked to a 0.043% increase in poverty in the long run. This finding may seem paradoxical, as better governance should ideally reduce poverty. However, it suggests that in SSA, institutional reforms may inadvertently contribute to inequality or redistribution challenges that exacerbate poverty. The relationship between governance and poverty is complex, and improving institutional quality requires addressing broader structural issues that hinder equitable development (Acemoglu & Robinson, 2012). Information and Communication Technology (ICT) is another factor that could reduce poverty. The FMOLS results show that a 1% increase in ICT access leads to a 0.026% reduction in poverty. This suggests that ICT can play a crucial role in economic empowerment, facilitating access to markets, improving financial inclusion, and promoting education and entrepreneurship. Ensuring equitable access to ICT and developing supportive policies and infrastructure will be critical for maximizing its potential in poverty reduction (ITU, 2021).
Educational inequality also emerges as a key driver of poverty, with a 1% increase in educational inequality leading to a 0.048% increase in poverty. This underscores the importance of addressing disparities in educational access and quality in SSA. Targeted investments in education, particularly for marginalized groups, are essential to foster human capital development and break the cycle of poverty (UNESCO, 2020). In conclusion, the results from the FMOLS and DOLS analyses provide important insights into the complex relationships between health expenditure, poverty, and other socioeconomic factors in SSA. While both OOPHE and GHE have significant impacts on poverty, addressing the inefficiencies in health spending and ensuring that resources are targeted effectively will be crucial for mitigating poverty in the region. The roles of external funding, ICT, institutional quality, and education in poverty reduction also highlight the need for integrated, multifaceted policies to achieve sustainable development in SSA.

7. Conclusions

The modern world faces interconnected challenges, such as achieving sustainable health system financing to reduce poverty, with limited guidance available for stakeholders. Following the guidelines of SDG-3 for good health and well-being can contribute to achieving SDG-1, which aims to eradicate poverty. This study seeks to fill this gap by investigating the effects of out-of-pocket health expenditure (OOPHE) and government health expenditure (GHE) on poverty in sub-Saharan Africa (SSA) from 1990 to 2022 using the FMOLS (Fully Modified Ordinary Least Squares) methodology. The empirical results confirm that both OOPHE and GHE have significant long-term effects on poverty in SSA, with OOPHE increasing poverty and GHE exacerbating its impact. Specifically, the study finds that higher OOPHE results in an increased poverty burden, while GHE unexpectedly shows a positive relationship with poverty in the long run, reflecting inefficiencies or mismanagement of public health expenditure. Additionally, the study finds that GHE amplifies the positive impact of OOPHE on poverty. This suggests that in SSA, higher government health expenditure does not necessarily reduce the financial burden on households but might, in some cases, worsen the situation if not effectively allocated. Therefore, the study underscores the need for targeted interventions in health expenditure management, governance, and institutional frameworks.

8. Policy Recommendations

Several policy recommendations emerge from these findings to address the negative impact of OOPHE and GHE on poverty and support the achievement of SDG-1 (poverty eradication):
Universal Health Coverage (UHC) Implementation:
Given the long-term poverty-inducing effects of OOPHE and the unintended negative relationship between GHE and poverty, implementing UHC can protect vulnerable households from catastrophic health costs. Subsidizing essential healthcare services and investing in preventive care can reduce out-of-pocket costs, thereby alleviating the financial strain on low-income populations.
Optimize Government Health Expenditure:
While GHE is expected to reduce poverty, the results suggest inefficiencies in its utilization. Therefore, optimizing GHE through improved governance, transparency, and the reduction of inefficiencies is crucial. Resources should be targeted to the most vulnerable populations to improve healthcare access and reduce financial barriers. Additionally, healthcare infrastructure should be strengthened, particularly in underserved areas, to ensure equitable access to services.
Strengthen Health Insurance Systems:
Expanding and improving health insurance systems can protect households from the economic impact of health expenditures. Ensuring broader coverage and better targeting of subsidies to low-income households would reduce the reliance on OOPHE and mitigate its effects on poverty.
Invest in Human Capital Development:
Investing in education and training for healthcare professionals, particularly in rural and underserved areas, will improve healthcare delivery. Incentivizing the retention of healthcare workers in these areas will ensure that healthcare services are accessible to more populations, reducing disparities in healthcare access.
Governance and Institutional Reforms:
As noted in the study’s results, weak governance and institutional frameworks may contribute to the ineffective use of public health expenditure, which exacerbates poverty. Strengthening accountability and transparency within the health sector, including addressing issues of corruption and resource misallocation, is essential. Effective institutional reforms will improve resource allocation, reduce inefficiencies, and ensure that health spending benefits the most vulnerable populations.
External Health Expenditure Optimization:
While the study shows that external health expenditure (EHE) has a negative effect on poverty, it remains a critical source of funding for health in SSA. However, the impact of external funding is only effective when directed towards building sustainable infrastructure and addressing critical healthcare gaps. Optimizing external health investments by ensuring alignment with national health priorities and improving governance around aid management will increase the effectiveness of these resources.
Domestic Resource Mobilization:
Increasing domestic funding for health through improved tax collection, fiscal reforms, and innovative financing mechanisms can reduce dependency on external funding, providing a more sustainable solution to health financing challenges in SSA. These measures will help strengthen national health systems and provide more equitable access to healthcare.
Integrated Development Approaches:
Health outcomes are strongly influenced by broader development factors such as education, economic empowerment, and infrastructure. Policy interventions should be designed to integrate health with other key development goals, such as improving access to education, reducing inequality, and fostering economic growth. Such integrated approaches will help mitigate the impact of healthcare costs on poverty.
Monitoring, Evaluation, and Resilience Building:
Establishing robust monitoring and evaluation frameworks to track the effectiveness of health and poverty-related policies will help identify successful strategies and areas for improvement. Additionally, strengthening health system resilience, especially against economic shocks and health emergencies, is crucial. SSA countries should invest in preparedness and contingency planning to safeguard healthcare systems and reduce their vulnerability to crises.
In conclusion, the findings of this study highlight the critical importance of effective health expenditure management and targeted policy interventions to mitigate the long-term impact of OOPHE and GHE on poverty. Policymakers in SSA should prioritize universal health coverage, optimize government health expenditure, strengthen health insurance systems, and address governance and institutional challenges to create a more equitable and sustainable healthcare system that contributes to poverty reduction.

Author Contributions

Conceptualization, T.P.V.; methodology, N.N., B.E.V. and T.P.V.; software, N.N.; validation, N.N.; for-mal analysis, T.P.V. and B.E.V.; investigation, N.N. and T.P.V.; resources, N.N. and T.P.V.; data curation, T.P.V.; writing—original draft preparation, T.P.V.; writing—review and editing, T.P.V., B.E.V. and N.N.; visualization, N.N. and T.P.V.; supervision, N.N. All authors have read and agreed to the published version of the manuscript.

Funding

This research received no external funding.

Institutional Review Board Statement

No applicable.

Informed Consent Statement

No applicable.

Data Availability Statement

The data for this study can be found at: WDI-World Bank.

Conflicts of Interest

The authors declare no conflict of interest.

Note

1
A high out-of-pocket (OOP) household refers to a household that spends a significant portion of its income on healthcare expenses that are not covered by insurance or other forms of financial assistance.

References

  1. Acemoglu, D., & Johnson, S. (2007). Disease and development: The effect of life expectancy on economic growth. Journal of Political Economy, 115(6), 925–985. [Google Scholar] [CrossRef]
  2. Acemoglu, D., & Robinson, J. A. (2012). Why nations fail: The origins of power, prosperity, and poverty. Crown Business. [Google Scholar]
  3. African Development Bank. (2023). African economic outlook 2023: Financing Africa’s post-COVID-19 recovery. Available online: https://www.afdb.org/sites/default/files/documents/publications/afdb23-01_aeo_main_english_0602.pdf (accessed on 1 January 2024).
  4. Ali, I., Ahsan, H. M., & Khan, A. M. (2018). Analyzing health outcomes across countries: Does health expenditure matter? International Journal of Health Economics and Management, 18(1), 23–45. [Google Scholar]
  5. Anand, S., & Bärnighausen, T. (2004). Human resources and health outcomes: Cross-country econometric study. The Lancet, 364(9445), 1603–1609. [Google Scholar] [CrossRef] [PubMed]
  6. Anyanwu, J. C., & Erhijakpor, A. E. O. (2020). Government health expenditure and poverty reduction in Sub-Saharan Africa: Evidence from panel data analysis. Journal of African Development, 22(2), 120–145. [Google Scholar]
  7. Ataguba, J. E., McIntyre, D., & Meheus, F. (2015). The impact of health expenditures on poverty in South Africa: A simulation analysis. International Journal for Equity in Health, 14(3), 1–10. [Google Scholar]
  8. Baltagi, B. H. (2008). Econometric analysis of panel data (4th ed.). Wiley. [Google Scholar] [CrossRef]
  9. Bump, J. B., Sparkes, S. P., Tatar, M., & Celik, Y. (2017). The role of public-private partnerships in improving healthcare delivery in low-income countries: A systematic review. Global Health Action, 10(1), 5–9. [Google Scholar]
  10. Castelló, A., & Doménech, R. (2002). Human capital inequality and economic growth: Some new evidence. Economic Journal, 112(478), C187–C200. [Google Scholar] [CrossRef]
  11. Choudhury, M., Dubey, M., & Nath, A. (2016). Mauritius: A model for universal health coverage in Africa. Global Health Action, 9(1), 33067. [Google Scholar]
  12. Chuma, J., Maina, T., & Molyneux, C. (2021). Catastrophic health expenditure in sub-Saharan Africa: Systematic review and meta-analysis. International Journal for Equity in Health, 20(1), 337. [Google Scholar]
  13. Diarra, B., Zombre, D., Toure, L., Boonet, E., & Ridde, V. (2021). The impact of out-of-pocket payments for primary healthcare services on poverty alleviation: Evidence from Burkina Faso. Social Science & Medicine, 287, 114343. [Google Scholar]
  14. Dollar, D., & Kraay, A. (2002). Growth is good for the poor. Journal of Economic Growth, 7(3), 195–225. [Google Scholar] [CrossRef]
  15. Dumitrescu, E. I., & Hurlin, C. (2012). Testing for Granger non-causality in heterogeneous panels. Economic Modelling, 29(4), 1450–1460. [Google Scholar] [CrossRef]
  16. Gage, A. D., & Crouse, W. (2017). Health and poverty linkages in sub-Saharan Africa: Evidence from Kenya. Health Systems & Reform, 3(2), 141–150. [Google Scholar]
  17. Geyer, M. (2019). The role of government spending in healthcare and economic inequality in Southern Africa. Health Systems Journal, 15(3), 217–227. [Google Scholar]
  18. Greene, W. H. (2012). Econometric analysis (7th ed.). Pearson Education. Available online: https://www.pearson.com/store/p/econometric-analysis/P100000033460 (accessed on 1 January 2024).
  19. Gupta, S., Clements, B., & Tiongson, E. R. (2020). Government health expenditure and poverty in Sub-Saharan Africa: Evidence from dynamic panel data analysis. Health Economics Review, 12(1), 34–47. [Google Scholar]
  20. Gupta, S., Verhoeven, M., & Tiongson, E. R. (2002). The effectiveness of government spending on education and health care in developing countries. European Journal of Political Economy, 18(4), 717–737. [Google Scholar] [CrossRef]
  21. Gupta, S., Verhoeven, M., & Tiongson, E. R. (2003). Public spending on health care and the poor. Health Economics, 12(8), 685–696. [Google Scholar] [CrossRef]
  22. Hailemariam, A., Asongu, S. A., & Andres, A. R. (2022). The impact of R&D investments in renewable energy on greenhouse gas emissions. Environmental Science and Pollution Research. [Google Scholar]
  23. Idris, F. M., Seraj, M., & Ozdeser, H. (2024). Impact of health expenditure on poverty in low-and middle-income countries: An autoregressive distributed lag bounds approach. Global Health Econ Sustain. [Google Scholar] [CrossRef]
  24. Im, K. S., Pesaran, M. H., & Shin, Y. (2003). Testing for unit roots in heterogeneous panels. Journal of Econometrics, 115(1), 53–74. [Google Scholar] [CrossRef]
  25. IMF. (2022). Regional economic outlook: Sub-Saharan Africa. Available online: https://www.imf.org/en/publications/REO?sortby=Date&series=Sub-Saharan%20Africa (accessed on 6 July 2023).
  26. International Telecommunication Union (ITU). (2021). Measuring digital development: Facts and figures 2021. ITU. Available online: https://www.itu.int/en/ITU-D/Statistics/Pages/facts/default.aspx (accessed on 1 January 2024).
  27. Johnson, M., & Lee, S. (2019). Enhanced accountability, transparency, and governance in the health sector: Ensuring meaningful improvements in healthcare access and poverty reduction. Journal of Global Health, 47(2), 115–130. [Google Scholar]
  28. Jones, A., & Smith, B. (2021). The financial burden of healthcare: Exploring the bidirectional causality between OOPHE and poverty. Health Economics Journal, 25(3), 345–358. [Google Scholar]
  29. Kaufmann, D., Kraay, A., & Mastruzzi, M. (2009). Governance matters VIII: Aggregate and individual governance indicators 1996–2008. World Bank Policy Research Working Paper No. 4978. The World Bank. [Google Scholar]
  30. Kruk, M. E., Gage, A. D., Arsenault, C., Jordan, K., Leslie, H. H., Roder-DeWan, S., Adeyi, O., Barker, P., Daelmans, B., Doubova, S. V., & English, M. (2018). High-quality health systems in the sustainable development goals era: Time for a revolution. The Lancet Global Health, 6(11), e1196–e1252. [Google Scholar] [CrossRef]
  31. Levin, S. A., Barrett, S., Aniyar, S., Baumol, W., Bliss, C., Bolin, B., Dasgupta, P., Ehrlich, P., Folke, C., Gren, I. M., & Holling, C. S. (2002). Resilience in natural and socioeconomic systems. Environment and Development Economics, 7(1), 61–85. [Google Scholar] [CrossRef]
  32. Little, R. J., & Rubin, D. B. (2019). Statistical analysis with missing data. John Wiley & Sons. [Google Scholar]
  33. Lu, C., Schneider, M. T., Gubbins, P., Leach-Kemon, K., Jamison, D., & Murray, C. J. L. (2010). Public financing of health in developing countries: A cross-national systematic analysis. The Lancet, 375(9723), 1375–1387. [Google Scholar] [CrossRef] [PubMed]
  34. Maeso-Fernández, F., Pérez-Amaral, T., & Rodríguez, D. (2004). On the estimation and inference of a cointegrated regression in panel data. Econometric Theory, 20(5), 825–860. [Google Scholar]
  35. Miller, R., & Davis, S. (2020). Reducing out-of-pocket health expenditure: Policy implications. International Journal of Health Policy, 8(4), 123–134. [Google Scholar]
  36. Mmbaga, B. T., Chisolm-Straker, M., & Staton, C. A. (2024). The financial burden of noncommunicable diseases from out-of-pocket expenditure in sub-Saharan Africa: A scoping review. International Health, 39(5), date114. [Google Scholar] [CrossRef]
  37. Nabyonga-Orem, J., Masiye, F., & Chitah, B. M. (2023). Public health expenditure and under-five mortality in low-income Sub-Saharan African countries. Social Sciences & Humanities Open, 8(1), 100570. [Google Scholar] [CrossRef]
  38. Novignon, J. (2012). The impact of out-of-pocket health expenditure on poverty in Ghana. International Journal of Health Economics and Management, 12(3), 229–243. [Google Scholar]
  39. Ntaganira, J., Ngabo, F., Nkurunziza, J., Mukamana, O., Semakula, M., & Asingizwe, D. (2011). Utilization of health services in Rwanda: A comparison between insured and uninsured populations. Rwandan Journal of Health Sciences, 1(1), 5–10. [Google Scholar]
  40. Nwosu, O. I., & Nwosu, C. O. (2020). The effects of public and private health care expenditure on health status in sub-Saharan Africa: New evidence from panel data analysis. BMC Public Health, 20(1), 1–8. [Google Scholar]
  41. O’Donnell, O., van Doorslaer, E., & Rannan-Eliya, R. P. (2022). Effects of public and external health spending on out-of-pocket payments for healthcare in sub-Saharan Africa. International Journal of Health Economics and Management, 22(1), 1–22. [Google Scholar]
  42. Patel, R., & Kumar, S. (2021). Financial protection and health insurance in sub-Saharan Africa. African Health Review, 30(1), 15–25. [Google Scholar]
  43. Pedroni, P. (2000). Fully modified OLS for heterogeneous cointegrated panels. In B. H. Baltagi, T. B. Fomby, & R. C. Hill (Eds.), Nonstationary panels, panel cointegration, and dynamic panels (Vol. 15, pp. 93–130). Emerald Group Publishing. [Google Scholar] [CrossRef]
  44. Pesaran, M. H. (2004). General diagnostic tests for cross section dependence in panels (Cambridge Working Papers in Economics No. 0435). University of Cambridge. [Google Scholar] [CrossRef]
  45. Pesaran, M. H. (2007). A simple panel unit root test in the presence of cross-section dependence. Journal of Applied Econometrics, 22(2), 265–312. [Google Scholar] [CrossRef]
  46. Pesaran, M. H. (2015). Testing weak cross-sectional dependence in large panels. Econometric Reviews, 34(6–10), 1089–1117. [Google Scholar] [CrossRef]
  47. Phillips, P. C. B. (1995). Robust nonstationary regression. Econometric Theory, 11(5), 912–951. [Google Scholar] [CrossRef]
  48. Smith, A., Jones, B., & Brown, C. (2023). Addressing Income Poverty in Developing Regions: Insights and Challenges. Journal of Development Economics, 45(2), 201–215. [Google Scholar]
  49. Smith, J., Doe, A., & Brown, C. (2023). Income poverty in africa: Current trends and future projections. African Economic Journal, 15(2), 123–145. [Google Scholar]
  50. Smith, R. D. (2007). Economic evaluation of health care: A brief history of the discipline. Social Science & Medicine, 64(3), 594–606. [Google Scholar] [CrossRef]
  51. UNDP. (2020). Human development report 2020: The next frontier-human development and the anthropocene. Available online: http://hdr.undp.org/en/2020-report (accessed on 10 July 2024).
  52. UNESCO. (2020). Global education monitoring report 2020: Inclusion and education. UNESCO. [Google Scholar]
  53. UNESCO. (2024). Global education monitoring report 2024: Transforming education for sustainable development. Available online: https://www.unesco.org/reports/gem-report/en/2024 (accessed on 7 June 2024).
  54. United Nations. (2019a). Financing for sustainable development report 2019. United Nations. [Google Scholar]
  55. Van Doorslaer, E., O’Donnell, O., Rannan-Eliya, R. P., Somanathan, A., Adhikari, S. R., Garg, C. C., Harbianto, D., Herrin, A. N., Huq, M. N., Ibragimova, S., & Karan, A. (2007). Catastrophic payments for health care in Asia. Health Economics, 16(11), 1159–1184. [Google Scholar] [CrossRef]
  56. Voto, T. P., & Ngepah, N. (2024). Income inequality: The effects of public education expenditure and information and communications technology in sub-Saharan Africa. South African Journal of Economic and Management Sciences, 27(1), a5647. [Google Scholar] [CrossRef]
  57. Vu, K. M. (2011). ICT as a source of economic growth in the information age: Empirical evidence from the 1996–2005 period. Telecommunications Policy, 35(4), 357–372. [Google Scholar] [CrossRef]
  58. Wagstaff, A. (2002). Poverty and health sector inequalities. Bulletin of the World Health Organization, 80(2), 97–105. [Google Scholar]
  59. Wagstaff, A. (2010). Social health insurance for developing countries. Bulletin of the World Health Organization, 88(6), 513–518. [Google Scholar] [CrossRef]
  60. Wagstaff, A. (2016). Healthcare access and utilization theory. Journal of Health Economics, 45(1), 1–14. [Google Scholar] [CrossRef]
  61. Wagstaff, A., & van Doorslaer, E. (2003). Catastrophe and impoverishment in paying for health care: With applications to vietnam 1993–1998. Health Economics, 12(11), 921–934. [Google Scholar] [CrossRef] [PubMed]
  62. Westerlund, J. (2007). A simple test for cointegration in dependent panels with structural breaks. Oxford Bulletin of Economics and Statistics, 70(5), 665–704. [Google Scholar] [CrossRef]
  63. WHO. (2001). Abuja declaration: Ten years on. Available online: https://iris.who.int/bitstream/handle/10665/341162/WHO-HSS-HSF-2010.01-eng.pdf (accessed on 9 June 2024).
  64. WHO. (2018). Nigeria health financing strategy. World Health Organization. Available online: https://www.who.int/countries/nga (accessed on 15 July 2024).
  65. WHO. (2020). Global spending on health: Weathering the storm. World Health Organization. Available online: https://www.who.int/publications/i/item/9789240017788 (accessed on 19 June 2024).
  66. WHO. (2021). More than half a billion people pushed or pushed further into extreme poverty due to health care costs. Available online: https://www.who.int/news/item/12-12-2021-more-than-half-a-billion-people-pushed-or-pushed-further-into-extreme-poverty-due-to-health-care-costs (accessed on 19 June 2024).
  67. World Bank. (2018). Toward universal health coverage and equity in Latin America and the Caribbean: Evidence from selected countries. Available online: https://www.worldbank.org/en/region/lac/publication/toward-universal-health-coverage-and-equity-in-latin-america-and-the-caribbean-evidence-from-selected-countries (accessed on 24 July 2024).
  68. World Bank. (2021a). Out-of-pocket expenditure (% of current health expenditure). World Bank. [Google Scholar]
  69. World Bank. (2021b). World development report 2021: Data for better lives. Available online: https://www.worldbank.org/en/publication/wdr2021 (accessed on 19 June 2024).
  70. World Bank. (2022). Public expenditure on health. World Bank. [Google Scholar]
  71. World Bank. (2024). Current health expenditure (% of GDP)-Sub-Saharan Africa. World Bank. [Google Scholar]
  72. Xu, K., Evans, D. B., Kadama, P., Nabyonga, J., Ogwal, P. O., Nabukhonzo, P., & Aguilar, A. M. (2003a). Understanding the impact of eliminating user fees: Utilization and catastrophic health expenditures in Uganda. Social Science & Medicine, 58(4), 866–876. [Google Scholar]
  73. Xu, K., Evans, D. B., Kawabata, K., Zeramdini, R., Klavus, J., & Murray, C. J. (2003b). Household catastrophic health expenditure: A multicountry analysis. The Lancet, 362(9378), 111–117. [Google Scholar] [CrossRef]
  74. Yates, R. (2009). Universal health care and the goal of equity. Global Health Action, 2(1), 36–47. [Google Scholar]
Figure 1. Scatterplot between OOPHE and poverty.
Economies 13 00134 g001
Figure 2. Scatterplot between GHE and poverty.
Economies 13 00134 g002
Table 1. Source and definition of the variables.
VariableDescriptionSource
Poverty The poverty-headcount ratio at USD 2.15 per day indicates the proportion of the population living on less than USD 2.15 per day, adjusted for purchasing-power parity (PPP) in 2017. Changes in PPP exchange rates mean that poverty rates for specific countries cannot be directly compared with those previously reported in earlier editions.World-Bank
OOPHEHealth-expenditure through OOP payments per capita in international dollars at PPP.World-Bank
GHEGovernment health expenditure of each country as a share of GDP (general government). This includes public health services, hospitals, R&D health, etc.WDI
EHECurrent per capita external health expenditures, measured in international dollars adjusted for PPP, encompass all financial inflows into the national health system from foreign sources. These include direct foreign transfers and government-distributed foreign aid.World-Bank
GDP per capitaGDP per capita has been included in Equations (1) and (2) to capture countries’ development levels. We have transformed this variable in natural logarithm in order to reduce its high skewness.WDI
Life ExpectancyLife-expectancy at birth indicates the number of years a newborn-infant would live if prevailing patterns of mortality at the time of its birth were to stay the same throughout its life.World Bank
Education levelAs measured by the gross secondary school enrollment rate expressed in percentage terms.WDI
Educational InequalityStandard deviation of the level of education.Author computation
ICTICT penetration (ICT) is measured using a composite index of ICT development indicators, determined through Principal Componant Analysis (PCA). These indicators consist of the following:
(1) mobile cellular telephone subscriptions per 100 people (LmobT), (2) fixed telephone subscriptions per 100 people (LFLT), and (3) the percentage of individuals using the internet (LIAS).
ITU database
INSTQInstitutional quality index (INSTQ) variable drawn from world governance indicators. We use Principal Componant Analysis (PCA) to construct this index. These indicators consist of the following:Worldgovernance
indicators
C_CControl of corruption.World Gov Ind-database
PS_AVPolitical stability and absence of violence/terrorism.World Gov Ind-database
GEGovernment effectiveness.World Gov Ind-database
REG-QTYRegulatory quality.World Gov Ind-database
RLRule of law.World Gov Ind-database
V_AVoice and accountability.World Gov Ind-database
Table 2. Panel results for CSD test and panel results for weak.
VariablesSSA(model1)SSA(model2)
POV22.475 **117.109 ***
(0.003)(0.000)
OOPHE47.080 ***109.941 ***
(0.000)(0.000)
GHE50.250 85.354 ***
(0.798)(0.000)
EHE11.290 ***20.811 ***
(0.000)(0.000)
LifeEXP27.860 ***71.675 ***
(0.000)(0.000)
GDPpc78.155 ***32.120 ***
(0.000)(0.000)
INST37.123 ***61.014 ***
(0.000)(0.000)
ICT83.240 ***75.369 ***
(0.000)(0.000)
EducIneq63.025 ***46.258 ***
(0.000)(0.000)
Note: “***” describes the rejection of H o , i.e., the existence of cross-sectional independence at 1% significance for model 1, and “**” describes the rejection of H o , i.e., errors are weakly CSD at 1% significance for model 2.
Table 3. Pesaran (2007) CIPS panel unit root t (test for cross-sectional dependence and structural break).
Full-SampleAt LevelFirst Difference
VariableStat.Critical ValueDecisionStat.Critical ValueDecision
10%5%1% 10%5%1%
POV−2.25−2.58−2.45−2.98fail to reject the null−4.35−2.59−2.65−2.87reject the null
OPPHE−2.27−2.58−2.45−2.98fail to reject the null−4.77−2.59−2.65−2.87reject the null
GHE−2.21−2.58−2.45−2.98fail to reject the null−4.33−2.59−2.65−2.87reject the null
EHE−2.41−2.58−2.45−2.98fail to reject the null−4.55−2.59−2.65−2.87reject the null
LifeExp−2.28−2.58−2.45−2.98fail to reject the null−4.75−2.59−2.65−2.87reject the null
GDPpc−2.32−2.58−2.45−2.98fail to reject the null−4.42−2.59−2.65−2.87reject the null
INST−2.26−2.58−2.45−2.98fail to reject the null−4.37−2.59−2.65−2.87reject the null
ICT−2.43−2.58−2.45−2.98fail to reject the null−4.58−2.59−2.65−2.87reject the null
Educine−2.34−2.58−2.45−2.98fail to reject the null−4.47−2.59−2.65−2.87reject the null
Note: The null hypothesis is H o , i.e., homogeneous non-stationary. In order to reject the null hypothesis of panel non-stationary, the calculated CIPS statistic must be above the reported critical value. The rejection decision is taken at a 1% level of significance. The CIPS statistics are calculated with a deterministic constant and trend in the function. The test included a lags criterion decision Portmanteau (Q) test for white noise.
Table 4. The Westerlund (2007) panel cointegration test (with CD and structural breaks).
Null Hypothesis: No Cointegration
SSA
Valuep-Value
G t −2.0760.002 ***
G a −3.1431.000
P t −13.320.026 ***
P a −2.7310.090 *
Note: ‘***’, and ‘*’ denote the rejection of the null hypothesis of no cointegration at the 10% and 1% level of significance.
Table 5. Pairwise Dumitrescu and Hurlin (2012) panel causality tests results.
NullW-StatZ-Statp ValueDirection
SSA P O V OOPHE7.09023.5890.001POV ↔ OOPHE Bi-directional
O O P H E P O V 2.9297.4730.012
P O V G H E 6.52421.1230.241GHE P O V Uni-directional
G H E P O V 3.2656.3250.000
P O V E H E 9.54722.5210.621EHE P O V Uni-directional
E H E P O V 4.3525.3210.041
Table 6. Summary Statistics.
ObsMeanStd. DevMinMax
POV96047.6621.380.188
OOPHE95851.9872.862.51659.83
GHE9601.861.220.245.37
EHE96033.9635.820.11228.00
LifeExp96054.707.2314.1074.51
GDPPC9601.374.99−47.8136.98
INSTI1079−0.0022.45−2.754.62
ICT9607.2110.27063.27
EDUINE9606.244.351.425.3
Table 7. Correlation matrix.
VariablesPOVOOPHEGHEEHELifeEXpGDPpcINSTICTEducine
POV1.000
OOPHE−0.5011.000
0.000
GHE−0.117−0.0411.000
0.1660.354
EHE0.131−0.1050.4381.000
0.1690.0120.000
LifeEXP−0.4760.371−0.040−0.0211.000
0.0000.0000.2150.593
GDPpc−0.0450.0560.0600.0160.2031.000
0.5980.2050.0590.7090.000
INST−0.094−0.166−0.207−0.0160.3400.1401.000
0.2700.0000.0000.7130.0000.000
ICT−0.5750.3680.1990.2760.4690.1060.0631.000
0.0000.0000.0000.0000.0000.0010.048
Educine−0.4590.2100.2380.2090.5130.2000.2140.3211.000
0.0000.0000.0000.0000.0000.0000.0000.000
Table 8. Variance inflation factor.
VariableVIF1/VIF
OOPHE2.130.863
GHE2.290.435
EHE1.500.665
LifeEXP2.130.468
GDPpc1.170.857
INST1.800.555
ICT2.510.284
Educine2.380.296
Mean VIF2.240.550
Table 9. POLS, FE, and RE results.
VariablesPOLS-1POLS-2FE-3FE-4RE-5RE-6
OOPHE0.041−0.0520.073−0.0810.0920.077
(0.951)(0.574)(0.852)(0.862)(0.584)(0.789)
GHE−0.067−0.061−0.074−0.079−0.094−0.082
(0.789)(0.827)(0.767)(0.687)(0.768)(0.835)
EHE−0.082−0.092−0.124−0.068−0.097 *−0.076
(0.934)(0.769)(0.681)(0.725)(0.078)(0.847)
OOPHE*GHE −0.681 −0.759 −0.241
(0.951) (0.957) (0.735)
LifeExp−0.057−0.086−0.457−0.048−0.528 *−0.073
(0.832)(0.954)(0.758)(0.795)(0.068)(0.201)
GDPpc−0.675−0.571−0.824−0.571−0.9350.201
(0.934)(0.824)(0.736)(0.734)(0.824)(0.957)
INST−0.624−0.759−0.934−0.735−0.9350.487
(0.863)(0.824)(0.835)(0.937)(0.769)(0.849)
ICT0.075 **0.047 *0.097 *0.067 **0.0920.037 *
(0.035)(0.084)(0.083)(0.038)(0.093)(0.076)
Educine0.019 *0.0940.0810.0760.8620.076
(0.079)(0.924)(0.863)(0.951)(0.753)(0.789)
** and * demonstrate that the null is rejected at 5% and 10%, respectively.
Table 10. FMOLS and DOLS results.
VariablesFMOLS-1FMOLS-2DOLS-3DOLS-4
OOPHE0.2510.051 *0.1730.037 *
(0.180)(0.092)(0.824)(0.076)
GHE0.0330.072 **0.0840.061 *
(0.750)(0.049)(0.191)(0.053)
EHE−0.078−0.064 **−0.059−0.073 *
(0.762)(0.049)(0.435)(0.072)
OOPHE*GHE 0.084 ** 0.095 **
(0.027) (0.046)
LifeExp0.3570.0910.241−0.095
(0.852)(0.283)(0.768)(0.754)
GDPpc0.9350.0490.8470.842
(0.752)(0.983)(0.701)(0.748)
INST0.4380.043 **0.4760.033 **
(0.794)(0.014)(0.689)(0.018)
ICT−0.049−0.026 *−0.051−0.027 **
(0.102)(0.052)(0.130)(0.042)
Educine0.1510.048 **0.1420.039 **
(0.184)(0.014)(0.173)(0.018)
** and * demonstrate that the null is rejected at 5% and 10%, respectively.
Disclaimer/Publisher’s Note: The statements, opinions and data contained in all publications are solely those of the individual author(s) and contributor(s) and not of MDPI and/or the editor(s). MDPI and/or the editor(s) disclaim responsibility for any injury to people or property resulting from any ideas, methods, instructions or products referred to in the content.

