Article

The Labour Market in Kazakhstan Under Conditions of Active Transformation of Their Economy

by
Ansagan Beisembina
1,
George Abuselidze
2,3,*,
Begzat Nurmaganbetova
4,*,
Gulnur Kabakova
5,
Aigul Makenova
4 and
Ainash Nurgaliyeva
1
1
Department of Economics, Toraighyrov University, Lomov, 64, Pavlodar 140008, Kazakhstan
2
Department of Finance, Banking and Insurance, Batumi Shota Rustaveli State University, Ninoshvili, 35, Batumi 6010, Georgia
3
School of Business and Administrative Studies, The University of Georgia, Kostava, 77a, Tbilisi 0171, Georgia
4
Department of Finance, Accounting and Auditing, Korkut Ata Kyzylorda University, A. Herzen, 26, Kyzylorda 120012, Kazakhstan
5
Department of Economics and Management, Korkut Ata Kyzylorda University, A. Herzen, 26, Kyzylorda 120012, Kazakhstan
*
Authors to whom correspondence should be addressed.
Economies 2025, 13(5), 131; https://doi.org/10.3390/economies13050131
Submission received: 28 February 2025 / Revised: 27 April 2025 / Accepted: 6 May 2025 / Published: 13 May 2025

Abstract

:
Continuous transformations, which have been observed more and more in recent years, require an increase in the effectiveness of measures in the state regulation of the labour market, which is possible only with a clear understanding and realistic assessment of its condition and existing trends of changes. For this purpose, guided by the data of the Bureau of National Statistics of the Agency for Strategic Planning and Reforms of the Republic of Kazakhstan, the country’s labour market was monitored, and the key factors that played a significant role in its formation were identified. Using these factors as a basis, vector autoregression (VAR) models were built to analyse dynamic relationships between economic variables. The choice of stationary variables ensured the adequacy of the model, which was confirmed by diagnostic tests such as the ADF test, Jarque–Bera test, and Ljung–Box test. Impulse response functions (IRFs) were used to assess the effect of shocks on each variable and other system variables. All results were visualised as graphs illustrating the dynamics of the impact over ten times. The modelling results showed that the changes are interrelated: shocks to youth unemployment (YUR) have the most significant impact on the total unemployment (UR) and the unemployed population (U), while outward migration (NM) has a short-run effect mainly on the economically active population (EA). The model confirmed that the labour market is indifferent to changes in youth unemployment, a key indicator for forming an effective employment policy. The study’s practical significance lies in its potential to inform the government, international organisations, and business communities about the state of the labour market and the necessary vectors of social policy. This will ensure economic growth and improve citizens’ quality of life in light of the changing nature of the labour market.

1. Introduction

In the context of globalisation, technological transformations, and changes in the world economy, employment issues are particularly relevant for developing countries, such as the Republic of Kazakhstan (RK). Employment regulation in Kazakhstan is important for several reasons. Firstly, effective employment management is the most important mechanism for stimulating economic growth and improving the population’s living standards. Second, high unemployment is a factor of social tension and public welfare deterioration, emphasising the importance of measures to reduce unemployment (Smagulova & Barzhaksyyeva, 2024). Thirdly, spontaneous interregional and intersectional labour migration, widespread informal employment, and informal wages exacerbate social tensions. These aspects require a comprehensive approach to labour market regulation since they are nothing but peculiar mechanisms of adaptation of the main subjects of the labour market (employees and employers) to the new conditions of the socio-economic environment (Ostapchuk et al., 2021).
However, the adaptive capacity of the labour market is far from unlimited. It has been noted that the restructuring of the economy of Kazakhstan, in general, and the labour market, in particular, is much slower than in other countries of the former Soviet Union. The change in the number and structure of jobs does not fully meet the requirements of modern reality (Ostapchuk et al., 2021). Under such conditions, a delicate, justified intervention by the state in the processes of structural formation, movement, and professional adaptation of labour resources is an inevitable stage in the development of the labour market of the Republic of Kazakhstan.
Analyses of scientific sources show that the scientific space of studying and forecasting the labour market is becoming increasingly active every day and is very popular in terms of topics.
In particular, Zhumashbekova et al. (2024) argue that the current situation in the labour market requires organised actions and quick adaptation to any factors. This is because the labour market is significantly affected by the following factors:
Demographic ageing of the population
Economic shocks caused by crises and natural disasters
Innovation and technological change
External and internal migration
Gender policies
Job role transformation, changing skill requirements, and complex wage dynamics
Trade union participation
The growth of entrepreneurship
Effective labour market management is also closely related to external investment, as demonstrated in a study by Khan et al. (2022). The authors used the ARDL method to analyse the data, which showed that increased FDI, capital formation, and industrialisation significantly contribute to job creation in the long and short run. Oyarzo and Ferrada (2024) emphasise youth employment subsidy (SEJ), female employment subsidy (BTM), and vocational training (CT), as well as variables such as contract type and other socio-economic controls. Ariansyah et al. (2024) highlight the importance of vocational education in shaping the labour market. Researchers consider vocational education as technical or career-oriented education that equips graduates with the knowledge, practical skills, and competencies necessary for social employment and personal development (Carneiro et al., 2010). This type of education is often seen as a practical choice for students seeking a quick entry into the labour market and a career in a specific industry (Cedefop, 2017; Kuczera & Jeon, 2019). Vézina and Bélanger (2020) focus on highly skilled immigrants whose skills can contribute to the labour market and the national economy, allowing them to integrate better and more easily into society economically and socially (Alba & Foner, 2016).
Zarifhonarvar (2024) highlight the impact of ChatGPT on labour market dynamics to provide a structured understanding of the changes brought about by generative AI technologies. Their study reveals that 32.8 per cent of occupations may be affected entirely by ChatGPT, 36.5 per cent may experience a partial impact, and 30.7 per cent are likely to remain unaffected.
Meanwhile, despite the comprehensive coverage of the factors and mechanisms of labour market regulation by researchers, there are still issues that have been considered only fragmentarily and require further research. In particular, the issue of methodology for assessing the state of the market in a rather volatile environment remains insufficiently researched.

2. Methodology

In the age of digitalisation, a wealth of data is becoming available, opening up new opportunities for labour market analysis. Many stakeholders can make informed decisions if they benefit from accurate and timely labour market information. However, traditional methods of studying the labour market often fail to capture the full diversity of its indicators and trends. Therefore, the authors justified the expediency of using the vector autoregression (VAR) model, which allows for estimating the dynamic relationships between economic variables. Five stationary key indicators were selected to build the model: the unemployed population, the unemployment rate, the youth unemployment rate, external migration, and the economically active population. The choice of stationary variables ensured the adequacy of the model, which was checked by stationarity tests (the ADF test). Diagnostic tests were performed to verify the model’s correctness—the Jarque–Bera test to check the normality of the residuals and the Ljung–Box test to detect autocorrelation. Impulse response functions (IRFs) were used to assess the effect of shocks in each variable on the other variables of the system. All results were visualised as graphs illustrating the dynamics of the impact over ten times.
This study’s limitations are related to the reliability and relevance of the statistics. At the time of the study, indicators up to and including 2023 were taken into account, as some relevant data for 2024 had not yet been published. An additional limitation may be the statistical bias of the data.

3. Results

In the context of globalisation and the accelerated development of technologies, the labour market is becoming more and more dynamic and unpredictable. Companies are forced to adapt to new realities, introduce innovative solutions, revise their strategies, radically change business models, and the nature of labour. In such an environment, the success of business adaptation depends a lot on the company’s human resources potential, creativity, possession of future-oriented skills, and ability to react quickly and make non-standard decisions. Therefore, today, even though in many countries the unemployment rate does not exceed 5%, the issue of creating a fair and stable labour market as a foundation for sustainable economic growth and social well-being has not lost its relevance. That is why many countries have joined the Global Coalition for Social Justice to ensure equality and equal opportunities for all.
The Republic of Kazakhstan is no exception. In 2023, the government of Kazakhstan adopted the Concept of Labour Market Development for 2024–2029 (Resolution of the Government of the Republic of Kazakhstan, 2023), according to which it is assumed that the implementation of measures provided for in it will lead to an increase in the number of quality jobs up to 3.8 million and improve the employment structure, which we believe is debatable.
As of today, some of the international companies operating in the country are leaving for other, more competitive markets, which negatively affects the labour market of Kazakhstan and makes it unstable.
The volatility of Kazakhstan’s labour market is also caused by active staff turnover. The demands of employees and job seekers have changed quite a bit after the COVID-2019 pandemic, which forced companies to reconsider their work format and send people to work remotely, thus shaking up the work and life balance (Turtaeva, 2024). It is not the first year that companies have tried their best to adjust this balance by offering more and more conveniences for employees (in particular, hybrid work format or completely remote work, flexible schedules, and others). However, the remote format of work is still more comfortable for most. People have realised, especially in big cities, that there is no point in wasting time travelling and sitting in the office when work can be carried out in another convenient format (at home, on holiday, in cafés, and so on). That is why bringing workers back to the office is not easy. Many are not ready to change their work format, having felt its advantages in full. Undoubtedly, this has shaken the labour market and has become a problem for Kazakhstan.
The growth of technologically complex sectors of the economy has also played an important role in the formation of Kazakhstan’s labour market. With their development, the demand for highly qualified specialists has increased. Therefore, in some segments of the market, there is a shortage of personnel with the appropriate level of education. However, this is not surprising, since according to the 2021 census data, among the population aged 25–65, only 3.7 million people had higher education, 4.2 million had specialised secondary education, and 4.9 million had secondary education (Table 1).
It should be noted that education in Kazakhstan is given special attention, so the data of the last census (2021) significantly increased compared to the indicators of the previous census. Thus, in 2021, per 1000 inhabitants of the country, there were 276 people with higher education diplomas, which is more than 39% higher than in 2019 (Table 2) (Education in the Republic of Kazakhstan, 2021).
However, the rapid introduction of modern technologies has led some university graduates (particularly in technical specialities) to lose their relevance. At the same time, the need for specialists with digital skills has grown exponentially. A similar situation is characteristic not only of technical specialities but also of several other specialities, as Kazakhstan’s education system does not keep pace with the labour market, which results in disproportions when universities swallow human resources and produce specialists not in demand on the labour market.
External and internal migration create a specific imbalance in the labour market. In 2023, 25,387 people arrived in Kazakhstan for permanent residence, while the number of people leaving the country was 16,094. Thus, for the first time after 2011, a positive migration balance of 9293 people was registered (Table 3) (Bureau of National Statistics, 2024; Agency of the Republic of Kazakhstan on Statistics, 2011; and Bureau of National Statistics, 2023).
The country’s central migration exchange is with other CIS countries, namely Azerbaijan, Armenia, Kyrgyzstan, Tajikistan, and others. The share of arrivals from CIS countries in 2023 was 86.3 per cent, while the share of persons who left for these countries was 77.3 per cent (Bureau of National Statistics, 2024).
Among other countries, China, Mongolia, and Turkey are the leaders from which migrants actively come to Kazakhstan for permanent residence. Those arriving from abroad mainly chose the Almaty (6409), Manistee (3546), and Kootenai (2367) oblasts for residence (Bureau of National Statistics, 2024).
Among the population arriving for permanent residence in Kazakhstan, only ¼ have higher education, 1/6 have a secondary vocational education, and 1/3 have a secondary education (Table 4).
The chaotic inflow of low- or unskilled migrants (Table 4) from neighbouring countries aggravates the situation in the labour market of Kazakhstan. However, it should be recognised that internal migration is no less influential than external migration when the population tends to move from villages to cities. In 2020–2023 alone, 836 thousand young people migrated to urban areas, which, combined with the departure of 714 thousand people, means a positive migration balance of 122 thousand people. Regionally, migration attraction is higher in the North-Kazakh, Kostanay, and Almaty regions. In the West-Kazakh and East-Kazakh oblasts, the migration attraction is much lower (Baikulakov, 2023).
Against the background of the transition of the large population from the older youth subgroup into the adult population, it is expected that by 2025–2027, the share of young people will decrease from 27.3% to 26.8%. However, as those born during the baby boom grow older, their share will increase to 30.9 per cent by 2040 (Baikulakov, 2023). This means that in Kazakhstan, in the next 10–15 years, a ‘demographic window’ for economic growth is opening, as the share of young people in the population structure will increase (Figure 1). However, the so-called ‘youth boom’ will have a temporary nature—it will be followed by a decline in birth rates, changes in the age structure of the labour market of Kazakhstan, etc. (Alshanskaya, 2024).
The data in Table 5 currently characterise the age structure of the unemployed population in Kazakhstan.
Suppose that the state and businesses cannot fully meet the needs of the younger generation in the short term. In that case, this may lead to unfavourable consequences, such as the growth of social tension and inequality in society, the emigration of young people outside Kazakhstan, or the growth of informal employment (Baikulakov, 2023).
According to statistics, today, every third of working Kazakhstanis has informal employment. These are the results of a study conducted by the analyst (One-Third of Kazakhstani Citizens Have Informal Employment, 2024). In 2023, the volume of the labour remuneration fund, calculated based on actual pension contributions, amounted to KZT 20 trillion. At the same time, according to estimates from the Bureau of National Statistics, the labour remuneration fund exceeds almost twice KZT 38 trillion. The most significant discrepancy in the labour remuneration fund data is observed in trade, agriculture, and real estate (Yeleseyeva, 2024). From a regional point of view, there is a higher percentage of informal employment in the Turkestan and Almaty oblasts, as well as in Shymkent (more than 30 per cent). The lowest rates of informal jobs are observed in the East Kazakhstan (1.8 per cent), Ulytau (19 per cent), and Aktobe (20.4 per cent) oblasts (One-Third of Kazakhstani Citizens Have Informal Employment, 2024).
The historically established preferences for working in public institutions are also noteworthy. Today, many university graduates try to obtain a position as a civil servant, as it gives a certain status and respect; the salary level is higher than average and social security is higher than in the private sector, which together creates a particular imbalance in the labour market (Abdramanova et al., 2024; Syzdykbekov, 2022; Rakhmetova & Syzdykbekov, 2024).
In addition, while employers used to only occasionally consider candidates over 50 years old, now the expectation level has dropped to 40. Decisions on rejection are made unofficially, as the Labour Code of the RK (Parliament of the Republic of Kazakhstan, 2015) prohibits discrimination against applicants based on age. Recruiters screen out CVs of applicants of different ages at the CV review stage, explaining the rejections for being unsuitable on formal grounds.
To avoid such manifestations, Kazakhstan created the Electronic Labour Exchange. This is a unified digital platform for employment with the possibility of job searching and recruitment. Today, it is a complex of various services related to the labour market: directly, the portal on employment and employment services is Enbek.kz; the online training platform is Skills.enbek.kz; the portal for support for entrepreneurs is Business.enbek.kz; the portal for labour relations is Hr.enbek.kz; the platform for the National Qualifications System is Career.enbek.kz.
Thus, we conclude that the labour market is a key component of Kazakhstan’s economy, reflecting general trends in the country’s economic development, the effectiveness of government policy, and social challenges.
Studying labour market dynamics allows us to assess the current state of employment, unemployment, and migration processes and identify the interrelationships between various economic variables. This is especially relevant in financial changes caused by domestic factors and global challenges, such as the pandemic, geopolitical instability, and structural reforms.
Eight key indicators were selected for the analysis, which most fully reflect the dynamics of the Kazakh labour market:
  • Labour force (LF)—the size of the population participating in labour activity.
  • Employment (E)—the number of employed persons.
  • Unemployment (U) is the number of people actively looking for work but cannot find it.
  • Unemployment rate (UR) is the share of unemployed people in the labour force.
  • Youth unemployment rate (YUR) is the percentage of unemployed youth.
  • Gross domestic product per capita (GDPpc) indicates economic well-being.
  • External migration (NM) is the balance of migration flows that affect demographic and labour potential.
  • Economically active population (EA) is the share of the population involved in economic activity.
The choice of these indicators is based on the hypothesis that they are interconnected through a complex system of cause and effect. For example, the unemployment rate can affect migration processes, and the level of economic activity can affect employment and production. Analysing these relationships will help better understand Kazakhstan’s labour market structure and develop recommendations for its optimisation.
We will develop a vector autoregression (VAR) model to analyse the relationships between the selected indicators. This method allows us to assess the simultaneous effects of different variables on each other and their dynamics over time. The VAR model does not require strict assumptions about causality, making it ideal for studying a system with many interacting variables.
The general form of the VAR model for the study can be presented as follows:
Yt = A1Yt−1 + … + ApYt−p + εt
where
Yt is the vector of time variables (including LF, E, U, UR, YUR, GDPpc, NM, and EA);
A1, A2, …, Ap Represents the coefficient matrices for each lag p;
εt is the vector of random errors (Blasques et al., 2021).
This model allows us to assess how changes in one indicator, such as the unemployment rate, affect other variables, such as the economically active population or GDP per capita. This approach provides a holistic understanding of the interrelationships in the labour market and its dependence on macroeconomic factors.
In general, applying a VAR model will not only identify the current state of the labour market in Kazakhstan but also forecast its development in the future, taking into account the interaction of key variables. This, in turn, can form the basis for a more effective employment policy that will contribute to economic growth and social stability (Tarasyev, 2017).
To build the model, we used statistical data for the selected indicators for 2001–2023.
Time series analysis requires a stationary check, as the VAR model works correctly only with such data. Stationary means that the distribution of values does not change over time; i.e., the series has a constant mean, variance, and correlation. We applied the Augmented Dickey–Fuller (ADF) test to test for stationarity.
Table 6 shows the results of the ADF test for each variable: ADF Statistic—test statistic; p-value—p-value, which shows the level of significance (if p < 0.05, the series is stationary); Stationary—whether the series is stationary (True/False).
The labour force (LF), employment (E), and gross domestic product per capita (GDPpc) showed high p-values (>0.05), which indicates their instability over time. This means these variables have a trend component and must be transformed to achieve stationarity or exclusion from the model.
The unemployed population (U), unemployment rate (UR), youth unemployment rate (YUR), external migration (NM), and economically active population (EA) demonstrated low p-values (<0.05), which confirms their stationarity in the given period.
To build a VAR model, it is necessary to transform unstable time series (for example, by taking differences) to make them stationary. This will ensure a correct assessment of the relationships between the variables and their dynamics over time. Attempts to make the variables LF, E, and GDPpc stationary were unsuccessful, so it was decided to exclude them from the model.
The model was built using the following variables: U, UR, YUR, NM, and EA.
To analyse the influence of the variables on each other, separate VAR equations were constructed for each variable.
Table 7 contains the coefficients for each variable, taking into account its dependence on the previous values of all other variables.
The equations of the VAR model are as follows:
Ut = 333.8475 + 0.2098Ut−1 − 5.0705URt−1 + 14.9310YURt−1 + 0.0003NMt−1 − 0.0024EAt−1
URt = 2.398 − 0.0025Ut−1 + 0.3802URt−1 + 0.2200YURt−1 − 0.00000008NMt−1 + 0.0004EAt−1
YURt = −0.5653 + 0.0105Ut1 − 1.4417URt1 + 1.1386YURt1 − 0.00001NMt1 + 0.0010EAt1
NMt = 104,870.8141 − 180.2855Ut1 + 11,622.9049URt1 + 781.0184YURt1 + 0.8447NMt1 − 36.6191EAt1
EAt = 3203.8523 + 11.2933Ut1 − 640.4511URt1 − 28.6544YURt1 + 0.0076NMt1  1.1631EAt1
Testing the adequacy of a VAR model is a critical step in confirming that it meets the data and statistical requirements. The following key tests were conducted to assess the model’s adequacy:
  • Test for autocorrelation of residuals (Ljung–Box Test).
The test checks whether the model residuals are correlated with each other. This is performed using statistics:
Q = n ( n + 1 ) k = 1 m f k 2 n k
where
n is the number of observations;
f k 2 is the autocorrelation of residuals at lag;
m is the maximum number of lags (Harding & Neamtu, 2018).
All variables have p > 0.05 (Table 8), which indicates that the residuals are normally distributed. The residuals satisfy the normality requirement for each variable.
2.
Jarque–Bera test for normality of residuals.
The Jarque–Bera test checks whether the distribution of the residuals follows a normal distribution in terms of skewness and kurtosis. The normality of the residuals (p > 0.05) indicates that the statistical estimates of the model are correct. The general formula for the Jarque–Bera Test is as follows:
J B = n a · S 2 6 + ( K 3 ) 2 24
where
J B is the Jarque–Bera statistic;
n is the number of observations or sample size;
S is the skewness, which measures the skewness of the distribution:
S = 1 n i = 1 n ( x i x ¯ σ ) 3
K is the kurtosis, which estimates the ‘tails’ of the distribution:
K = 1 n i = 1 n ( x i x ¯ σ ) 4
where
σ is the standard deviation;
x ¯ is the mean value.
The results of the Jarque–Bera test indicate that the distribution of residuals follows the normal distribution. The test statistic is 11.31, characterising the residuals’ deviation from the normal distribution. In context, the closer the value of the test statistic is to zero, the closer the residual distribution is to the normal distribution.
Comparing the test statistic with the critical value (18.31) allows us to assess whether the deviations detected are significant. In our case, the value of the statistic (11.31) is less than the critical value, favouring the null hypothesis, H0. This means that the distribution of residuals does not have statistically significant deviations from the normal distribution.
The key confirmation of this is the p-value of 0.334. Since p > 0.05, we do not reject H0 at the 5% significance level. This suggests that the model residuals follow a normal distribution and that the model used has an adequate specification for further analysis.
The number of degrees of freedom in this test is five, corresponding to the number of equations in the model. This means that the distribution of the residuals is tested, considering the constraints imposed by the model structure. The test results indicate that the model specification is correct regarding the normal distribution of the residuals.
Impulse response functions (IRFs) are constructed to assess the relationships between labour market variables in Kazakhstan and analyse their response to external shocks. These functions are a key tool in VAR models, as they allow us to study how one variable reacts to a sudden change (shock) in another variable over time. IRF charts show the system’s dynamic behaviour, considering both the direct impact and the sequential interactions between the variables.
Building IRF charts helps to understand the following:
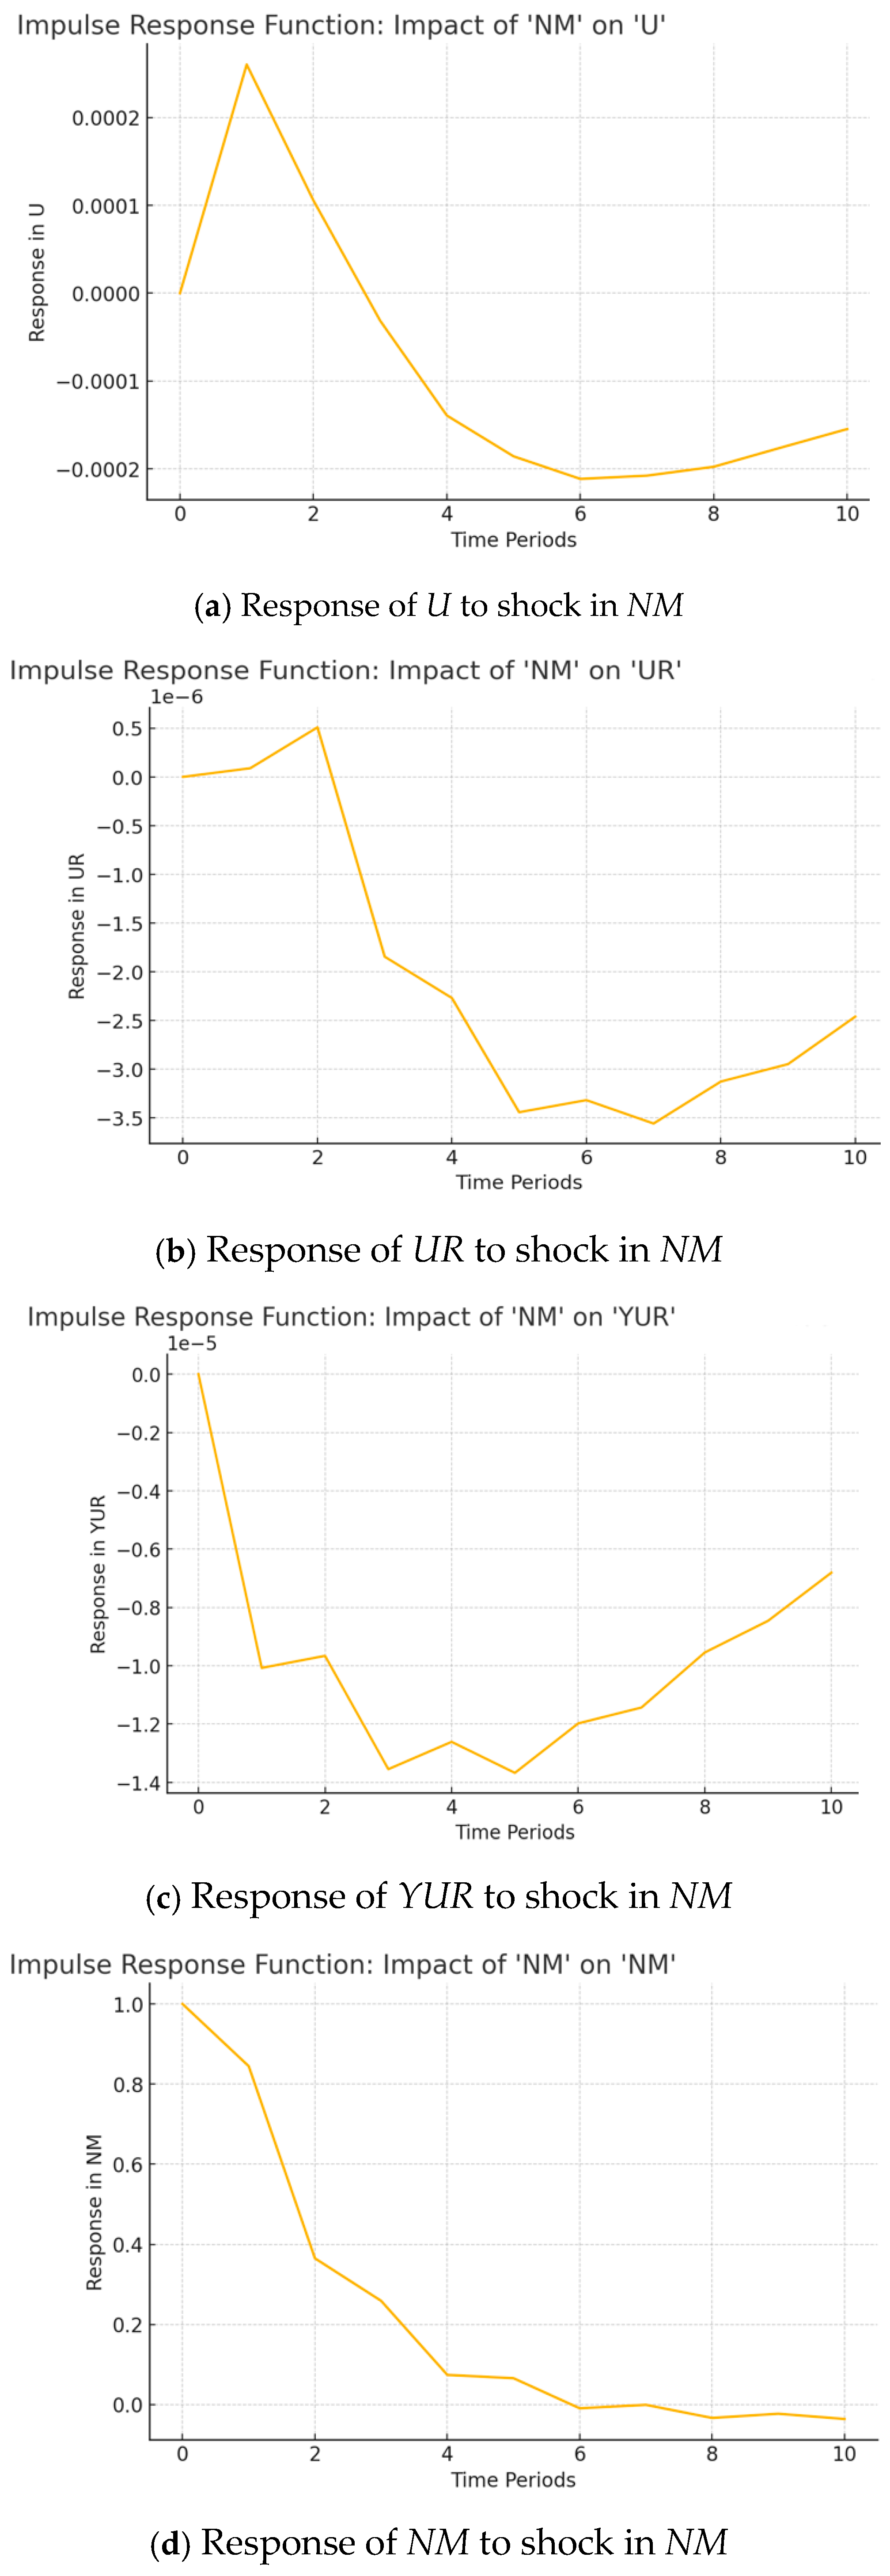
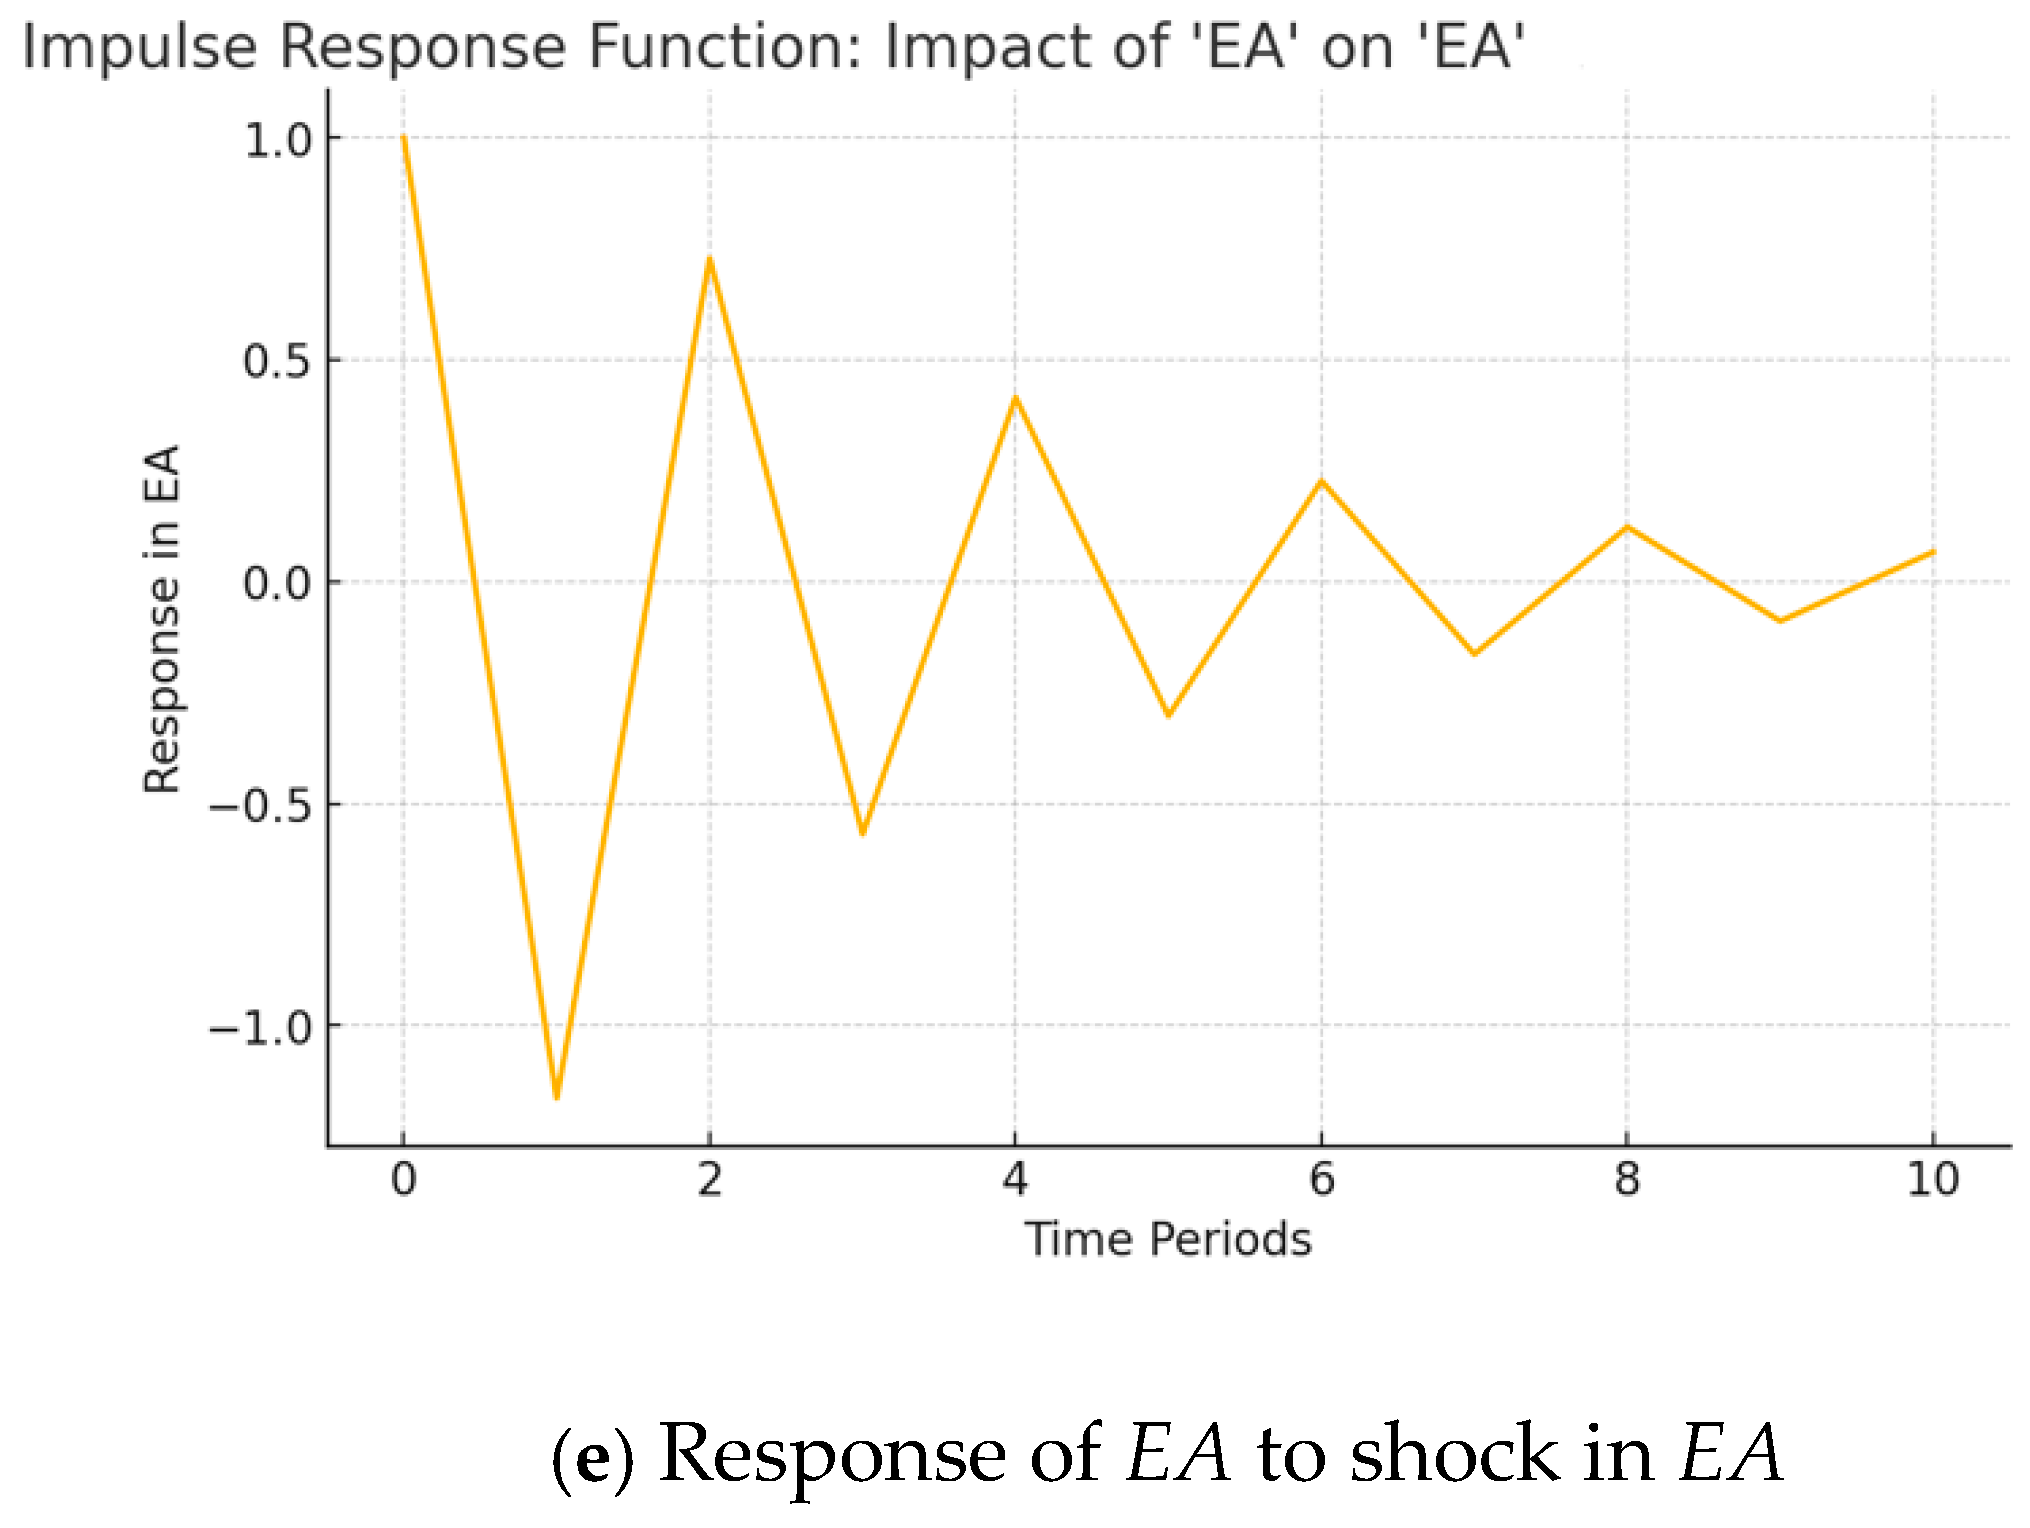
  • The direction of the impact: whether the value of the variable increases or decreases in response to the shock.
  • The strength of the impact: how much the value of the variable changes.
  • The duration of the impact: how many periods before the effect of the shock disappears.
Figure 2a–e show the individual impulse responses (IRFs) of the variables U, UR, YUR, NM, and EAU to a shock in the variable U.
Thus, we conclude the following:
U🠖U: The strongest response in the first period. The response quickly declines, indicating that the shock has a short-term impact on the unemployed population.
U🠖UR: The shock causes a noticeable jump in the unemployment rate. This is logical since the increase in the absolute number of unemployed people affects the relative indicator.
U🠖YUR: Youth unemployment demonstrates similar dynamics but with greater sensitivity. This confirms that the youth group is more vulnerable to economic changes.
U🠖NM: The response to the shock is gradual. This indicates that the increase in unemployment can stimulate external migration, but this process is not instantaneous.
U🠖EA: The response is weak, which may indicate the absence of a direct relationship between the shock in the unemployed population and economic activity. Long-term trends are probably more important for this variable.
Short-run effects. The shock to U has the most substantial impact on UR and YUR in the short run. Intermediate effects are witnessed on NM and EA. These variables respond less strongly, indicating indirect or long-run impacts. For all variables, the shock response decays over time, confirming the stability of the model.
Figure 3a–e present the responses of each variable, U, UR, YUR, NM, and EA, to a shock to UR.
Thus, we conclude the following:
UR🠖U: A shock in U R causes a noticeable increase in the absolute unemployment rate. This effect is logical since an increase in the relative unemployment rate is directly correlated with an increase in the absolute number of unemployed people. This reaction fades over time.
UR🠖U: A shock in U R has the most significant effect on the variable itself. Self-induction is observed: after the impulse, the unemployment rate increases and gradually returns to a stable state.
UR🠖YUR: Youth unemployment also increases after the shock in U R . This variable is more sensitive to changes in the general unemployment rate, so the reaction is noticeable but fades over time.
UR🠖NM: A shock in U R can stimulate external migration since high unemployment pushes people to look for work outside the country. The reaction is gradual, without sharp changes.
UR🠖EA: The economically active population reacts weakly to a shock in U R . This indicates that changes in the relative unemployment rate do not strongly affect overall economic activity.
The most significant impact of the shock is observed on U , U R , and Y U R , reflecting the close relationship between these variables. The effect on NM and EA is less significant and more gradual. The shock in UR is temporary for all variables, and the effects gradually disappear.
Figure 4a–e present the responses of each variable, U, UR, YUR, NM, and EA, to the shock in YUR.
Thus, we conclude the following:
YUR🠖U: The shock in Y U R causes an increase in the unemployment rate. The effect is moderate and short-term; after the initial increase, the response quickly declines.
YUR🠖UR: The unemployment rate also increases after the youth unemployment shock. This is expected since the youth group influences the overall trend in the relative unemployment rate.
YUR🠖YUR: The strongest response is visible in the variable itself. After the initial shock, the youth unemployment rate gradually returns to a stable value.
YUR🠖NM: The increase in youth unemployment can stimulate external migration. The response is gradual and moderate, indicating a lag in the impact of unemployment on migration processes.
YUR🠖EA: The effect is weak but still noticeable. This may suggest that high youth unemployment affects overall economic activity in the short term.
Youth unemployment is an essential factor affecting both absolute and relative unemployment rates. The shock in Y U R has a less direct but significant impact on external migration and economic activity.
Figure 5a–e present the responses of each variable, U, UR, YUR, NM, and EA, to the shock in NM.
Thus, we conclude the following:
NM🠖U: The shock in external migration moderately affects the unemployed population. It can be assumed that migration processes reduce the number of unemployed people because people leave to search for work. This reaction is short-term.
NM🠖UR: The shock in N M has a negligible impact on the unemployment rate. This indicates that external migration has a less significant effect on the relative unemployment rate.
NM🠖YUR: The response of youth unemployment to the shock in N M is also moderate. Youth migration may respond to high unemployment, but the shock in N M does not cause significant changes.
NM🠖NM: The most potent effect is observed in the variable itself. After the initial shock, a correction to the steady state is observed.
NM🠖EA: The economically active population demonstrates a moderate response. This may be a consequence of the departure of non-disabled people abroad.
There is a moderate shock impact on key variables (U, UR, and YUR): external migration does not cause sharp changes, but the effect is still noticeable. NM’s response to NM confirms that migration is directly related to economic activity. The dynamics of NM are such that after the initial shock, stabilisation is observed.
Figure 6a–e present the responses of each variable, U, UR, YUR, NM, and EA, to a shock in EA.
Thus, we conclude the following:
EA🠖U: The shock in EA has a moderate effect on the unemployed population. The answer may be because changes in the economically active population also affect the unemployed.
EA🠖UR: The relative unemployment rate responds slightly to the shock in EA. This indicates that economic activity has a weak effect on this indicator in the short term.
EA🠖YUR: The reaction of youth unemployment is also moderate, with a tendency to quickly fade away.
EA🠖NM: The shock in EA has practically no effect on external migration. This may indicate that migration is caused by other factors and not only by changes in economic activity.
EA🠖EA: The strongest reaction is observed in the variable itself. After the shock, EA demonstrates gradual stabilisation.
There is a weak impact of the shock in EA on other variables: The main effect is observed in the variable itself, and the impact on other indicators is moderate or insignificant.
The developed VAR model allowed us to assess the dynamic relationships between key labour market variables.
Thus, we conclude the following:
  • Relationships between variables.
  • Strong relationships: the variables U, UR, and YUR are closely related. Shocks in one of these variables quickly trigger significant responses in the others.
Moderate relationships: NM and EA demonstrate a less direct relationship with unemployment. Their responses are weaker and less defined.
SSensitivity of youth unemployment: YUR responds more sensitively to shocks in UR and U, which confirms the high vulnerability of the youth group to changes in the labour market.
3.
Dynamics of shocks
Short-term effects: Shocks in the variables U, UR, and YUR cause rapid changes that gradually fade after 5–7 periods. This indicates that the labour market system stabilises relatively quickly.
Slow effects: The response of NM and EA to shocks is more gradual, which indicates their dependence on long-term processes such as migration or economic activity.
Self-induction of shocks: Each variable exhibits the strongest self-effect after a shock, typical of economic systems.
4.
Practical implications
Policymakers should pay attention to youth unemployment, YUR, as it is the most sensitive to shocks and indicates the overall labour market situation.
Rising unemployment can stimulate migration, but this effect is gradual. Programmes to curb labour migration should be long-term.
Although EA shows a weak relationship with unemployment, stabilising economic activity contributes to the overall stability of the labour market.
The short-term response to shocks indicates a relatively high stability level in Kazakhstan’s labour market, but this trend needs to be maintained through adaptive economic strategies.
The developed VAR model allowed us to analyse the dynamic relationships between key indicators of the labour market of Kazakhstan, such as the unemployed population (U), the unemployment rate (UR), youth unemployment (YUR), external migration (NM), and the economically active population (EA). The modelling results showed that the variables are interrelated: shocks in youth unemployment (YUR) have the most significant impact on total unemployment (UR) and the unemployed population (U), while external migration (NM) has a short-term effect mainly on the economically active population (EA). The model confirmed that the labour market is vulnerable to changes in youth unemployment, which is a key indicator for the formation of effective employment policies. Statistical tests confirmed the adequacy of the model: it is stable, the residuals are not autocorrelated, and they correspond to a normal distribution. This allows us to use the model to forecast and assess the impact of economic policies. Shocks in the variables exhibit short-term implications that gradually fade away, indicating the system’s ability to return to equilibrium.
Thus, the analysis of the labour market of Kazakhstan with the help of the VAR model has allowed us to establish several problems and challenges that require a comprehensive and systematic approach to their solution. The following should be highlighted among them:
The mismatch of workers’ qualifications and skills with the labour market requirements, as well as the insufficient development of the vocational education and training system.
A high share of informal employment, especially in rural areas, and a low level of protection of workers’ rights and interests.
The inequality in access to jobs and income between different groups of the population, such as women, youth, people with disabilities, ethnic minorities, and others.
Hence, we conclude that applying the VAR model to monitoring the labour market can become a fundamental basis for decision-making in youth employment.
Currently, the government of Kazakhstan faces the task of creating a competitive, predictable, and adaptive labour market, the most important priority of which should be the creation of new quality jobs since, through the demographic growth of the 2000s, by 2030, the annual inflow of young people to the labour market of Kazakhstan will be over 300 thousand people. The labour market has already felt the first wave of the ‘baby boom’ with general secondary and vocational education. However, in 2026, more and more young people with higher education will start arriving. In order to avoid the emigration of qualified specialists and prevent the rates of previous years (60% of those who left for other countries are persons with higher and technical professional education), the government of Kazakhstan needs to take several cardinal measures to create quality jobs in the coming years. The following factors should be taken into account:
Firstly, the digital economy is transforming the labour market. Traditional wage employment has transformed towards a ‘free earning economy’. Today’s labour market involves flexible employment, including platform employment, which is not just a fashion trend but a dynamically developing trend. The main advantages of platform employment are its low barriers to entry, the possibility of combining it with one’s primary job, and the flexibility of its working hours.
Secondly, by 2030, ‘millennials’ and generation ‘Z’ who are significantly different from the older generation, will represent 74% of the labour force in Kazakhstan. They choose new behaviours and values; i.e., they value flexible forms of employment. These generations understand the balance between one’s professional and personal life and can make financial concessions for flexible working hours. The next generation is not fixated on a professional career and a lifelong commitment to a single endeavour. They are willing to spend more time and money on education (The Government of the Republic of Kazakhstan, 2023).
Thus, demographic growth and the arrival of young people in the labour market will force the labour market to adapt to a new reality, where the younger generation will change the labour market to suit their priorities and conditions. Therefore, the government of Kazakhstan should first change its approaches to regulating youth unemployment.
In Azerbaijan, since 2022, a special fund to regulate unemployment and increase employment, called the ‘Unemployment Insurance Fund’, has been developed and implemented in the budget. New mechanisms of active employment measures, ‘Targeted programmers’ and ‘Jobs above quota’ have also been developed. These measures encourage employers to create new jobs for socially vulnerable groups and those who have been unable to work for a long time.
Uzbekistan is addressing the issue of creating quality jobs by attracting foreign investment and building large factories and enterprises in various regions of the country, one of the requirements of which is to ensure that 80 per cent of the employees of the enterprise are drawn from the local population. For this purpose, huge privileges are granted to attract foreign investment.
In Kyrgyzstan, in recent years, especially since 2022, measures to regulate unemployment are aimed at ensuring access to information about the labour market, especially for young people, who are the most active users of social networks (Mukhitdinova, 2024).
The necessary programming and strategic decisions on transitioning from an agrarian–industrial economy to an industrial–agrarian economy have been developed and implemented in Tajikistan since 2018. In addition, according to the National Development Strategy until 2030, from 2025, the third scenario of economic development, i.e., the scenario of industrial innovation, should be realised. The state programmer ‘Promotion of Employment for 2023–2025’ considers active and passive measures to promote employment, such as the granting of soft loans for entrepreneurial activities, the employment of vulnerable citizens in the labour market through quota jobs, unemployment benefits, etc. A simplified taxation system for small and medium-sized businesses is also envisaged (Aminov & Aminov, 2024).
The policy regulating youth unemployment should be flexible and capable of faster adaptation to changes in the labour market conditions. Focusing the labour market on quality employment, support for automation and the digitalisation of industrial enterprises, fair support for small and medium-sized businesses, and a paradigm shift in the education system will ensure increased productivity, social protection of citizens, and balanced territorial development.
In addition, for the further development of Kazakhstan’s labour market, it is necessary to ensure the following:
The systemic stimulation of demand for quality jobs in the context of industries and macro-regions;
The development of human capital, improving the quality of labour resources;
The development of the labour market infrastructure, as well as increasing its inclusiveness.

4. Discussion

Using various economic and mathematical methods and models opens vast opportunities for improving labour market management and increasing the efficiency and effectiveness of mechanisms of state regulation. Currently, the models of correlation and regression analysis, production functions, systems of econometric equations, and many others are widely used to solve such problems.
In particular, constructing correlation and regression models allows for quantitatively characterising the relationship, dependence, and mutual conditioning of economic indicators (Alshanskaya, 2024). However, an indicator that reflects the closeness of the relationship with all factors combined does not consider the degree of influence of each factor individually on the change in the value of the dependent variable. This means that even in the presence of a very high overall multiple correlation coefficient, it is possible that the influence of individual factors may be negligible and their inclusion in the correlation model is unjustified.
Production functions (multifactor) have also been widely used (Shananin & Trusov, 2023), which makes it possible to study the influence of each factor separately while considering the effect of other factors. It was revealed that, as a rule, dynamic systems of equations (taking into account the time factor) are currently used. However, a vector autoregressive model can obtain more accurate and correct results. A linear combination of indicators of previous periods represents each variable.
Inoue and Chen (2015) investigated labour market problems using a mathematical model described by the Potts spin stack. In this model, the correlation (adjacency matrix) between job applicants is accounted for through pairwise spin–spin interactions, which provide the necessary analytical insights into the labour market. However, this technique has not been widely used due to the complexity of the calculation. Bardhan and Mookherjee (2006), Misra and Singh (2011), and Klein (2013) study the labour market using a model based on the stability theory of differential equations. However, the model has only one nonlinearly stable equilibrium under well-defined conditions. Blasques et al. (2021) and Rollnik-Sadowska and Bartkute-Norkuniene (2024) analysed the impact of unemployment on participation in education through a factor model with clustering. However, this approach is centred on long-run macroeconomic factors and does not consider short-run dynamics. Tarasyev (2017) uses the gravitation model to analyse labour migration, but its limitation is the dependence of accuracy on the geographical distance between regions. The research (Harding & Neamtu, 2018) analyses unemployment through nonlinear models considering political delays. Although it adds value in the context of modelling, such an approach has limited practical application for analysing systems with many variables.
Using a vector autoregressive (VAR) model to analyse dynamic relationships between economic variables has several advantages over other approaches presented in the literature. It provides a comprehensive approach to checking the adequacy of the model, considers the stationarity of variables, and uses impulse response functions to assess the impact of shocks. Thus, the proposed approach takes into account all important aspects of building a VAR model and offers a more reliable methodology compared to other studies, providing accurate results and a correct analysis of the dynamic economic interrelationships of the labour market and economic development of the country, in particular, the Republic of Kazakhstan.

5. Conclusions

According to the results of the study of the labour market of the Republic of Kazakhstan, it was found that over the past few years, the government has been taking several measures to reduce unemployment. The Labour Market Development Concept for 2024–2029 has been adopted, increasing the number of quality jobs to 3.8 million and improving the employment structure. The article proves that it is not easy to achieve this ambitious goal since the factors shaping the labour market in Kazakhstan have a significant impact.
The analysis of the data of the Bureau of National Statistics of the Agency for Strategic Planning and Reforms of the Republic of Kazakhstan established which factors played the most significant role in shaping the country’s labour market. Based on these factors (unemployed population, unemployment rate, youth unemployment rate, external migration, and economically active population), vector autoregressive (VAR) models were built to analyse the dynamic relationships between economic variables. The choice of stationary variables ensured the adequacy of the model, which was checked by the ADF test. Diagnostic tests were performed to verify the model’s correctness—the Jarque–Bera test to check the normality of the residuals and the Leung-Box test to detect autocorrelation. Impulse response functions (IRFs) were used to assess the impact of shocks in each variable on other variables in the system. All results were visualised in the form of graphs illustrating the dynamics of the impact over ten times. The model confirmed that the labour market is vulnerable to changes in youth unemployment, a key indicator for formulating effective employment policies. This makes it possible to use the model to assess the effectiveness of policies and mechanisms of state regulation of the labour market and identify vectors for further reform.
Today, the government of Kazakhstan faces the strategic task of creating a competitive, predictable, and flexible labour market that should be centred on creating new, quality jobs. This is because, due to the demographic growth of the 2000s, by 2030, the annual influx of young people into the labour market will exceed 300,000 people. In order to prevent the outflow of qualified specialists abroad, it is necessary to implement a set of cardinal measures aimed at expanding employment opportunities and improving the quality of employment in the coming years.
It should be taken into account that the digitalisation of the economy and changes in labour values among the millennial and ‘Z’ generations are radically transforming the market: the demand for flexible forms of employment and platform work is increasing. Under these conditions, policies to regulate youth unemployment must become more flexible and responsive. Support for quality employment, the promotion of digitalisation, the development of human capital, and the modernisation of labour market infrastructure should become development priorities.
Further research will be aimed at modifying the policy of state regulation of the labour market of the Republic of Kazakhstan on short- and long-term time horizons.

Author Contributions

Conceptualization, A.B. and G.A.; Methodology, G.A.; Software, G.A. and B.N.; Validation, G.A., G.K. and A.M.; Formal analysis, G.A. and B.N.; Investigation, G.A.; Resources, A.B. and A.N.; Writing—original draft, A.M.; Writing—review & editing, A.N.; Supervision, G.A.; Project administration, G.A. All authors have read and agreed to the published version of the manuscript.

Funding

This research received no external funding.

Institutional Review Board Statement

Written informed consent has been obtained from the patient(s) to publish this paper if applicable.

Informed Consent Statement

Not applicable.

Data Availability Statement

The data used is public. No secret or commercial data was used.

Conflicts of Interest

The authors declare no conflicts of interest.

References

  1. Abdramanova, U., Nietalina, G., Orlowska, R., & Spanov, M. (2024). The economic consequences of youth migration in Kazakhstan: An analysis of the loss of human capital. Bulletin of “Turan” University, 4, 186–199. [Google Scholar] [CrossRef]
  2. Agency of the Republic of Kazakhstan on Statistics. (2011). Population migration: Results of the national population census of the Republic of Kazakhstan. Available online: https://stat.gov.kz/en/industries/social-statistics/demography/publications/79244/ (accessed on 18 December 2024).
  3. Alba, R., & Foner, N. (2016). Integration’s challenges and opportunities in the Wealthy West. Journal of Ethnic and Migration Studies, 42(1), 3–22. [Google Scholar] [CrossRef]
  4. Alshanskaya, A. (2024). Youth in the labour market in Kazakhstan. Kazakhstan Institute for Strategic Studies under the President of the Republic of Kazakhstan. Available online: https://kisi.kz/ru/molodezh-na-rynke-truda-v-kazahstane/ (accessed on 24 December 2024).
  5. Aminov, I. A., & Aminov, F. I. (2024). Influence of business development on employment in the Sughd region of the Republic of Tajikistan. Bulletin of the Tajik State University of Commerce, 2(52), 34–40. [Google Scholar]
  6. Ariansyah, K., Wismayanti, Y. F., Savitri, R., Listanto, V., Aswin, A., Ahad, M. P. Y., & Cahyarini, B. R. (2024). Comparing labour market performance of vocational and general school graduates in Indonesia. Empirical Research in Vocational Education and Training, 16, 5. [Google Scholar] [CrossRef]
  7. Baikulakov, S. (2023). Workforce of the future: Youth in the labour market of Kazakhstan. Ministry of Labour and Social Protection of the Republic of Kazakhstan. Available online: https://erdo.enbek.kz/storage/news_files/%D0%9D%D0%B0%D1%86%D0%B4%D0%BE%D0%BA%D0%BB%D0%B0%D0%B4%20%D1%80%D1%83%D1%81%D1%81.pdf (accessed on 12 December 2024).
  8. Bardhan, P., & Mookherjee, D. (2006). Decentralisation and local governance in developing countries: A comparative perspective. The World Bank Research Observer, 21(2), 205–227. [Google Scholar]
  9. Bennett, D., Wagner, G., & Araki, M. (2024). Labour market reform as an external enabler of high-growth entrepreneurship. Journal of Business Venturing, 39(6), 106428. [Google Scholar] [CrossRef]
  10. Blasques, F., Hoogerkamp, M. H., Jan Koopman, S., & van de Werve, I. (2021). Dynamic factor models with clustered loadings: Forecasting education flows using unemployment data. International Journal of Forecasting, 37(4), 1426–1441. [Google Scholar] [CrossRef]
  11. Braunerhjelm, P., Eklund, J., & Kugler, M. (2023). Labour market regulations, innovation and technological change. In Handbook of innovation and regulation. Available online: https://www.e-elgar.com/shop/gbp/eelgar/product_flyer/printpage/id/20532/ (accessed on 12 December 2024).
  12. Bureau of National Statistics. (2023). Migration of the population of the Republic of Kazakhstan. Available online: https://stat.gov.kz/en/industries/social-statistics/demography/publications/157661/ (accessed on 13 December 2024).
  13. Bureau of National Statistics. (2024). On the demographic situation for January–December 2024. Available online: https://stat.gov.kz/ru/news/ (accessed on 10 December 2024).
  14. Carneiro, P., Dearden, L., & Vignoles, A. (2010). The economics of vocational education and training. In International encyclopedia of education. Semantic Scholar. [Google Scholar] [CrossRef]
  15. Cedefop. (2017). Cedefop European public opinion survey on vocational education and training. Publications Office of the European Union. Available online: https://data.europa.eu/doi/10.2801/575587 (accessed on 7 December 2024).
  16. Education in the Republic of Kazakhstan. (2021). Population Census 2021. Available online: https://stat.gov.kz/en/national/2021/ (accessed on 10 December 2024).
  17. Harding, L., & Neamtu, M. (2018). Dynamic model of unemployment with migration and delayed policy intervention. Computational Economics, 51, 427–462. [Google Scholar] [CrossRef]
  18. He, W., Zhang, B., & Zhang, J. (2024, January 12–14). The impact of technology on the labor market: An analysis of the changing landscape. 9th International Conference on Financial Innovation and Economic Development (ICFIED 2024), Ningbo, China. [Google Scholar] [CrossRef]
  19. Inoue, J., & Chen, H. (2015). Statistical mechanics of human resource allocation. Springer Proceedings in Mathematics & Statistics, 146, 69–88. [Google Scholar] [CrossRef]
  20. Khan, I., Xue, J., Zaman, S., & Mehmood, Z. (2022). Nexus between FDI, economic growth, industrialisation, and employment. Journal of the Knowledge Economy, 14(3), 3153–3175. [Google Scholar] [CrossRef]
  21. Klein, L. R. (2013). Mathematical economics: An introduction to the economic analysis. Journal of Economic Literature, 51(4), 1234–1236. [Google Scholar]
  22. Kuczera, M., & Jeon, S. (2019). Vocational education and training in Sweden. OECD. [Google Scholar] [CrossRef]
  23. Misra, A., & Singh, A. (2011). A mathematical model for unemployment. Nonlinear Analysis: Real World Applications, 12, 128–136. [Google Scholar] [CrossRef]
  24. Mora-Sanguinetti, J., & Atienza-Maeso, A. (2024). How effective is equality regulation in reducing gender gaps? Journal of Policy Modelling, 46, 823–846. [Google Scholar] [CrossRef]
  25. Mukhitdinova, S. (2024). Peculiarities of the regulation of employment of the population in the Union of Independent States countries. Fundamental Research, 10, 50–54. [Google Scholar]
  26. One-Third of Kazakhstani Citizens Have Informal Employment. (2024). Available online: https://ranking.kz/digest/industries-digest/tret-rabotayuschih-kazahstantsev-imeyut-neformalnuyu-zanyatost.html (accessed on 18 December 2024).
  27. Ostapchuk, A., Kustrich, L., Tranchenko, L., Botsula, O., Kolmakova, V., & Patoka, I. (2021). Modeling the labor market stability in conditions of uncertainty. Lecture Notes in Networks and Systems, 194, 261–272. [Google Scholar] [CrossRef]
  28. Oyarzo, M., & Ferrada, L. (2024). Exploring the impact of employment policies on wages and employability. Regional Science Policy & Practice, 16, 100048. [Google Scholar] [CrossRef]
  29. Parkhomenko, N. (2024). Trends of labour migration. Economy and Marriage, 63. [Google Scholar] [CrossRef]
  30. Parliament of the Republic of Kazakhstan. (2015). Labour code of the Republic of Kazakhstan. Available online: https://adilet.zan.kz/rus/docs/K1500000414 (accessed on 22 December 2024).
  31. Rakhmetova, A., & Syzdykbekov, E. (2024). Modern trends of external labour migration in Kazakhstan. Practice, 2024, 52–63. [Google Scholar] [CrossRef]
  32. Resolution of the Government of the Republic of Kazakhstan. (2023). Approval of the concept of labour market development is required. Available online: https://adilet.zan.kz/rus/docs/P2300001050 (accessed on 27 December 2024).
  33. Rigolini, I., Sanchez-Reaza, J., Shulga, I., Ustinova, M., Baikulakov, S., Shumekov, D., & Shegenova, U. (2024). More, better and inclusive jobs in Kazakhstan. World Bank. [Google Scholar]
  34. Rollnik-Sadowska, E., & Bartkute-Norkuniene, V. (2024). The efficiency of labour market policies in EU countries. Comparative Economic Research Central and Eastern Europe, 27(2), 113–133. [Google Scholar] [CrossRef]
  35. Shananin, A., & Trusov, N. (2023). Mathematical modeling of the household behavior in the labor market. Mathematical optimisation theory and operations research. Springer. [Google Scholar] [CrossRef]
  36. Smagulova, G., & Barzhaksyyeva, A. (2024). State regulation of employment in Kazakhstan: Labour market and ways of development. Economy: Strategy and Practice, 19(3), 117–136. [Google Scholar] [CrossRef]
  37. Syzdykbekov, E. (2022). External labor migration as a factor in the development of the labor market in the Republic of Kazakhstan. Bulletin of Karaganda University “Economics”, 4(108), 227–234. [Google Scholar] [CrossRef]
  38. Tarasyev, A. (2017). The gravity model of labor migration behavior. AIP Conference Proceedings, 1863, 560062. [Google Scholar] [CrossRef]
  39. Textor, C. (2024). Economic slowdown—Impact on the labour market. In Economy & politics/economy. Statista. Available online: https://www.statista.com/statistics/239153/employment-rate-in-china/ (accessed on 23 December 2024).
  40. The Government of the Republic of Kazakhstan. (2023). Resolution ‘On approval of the concept of labour market development of the Republic of Kazakhstan for 2024—2029’. Available online: https://adilet.zan.kz/rus/docs/P2300001050#z59 (accessed on 23 December 2024).
  41. Turtaeva, M. (2024). “The perfect storm”: The labor market in Kazakhstan in 2024. Workforce. Available online: https://manpower.kz/media/publication/%C2%ABidealnyij-shtorm%C2%BB-ryinok-truda-kazaxstana-v-2024-godu.html (accessed on 11 December 2024).
  42. Vézina, S., & Bélanger, A. (2020). Literacy skills as an explanation for labour market imbalances by occupational type in Canada: Microsimulation projections for 2014–2024. Population Research and Policy Review, 39, 1019–1049. [Google Scholar] [CrossRef]
  43. Yahyaoui, M., & Amine, S. (2024). Mathematical modelling of unemployment dynamics with skills development and cyclical effects. Partial Differential Equations in Applied Mathematics, 11, 100800. [Google Scholar] [CrossRef]
  44. Yeleseyeva, E. (2024). Zhakupova named the problems of the labour market of Kazakhstan. Available online: https://www.zakon.kz/obshestvo/6452292-problemy-rynka-truda-kazakhstana-nazvala-zhakupova.html (accessed on 3 December 2024).
  45. Zambrano-Monserrate, M. (2024). Labour dynamics and unions: An empirical analysis through Okun’s Law. Economic Analysis and Policy, 82, 613–628. [Google Scholar] [CrossRef]
  46. Zarifhonarvar, A. (2024). Economics of Chatgpt: A labour market view on the occupational impact of artificial intelligence. Journal of Electronic Business & Digital Economics, 3, 100–116. [Google Scholar] [CrossRef]
  47. Zhumashbekova, S., Kirdasinova, K., Talapbayeva, G., Bekmagambetova, G., Nurpeissova, A., Orynbekova, G., & Aldeshova, S. (2024). Assessment of the migration processes on the example of Kazakhstan. Regional Science Policy & Practice, 16, 12645. [Google Scholar] [CrossRef]
Figure 1. Forecast of the average annual number of young people (15–34 years) for the period up to 2050 (Baikulakov, 2023).
Economies 13 00131 g001
Figure 2. Response of U, UR, YUR, NM, and EA to shock in U.
Economies 13 00131 g002aEconomies 13 00131 g002b
Figure 3. Response of U, UR, YUR, NM, and EA to shock in UR.
Economies 13 00131 g003aEconomies 13 00131 g003b
Figure 4. Response of U, UR, YUR, NM, and EA to Shock in YUR.
Economies 13 00131 g004aEconomies 13 00131 g004b
Figure 5. Response of U, UR, YUR, NM, and EA to shock in NM.
Economies 13 00131 g005aEconomies 13 00131 g005b
Figure 6. Response of U, UR, YUR, NM, and EA to shock in EA.
Economies 13 00131 g006aEconomies 13 00131 g006bEconomies 13 00131 g006c
Table 1. Population of Kazakhstan by level of education at the age of 15 years and older according to the population census, in % (Education in the Republic of Kazakhstan, 2021).
YearsTotal,
Millions of People
Percentage With a Level of Education
Higher EducationIncomplete Higher EducationSecondary
Special
Education
Overall Average
Education
Basic Secondary
Education
Primary Education
The Entire Population, Millions of People
200912.22.40.43.43.81.60.6
202113.53.70.24.23.61.30.5
The Entire Population, %
200910019.83.127.630.913.34.9
202110027.61.630.826.69.83.4
Table 2. The population of Kazakhstan by level of education at the age of 15 years and older per 1000 inhabitants of the country (Education in the Republic of Kazakhstan, 2021).
YearsTotal,
Millions of People
Those Who Have Education, People per 1000 Inhabitants of the Country
Higher EducationIncomplete Higher EducationSecondary
Special
Education
Overall Average
Education
Basic Secondary
Education
Primary Education
200912.21983127630913349
202113.5276163082669834
Table 3. Balance of total migration of the population of the Republic of Kazakhstan in 2014–2023 (Bureau of National Statistics, 2024).
2014201520162017201820192020202120222023
Republic of Kazakhstan−12,162−13,466−21,145−22,130−29,121−32,970−17,718−21,217−67229293
Abay--------−660−393
Akmola−1497−1050−1593−2231−2148−2801−1738−1768−1149−730
Aktobe−191−606−713−1071−1261−1899−1336−1476−58043
Almaty419183322103753542767−145−116310111196
Atyrau37021923818536−68−2112237500
West Kazakhstan−565−731−526−786−1206−1606−1005−836−393582
Zhambyl−142−434−626−479−449−946−838−1041−651−513
Zhetisu--------−31482
Karaganda−3403−3874−5483−5571−5255−5388−3771−4349−2373−687
Kostanay−2260−2388−3692−4169−4820−4665−2542−2635−1933108
Kyzylorda19−45−51−27−35−38−8−61−21−42
Mangistau2091279113811087111419652450221233363416
Pavlodar−2370−2966−3974−3888−4173−5298−2788−2855−1858−380
North Kazakhstan−2671−2099−2533−2651−3210−3660−1759−1863−1181−183
Turkestan1382593501754336−24500252314352
Ulytau--------−201−146
East Kazakhstan−3122−3511−3712−4306−5582−6515−3335−3650−1804−979
Astana city375−25−636−926−1276−1068−742−1000391461
Almaty city−597−1173−1936−1804−2096−2219−960−135212265097
Shymkent city----362493301256233509
Table 4. Population arriving for permanent residence in 2009–2021 by level of education, in thousands of people (Education in the Republic of Kazakhstan, 2021; Agency of the Republic of Kazakhstan on Statistics, 2011; and Bureau of National Statistics, 2023).
YearsTotal,
Millions of People
Those Who Have Education, People per 1000 Inhabitants of the Country
Higher EducationIncomplete Higher EducationSecondary
Special
Education
Overall Average
Education
Basic Secondary
Education
Primary Education
20093031.9591.7122.358.8597.7432.9275.5
20212770.5705.237.5183.2449.3252.8211.6
Table 5. Dynamics of the unemployed population of the Republic of Kazakhstan at the end of 2023 (on the demographics of 2024).
IndicatorsTotalIncluding
Urban PopulationRural Population
Both SexesIncludingBoth SexesIncludingBoth SexesIncluding
MenWomenMenWomenMenWomen
Unemployed population, total445,886200,478245,408276,802123,822152,980169,08476,65692,428
At the age of
15---------
16–2438,09018,69219,39824,11210,90013,21213,97877926186
25–2826,23311,49314,74013,5705514805612,66359796684
29–3458,65725,68432,97340,09617,29722,79918,561838710,174
35–44158,35368,25690,097101,53745,28456,25356,81622,97233,844
45–5499,18944,69554,49461,17427,91333,26138,01516,78221,233
55–6465,36431,65833,70636,31316,91419,39929,05114,74414,307
65 and older---------
Including those of working age444,854200,406244,448276,443123,780152,663168,41176,62691,785
Table 6. ADF test results for Kazakhstan labour market data (Rigolini et al., 2024).
VariableADF Statisticp-ValueStationary
Labour force, thousands of people (LF)−0.07570.9518False
Employed population, thousands of people (E)−0.48590.8947False
Unemployed population, thousands of
people (U)
−4.00570.0014True
Unemployment rate, % (UR)−3.87280.0022True
Youth unemployment rate, % (YUR)−4.57990.0001True
GDPpc, KZT (GDPpc)2.11660.9988False
External migration, balance (NM)−5.8480−3.6407True
Economically active population, thousands of people (EA)−3.61000.0056True
Table 7. VAR model coefficients for each variable (Textor, 2024).
VariableUnemployed Population, Thousands of People (U)Unemployment Rate, % (UR)Youth Unemployment Rate, % (YUR)External Migration (Balance) (NM)Economically Active Population, Thousands of People (EA)
const333.84752.398−0.5653104,870.81413203.8523
Unemployed population, thousands of people (U)0.2098−0.00250.0105−180.285511.2933
Unemployment rate, % (UR)−5.07050.3802−1.441711,622.9049−640.4511
Youth unemployment rate, % (YUR)14.93100.22001.1386781.0184−28.6544
External migration (balance) (NM)0.00030.00000008−0.000010.84470.0076
Economically active population, thousands of people (EA)−0.00240.00040.0010−38.6191−1.1631
Table 8. Ljung–Box test results for autocorrelation.
VariableLB Statisticp-ValueNo Autocorrelation
(p > 0.05)
Unemployed population, thousands of people (U)0.56490.4523Yes
Unemployment rate, % (UR)1.08460.2977Yes
Youth unemployment rate, % (YUR)0.04380.8342Yes
External migration (balance) (NM)0.45570.4996Yes
Economically active population, thousands of people (EA)0.19400.6596Yes
Disclaimer/Publisher’s Note: The statements, opinions and data contained in all publications are solely those of the individual author(s) and contributor(s) and not of MDPI and/or the editor(s). MDPI and/or the editor(s) disclaim responsibility for any injury to people or property resulting from any ideas, methods, instructions or products referred to in the content.

