Abstract
This study examines the asymmetric effects of foreign worker employment and low educational attainment on labor productivity across Malaysia’s three main economic sectors—agriculture, industry, and services—from 1991 to 2019 using the nonlinear autoregressive distributed lag (NARDL) model. Three sectoral models are estimated to capture how overdependence on foreign workers and low-skilled local labor influences productivity. Model 1 for agriculture underscores positive variations vis-à-vis how foreign worker employment boosts agricultural productivity in both the short and long term. However, negative variations lead to diminished productivity in the long run. Primary education negatively affects long-term agricultural productivity. In Model 2 for industry, neither foreign worker employment nor low educational attainment significantly affects productivity. Model 3 for services reveals a short-term boost in productivity with increased foreign workers’ employment, whereas reduced employment enhances long-term productivity. The absence of formal education is detrimental to long-term service productivity, while primary education affects it negatively in the short term. NARDL multiplier graphs and Wald tests confirm significant long-run asymmetric effects of foreign labor in the agriculture and services sectors. The findings highlight the need for Malaysia to reduce reliance on low-skilled labor and accelerate its transition toward a high-skilled workforce to sustain productivity growth and economic competitiveness.
Keywords:
foreign worker employment; low educational attainment; NARDL model; sectoral labor productivity JEL Classification:
E24; I25; J08; J21
1. Introduction
The main challenges in the Malaysian industries are the shortage of skilled workers and over-reliance on low-skilled workers, especially in the agriculture, construction, and manufacturing sectors. Rapid economic development leads to labor shortages in Malaysian firms, and now they are more reliant on low-skilled local workers and low-wage foreign workers from other countries. According to Abdul-Rahman et al. (2012), overdependence on foreign workers is the main negative issue regarding the Malaysian construction industry. Local firms prefer to rely heavily on low-cost production models that lead to the hiring of low-skilled labor to maintain their profit margins (Ang et al., 2018). The share of low-skilled jobs has increased remarkably recently, and Malaysia’s workforce is predominately constituted by low-skilled workers; this is reflected in the comparatively lower proportion of tertiary-educated workers in the Malaysian industry. According to the Department of Statistics Malaysia, foreign labor accounts for approximately 15% of the total labor force, predominantly employed in lower-skilled jobs. In 2017, the total number of foreign workers was about 2.96 to 3.26 million. According to the Central Bank of Malaysia, merely 5.2% of migrant workers have attained tertiary education levels (Ang et al., 2018). The Central Bank of Malaysia pointed out that the share of high-skilled job creation declined to an average of 27% in Malaysia over the 2010–2019 period, from about 51% between 2000 and 2009. In 2018, Malaysia’s labor force was approximately 15.3 million, accounting for an estimated 27% skilled workers and 73% semi- and low-skilled workers.
The research undertaken by the economics department in the Central Bank of Malaysia reported that foreign workers constitute a significant portion of industries with low productivity, often relying on longer working hours to produce output (Ang et al., 2018). The World Bank Group (2019) reported that the agricultural value added per worker in Malaysia was 45% of the average among high-income countries in 2017. This report implies that Malaysia’s agricultural productivity is less than half that of high-income countries. Meanwhile, the ratio of agricultural employment to total employment declined from 37% to 11.1% during the period 1980–2018. The emergence of low-skilled employment and excessive dependence on low-skilled labor appear to negatively affect the agricultural value added per worker.
Over-reliance on low-skilled workers, rather than pivoting toward high-skilled labor, might significantly impede Malaysia’s industrial growth. Such a trajectory might reduce production rates and overall output, making industrial transformation challenging. This stagnation poses the risk of Malaysia becoming entrenched in the middle-income trap. As emphasized by the World Bank Group (2019), a robust agricultural transformation is vital for Malaysia’s progression from an upper-middle-income to a high-income nation. Failing to keep pace with global agricultural advancements not only hinders the nation’s economic ascent but also perpetuates disparities between rural and urban communities. A continued focus on low-skilled labor translates to fewer opportunities for the creation of high-skilled jobs. This scenario inevitably slows productivity growth, making it challenging for Malaysia to boost its production capacities and achieve its economic aspirations.
With motivation at hand, this study identifies key factors that influence slow productivity growth by exploring how foreign worker employment and the presence of low-skilled local workers impact sectoral labor productivity. Is the presence of foreign workers contributing to a decline in productivity within industries? Are low-skilled local workers exacerbating this slow productivity growth? Our research objective is to ascertain the factors that impede labor productivity. This study aims to identify the effects of employing foreign workers—both positive and negative changes—on labor productivity, as well as the impact on local low-skilled workers within the Malaysian sectoral industries. In this study, we examined low educational attainment as a low-skill factor that might engender slow productivity growth. Thus, the independent variables—total employment of foreign workers (including both skilled and unskilled foreign labor) and local workers with low educational attainment—will be investigated to identify the factors contributing to the slow productivity growth. To explore both positive and negative changes in foreign worker employment, this study employs the NARDL model to examine the asymmetric effects of foreign worker employment and the influences of local workers with low educational attainment on sectoral labor productivity. This study makes two significant contributions to the literature. First, our study, which encompasses Model 1 (agriculture), Model 2 (industry), and Model 3 (service), bridges existing research gaps by providing a novel approach to the asymmetric influence of foreign worker employment on labor productivity across Malaysia’s main targeted sectors—agriculture, industry, and service—spanning the period 1991–2019. Notably, through nonlinear autoregressive distributed lag (NARDL) estimation, our study illuminates these nuanced asymmetric effects more comprehensively; previous studies emphasized estimation by using linear approaches, including ordinary least squares (OLS), autoregressive distributed lag (ARDL), and generalized method of moments (GMM) (e.g., Jordaan, 2018; Kangasniemi et al., 2012; Thangavelu, 2016). Unlike the ARDL, the NARDL approach provides graphs of cumulative dynamic multipliers that clarify the adjustment patterns following positive and negative shocks to the employment of foreign workers. The NARDL model effectively analyzes small sample sizes and captures both short-run and long-run nonlinear dynamics, thereby fulfilling the research objective. The incorporation of a nonlinear autoregressive distributed lag (NARDL) model captures the potential nonlinear relationships (i.e., positive changes and negative changes in foreign worker employment) that affect Malaysian sectoral labor productivity. The existing literature rarely highlights the influence of foreign labor on labor productivity within Malaysia’s economic sectors, especially regarding the long- and short-term asymmetric effects. Our paper, therefore, addresses these oversights, placing a magnified lens on the asymmetric repercussions of foreign labor across Malaysia’s three dominant sectors.
Second, while Model 1 underscores that foreign worker employment and low-skilled local labor can be principal contributors to the agricultural sector’s reduced productivity, past research has primarily focused on how education levels drive overall economic growth. Many studies have overlooked the impacts of having no formal education, traditionally concentrating on the primary, secondary, and tertiary education levels as pivotal indicators of educational quality. The current literature offers a limited exploration of how low educational attainment (i.e., representing the educational quality of low-skilled labor) influences the Malaysian industrial landscape. For this study, the NARDL model sheds new light on the asymmetric effects of foreign worker employment, and low-skilled local employment can be a principal contributor to the targeted sector’s reduced productivity. The study adds to the body of knowledge by delving into the influences of low educational attainment on sectoral labor productivity, based on the estimation model results.
The remainder of the study is organized as follows: Section 2 reviews the literature on foreign workers, educational attainment, productivity, and economic growth, and it discusses the effects (i.e., foreign workers and educational attainment) on productivity and economic growth. Section 3 presents the research method, and Section 4 analyzes the econometric findings. Section 5 covers the conclusion, summary of the findings, and policy implications.
2. Literature Review
Previous studies have explored the impacts of foreign workers on productivity. Most of the studies have primarily focused on the influences of human capital on productivity, production output, and economic growth. Foreign workers can probably affect labor productivity through their skills or other factors. There is limited literature on the effects of foreign workers in Malaysia. For instance, Jordaan (2018) reports that both low- and high-skilled foreign workers have a positive impact on productivity in Malaysian manufacturing industries, with data covering the 2005–2009 period using OLS estimation. A recent study by Mamun et al. (2023) reveals that urban migration leads to agricultural labor shortage, ultimately lowering agricultural productivity in Malaysia. Abdul-Rahman et al. (2012) pointed out that the primary concern in the Malaysian construction industry is the excessive reliance on foreign workers. Kangasniemi et al.’s (2012) study reveals that foreign workers exhibit a positive long-run effect on total factor productivity in the United Kingdom by employing the ARDL method, whereas a negative effect exists in Spain. The impact of foreign workers in construction and personal services exhibits a negative or neutral contribution to labor productivity growth in the United Kingdom, while the effect is negative in Spain (i.e., agriculture and construction). Thangavelu (2016) found that foreign workers contribute to manufacturing productivity; however, their influence is significantly less than that of local workers. Other findings indicate that unskilled foreign laborers are likely to experience a slight decline in long-term output growth (Awad et al., 2018). Another finding by Chen et al. (2021) demonstrates that highly skilled foreign labor improves financial performance and fosters innovation.
Regarding the effect of educational attainment, previous studies have shown that education not only affects productivity (Aljarallah & Angus, 2020; Benos & Karagiannis, 2016; Lin, 2003; Pudasaini, 1983; Shahiri et al., 2023; Viswanath et al., 2009; Wei & Hao, 2011) but also enhances economic growth and development in relevant studies (Anastasios et al., 2019; Barro, 2001; Ganegodage & Rambaldi, 2011; Gyimah-Brempong, 2011; Hanushek & Kimko, 2000; Hii & Lau, 2024; Jalil & Idrees, 2013; Tsai et al., 2010; Yan, 2011). Hanushek and Kimko (2000) reveal that the extent of labor force differences is related to schooling; it has a stable, consistent, and strong relationship, which has a causal impact on economic growth. The results also exhibit strong evidence that the performance of international tests is associated with productivity differences. Aljarallah and Angus (2020) reported that productivity positively impacts education. Likewise, human capital not only strengthens job performance in the Malaysian Navy sector but also elevates labor productivity (Shahiri et al., 2023). Benos and Karagiannis (2016) assert that human capital has a strong positive relationship with labor productivity through both upper secondary and tertiary education. In contrast, primary education demonstrates a negative relationship, while lower secondary education shows no discernible connection with productivity. Lin (2003) demonstrates that education substantially contributes to output growth in Taiwan, with an estimated increase of approximately 0.15% for each additional year of average schooling; educational attainment enhances productivity, augments income levels, reduces the risk of poverty, and improves overall living standards. Lee (2005) observes that the lower productivity performance of the service industries influences productivity growth in the aggregate economy of Korea. Pudasaini (1983) points out that education engenders higher productivity, especially in modern agriculture relative to the traditional approach in Nepal. The study also reports that higher educational levels play a significant role in modernized agriculture compared to traditional agriculture.
Following this argument, Barro (2001) established that elevated educational attainment correlates with a more skilled and productive workforce, thereby fostering economic growth and development—signifying that education is imperative for a nation’s economic progress, as it bolsters the competitiveness required for maintaining economic growth. Similarly, Viswanath et al. (2009) assert that a strong positive relationship exists between human capital investment and economic growth. Basically, education is regarded as the foremost component of human capital, as higher education enhances it, thereby increasing productivity and, on average, generating greater added value. Shindo (2010) also observed that Jiangsu and Liaoning achieved greater economic growth due to increased government subsidies for education. The rise in government funding for education encourages individual investment in human capital, thereby accelerating economic growth. However, Jalil and Idrees (2013) highlighted that education, evaluated across the three levels of primary, secondary, and tertiary, positively influenced the economic growth of Pakistan during the period from 1960 to 2010. Dempere et al. (2023) pointed out that a positive relationship between GDP and human capital and research was observed in only three of the seven years (i.e., 2015, 2017–2018). The findings of a study by Tsai et al. (2010) confirm that secondary education plays a substantial role in economic growth in developing countries relative to developed countries. Furthermore, tertiary education is crucial for promoting economic growth in both developing and developed nations. Some studies, such as Tsai et al. (2010), have found that secondary education is a bigger contributor to economic growth, especially in developing countries.
A study by Yan (2011) concludes that education both significantly influenced economic growth in the short term and played a substantial role in the long term during the period 1990–2009 in China. Nonetheless, educational attainment and working experience have a slight influence on employment quality for women. A significant number of highly educated individuals remain unemployed due to insufficient job opportunities. Enhancing the skills and education of workers residing in rural areas can empower them to take advantage of expanding employment opportunities in India’s services sector (Reddy, 2014). Concurrently, additional findings reveal that both educational and income growth positively affected each other during the 2000–2010 period in West Virginia, United States (Bashir et al., 2012). The findings unequivocally demonstrate that higher levels of educational attainment are associated with enhanced economic growth, based on data from 93 countries—underlining that the effect of tertiary education surpasses that of secondary education, which in turn exceeds the influence of primary education (Agiomirgianakis et al., 2002).
Some studies (e.g., Ganegodage & Rambaldi, 2011; Tsai et al., 2010) underscore that secondary and tertiary education can positively affect economic growth, while others (e.g., Agiomirgianakis et al., 2002; Jalil & Idrees, 2013) point out that higher levels of educational quality are associated with higher economic growth—implying that the positive effect is based on the level of education. Nonetheless, Benos and Karagiannis (2016) demonstrate that primary education exhibits a negative relationship, while lower secondary education reveals no relationship with productivity. The relationship between education and economic growth is negligible (Malangeni & Phiri, 2018).
3. Methodology
The Solow–Swan model is an exogenous growth model that serves as an economic framework for long-term growth in the realm of neoclassical economics—a notable contribution of Solow (1956) and Swan (1956). This growth model underpins the econometric models employed in this research; the Cobb–Douglas production function is adopted, which Cobb and Douglas (1928) proposed. The model posits that the production function is structured due to the relationship between labor and knowledge (Becker, 1964; Romer, 1990), denoted by as the measure of effective labor units (Mankiw et al., 1992). refers to labor-augmenting knowledge or technology; thus, denotes effective labor. is knowledge that can increase productivity, and represents the number of workers (Ogunleye, 2015). To derive the educational quality of a labor equation, was applied; it denotes effective labor (Chu & Cozzi, 2016; Harris, 2021; Hii & Lau, 2024; Shen et al., 2021). In this study, low skill, defined as low educational attainment in line with MASCO 2020, was examined as knowledge that affects sectoral labor productivity. The estimation of the educational quality of the labor model is based on the Cobb–Douglas production function—spanning from 1991 to 2019. The investigation analyzes the productivity challenges arising from over-reliance on foreign labor and low-skilled local labor. Thus, the estimation models are designed to explore not only the asymmetric effects of foreign worker employment but also the effects of low educational attainment on labor productivity in Malaysian sectoral industries, as specified by the following equation:
where denotes the logarithm of sectoral labor productivity, represents the logarithm of employed foreign workers, refers to the logarithm of employed workers lacking formal education, denotes the logarithm of employed workers possessing primary education, and signifies the error term. Sectoral labor productivity is measured as value added per worker using World Bank data. In this study, industrial productivity specifically refers to value added per worker in the sectors of mining and quarrying, manufacturing, construction, and public utilities. Data on the workforce with low educational attainment was sourced from the Department of Statistics Malaysia (DOSM). The definition and measurement of the variables are described in Table 1.

Table 1.
Variable definition and measurement.
This study aims to examine the asymmetric effects of foreign worker employment on Malaysian sectoral labor productivity (i.e., agriculture, industry, and services) as well as the influence of low educational attainment—defined as the absence of formal education and only primary education attained—over the 1991–2019 period, in terms of the Cobb–Douglas production function. More specifically, this study aims to investigate the effects of employing foreign workers—both positive and negative changes—on labor productivity, as well as the impact on local low-skilled workers within the Malaysian sectoral industries. Accordingly, the NARDL model proposed by Shin et al. (2014) is employed in this study based on the following equation:
Equation (2) is estimated to be using the NARDL model. As per asymmetry or NARDL, employed foreign workers comprise two components—positive and negative. The two variables are established, namely , which denotes the partial sum processes of positive changes, and , which denotes the partial sum processes of negative changes in :
In accordance with Shin et al. (2014), this study’s nonlinear autoregressive distributed lag () model, derived from Equation (2), can be rewritten in relation to sectoral labor productivity as follows:
where , , and represent the autoregressive parameter, while the parameters of asymmetric distributed lag are and ; and ; and . is decomposed into and to formulate the nonlinear autoregressive distributed lag proposed by Shin et al. (2014). Our three NARDL models (i.e., Models 1, 2, and 3) include the concept of partial asymmetry for this study as rewritten in terms of the sectoral labor productivity in the following equations:
where ,, and denote the long-run coefficients of ; , , and represent the long-run coefficients of , while the short-run coefficients are represented by and ; and ; and . Next, employed workers with low educational attainment are also one of the independent variables in this study, which includes two low educational attainments: no formal education and primary education (e.g., Conway et al., 2010; Fisher et al., 2015). denotes the logarithm of Malaysia’s agricultural productivity, refers to the logarithm of Malaysian industrial productivity, and is the logarithm of Malaysia’s service productivity. Following Shin et al. (2014), the Wald statistics for the null hypothesis of long-run symmetry in this study is tested (i.e., , , ), as well as the short-run symmetry (i.e., , , = ). The research methodologies adopted in this study are the unit root and stationary test and the nonlinear autoregressive distributed lag (NARDL) model, which are estimated by EViews 12. The NARDL estimation includes the bounds test, error correction model, long-run coefficient, diagnostic tests, and dynamic multiplier graph, and the Wald test can also be applied in this study.
4. Results and Discussion
The descriptive statistics of the variables are presented in Table 2. Industrial productivity exhibits the highest mean, followed by service productivity. However, in comparison to other variables, the mean for employed workers lacking formal education is the lowest. The standard deviation is a measure of dispersion in the series—which underlines that the employed foreign workers have the highest standard deviation, followed by service productivity, whereas the employed workers with primary education have the lowest standard deviation. Positive skewness is observed only in workers lacking formal education, indicating that this distribution features a long right tail. Conversely, negative skewness highlights that the distribution has a longer left tail. The kurtosis of the normal distribution is 3, and no series exceeds this value—resulting in a flat distribution.
Table 2.
Descriptive statistics.
4.1. Unit Root and Stationary Tests
The three types of unit root tests employed in this study are the augmented Dickey–Fuller (ADF) test proposed by Dickey and Fuller (1979); the Phillips–Perron (PP) test proposed by Phillips and Perron (1988); and the Kwiatkowski, Phillips, Schmidt, and Shin (KPSS) test proposed by Kwiatkowski et al. (1992). Table 3 presents the suggested results of the unit root and stationary tests for Models 1–3 from the ADF, PP, and KPSS tests. The results of the unit root tests affirm that all variables, including LPRODA, LPRODI, LPRODS, LEF, LENOF, and LEPRI, are concluded to be stationary at the first difference, which is I(1) variables, based on the results of the ADF, PP, and KPSS tests.
Table 3.
Results of unit root and stationary tests.
4.2. Nonlinear ARDL Bounds Test for Cointegration
Table 4 reveals the results of the NARDL bounds testing approach for Models 1–3 over the 1991–2019 period, where k denotes the quantity of independent variables employed in this study. The F-statistic value of Model 1 is indicated as 13.540, as shown in Table 4, which is greater than the critical value of the upper bound proposed by Pesaran et al. (2001) at the 1% significance level, implying that the null hypothesis of no cointegration is rejected. The results of Model 1 confirm the existence of an asymmetric (cointegrating) long-run relationship between agricultural productivity and the independent variables (employed foreign workers) from 1992 to 2019. The optimal lag length selection is the NARDL (1, 2, 1, 3, 0) model, which is selected based on the Akaike information criterion (AIC).
Table 4.
Results of NARDL bounds testing approach.
The calculated F-statistic value of Model 2 is presented as 4.242; this implies that the results reveal the existence of a long-run relationship between industrial productivity and independent variables during the 1991–2019 period. The optimal lag length selection is the NARDL (1, 0, 2, 0, 2) model, which is also designated based on the AIC. Next, the F-statistic value of Model 3 is shown as 4.131, which is larger than the critical value of the upper bound proposed by Pesaran et al. (2001) at the 5% significance level. The results of Model 3 demonstrate the existence of asymmetric cointegration between the dependent variable (service productivity) and independent variables throughout the study period based on the NARDL bounds test. The optimal lag length selection for Model 3 is the NARDL (1, 2, 1, 2, 1) model, and it is nominated based on the AIC.
4.3. NARDL Long-Run Estimates
The results affirm that both the positive and negative components of employed foreign workers are obtained through NARDL for Models 1–3. The NARDL bounds testing approach results of Models 1–3 are presented in Table 4, indicating that a long-run relationship exists between the dependent and independent variables. Next, the long-run estimation results of Model 1 based on NARDL, as presented in Table 5, reveal that only LEF_POS and LEPRI have a positive and statistically significant effect on LPRODA at the 1% level. This result indicates that positive changes in employed foreign workers positively influence agricultural productivity, with a coefficient of 0.112.
Table 5.
Results of NARDL long-run estimates.
The positive changes in employing foreign workers by 1% will result in an increase in agricultural productivity of approximately 0.112%. This finding aligns with the study by Hii and Lau (2024), which showed that foreign labor positively impacts agricultural output. Furthermore, workers with primary education negatively impact agricultural productivity, as evidenced by a coefficient of −0.603. A rise of one percent in workers with primary education results in a decline in agricultural productivity of about 0.603%. This finding is consistent with studies conducted by Benos and Karagiannis (2016), whereas this result contradicts other findings (e.g., Gyimah-Brempong, 2011; Wei & Hao, 2011), which assert that primary education positively influences development outcomes. The long-run estimation results of Model 1 affirm that LEF_NEG has a negative and statistically significant effect on LPRODA at the 5-percent level. This result reveals that negative changes in employed foreign workers negatively affect agricultural productivity, with a coefficient of −0.112—signifying that negative changes in employed foreign workers by 1% will lead to a diminution in agricultural productivity by approximately 0.112%.
Additionally, the bounds test results of Model 2 based on NARDL reveal the absence of a long-run relationship between dependent and independent variables. This is because it fails to reject the null hypothesis; the p-value is greater than the 5% significance level. The long-run estimation results of Model 2 disclose that the variables LEF_POS, LEF_NEG, and each LENOF have a positive effect on LPRODI, while only LEPRI negatively impacts LPRODI in the long term. These results are statistically insignificant. Moreover, the long-run estimation of Model 3 highlights that only LEF_NEG and LENOF exert a statistically significant long-run effect on LPRODS at the 5-percent significance level (see Table 5). However, the result confirms that LEF_POS and LPRI have a statistically insignificant long-run effect on LPRODS due to the p-value being greater than 0.05. The long-term estimation results indicate that LEF_NEG has a positive effect on LPRODS, with a coefficient of 1.957 in the long run. A one-percent negative change in employed foreign workers will lead to an increment in service productivity by around 1.957%. The result of the long-run estimation affirms that LENOF exerts a negative and statistically significant effect on LPRODS, with a coefficient of −1.576. A one-percent increase in employing workers lacking formal education will result in a long-term decline in service productivity of approximately 1.576%.
4.4. NARDL Error Correction Representation and Diagnostic Tests
Table 6 presents the short-run results of the NARDL obtained by using the NARDL model proposed by Shin et al. (2014). The results of Model 1 highlight that LEF_POS has a positive and statistically significant effect on LPRODA in the short term. The estimated coefficient of LEF_POS is statistically significant at the 1% level. This result implies that positive changes in employed foreign workers positively influence agricultural productivity, as demonstrated by a coefficient of 0.240. The positive changes in employed foreign workers are 1%, leading to a 0.240% rise in agricultural productivity. The error correction term (ECT) measures the speed of adjustment, comprises a negative sign, and is statistically significant at the 1-percent significance level. The ECT coefficient of −0.945 signifies that the adjustment speed for the variable to attain long-run equilibrium is approximately 94.5% annually.
Table 6.
NARDL estimation results.
Results from Model 2 indicate that LEF_NEG exerts a positive effect on LPRODI in the short run. Specifically, the negative changes in foreign workers employed by 1% resulted in an increment in industrial productivity of about 0.397%. However, the results indicate that the estimated coefficient of the LEF_NEG is statistically insignificant because the p-value is greater than the 5% significance level. The ECT coefficient is −0.458, signifying that the adjustment speed for the variable to reach long-run equilibrium is approximately 45.8% annually. The results of Model 3 confirm that LEF_POS exerts a positive and statistically significant effect on LPRODS in the short run, and the coefficient is statistically significant at the 1% level. This means that the positive changes in employed workers have a short-term positive effect on service productivity, as evidenced by a coefficient of 0.213 spanning the period 1991–2019.
This result demonstrates the one-percent positive change in employed foreign workers, leading to an increment in service productivity of roughly 0.213%. The short-run results of NARDL for Model 3 reveal that LEPRI adversely impacts LPRODS, exhibiting a coefficient of −0.614. This result affirms that a one-percent rise in the employment of workers with primary education leads to an approximate decline of 0.614 in service productivity. In line with the findings of Benos and Karagiannis (2016), primary education indicates a negative relationship with productivity. This result is contrary to a study by Gyimah-Brempong (2011), which states that primary education positively impacts development outcomes. Meanwhile, the short-run results also reveal that LEF_NEG has a positive effect on LPRODS, indicated by a coefficient of −0.235; the result is not statistically significant. LENOF demonstrates a slightly positive effect on LPRODS, with a coefficient of 0.014; the estimated coefficient of LENOF is not statistically significant during the sample period.
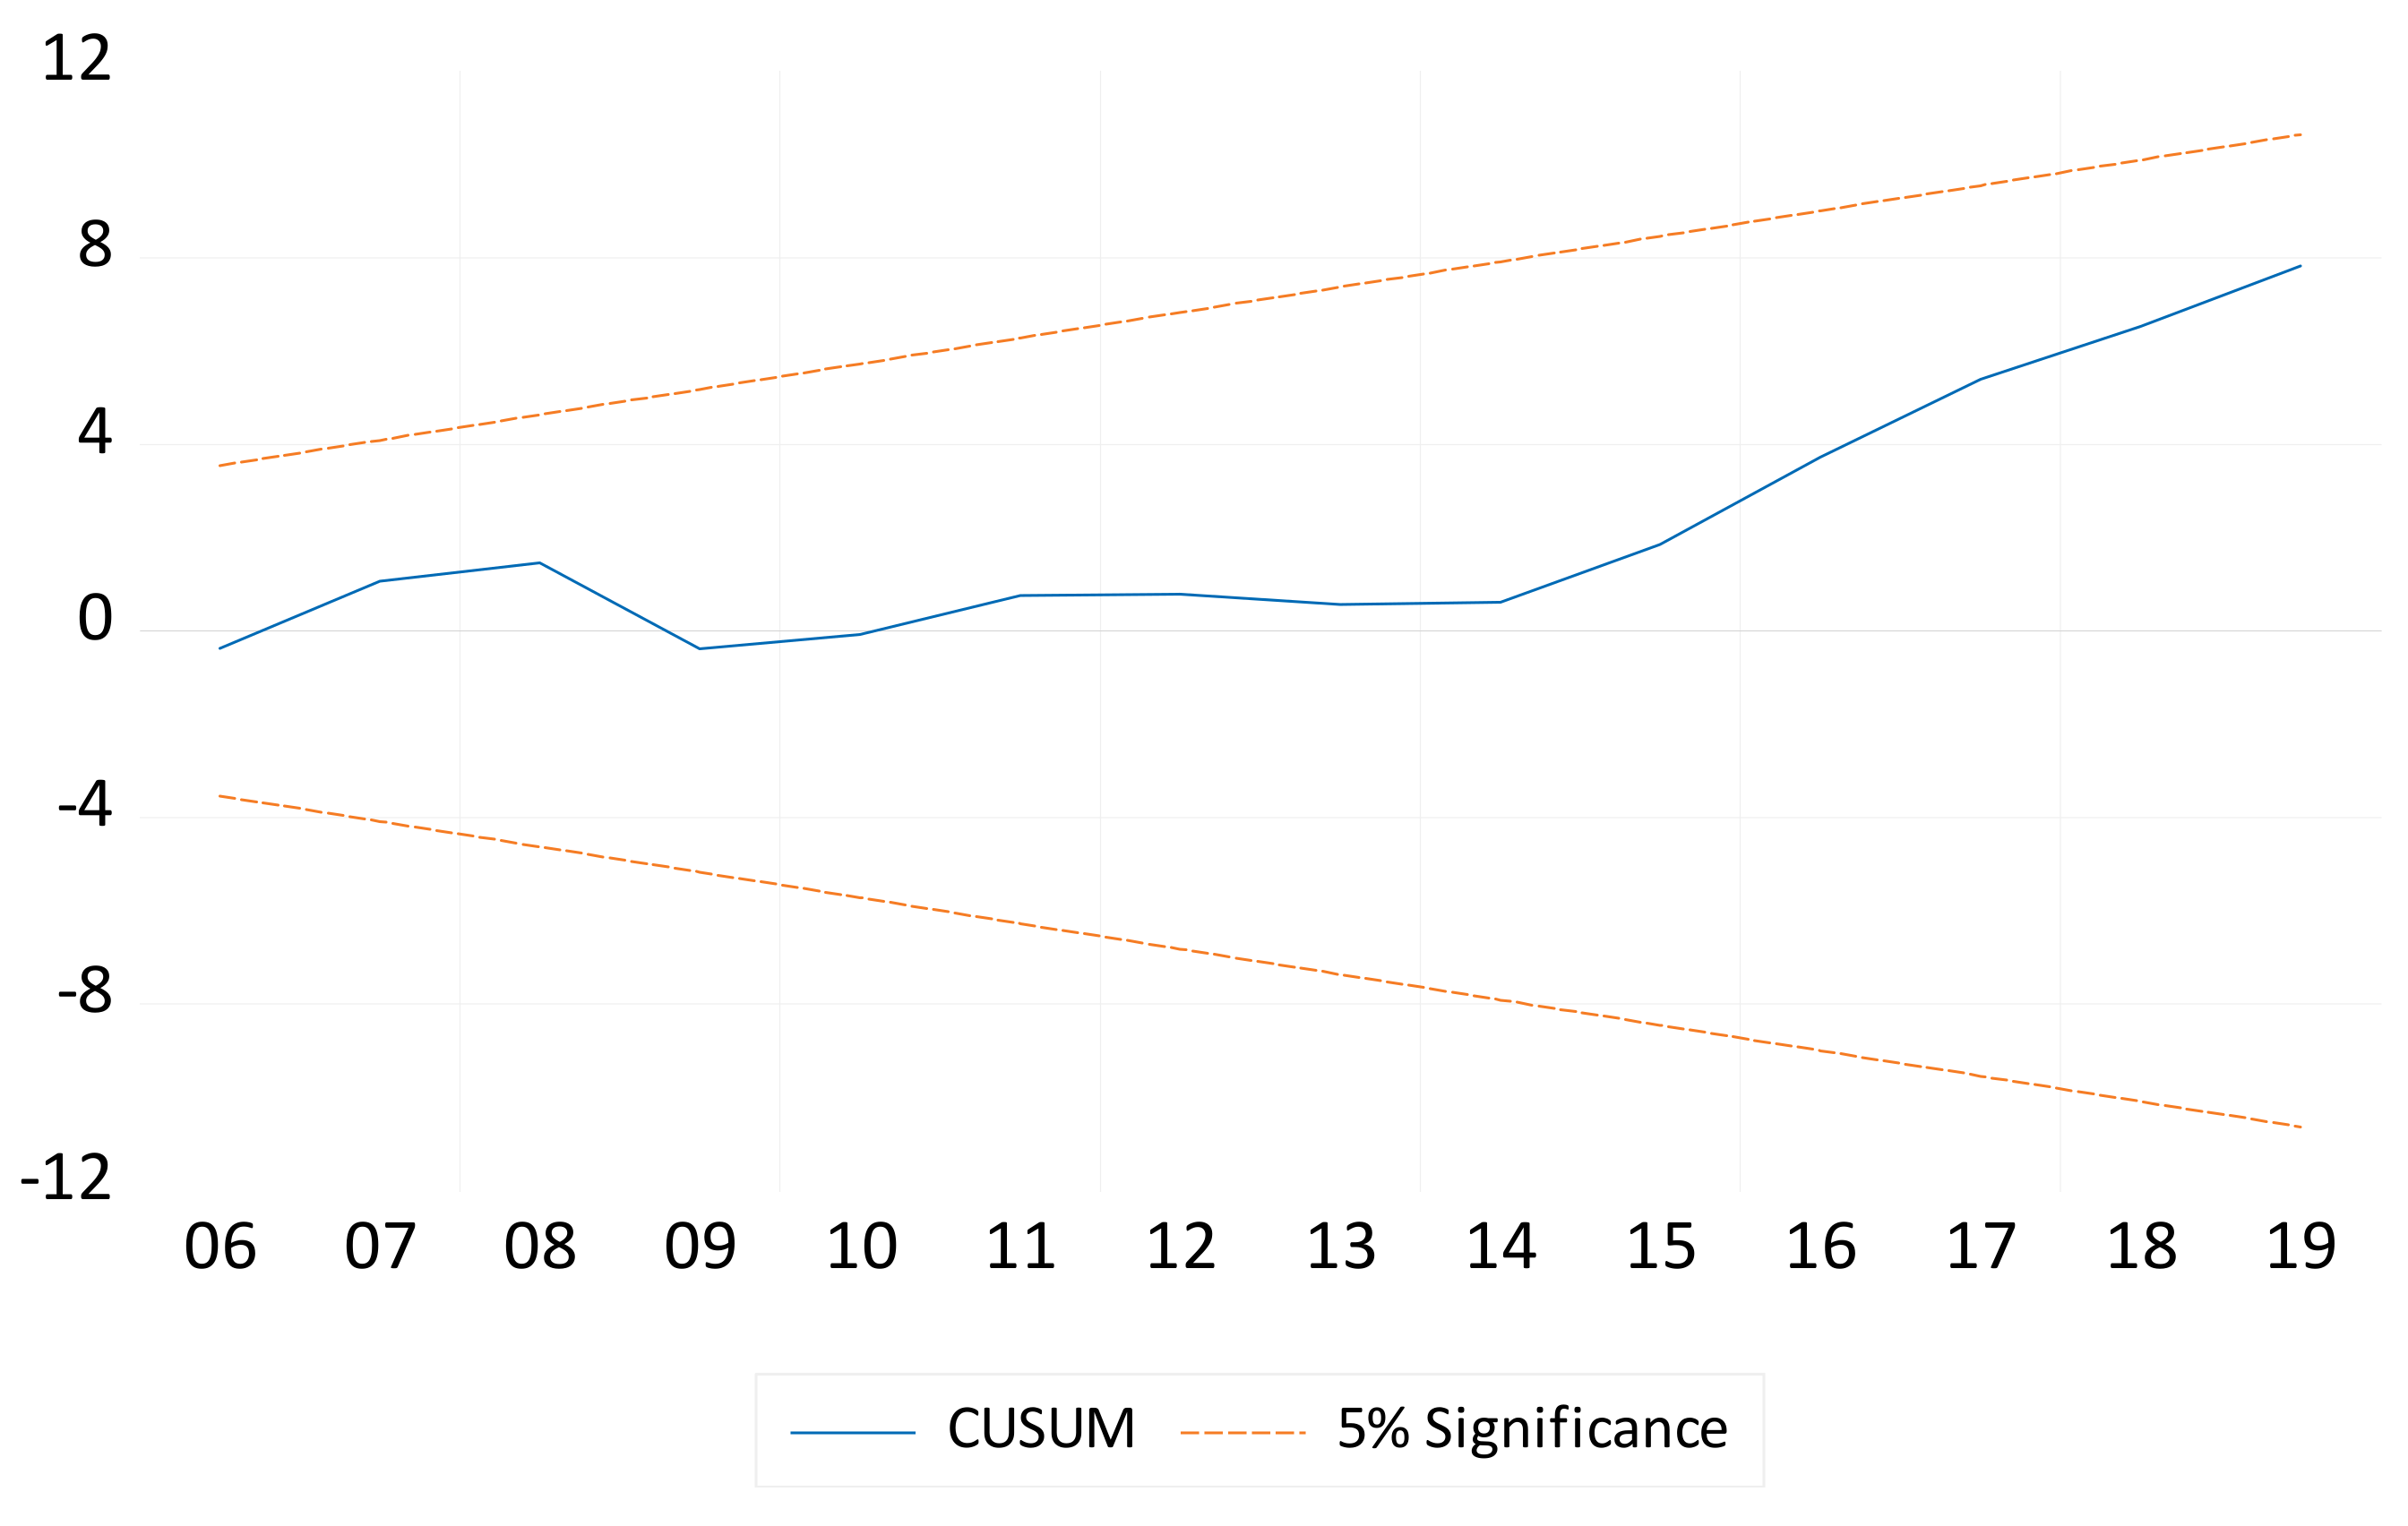
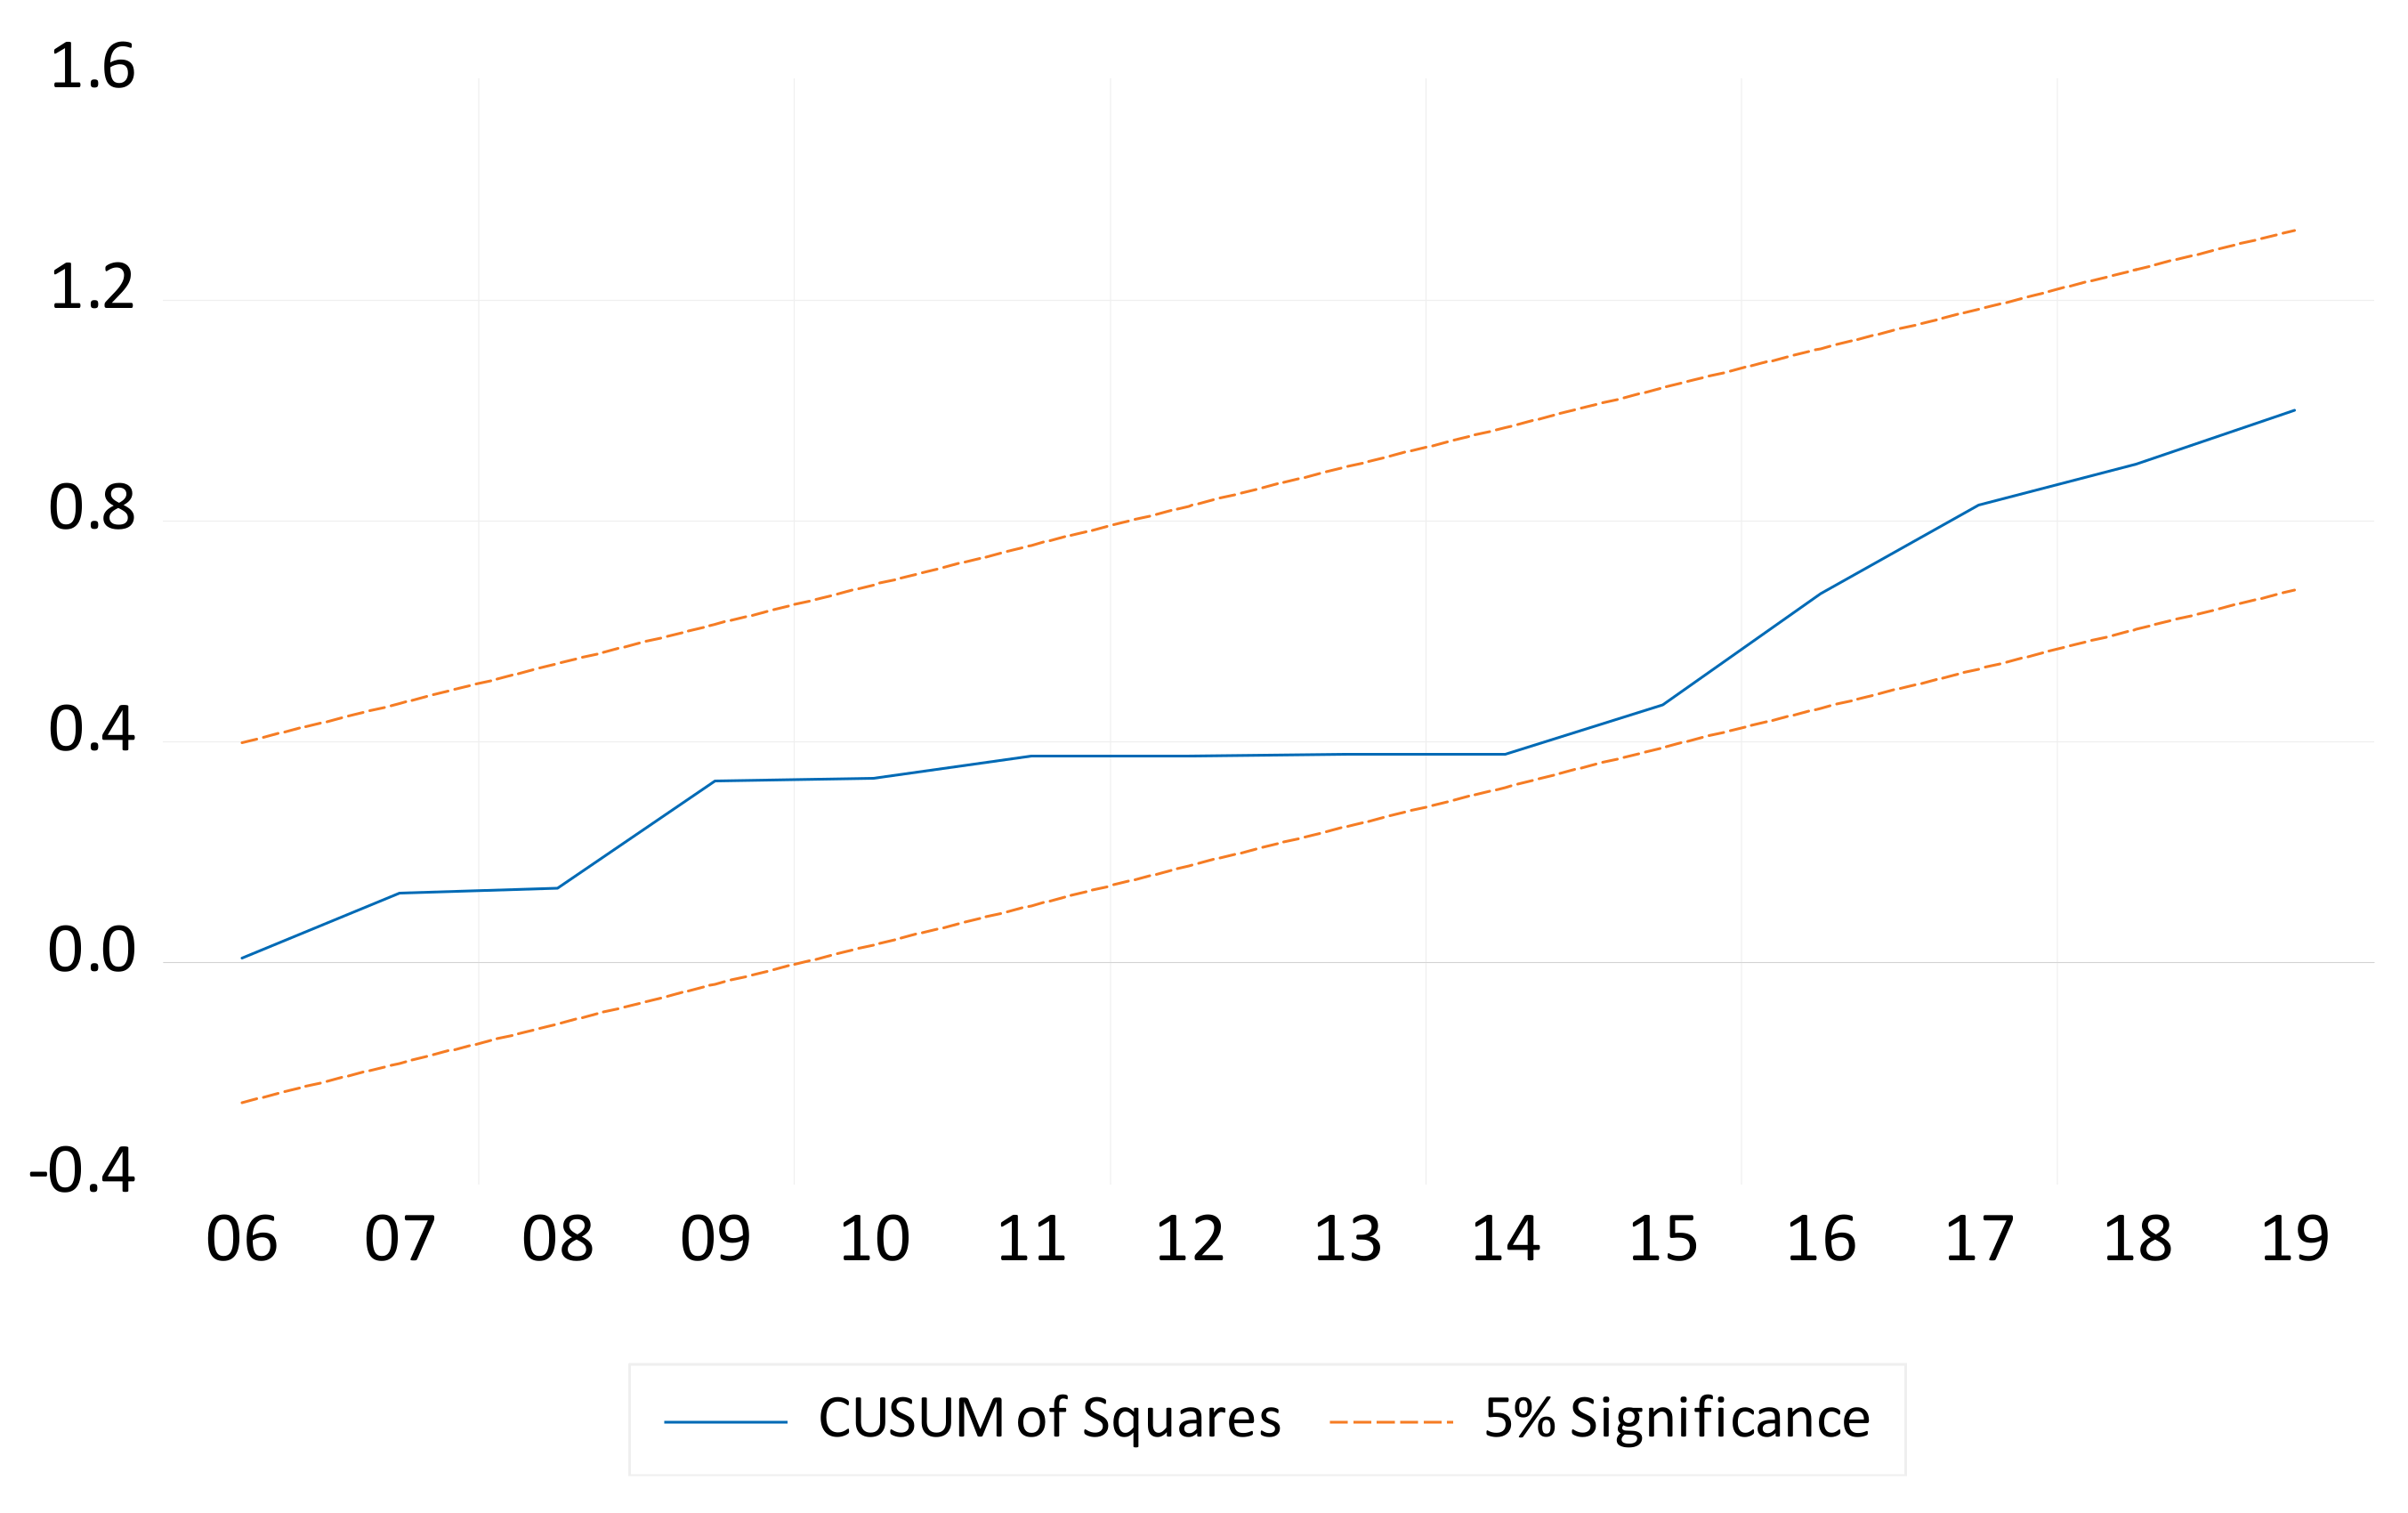
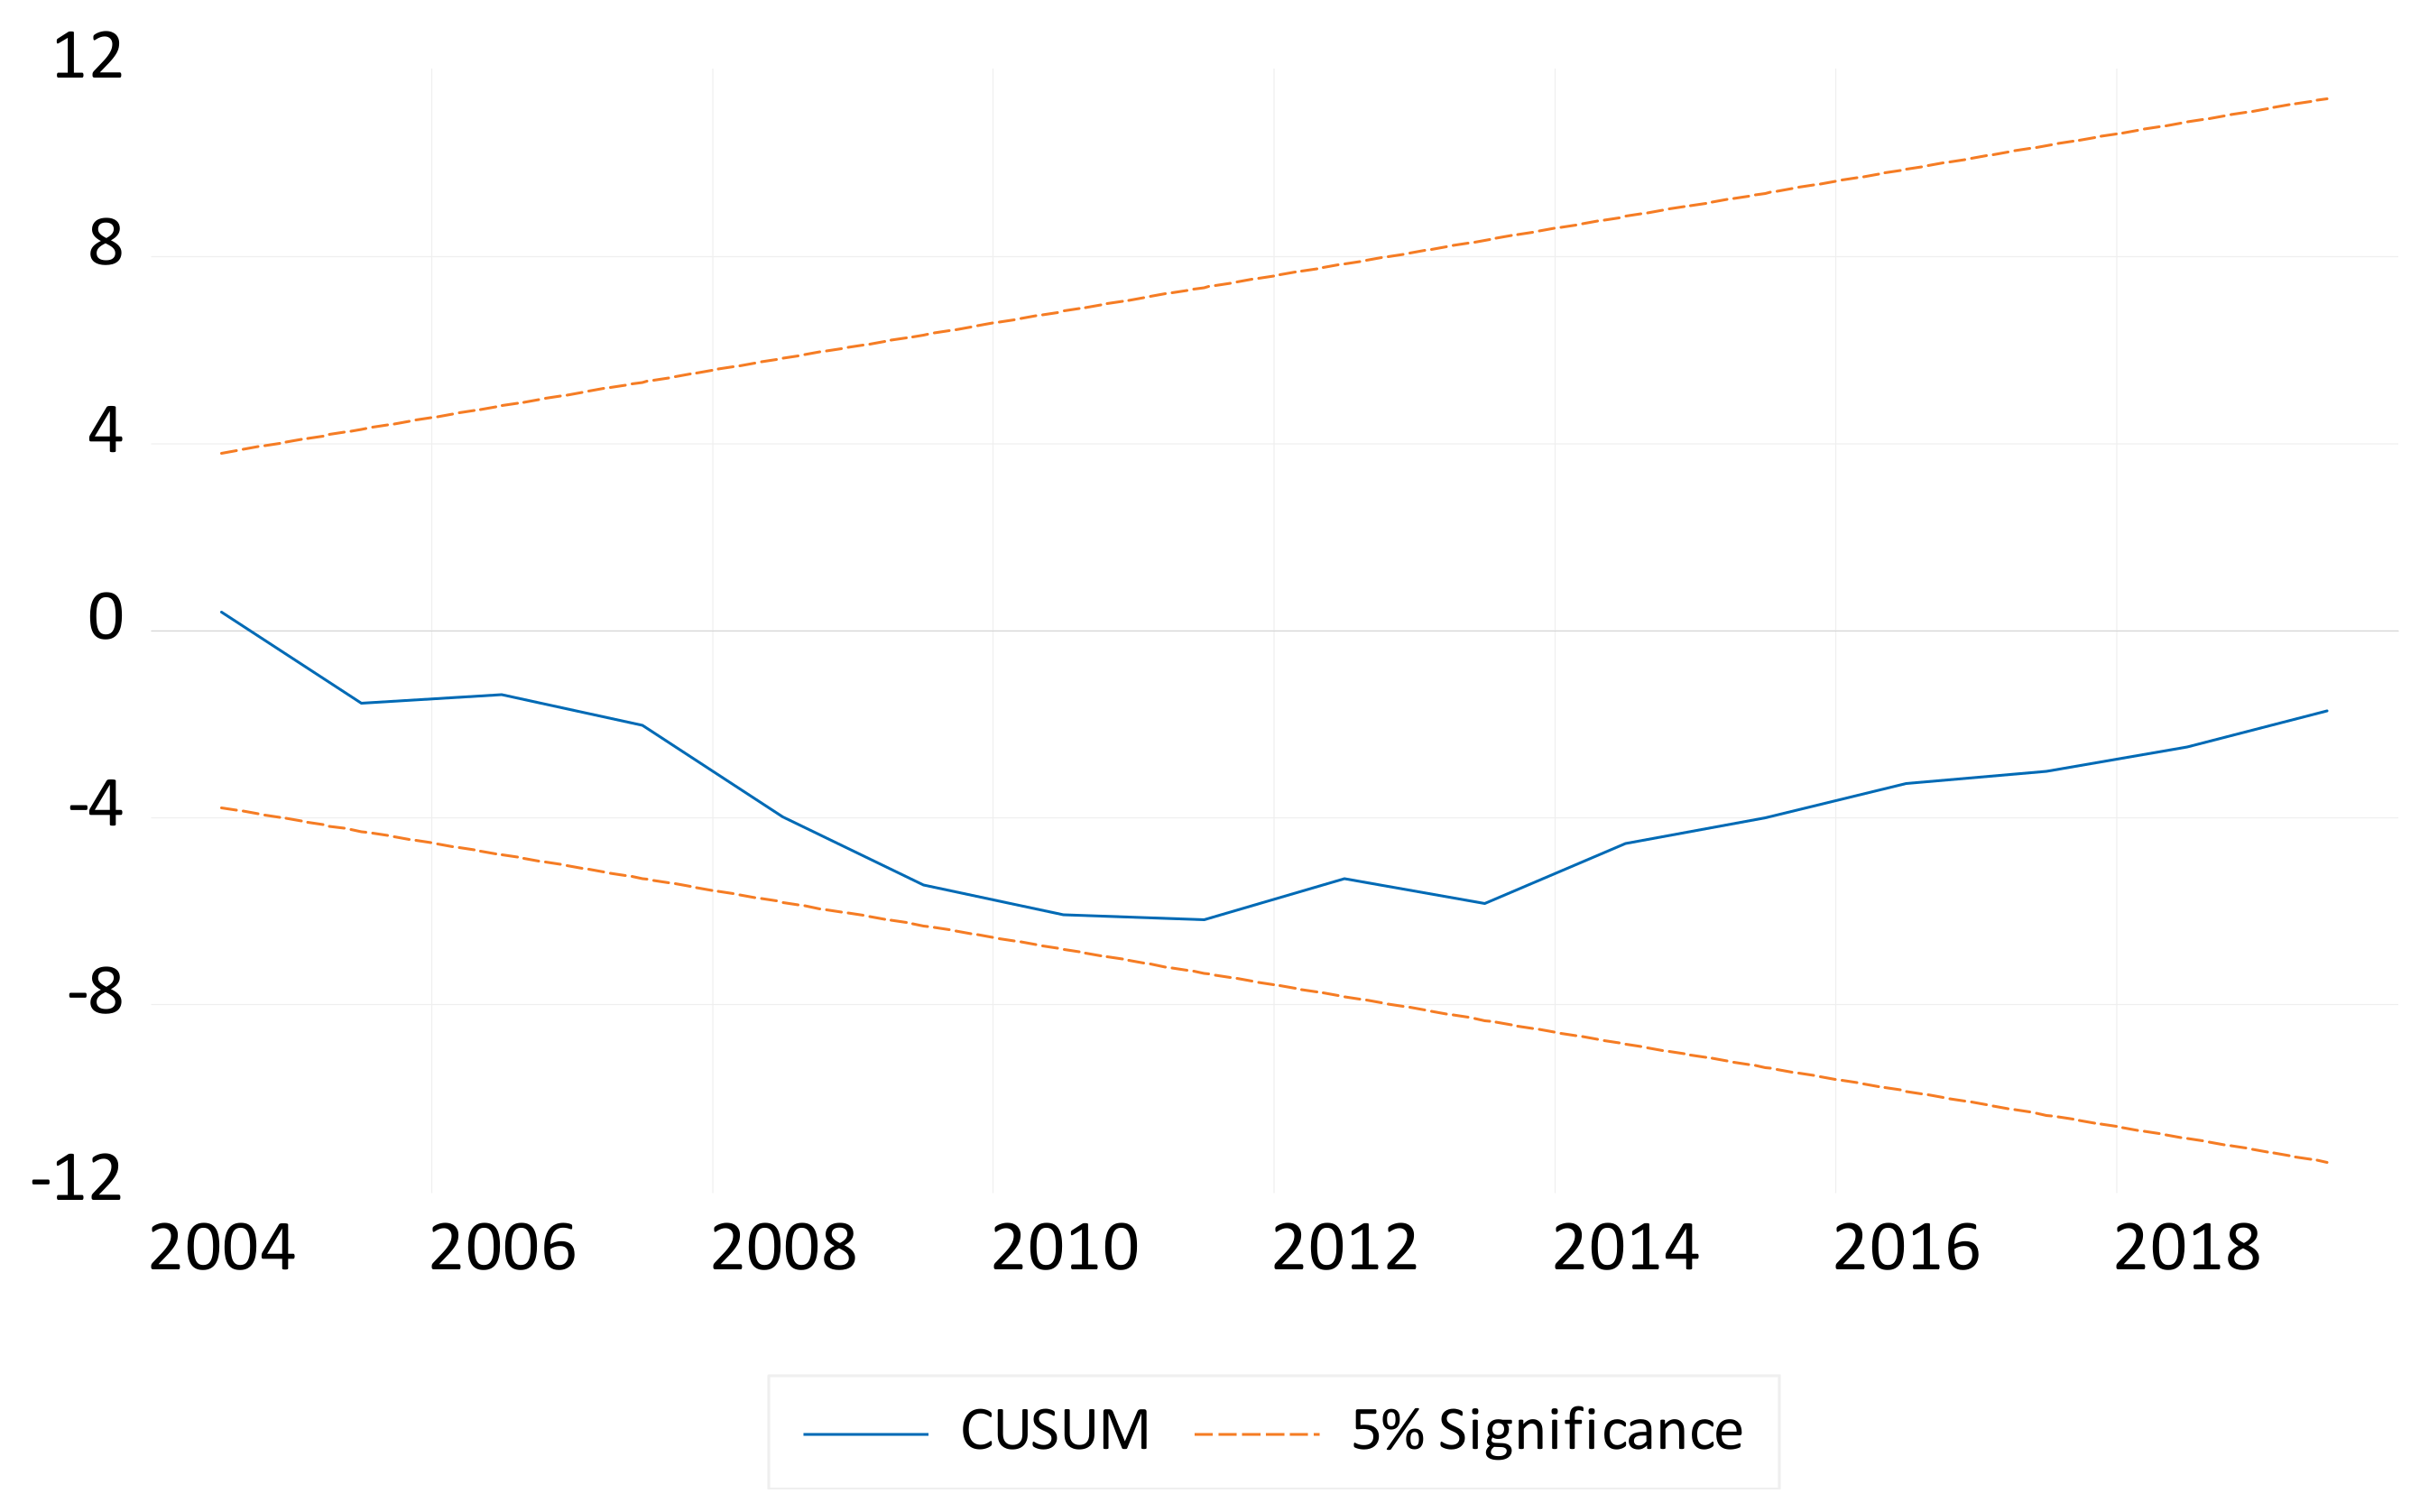
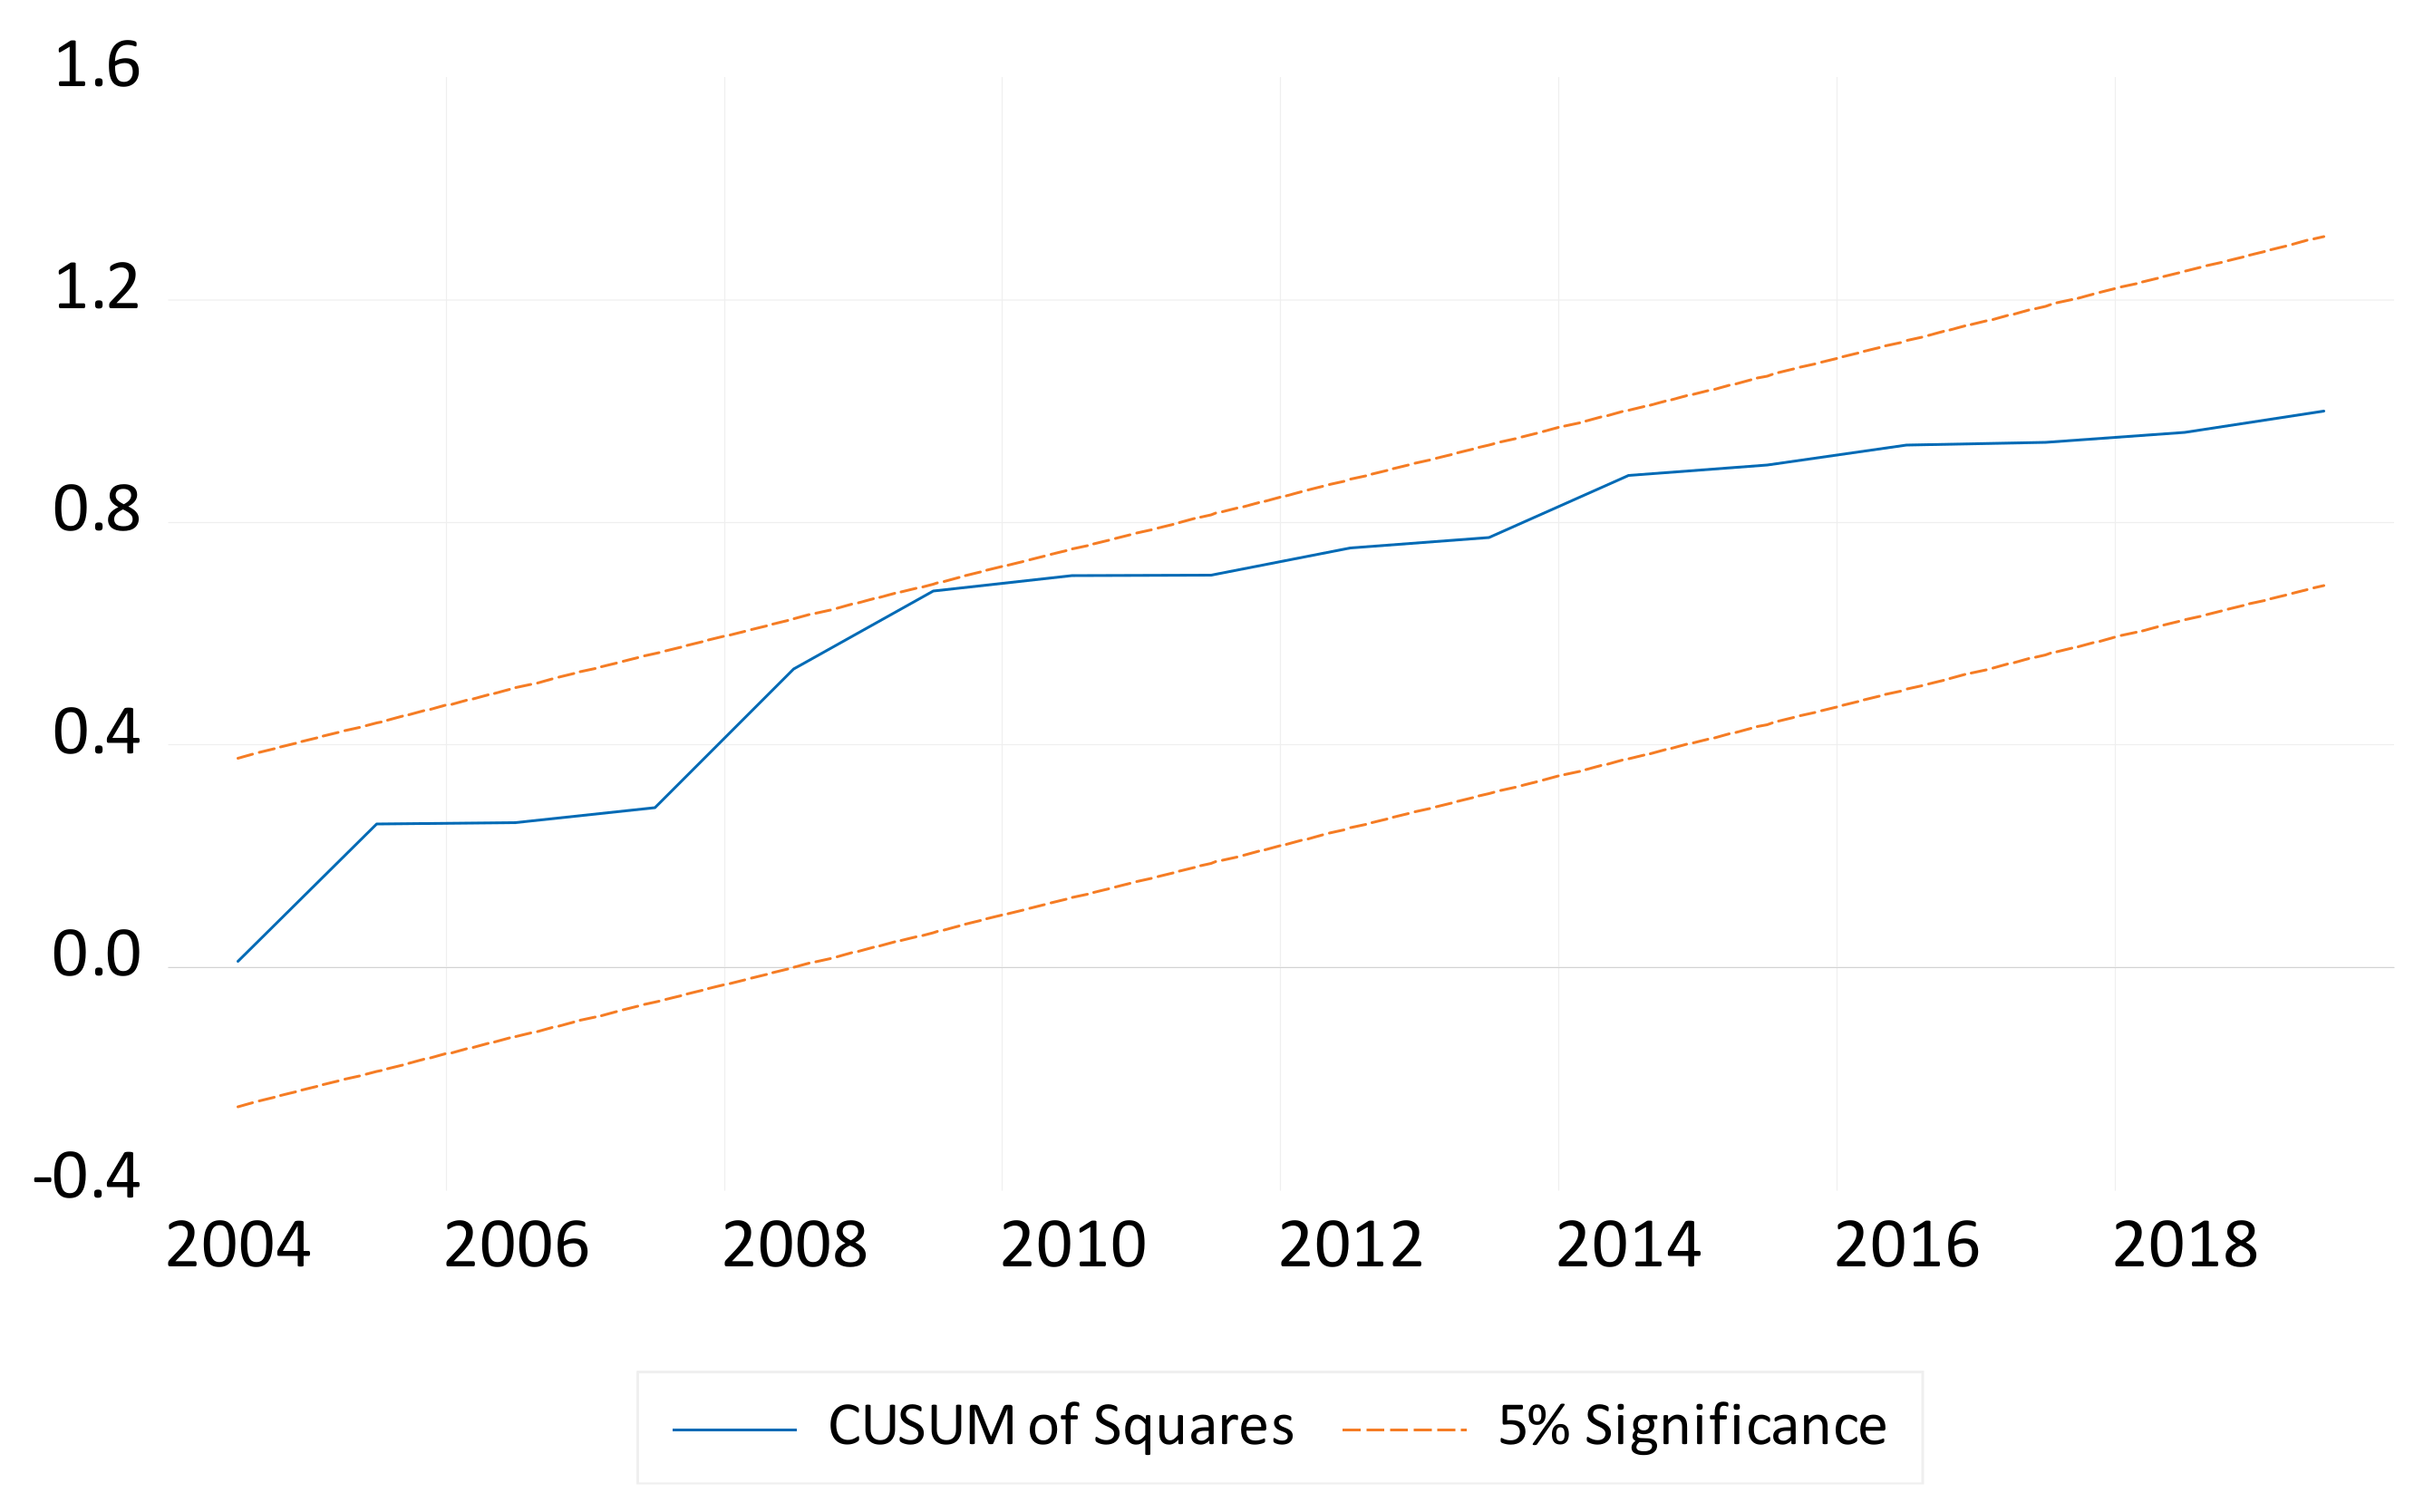
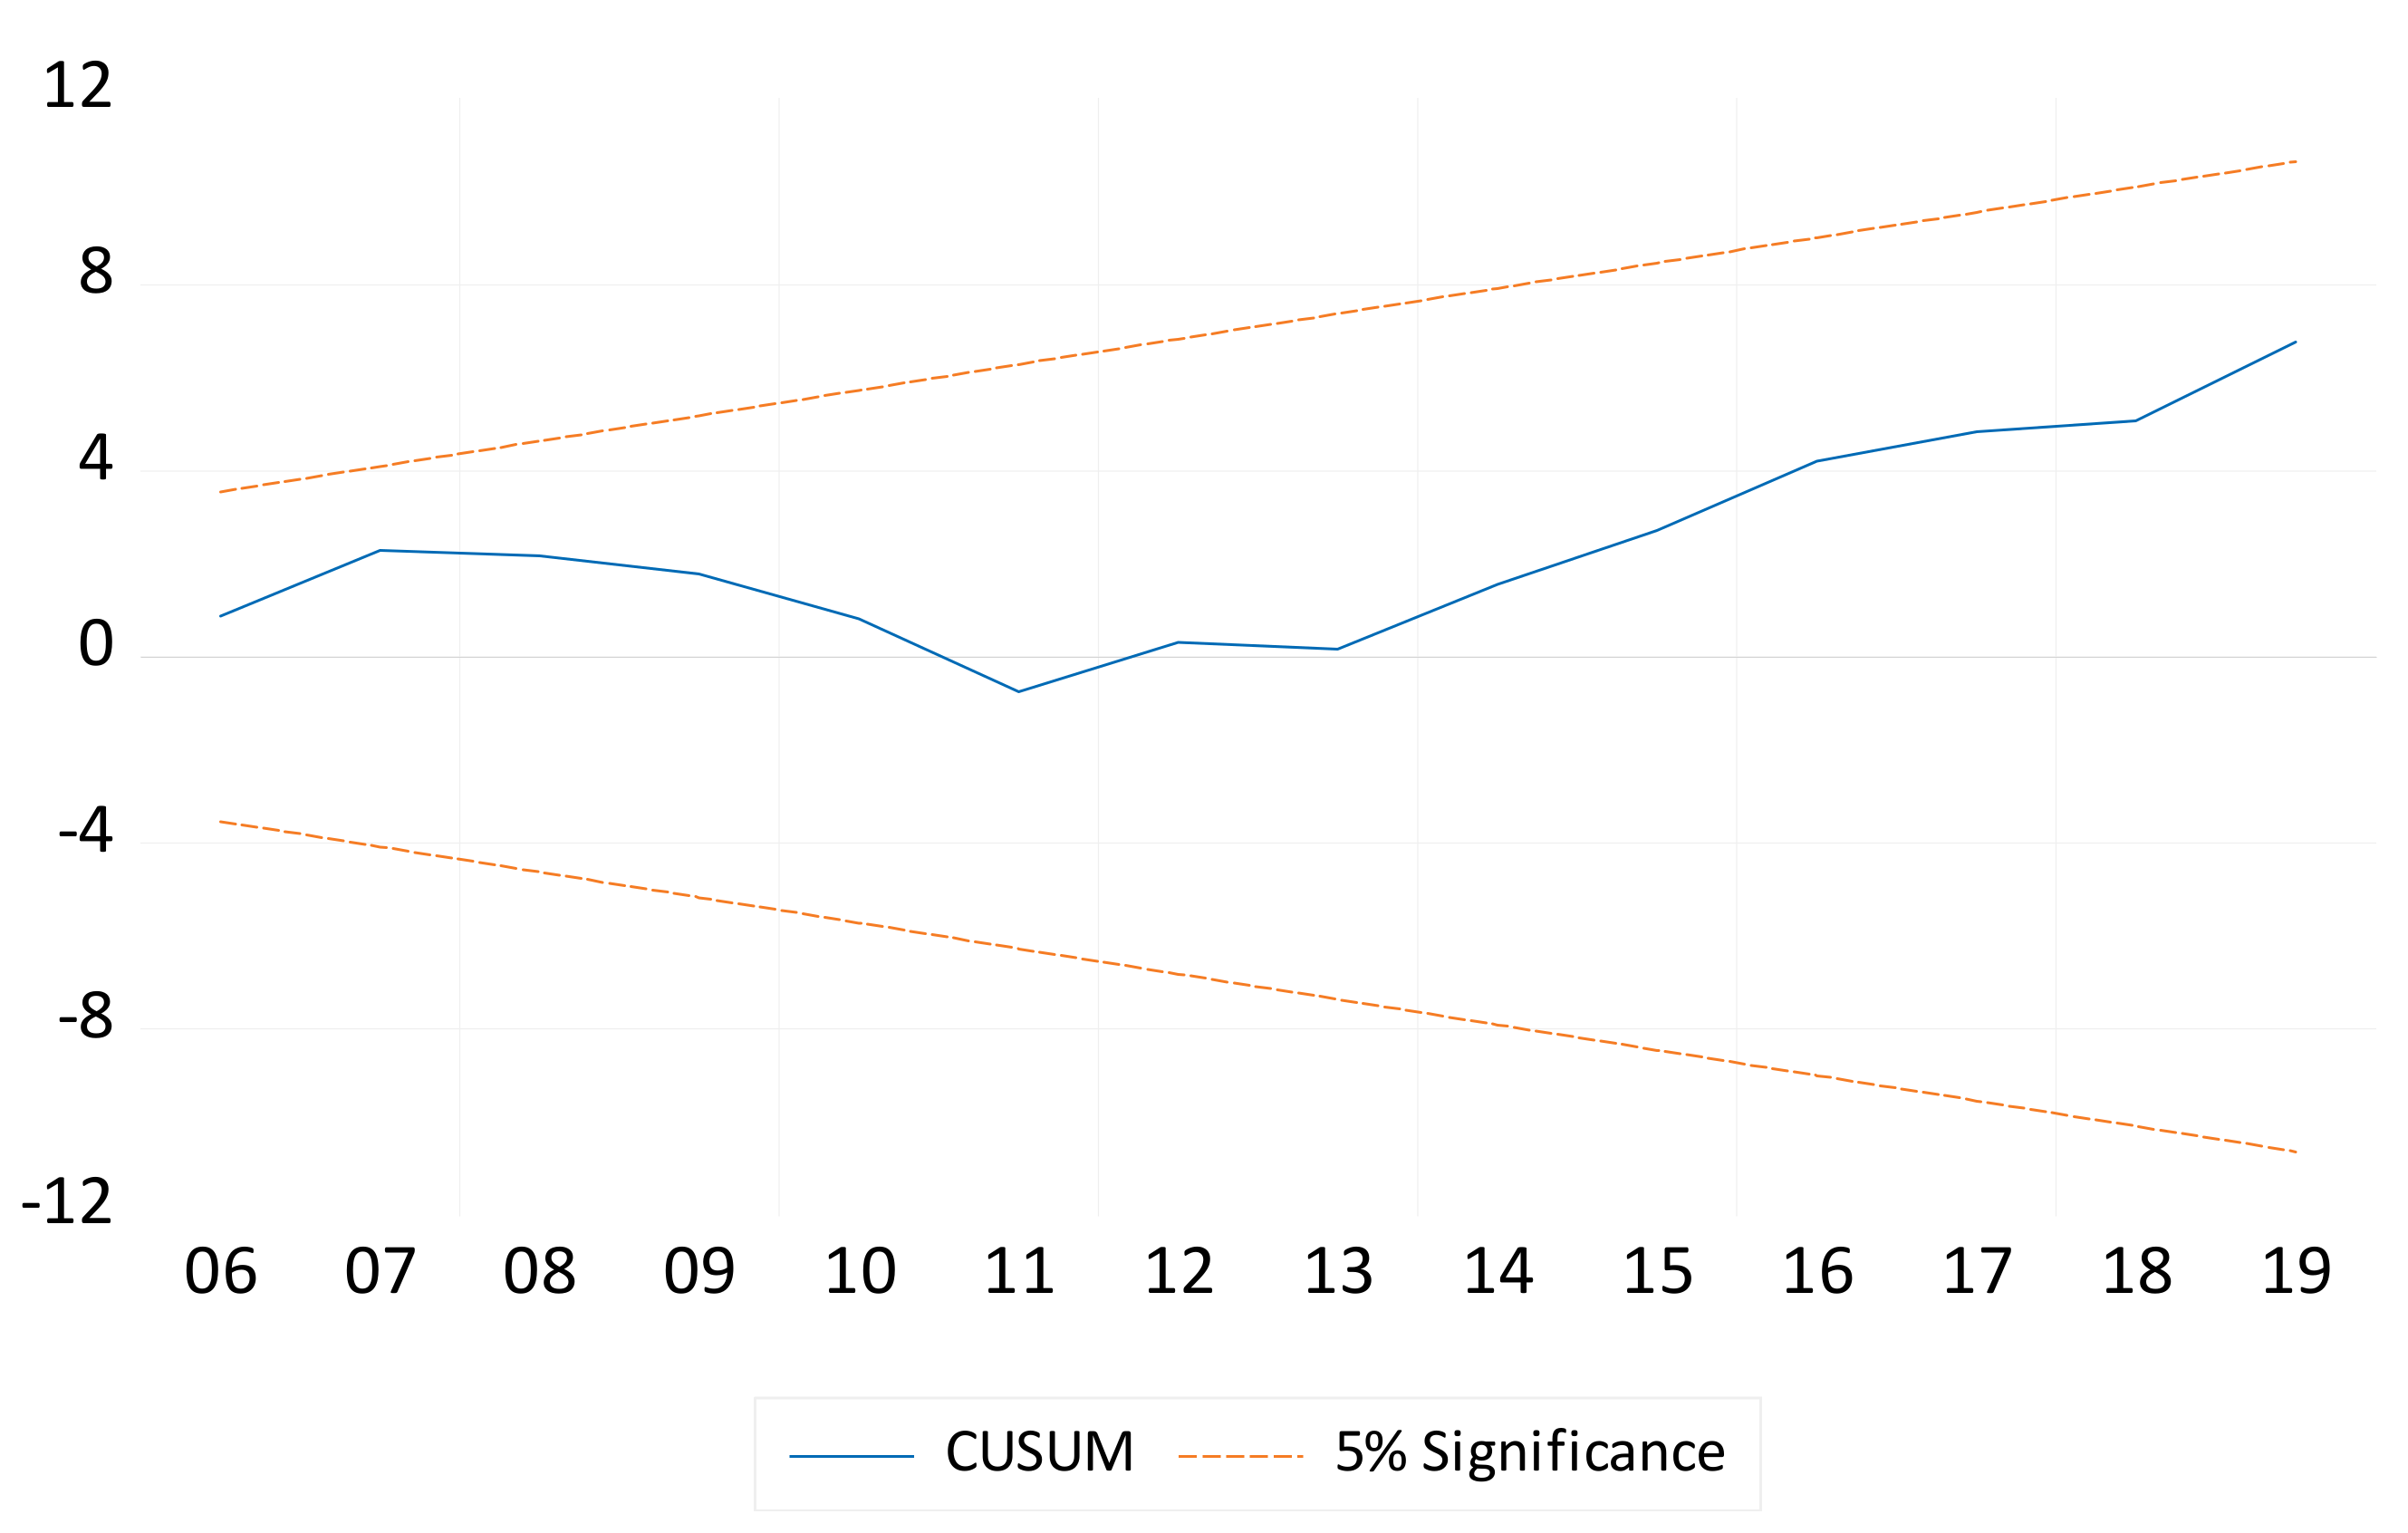
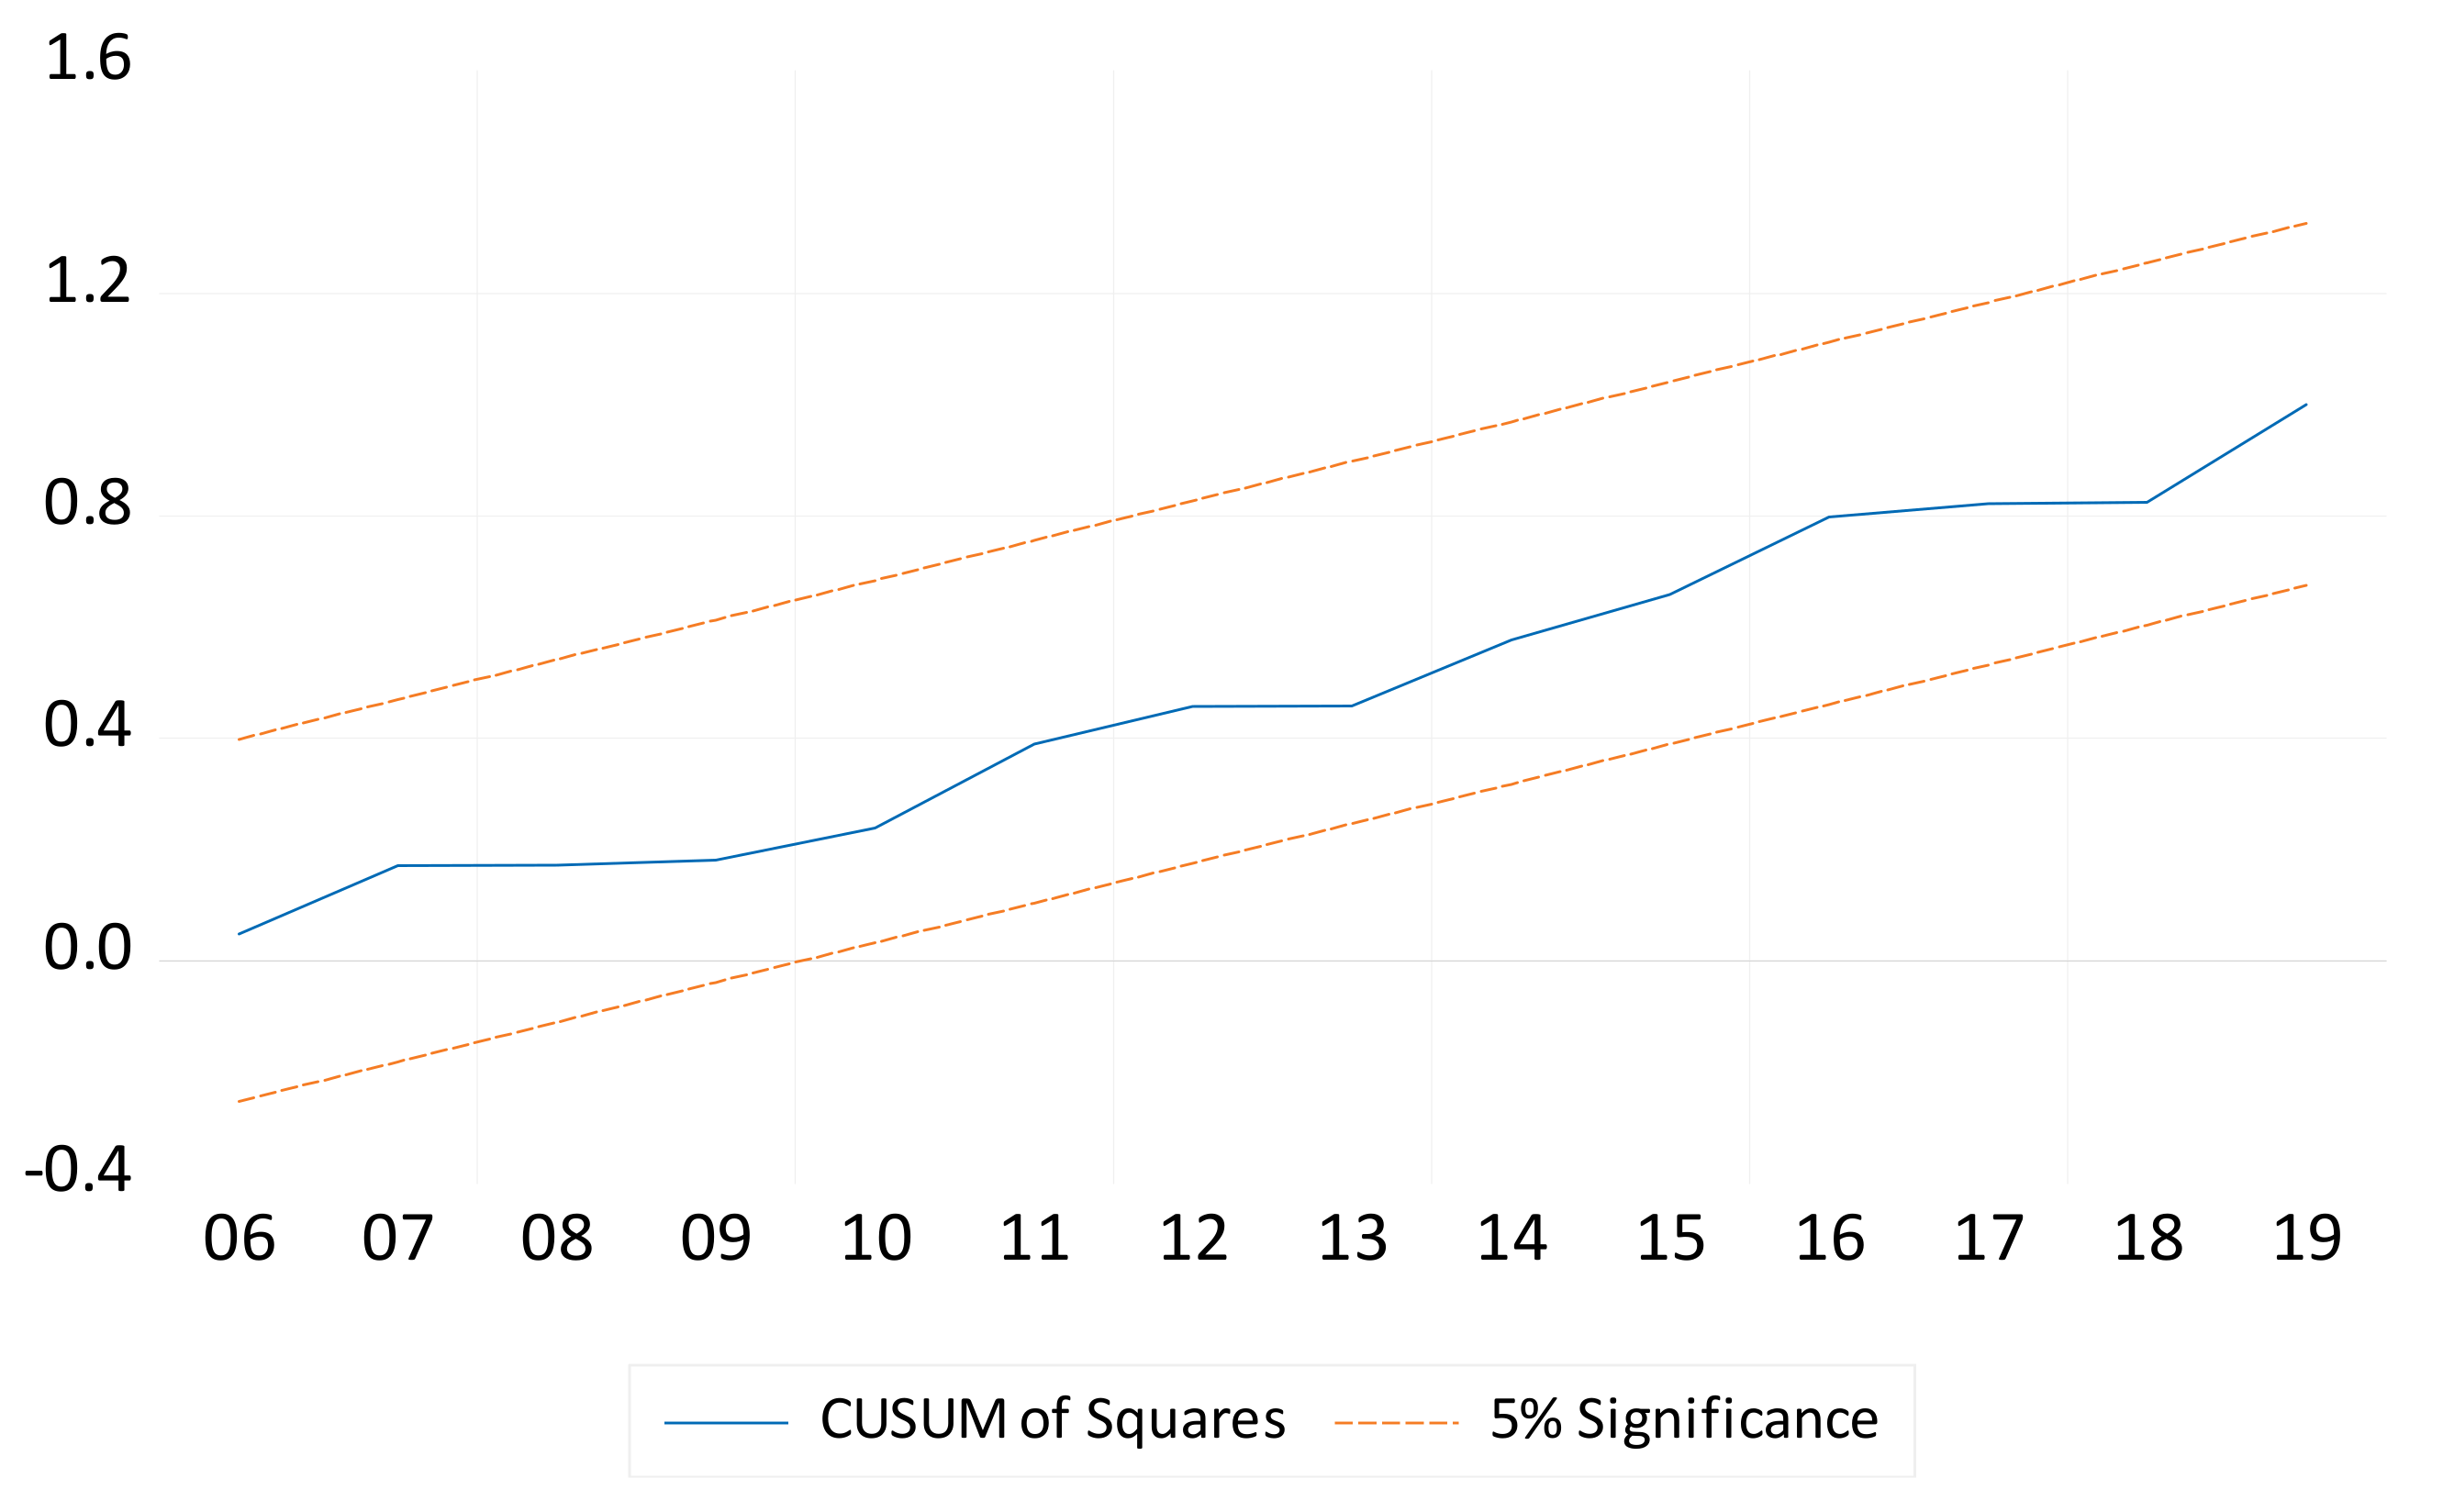
Next, Table 6 presents the results of the diagnostic tests, indicating all the probabilities are greater than 0.05; therefore, it fails to reject the null hypothesis. This evidence underscores that Models 1–3 pass all the diagnostic tests where the residuals are normally distributed; there is no serial correlation problem, the variances are homoscedastic, and there is no misspecification. The mean VIF from the three models is below the commonly accepted threshold of 5.0 (Hair et al., 2010), suggesting moderate but acceptable levels of multicollinearity. Since none of the individual VIFs exceed 10.0, the model does not exhibit severe multicollinearity (Gujarati & Porter, 2009). Likewise, the results of the cumulative sum of recursive residuals () and cumulative sum of squares of recursive residuals () reveal that all the equations for Models 1–3 are stable (see Figure 1, Figure 2, Figure 3, Figure 4, Figure 5 and Figure 6). The results indicate that all three models remain stable where the blue line lies within the 95% confidence interval. The 95% confidence interval was represented by the thin red dashed lines.
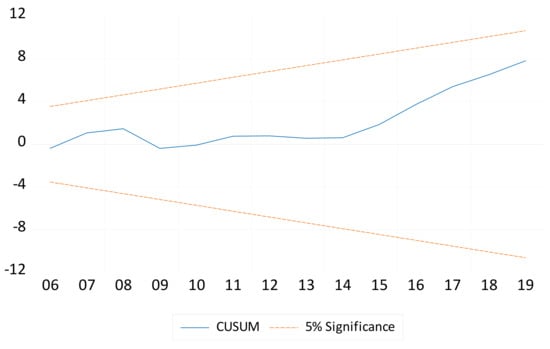
Figure 1.
NARDL CUSUM for Model 1. The thin red dashed lines denote the 95% confidence intervals.
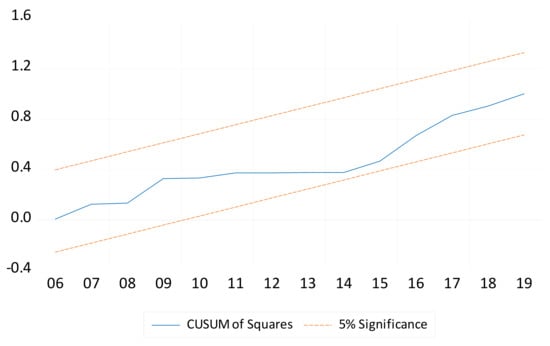
Figure 2.
NARDL CUSUM of squares for Model 1. The thin red dashed lines signify the 95% confidence intervals.
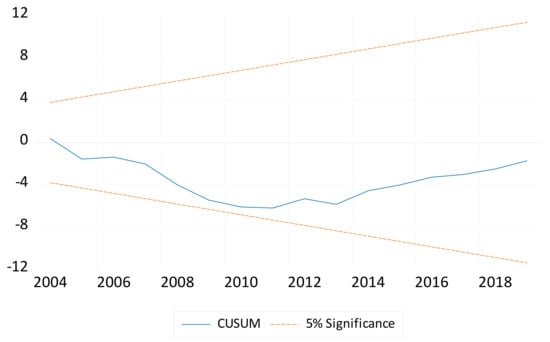
Figure 3.
NARDL CUSUM for Model 2. The thin red dashed lines represent the 95% confidence intervals.
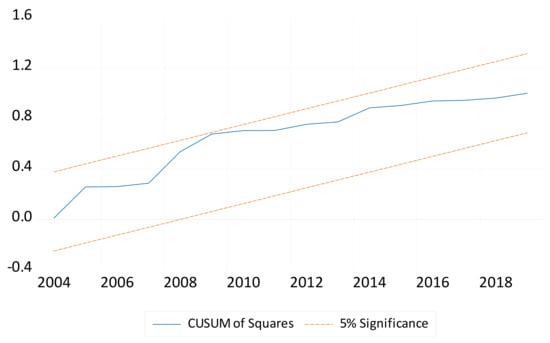
Figure 4.
NARDL CUSUM of squares for Model 2. The thin red dashed lines indicate the 95% confidence intervals.
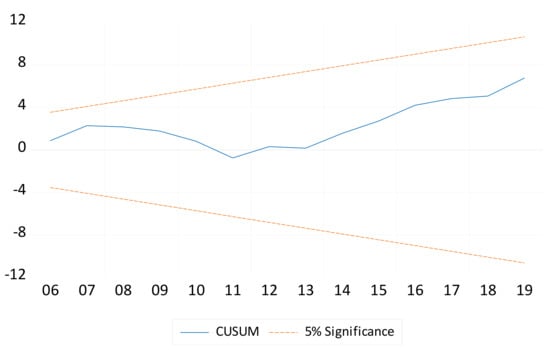
Figure 5.
NARDL CUSUM for Model 3. The thin red dashed lines denote the 95% confidence intervals.
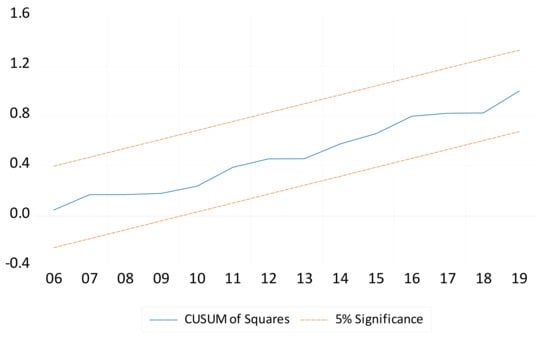
Figure 6.
NARDL CUSUM of squares for Model 3. The thin red dashed lines indicate the 95% confidence intervals.
The results of the Wald test are presented in Table 7, which specifies the long- and short-run asymmetric effects of employed foreign workers on agricultural, industrial, and service productivity, respectively. The results of Model 1 demonstrate that employed foreign workers have a long-run asymmetric effect on agricultural productivity, which is statistically significant at the 1% level. However, the results reveal that employed foreign workers have a statistically insignificant asymmetric effect on agricultural productivity in the short term; the p-value exceeds 0.05 and is not considered statistically significant.
Table 7.
The results of the long-run and short-run asymmetric effects of employed foreign workers in Wald tests.
In addition, the results of Model 2 disclose that there was a statistically insignificant long-run asymmetric effect of employed foreign workers on industrial productivity. In the short run, employed foreign workers have a statistically insignificant asymmetric effect on industrial productivity, which is based on the results of the Wald test shown in Table 7. Likewise, employed foreign workers have a statistically significant long-run asymmetric effect on service productivity at the 5% level, according to the Wald test results of Model 3. The results also indicate that employed foreign workers have a statistically insignificant short-run asymmetric effect on service productivity because the p-value exceeds 0.05.
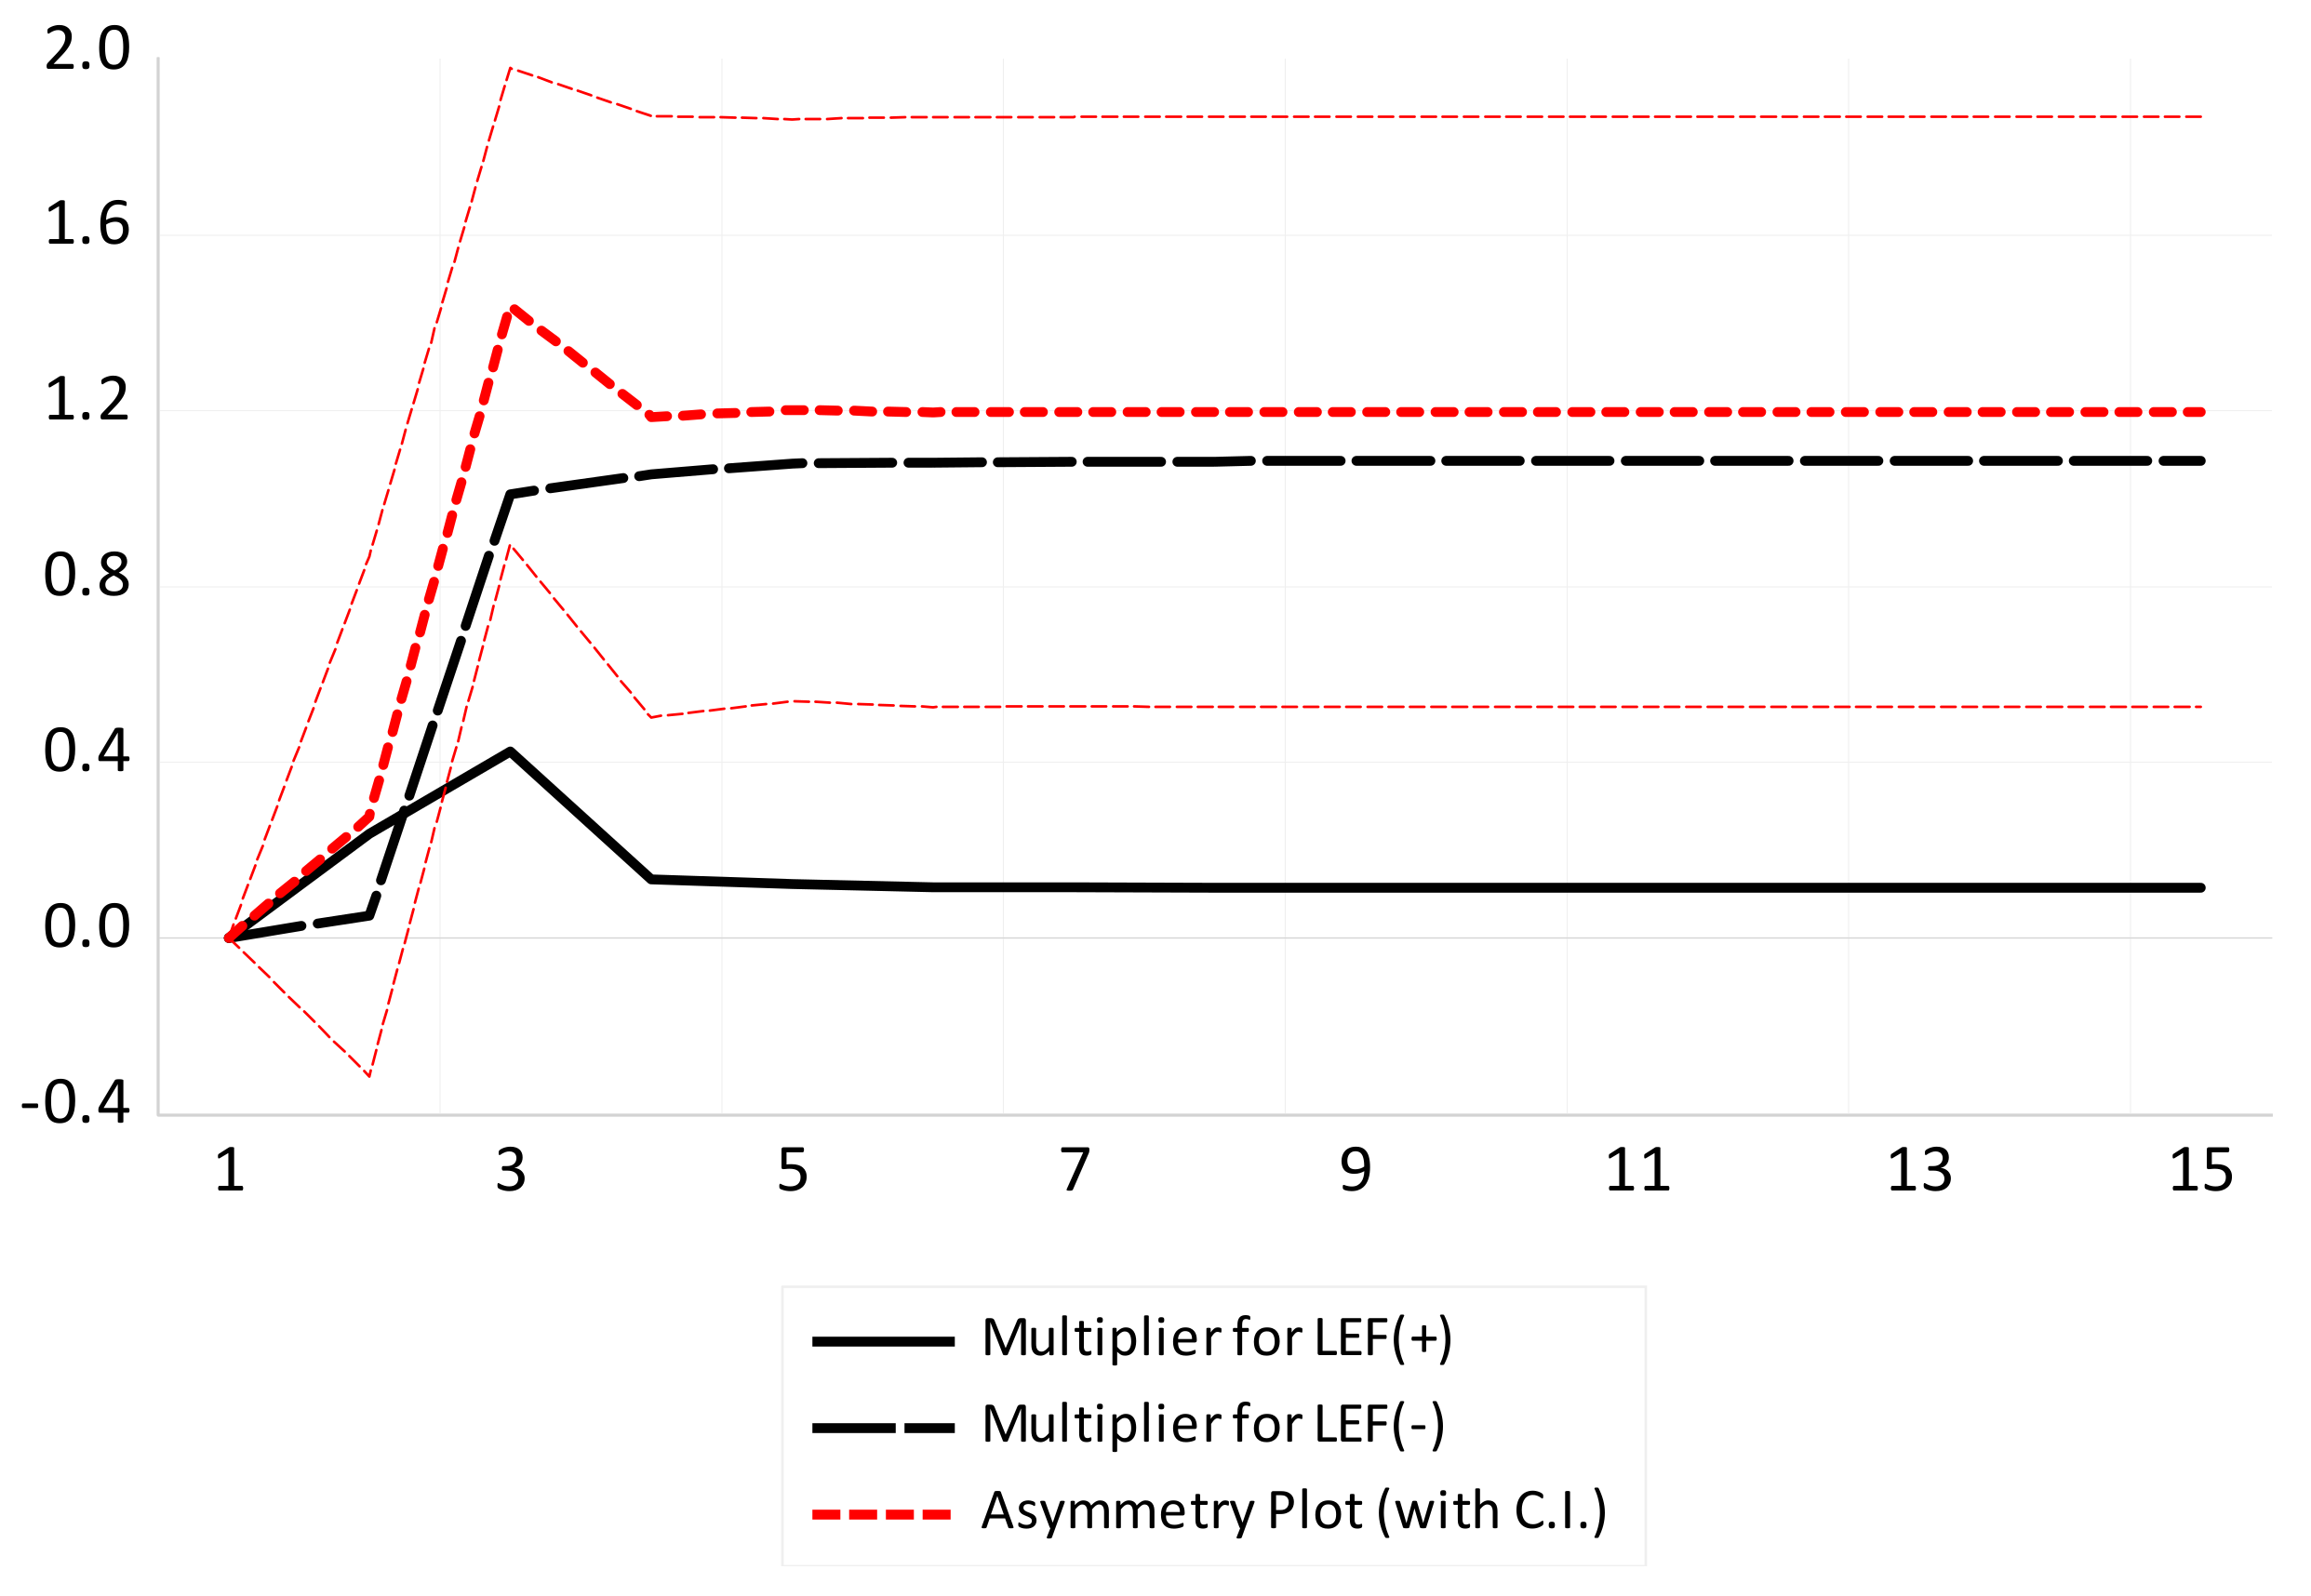
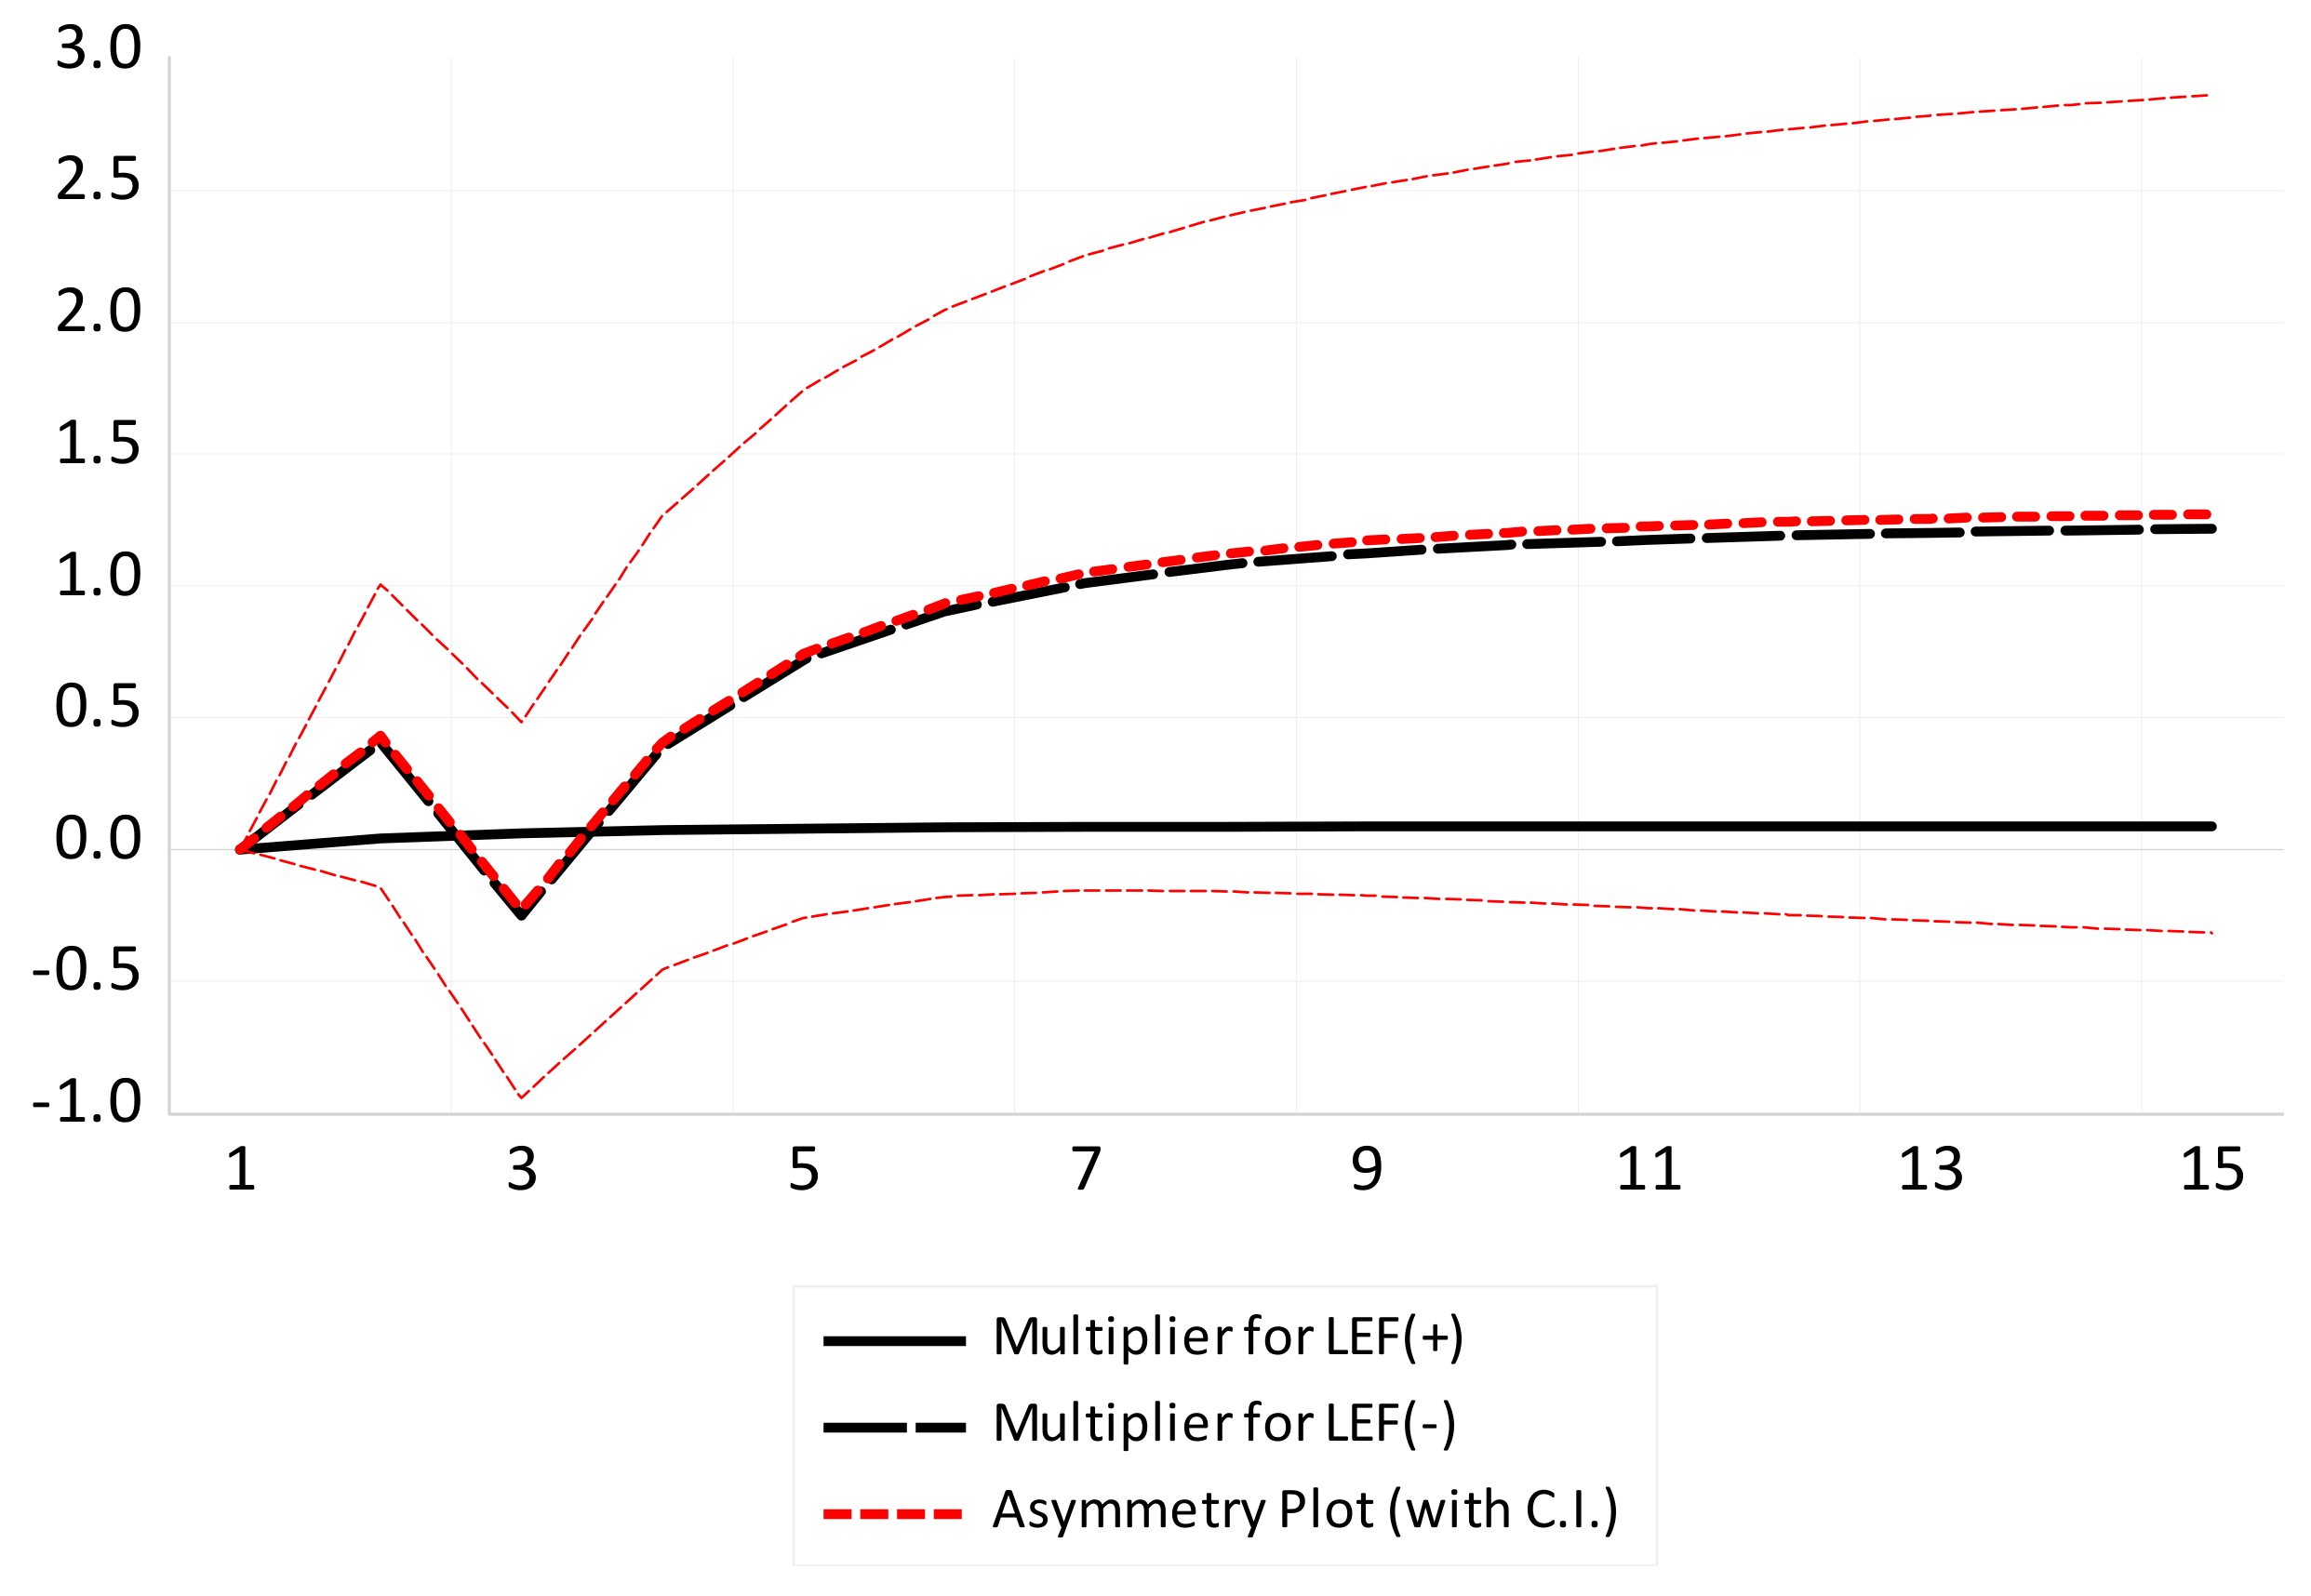
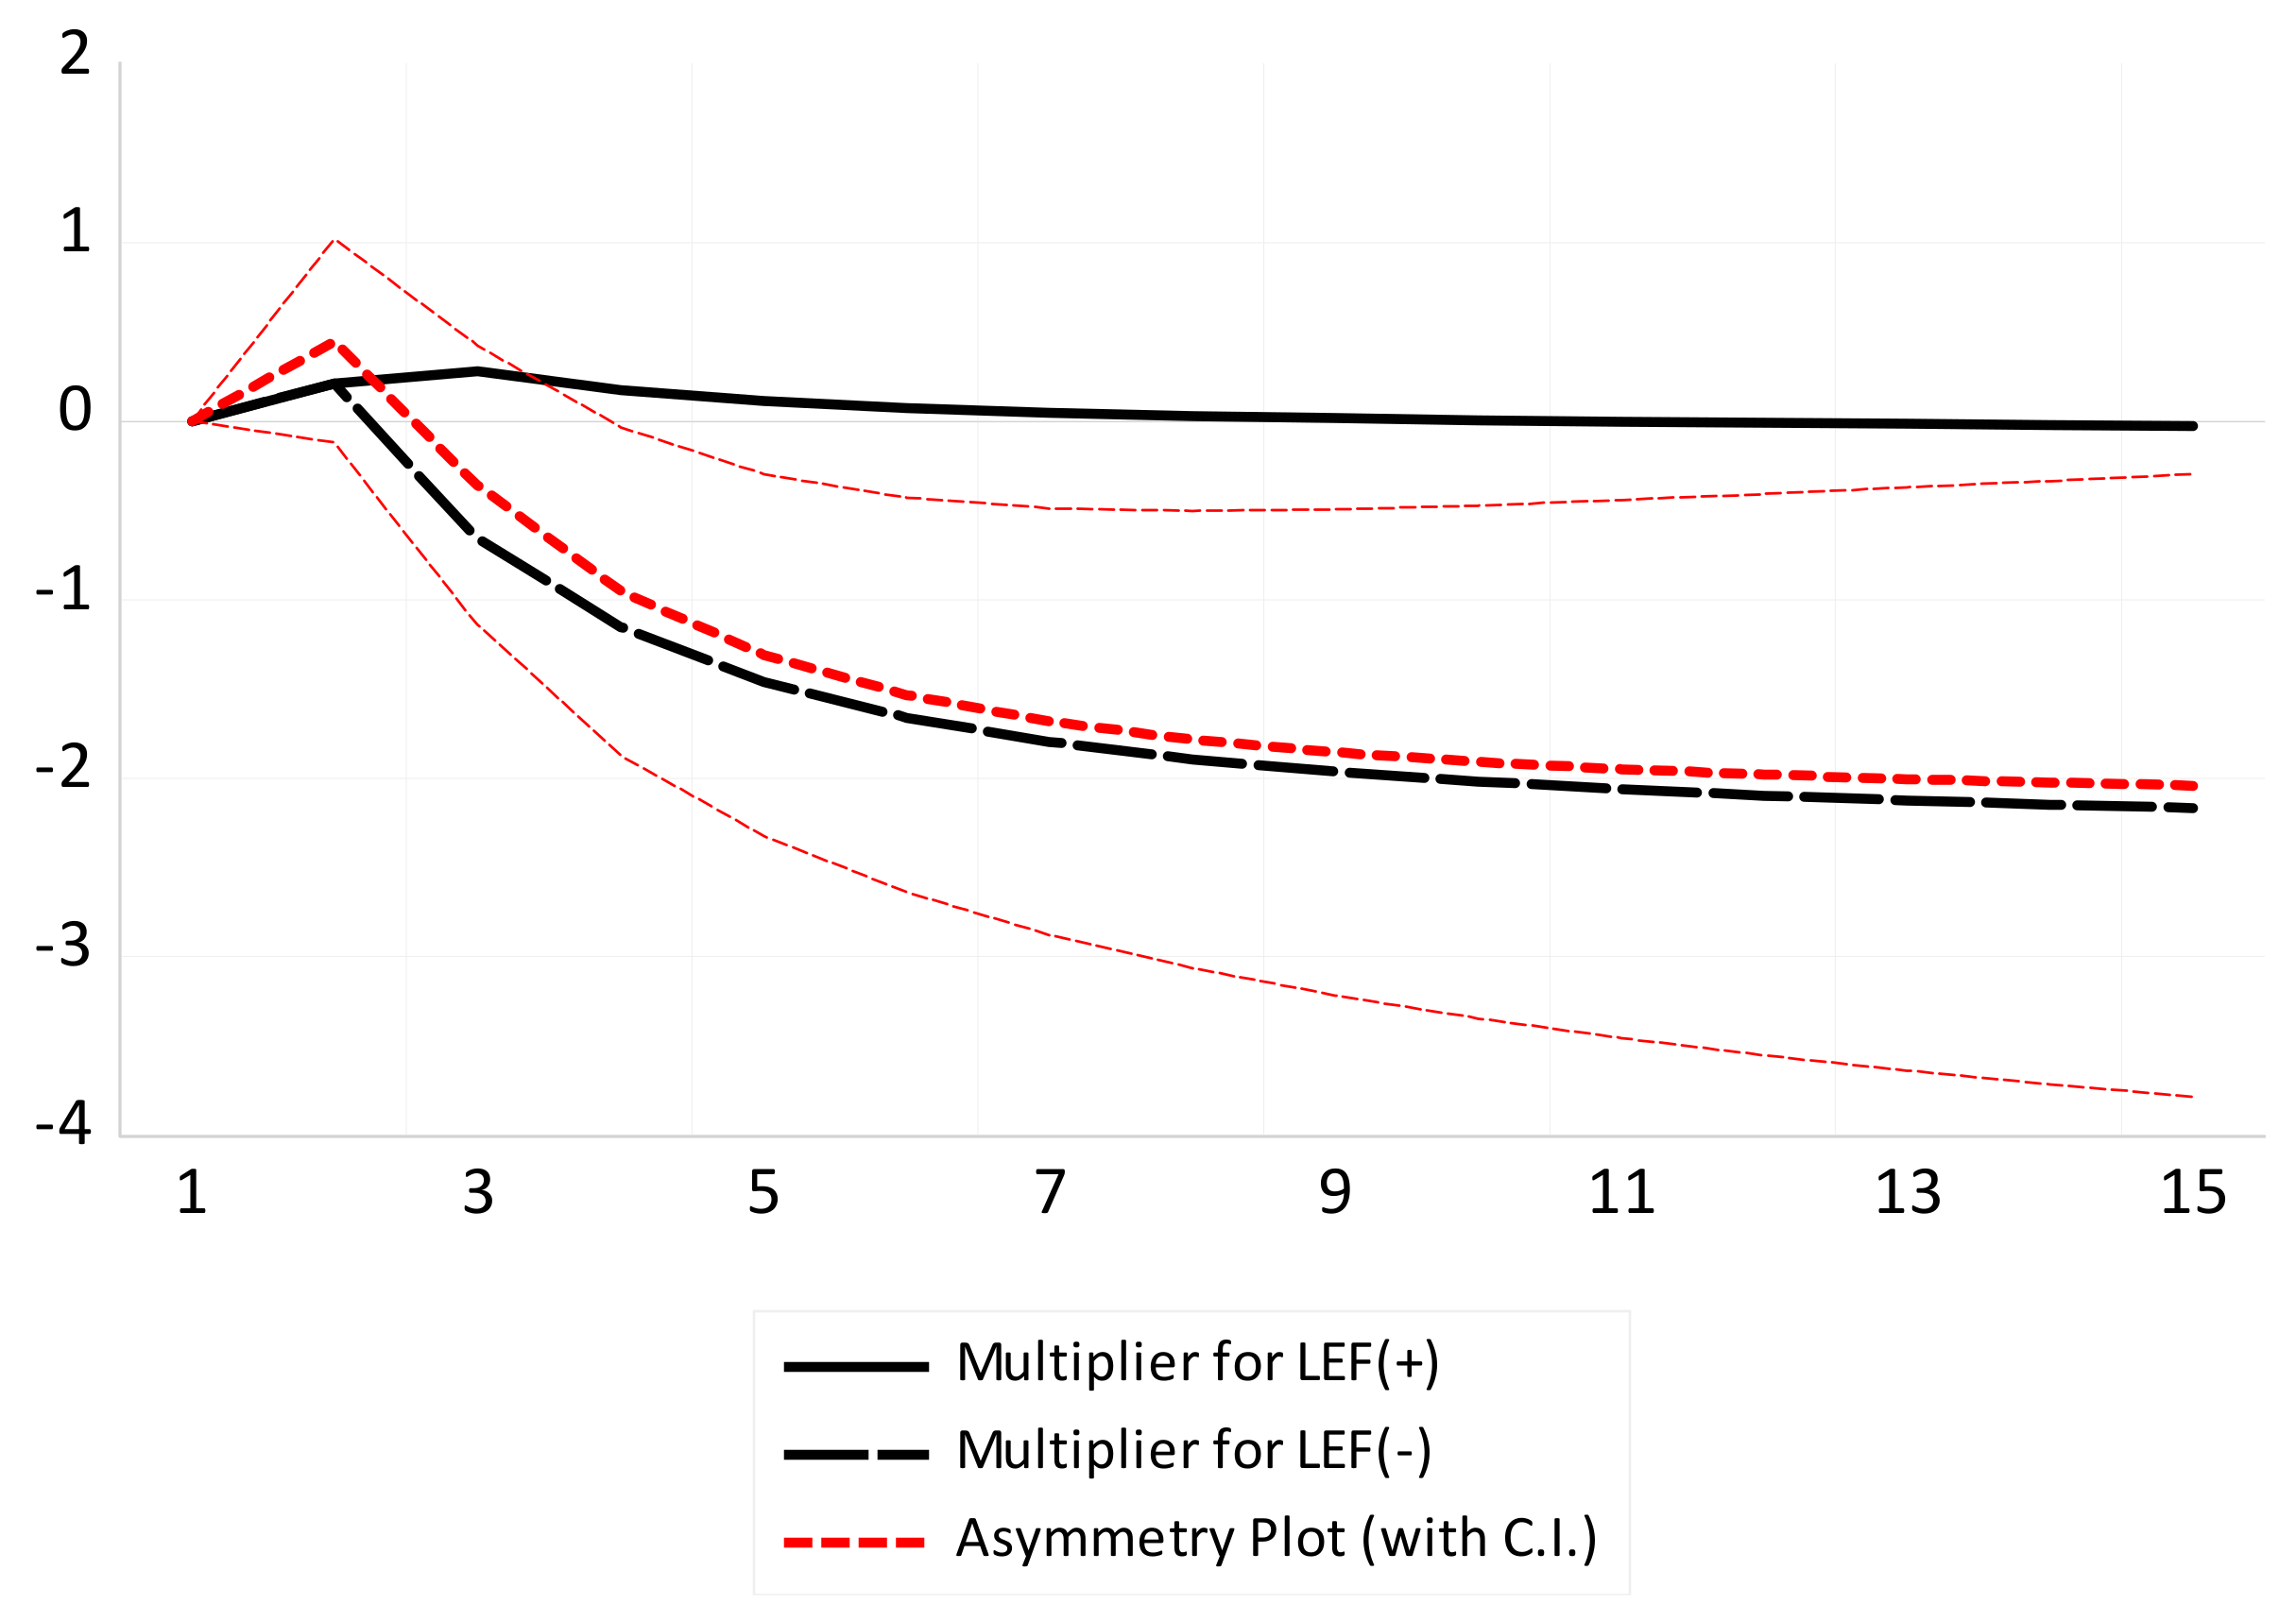
The nonlinear adjustment in the long-run equilibrium due to the positive and negative changes in employed foreign workers is depicted in Figure 7, Figure 8 and Figure 9 by the dynamic multiplier graph. The dynamic multiplier graph for NARDL plots the positive and negative change curves, illustrating the evidence of asymmetric adjustment during a specific period. The asymmetry plot illustrates the linear combination of dynamic multipliers associated with positive and negative changes, which are depicted as red dashed lines. The asymmetry is statistically significant where it was within the 95 percent confidence interval, as indicated by the upper and lower thin dashed red lines (see Figure 7, Figure 8 and Figure 9). Figure 7 shows the results of dynamic multiplier changes for Model 1. The NARDL multiplier graph reveals that positive and negative changes in LEF lead to a positive relationship with LPRODA, respectively. The positive changes in LEF are initially in a leading period, but then the negative changes become dominant. The asymmetry plot for Model 1 illustrates an overall positive effect for both positive and negative changes over 15 years. Likewise, the results of Figure 8 reveal the dynamic multiplier changes for LEF and LPRODI over 15 years.
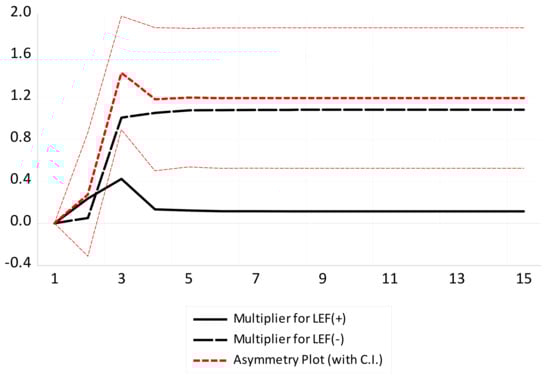
Figure 7.
NARDL multiplier graph for Model 1. The thin red dashed lines denote the confidence interval.

Figure 8.
NARDL multiplier graph for Model 2. The thin red dashed lines indicate the confidence interval.
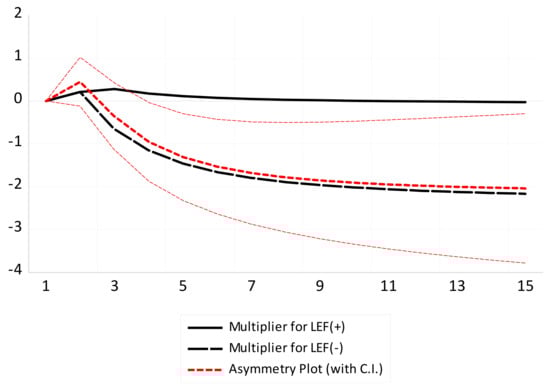
Figure 9.
NARDL multiplier graph for Model 3. The thin red dashed lines represent the confidence interval.
Initially, the graph indicates that the positive change in LEF shows a stable and slight positive response over 15 years, whereas the negative change in LEF exhibits a slight negative reaction occurring only over 2–3 years. The response of LPRODI to negative changes in LEF gradually increases starting in the third year and then changes to a stable position a few years later. In Model 2, the asymmetry plot demonstrates an overall positive effect for both positive and negative changes over 15 years; however, the negative effect occurred during the third year. Additionally, the results of dynamic multiplier changes for LEF and LRPODS are presented (see Figure 9). The positive change in LEF illustrates a steady and small positive reaction at the starting period only, and then progressively declines after the third year. This positive response does not exist a few years later. Conversely, the negative change in LEF exhibits a slight positive response, but this occurs solely during the initial period. The response of LPRODS to negative changes in LEF is a positive reaction only in the first two years; it then steadily diminishes during the second year and shifts to a negative response after that. This negative response progressively increases until the fifteenth year. The asymmetry plot indicates a predominantly negative effect over 15 years, despite a positive effect observed in the second year.
5. Conclusions
The asymmetric effects of foreign worker employment on labor productivity in Malaysian sectoral industries were analyzed using the NARDL model for the annual period between 1991 and 2019. Explicitly, our research objective is to ascertain the determinants that impede labor productivity—exploring the effects of foreign worker employment (i.e., positive changes and negative changes) on sectoral labor productivity and the consequences for local low-skilled labor within Malaysian sectoral industries. First, the empirical evidence (see Table 5 and Table 6) and Model 1 reveal that an increase in the employment of foreign workers positively and significantly affects agricultural productivity both in the short and long run. The data also hints at an educational dimension. Primary education has a negative impact on agricultural productivity in the long term and is statistically significant. In the meantime, the lack of formal education seems to harm agricultural productivity, but this observation is not statistically significant. Foreign workers play a pivotal role in enhancing Malaysia’s agricultural productivity. Given this, both the agricultural sector and the Ministry of Agriculture and Food Security should consider introducing advanced courses to improve the skills and knowledge related to planting and harvesting—thus ensuring sustainable growth.
Second, the results of Model 2 demonstrate that positive and negative changes in employed foreign workers, as well as an absence of formal education, have a positive and statistically insignificant effect on industrial productivity. However, primary education has a negative and insignificant impact on industrial productivity in both the long and short run. The asymmetric effects of foreign worker employment on industrial productivity are not statistically significant. Third, the NARDL estimation of Model 3 results in Table 5 indicates that negative changes in employed foreign workers have a positive and statistically significant effect on service productivity in the long run at the 1% level. Then, the presence of employed workers lacking formal education has a long-run negative effect on service productivity. In the short run, the findings specify that a 1% positive change in employed foreign workers will lead to an increase in service productivity of approximately 0.213%. Next, primary education has a short-run negative effect on service productivity, as evidenced by a coefficient of −0.614—underscoring a 1% increase in employed workers with primary education and leading to a diminishment in service productivity by approximately 0.614%. Interestingly, employed foreign workers have a statistically significant long-run asymmetric effect on service productivity at the 5% level, which is based on the Wald test shown in Table 7. The results point out that negative changes in employed foreign workers positively impact service productivity in the long run, whereas positive changes in employed foreign workers only have a short-term positive effect on service productivity—implying that over-reliance on employed foreign workers for a long time leads to lessened service productivity based on the findings of this study. Accordingly, the government should encourage service industries to rely less on the employment of foreign workers, as they only enhance productivity in the short term rather than in the long term.
A practical solution to enhance labor productivity in Malaysian sectoral industries is to prioritize hiring highly educated local employees over those with lower educational attainment. This shift in workforce composition can reduce the reliance on low-skilled workers, which often leads to lower productivity. The present study’s findings demonstrate that the asymmetric effects of foreign worker employment on labor productivity, particularly in the industrial sector, are limited. While foreign workers have played a significant role in Malaysia’s economic growth, this study suggests that local industries should focus on hiring more skilled workers to enhance labor productivity. As evidenced by a study by Aljarallah and Angus (2020), productivity was positively impacted by education. As a policy recommendation, the Malaysian government should encourage local industries to hire highly educated employees or enhance the quality of low-skilled labor through training programs offered by Technical and Vocational Education and Training (TVET). Simultaneously, the government should offer free training programs to equip employees with advanced skills, techniques, and technologies (e.g., artificial intelligence, robotics, drones, etc.), thereby fostering industry transformation. This effort aims to boost labor productivity, increase production output, and facilitate Malaysia’s progression toward achieving high-income nation status.
The World Bank (2021) has pointed out that upskilling the labor force through more market-responsive academics and creating high-skilled jobs is a facilitator of inclusive development. Pudasaini (1983) finds that high educational attainment creates more productivity in modern agriculture than traditional agriculture. In other perspectives, workers with higher labor productivity can attract and enhance foreign direct investment (FDI). There is a strong association between FDI and labor productivity (Boghean & State, 2015). The quality of education needs to be more emphasized than the quantity of education (Malangeni & Phiri, 2018). Likewise, collaboration between the Ministry of Education and the Ministry of Human Resources is crucial in offering free training courses, certified by local universities, to strengthen the skills of low-skilled workers.
This study has certain limitations that must be acknowledged, particularly the lack of comprehensive data concerning labor productivity across economic subsectors and the workforce in these sectors. We believe that analyzing data within subsectors will underpin future research. For this study, we affirm that employed foreign workers can continue to contribute significantly to labor productivity, particularly agricultural productivity, in both the long and short run, whereas service productivity is only statistically significant in the short term. Nevertheless, to address low productivity issues and drive sustained GDP growth, Malaysia must expedite its industry transformation toward Industry 4.0 and simultaneously reduce dependence on low-skilled labor, while ultimately improving the educational quality of the labor market to augment labor productivity over time, in line with the Sustainable Development Goals.
Author Contributions
Conceptualization, E.L.; Methodology, N.L.H.; Software, N.L.H.; Validation, E.L.; Formal analysis, N.L.H.; Data curation, N.L.H.; Writing—original draft, E.L. and N.L.H.; Writing—review & editing, E.L.; Supervision, E.L.; Funding acquisition, E.L. All authors have read and agreed to the published version of the manuscript.
Funding
This research received no external funding.
Institutional Review Board Statement
Not applicable.
Informed Consent Statement
Not applicable.
Data Availability Statement
World Bank and Department of Statistics Malaysia.
Acknowledgments
The authors would like to express their sincere gratitude to the Editor for the valuable guidance and support provided throughout the review process. We are also deeply appreciative of the anonymous reviewers for their insightful comments and constructive suggestions, which greatly contributed to improving the quality and clarity of this paper. The authors would like to express their deepest gratitude to Universiti Malaysia Sarawak (UNIMAS) for their invaluable support.
Conflicts of Interest
The authors declare no conflicts of interest.
References
- Abdul-Rahman, H., Wang, C., Wood, L. C., & Low, S. F. (2012). Negative impact induced by foreign workers: Evidence in Malaysian construction sector. Habitat International, 36(4), 433–443. [Google Scholar] [CrossRef]
- Agiomirgianakis, G., Asteriou, D., & Monastiriotis, V. (2002). Human capital and economic growth revisited: A dynamic panel data study. International Advances in Economic Research, 8(3), 177–187. [Google Scholar] [CrossRef]
- Aljarallah, R. A., & Angus, A. (2020). Dilemma of natural resource abundance: A case study of Kuwait. Sage Open, 10(1), 2158244019899701. [Google Scholar] [CrossRef]
- Anastasios, K., Constantinos, T., & Panagiotis, P. (2019). The effects of formal educations’ levels on regional economic growth in Greece over the period 1995–2012. Review of Regional Research, 39, 91–111. [Google Scholar] [CrossRef]
- Ang, J. W., Murugasu, A., & Chai, Y. W. (2018). Low-skilled foreign workers’ distortions to the economy. Economics Department of Central Bank of Malaysia. Available online: https://www.bnm.gov.my/documents/20124/826852/AR+BA3+-+Low-Skilled+Foreign+Workers+Distortions+to+the+Economy.pdf (accessed on 15 January 2025).
- Awad, A., Yussof, I., & Khalid, N. (2018). Output growth of the Malaysia’s manufacturing sector—Do foreign workers matter? Journal of Economic Studies, 45(4), 876–895. [Google Scholar] [CrossRef]
- Barro, R. J. (2001). International data on educational attainment: Updates and implications. Oxford Economic Papers, 53(3), 541–563. [Google Scholar] [CrossRef]
- Bashir, S., Herath, J., & Gebremedhin, T. G. (2012). An empirical analysis of higher education and economic growth in West Virginia. AgEcon Search. [Google Scholar] [CrossRef]
- Becker, G. S. (1964). Human capital: A theoretical and empirical analysis with special reference to education (1st ed.). NBER Books. [Google Scholar]
- Benos, N., & Karagiannis, S. (2016). Do education quality and spillovers matter? Evidence on human capital and productivity in Greece. Economic Modelling, 54, 563–573. [Google Scholar] [CrossRef]
- Boghean, C., & State, M. (2015). The relation between foreign direct investments (FDI) and labour productivity in the European Union countries. Procedia Economics and Finance, 32, 278–285. [Google Scholar] [CrossRef]
- Chen, J., Hshieh, S., & Zhang, F. (2021). The role of high-skilled foreign labor in startup performance: Evidence from two natural experiments. Journal of Financial Economics, 142(1), 430–452. [Google Scholar] [CrossRef]
- Chu, A. C., & Cozzi, G. (2016). Growth accounting and endogenous technical change. Economics Letters, 146, 147–150. [Google Scholar] [CrossRef]
- Cobb, C. W., & Douglas, P. H. (1928). A theory of production. The American Economic Review, 18(1), 139–165. [Google Scholar]
- Conway, D. I., McKinney, P. A., McMahon, A. D., Ahrens, W., Schmeisser, N., Benhamou, S., Bouchardy, C., Macfarlane, G. J., Macfarlane, T. V., Lagiou, P., Minaki, P., Bencko, V., Holcátová, I., Merletti, F., Richiardi, L., Kjaerheim, K., Agudo, A., Castellsague, X., Talamini, R., … Brennan, P. (2010). Socioeconomic factors associated with risk of upper aerodigestive tract cancer in Europe. European Journal of Cancer, 46(3), 588–598. [Google Scholar] [CrossRef] [PubMed]
- Dempere, J., Qamar, M., Allam, H., & Malik, S. (2023). The impact of innovation on economic growth, foreign direct investment, and self-employment: A global perspective. Economies, 11(7), 182. [Google Scholar] [CrossRef]
- Dickey, D. A., & Fuller, W. A. (1979). Distribution of the estimators for autoregressive time series with a unit root. Journal of the American Statistical Association, 74(366a), 427–431. [Google Scholar]
- Fisher, B., Ellis, A. M., Adams, D. K., Fox, H. E., & Selig, E. R. (2015). Health, wealth, and education: The socioeconomic backdrop for marine conservation in the developing world. Marine Ecology Progress Series, 530, 233–242. [Google Scholar] [CrossRef]
- Ganegodage, K. R., & Rambaldi, A. N. (2011). The impact of education investment on Sri Lankan economic growth. Economics of Education Review, 30(6), 1491–1502. [Google Scholar] [CrossRef]
- Gujarati, D. N., & Porter, D. C. (2009). Basic econometrics (5th ed.). McGraw-Hill. [Google Scholar]
- Gyimah-Brempong, K. (2011). Education and economic development in Africa. African Development Review, 23(2), 219–236. [Google Scholar] [CrossRef]
- Hair, J. F., Black, W. C., Babin, B. J., & Anderson, R. E. (2010). Multivariate data analysis (7th ed.). Pearson. [Google Scholar]
- Hanushek, E. A., & Kimko, D. D. (2000). Schooling, labor-force quality, and the growth of nations. American Economic Review, 90(5), 1184–1208. [Google Scholar] [CrossRef]
- Harris, J. (2021). Foreign aid, human capital accumulation and the potential implications for growth. The Review of International Organizations, 16(3), 549–579. [Google Scholar] [CrossRef]
- Hii, N. L., & Lau, E. (2024). Role of labor market education quality in driving economic growth and value-added agriculture: A Malaysian perspective. Thailand and the World Economy, 42(3), 186–211. [Google Scholar]
- Jalil, A., & Idrees, M. (2013). Modeling the impact of education on the economic growth: Evidence from aggregated and disaggregated time series data of Pakistan. Economic Modelling, 31, 383–388. [Google Scholar] [CrossRef]
- Jordaan, J. A. (2018). Foreign workers and productivity in an emerging economy: The case of Malaysia. Review of Development Economics, 22(1), 148–173. [Google Scholar] [CrossRef]
- Kangasniemi, M., Mas, M., Robinson, C., & Serrano, L. (2012). The economic impact of migration: Productivity analysis for Spain and the UK. Journal of Productivity Analysis, 38(3), 333–343. [Google Scholar] [CrossRef]
- Kwiatkowski, D., Phillips, P. C., Schmidt, P., & Shin, Y. (1992). Testing the null hypothesis of stationarity against the alternative of a unit root: How sure are we that economic time series have a unit root? Journal of Econometrics, 54(1–3), 159–178. [Google Scholar] [CrossRef]
- Lee, J. W. (2005). Human capital and productivity for Korea’s sustained economic growth. Journal of Asian Economics, 16(4), 663–687. [Google Scholar] [CrossRef]
- Lin, T. C. (2003). Education, technical progress, and economic growth: The case of Taiwan. Economics of Education Review, 22(2), 213–220. [Google Scholar] [CrossRef]
- Malangeni, L., & Phiri, A. (2018). Education and economic growth in post-apartheid South Africa: An autoregressive distributive lag approach. International Journal of Economics and Financial Issues, 8(2), 101–107. [Google Scholar]
- Mamun, A. A., Hayat, N., Mohiuddin, M., Salameh, A. A., & Alam, S. S. (2023). Green gardening practices among urban botanists: Using the value-belief-norm model. SAGE Open, 13(3), 21582440231187583. [Google Scholar] [CrossRef]
- Mankiw, N. G., Romer, D., & Weil, D. N. (1992). A contribution to the empirics of economic growth. The Quarterly Journal of Economics, 107(2), 407–437. [Google Scholar] [CrossRef]
- Ogunleye, E. K. (2015). Emerging evidence on the relative importance of sectoral sources of growth in Sub-Saharan Africa (pp. 131–166). Routledge eBooks. [Google Scholar] [CrossRef]
- Pesaran, M. H., Shin, Y., & Smith, R. J. (2001). Bounds testing approaches to the analysis of level relationships. Journal of Applied Econometrics, 16(3), 289–326. [Google Scholar] [CrossRef]
- Phillips, P. C. B., & Perron, P. (1988). Testing for a unit root in time series regression. Biometrika, 75(2), 335–346. [Google Scholar] [CrossRef]
- Pudasaini, S. P. (1983). The effects of education in agriculture: Evidence from Nepal. American Journal of Agricultural Economics, 65(3), 509–515. [Google Scholar] [CrossRef]
- Reddy, A. A. (2014). Rural labour markets: Insights from Indian villages. Asia-Pacific Development Journal, 21(1), 107–136. [Google Scholar] [CrossRef]
- Romer, P. M. (1990). Endogenous technological change. Journal of Political Economy, 98(5), S71–S102. [Google Scholar] [CrossRef]
- Shahiri, H., Husin, K. A., & Khain, W. C. (2023). The effect of job rotation in a fixed wage setting model. SAGE Open, 13(1). [Google Scholar] [CrossRef]
- Shen, L., Zhang, X., Liu, H., & Yao, P. (2021). Research on the economic development threshold effect of the employment density of the Shanghai consumer goods industry in the context of new manufacturing, based on the experience comparison with international metropolis. Mathematics, 9(9), 969. [Google Scholar] [CrossRef]
- Shin, Y., Yu, B., & Greenwood-Nimmo, M. (2014). Modelling asymmetric cointegration and dynamic multipliers in a nonlinear ARDL framework. In Festschrift in honor of Peter Schmidt (pp. 281–314). Springer. [Google Scholar]
- Shindo, Y. (2010). The effect of education subsidies on regional economic growth and disparities in China. Economic Modelling, 27(5), 1061–1068. [Google Scholar] [CrossRef]
- Solow, R. M. (1956). A contribution to the theory of economic growth. The Quarterly Journal of Economics, 70(1), 65–94. [Google Scholar] [CrossRef]
- Swan, T. W. (1956). Economic growth and capital accumulation. Economic Record, 32(2), 334–361. [Google Scholar] [CrossRef]
- Thangavelu, S. M. (2016). Productive contribution of local and foreign workers in Singapore manufacturing industries. Journal of Economic Studies, 43(3), 380–399. [Google Scholar] [CrossRef]
- Tsai, C. L., Hung, M. C., & Harriott, K. (2010). Human capital composition and economic growth. Social Indicators Research, 99(1), 41–59. [Google Scholar] [CrossRef]
- Viswanath, J., Reddy, K. L. N., & Pandit, V. (2009). Human capital contributions to economic growth in India: An aggregate production function analysis. Indian Journal of Industrial Relations, 44(3), 473–486. [Google Scholar]
- Wei, Z., & Hao, R. (2011). The role of Human capital in China’s total factor productivity growth: A cross-province analysis. The Developing Economies, 49(1), 1–35. [Google Scholar] [CrossRef]
- World Bank. (2021). Aiming high: Navigating the next stage of Malaysia’s development. The World Bank. [Google Scholar]
- World Bank Group. (2019). Agricultural transformation and inclusive growth: The Malaysian experience. The World Bank. [Google Scholar]
- Yan, Y. (2011). The impact of education on economic growth in China. IEEE Xplore. [Google Scholar] [CrossRef]
Disclaimer/Publisher’s Note: The statements, opinions and data contained in all publications are solely those of the individual author(s) and contributor(s) and not of MDPI and/or the editor(s). MDPI and/or the editor(s) disclaim responsibility for any injury to people or property resulting from any ideas, methods, instructions or products referred to in the content. |
© 2025 by the authors. Licensee MDPI, Basel, Switzerland. This article is an open access article distributed under the terms and conditions of the Creative Commons Attribution (CC BY) license (https://creativecommons.org/licenses/by/4.0/).