Article

Gender Gaps, Financial Inclusion and Social Integration in Kakuma Refugee Camp, Kenya

by
Afrika Onguko Okello
African Economic Research Consortium (AERC), P.O. Box 62882-00200, Nairobi, Kenya
Economies 2025, 13(3), 75; https://doi.org/10.3390/economies13030075
Submission received: 8 January 2025 / Revised: 25 February 2025 / Accepted: 26 February 2025 / Published: 14 March 2025
(This article belongs to the Special Issue Human Capital Development in Africa)

Abstract

:
The integration or resettlement efforts aimed at self-reliance of refugees are requisite for their adaptation to social and economic shocks and consequently to their human development and contribution to economic growth. This study analyses the drivers of financial inclusion and social integration and estimates the respective gender gap among households in Kakuma Refugee Camp, Kenya. Based on a 2019 socio-economic survey dataset, the study constructs indices to reveal the extent of financial inclusion and social integration. Using the ordered logistic regression, factors such as earning wages, asset accumulation, food security, social capital, education, and access to information demonstrate significant explanatory power for financial inclusion and social integration. The Blinder-Oaxaca decomposition technique for measuring the gender gap reveals that women are significantly better off with respect to financial inclusion compared to men. These results suggest that gendered financial inclusive and social integration programs can build refugee self-reliance. Accordingly, government and development partners should promote gender-inclusive strategies for refugees in Kenya. This study contributes to the literature on refugee financial inclusion and social integration by offering gender-specific insights into their barriers and enablers in protracted displacement contexts.
JEL Classification:
F22; J15; J18; O15

1. Introduction

The attainment of the overarching Sub-Saharan Africa’s (SSA) continental agenda on sustainable and inclusive development depends on the adaptive capacity of vulnerable groups. The region continuously grapples with an increasing number of victims of forced displacement due to fragility and conflict. The United Nations High Commissioner for Refugees (UNHCR, 2023, 2024b) estimates that 13.6 million refugees will be hosted in SSA by the end of 2024, representing a 64 percent increase from 2021. Despite the region hosting the largest global population of refugees at 37 percent and being the largest recipient of humanitarian funds (46 percent), a funding gap persists (UNHCR, 2024b). For instance, the allocated funds for hosting refugees within the East African region was USD 2.1 billion in 2024, compared to USD 2.7 billion in 2022—a decline of 22 percent (UNHCR, 2024a, 2024b).
Kenya hosts one of the largest numbers of refugees in SSA, with more than 800,000 dwelling in camps, settlements, and urban areas nationwide (UNHCR, 2024b). The influx of refugees often overstretches the capacity of existing national infrastructure, making it inadequate to serve local and refugee needs. With the reduction in funding, there is potential for conflict with the host communities. This necessitates a rethinking of refugee humanitarian assistance from aid-dependent to self-reliant for their long-term survival. This requires a holistic approach where financial and non-financial strategies are designed and tailored based on refugees’ specific needs and barriers (Naseh et al., 2024). This study acknowledges the significance of heterogeneity in the preferences and needs of refugees to guide policy design (Hughes & Bushell, 2013), and analyses the extent of formal financial inclusion and social integration to inform financial and non-financial strategies, respectively. The study is cognizant of the fact that these two concepts are interrelated since successful social integration can establish social institutions/groups that provide financial resources to refugees (Swamy, 2014).
Financial inclusion is defined as the access to and effective use of formal financial services, such as having a bank account and access to formal loans and financial assets (Kling et al., 2020; Allen et al., 2016; Swamy, 2014). Financial inclusion can reduce households’ propensity for being poor and vulnerable to shocks (Koomson et al., 2020; Jiang & Liu, 2022; Ozili, 2021; Kling et al., 2020). Yet refugees still rely on informal financial services due to the strict documentation requirement by formal sources: only two (2) percent of loans accessed by refugees are from formal financial institutions in Kenya (UNHCR & World Bank, 2021). Whereas the refugee integration framework requires refugees’ participation in formal institutions to facilitate access to national resources (Government of Kenya, 2021), their low uptake of formal financial services implies a flawed policy framework that fails to adequately capture their reality.
The diminishing global aid for refugee assistance will further complicate their existing limited access to financial resources from formal institutions (Bhagat, 2020), which may carry an uncertain financial burden to the refugees. This calls for the rethinking of the concept of financial inclusion within this group to effectively achieve the desired outcomes. By analyzing the current extent of financial inclusion and its drivers, this study aims to inform policy development to incorporate the unique situation of refugees. In addition, the study recognizes that financial inclusion has been studied independently from other indicators of self-reliance, such as social integration. Yet evidence points out that social networks and community-based support mechanisms strengthen integration and complement financial efforts by public and private stakeholders (Dhawan et al., 2024).
Here, the definition of social integration emulates Betts et al. (2022) and Habib et al. (2020), who identify it as either relations between refugee families or interactions between refugee and host communities. Factors such as ease of refugee movement, sharing of available resources, and identifying with unique challenges strengthen these relations (Dhawan et al., 2024; Swamy, 2014). The resultant institutions from social networks are often considered as informal financial intermediaries (Swamy, 2014), yet refugees can rely on their membership and bargaining power, to access credit from formal financial institutions and pool financial resources internally.
For refugee interventions to adequately achieve financial inclusion and social integration outcomes, the World Bank (2021) explains the need for specific interventions as opposed to broad-based efforts. This is crucial considering refugees’ circumstances vary across households due to unequal access to resources, yet their respective needs should be met in order to move them to desirable and higher levels of financial inclusion and social integration (Link et al., 2021; Alinovi et al., 2009; Sarma, 2008). Therefore, policies designed based on evidence can address existing nuances to formulate interventions that will assist each group and facilitate movement to higher categories in the long term. This paper aims to contribute to the existing knowledge gaps by measuring the following specific objectives: (i) determine the extent of financial inclusion and social integration of the refugees in Kakuma Refugee Camp; (ii) assess the socio-economic and institutional drivers of financial inclusion and social integration; and (iii) estimate gender gaps in financial inclusion and social integration. To operationalize the above, the study constructs financial inclusion and social integration indices and applies an ordered logit model to examine the drivers separately. The Blinder-Oaxaca (Blinder, 1973; Oaxaca, 1973) decomposition method is used to estimate the gender gaps. It is hypothesized that there are significant socio-economic and institutional drivers of financial inclusion and social integration. The findings established here contribute to a dynamic policy environment that strives to translate refugees’ access to national systems such as employment, education, and freedom of movement into practice.
The rest of the paper is organized as follows: Section 2 presents an issue-based literature review, followed by the methodology in Section 3. The results and discussion are presented in Section 3 and Section 4, respectively, and the conclusion and policy implications are explained in the last section.

2. Literature Review

2.1. Refugee Situation in Context

Refugee integration in host nations has been a developmental concern, given that refugees are likely to be culturally and socially different from the host population (Bloemraad et al., 2023; Wessendorf & Phillimore, 2019). Bhagat (2020) argues that financial inclusion is the only strategy for poverty alleviation and self-reliance for refugees. While this underscores the benefits of financial services, Dhawan et al. (2024) explain that even though overcoming financial shocks is among refugees’ priorities, access to formal financial services is not the most important input to achieving self-reliance. The study stresses that financial inclusion cannot be achieved in isolation, and this can be attributed to the simultaneous nature of shocks and the fact that refugees are not homogenous since their respective circumstances vary significantly (Hughes & Bushell, 2013). Similar to the effect of financial inclusion, successful social integration of refugees can increase their participation in economic activities, thereby contributing to the productivity and growth indicators of host nations (Borjas, 2019). Having more supportive conditions provided by informal social networks and community-based support, which provide non-financial assistance, was significantly critical (Dhawan et al., 2024). Hughes and Bushell (2013) further emphasize that households cope better with shocks when they are part of a larger coordinated effort at the community level, reinforced by reliable family networks. Community-based groupings can guarantee bargaining power to hasten integration and even redefine the framework of traditional formal financial institutions. Therefore, in this study, a multidimensional approach is utilized by focusing on financial inclusion and social integration.
In Kenya, the frequent and regular flow of refugees into Kakuma Refugee Camp creates the need for in-depth research and efforts to promote self-reliance. Betts et al. (2018) examine the socio-economic outcomes for refugees in North-West Kenya to assess the degree of self-reliance in the Kalobeyei settlement. The study emphasizes the role of refugees in establishing their social institutions and how this can be achieved through community participation. A major factor that can promote community participation and consequently lead to social integration is financial investments in the entire (host) economy. This averts conflict with the host community, which willingly apportioned land for refugee settlement with the expectation of receiving parallel services and infrastructure. Financial investments at the micro level involve ready access to credit and savings institutions that can lend funds to set up businesses for welfare gains. However, the study identifies that limited access to these institutions has been the largest barrier to achieving self-reliance. Therefore, communities rely on customary finance mechanisms, which are pegged on the extent of individually established social capital, to obtain credit. The study further points out that this informal financing is limited to certain refugee nationalities and may affect women disproportionately since the latter do not participate in community groups due to their low financial resources. It is evident that financial inclusion and social integration are interdependent, and their interactions, as well as personal features, determine their transition to desirable categories. This is reinforced in the UNHCR and World Bank (2019b) report on the socio-economic conditions of refugees in Kalobeyei.
Women make up 49 percent of the global refugee population (UNHCR, 2024c); examining self-reliance and designing policies to improve refugees’ capacities to cope with shocks cannot ignore the gender dimension. Morsy (2020) underscores that women are more likely to be excluded from the formal financial sector, where they have limited access to credit, even in public financial institutions that ought to be more inclusive. On average, about 33 percent of women in SSA have access to a financial account. This is 10 percent less compared to men (Loaba, 2023). Hence, women tend to rely on informal financial sources, which depend on the extent of their social integration within the community. The gaping gender disparities in terms of unequal access to economic resources undermine resilience.
Women tend to demonstrate stronger positive attitudes towards helping others, while men are more willing to act on this motivation depending on the financial resources at their disposal (Valentova, 2016). Wellalage and Locke (2020) argue that financial inclusion and social integration are interconnected, and financial products ought to consider social dimensions such as the culture of the refugee population. However, social integration is not achievable if it is the basis for financial exclusion.

2.2. Study Context

Kakuma Refugee Camp was established in 1992, following an influx of refugees from Sudan, and has since expanded to host refugees from Ethiopia, Somalia, and neighboring East African countries. It is divided into four sub-camps—Kakuma 1, 2, 3, and 4—and exists alongside the Daadab camp and Kalobeyei settlement. The latter was established to decongest refugees in Kakuma camp in 2016. Kakuma hosts the second-largest refugee population in Kenya (27 percent) after the Daadab camp, with more than half (53 percent) being men (UNHCR, 2024d). It is located in Turkana County in the North Western region of Kenya. Specifically, it is situated about 95 km from Lokichoggio, near the Kenya-Sudan border. About 80 percent of the county is arid, with temperatures averaging 30.5 °C (Government of Kenya, 2023). The region experiences extreme and unpredictable weather patterns, such as flash floods and prolonged drought. The local people are predominantly seminomadic and rear livestock for food. Nationally, the county has the highest overall poverty gap of 38.2 percent, whereby adult per capita monthly consumption is below US$ 30.401 (Government of Kenya, 2021). This affects households’ ability to purchase food and access basic social and economic infrastructure.
Administratively, the camp is under the mandate of the Department of Refugee Services of Kenya, while the UNHCR offers requisite support. Although legal restrictions limit formal employment, freedom of movement, and the ability to own land/property, the camp has a thriving informal refugee economy with more than 2000 businesses providing food, income, and employment opportunities (International Finance Corporation (IFC), 2018). Small general stores account for 33 percent of the businesses and are mainly male-owned. According to the report, almost three-quarters of the refugees lack information on financial matters, and about a quarter are likely to receive a loan from formal financial institutions for education and business investment. While two-thirds have expressed demand for mobile phones, only one-half of them use mobile banking, which is dependent on financial literacy and access to alien identification cards (International Finance Corporation (IFC), 2018).
Humanitarian organizations implement various livelihood programs in the camp. For instance, the World Food Programme conducts an e-voucher program called Bamba Chakula (“Get your Food”). The program enables about 57 percent of households to receive funds for selected food items rather than receiving predetermined food packages (International Finance Corporation (IFC), 2018). The flow of humanitarian assistance has led to infrastructural development and social programs that have trickled into the host community. The Kalobeyei Integrated Socio-Economic Development Plan envisions a conducive environment for private sector investment, increased school enrolment, and improved socio-economic infrastructure for the host residents and refugees. Women and youth are facilitated through technical and vocational education as well as empowerment activities to increase their economic contribution to the households. Situated in an arid and semi-arid region, the threat of extreme climate amid other economic shocks can trigger conflict between the host and refugee communities, affect access to existing resources, and dissipate efforts toward social integration. This underscores the need for effectively-designed policies centered on self-reliance to offset the risks posed by exogenous threats.

2.3. Theoretical Framework

Financial inclusion and social integrations can be described within the expansive realm of resilience. The theory of resilience holds that resilience is borne out of adaptation, given access to the necessary resources (Rutter, 2006). The theory posits that resilience is not a fixed trait but a dynamic process that varies based on an individual’s exposure to risks and a set of protective factors such as financial security and social connections (Masten, 2014). This framework allows researchers to examine why some individuals are more capable of rebounding from challenges than others.
For refugee populations, resilience is particularly critical as they often face extreme challenges, including displacement, poverty, and social exclusion. Betts et al. (2022) emphasized that resilience in refugee contexts involves both social and economic dimensions. Economic resilience refers to financial inclusion and the ability to access resources, while social resilience pertains to social cohesion and integration into host communities (Betts et al., 2022). Resilience in refugees is thus measured by their ability to build self-reliant lives and overcome dependency on aid (Papadopoulos, 2021). Additionally, gender disparities play a significant role in resilience outcomes. Studies show that women, particularly in refugee contexts, tend to have lower access to resources, which negatively impacts their resilience (Krause, 2021). However, women’s resilience can be bolstered through increased financial inclusion, education, and supportive social networks (UNHCR, 2022).
The theory is increasingly informing development policies aimed at vulnerable populations. The Global Compact on Refugees emphasizes enhancing refugee resilience through financial inclusion, education, and employment opportunities (UNHCR, 2018). Policies aimed at fostering resilience are focused on reducing barriers to economic and social participation, particularly for women and marginalized groups. This study relies on the theory of resilience to elucidate the indicators of financial inclusion and social integration that can be instrumental in analyzing resilience as a multidimensional concept. The theory places equal value on different risk and protective factors that constitute resilience, which is an approach followed in this study.

3. Methodology

3.1. Data Source

The study utilizes the Socio-economic Survey (SES) of Refugees in Kakuma dataset (UNHCR & World Bank, 2019a). The survey adopted a two-stage sampling procedure, where the first stage sampled dwellings stratified by sub-camp, followed by the second stage of household identification. The selected dwellings were drawn as the primary sampling unit from an updated list of all dwellings in the camp provided by the UNHCR Shelter Unit, which served as the sampling frame. The sample was drawn with stratification for the four Kakuma sub-camps, with uniform probability for Kakuma 1–3. For Kakuma 4, the selection probability was slightly increased because of a higher expected non-response. Based on a three (3) percent margin of error at a confidence level of 95 percent, the sample size was 2122.
Data were collected through smartphone-assisted face-to-face questionnaires administered by trained research assistants. The questionnaire contained questions on demographics, education, housing characteristics, access to services, livelihoods, assets, poverty incidence, food security, vulnerabilities, cohesion, trajectories of displacement, and intentions to move. Due to non-responses from some of the variables used to compute the indices, data from a total of 1829 households were considered suitable for analysis.

3.2. Measuring Financial Inclusion and Social Integration

The study considers multiple factors that relate to financial inclusion and social integration to generate the respective indices. To construct the financial inclusion index, this study used multiple correspondence analysis (MCA), which is a descriptive method suitable for examining relationships among categorical variables (Le Roux & Rouanet, 2010). The method aggregates binary responses and transforms them into a linear scale that can subsequently become bounded (van Horn et al., 2019). The financial inclusion index is constructed using three indicators based on the definition of financial inclusion adopted in this study and available data. Data on six metrics of financial inclusion were collected (access to bank account, ATM card, IRIS account, insurance, and debit and credit cards) as guided by the G20 proposal (GPFI, 2020). However, due to non-responses in three indicators, the study used the available data (credit and bank and mobile money accounts) for the MCA: The indicators and percentages for each indicator across male and female-headed households are summarized in Figure 1. The responses to the indicators were captured as either “yes” or “no”, making them binary in nature and suitable for the MCA. The continuous index ranged from negative to positive; that is, the more negative the score, the less financially included the household is, and conversely, the more positive the index, the more financially included the household. The index was used as the dependent variable in subsequent ordered logit regression analysis.
Following Okello et al. (2021) and Muricho et al. (2019), social integration was generated using the principal component analysis (PCA) technique based on the responses in Table 1. This is a data reduction technique commonly used to reduce dimensionality on correlated indicators with responses measured on Likert scales. In this case, responses were collected using a five-point Likert scale with one (1) meaning “strongly disagree” and five (5) meaning “strongly agree”. Social integration was captured within the broad categories of participation, trust, and safety as conceptualized within the social cohesion framework (Jenson, 2010). For both indices, the higher the values, the more financially included or socially integrated in the household.

3.3. Models of Financial Inclusion and Social Integration

The modeling approach adopted a two-step procedure. First, the extent of financial inclusion and social integration is measured in three categories: low, moderate, or high, emulating the approach by Sarma (2008). The thresholds (limits) along the two continuous indices are set ex-post to data collection and at regular intervals to form three equal parts. The two thresholds are defined by n = 2 parameters, whereby 1   <   2 which can be modeled as outlined in Equation (1):
Y i g * = 0   i f     Y i g 1 l o w 1   i f   1 < Y i g 2 m o d e r a t e 2   i f   Y i g > 2 h i g h
where Y i g represents the continuous index for the ith household, Y i g * represents the category under which the ith household falls, and g represents the gender of the household head. Second, the study employed the ordered logit model to understand the factors influencing financial inclusion and social integration in male and female-headed households. While either the ordered logit or probit model can be used, the ordered logit is preferred here for allowing ease of interpretation of the coefficients, given as odds ratios. Following Wooldridge (2010) and Gujarati (2015), the standard ordered logit is derived from the latent variable equation given as:
Y i g * = X i g β g + ε i g
where Y i g * is the latent dependent variable that represents either the financial inclusion or social integration category for the ith household, g represents the gender of the household head, X i g is a vector of explanatory variables, β g is the vector of coefficient parameters to be estimated, such as the education expenditure, average household size, having friends/relatives resettled in developed countries, English literacy and dependency ratio, and ε i g is the random error term which is assumed to follow a normal distribution.

3.4. Analysing the Gender Gaps in Financial Inclusion and Social Integration

The study used the Blinder-Oaxaca (B-O) decomposition method (Blinder, 1973; Oaxaca, 1973) to investigate how differences in resilience contribute to the gender gap in households. The method decomposes mean differences in the measure of resilience based on regression models in a counterfactual manner. The method is suitable for outcome variables that are continuous in nature; in this case, the resilience index was used as the outcome variable. The method disaggregates the difference in resilience between genders into a part that is “explained” by group differences such as education or employment and a residual part that cannot be accounted for by such differences, that is, the determinants of resilience. The “unexplained” part is often used as a measure for discrimination, but it also subsumes the effect of group differences in unobserved predictors (Jann, 2008). The decomposition can be expressed as:
G a p = R m ¯ R f ¯ = 1 N m i = 1 N m F X i m β f 1 N f i = 1 N f F X i f β f + 1 N f i = 1 N f F X i f β m 1 N f i = 1 N f F X i f β f + { 1 N m i = 1 N m F X i m β m 1 N m i = 1 N m F X i m β f + 1 N f i = 1 N f F X i f β m 1 N f i = 1 N f F X i f β f }
where R m ¯ and R f ¯ denote the mean probability of being in one of the categories (male and female-headed households, respectively); N m and N f represent the sample sizes of males and females, respectively, and F is the cumulative distribution function from the linear distribution. Equation (3) has three components separated by the curly brackets.
According to Blinder (1973) and Oaxaca (1973), the three components contribute to explaining gender gaps. The first part of the equation is the portion associated with differences in endowment (the “explained” part). The second term is attributed to differences in coefficient effects, including differences in the intercept (the “unexplained” part), and the last portion is a joint effect of both endowments and returns, meaning that differences in endowments and coefficients exist simultaneously between the two groups. The decomposition is formulated from the perspective of female-headed households. A positive value implies that male-headed households have a structural advantage over their female counterparts with regard to the specific effects.

4. Results

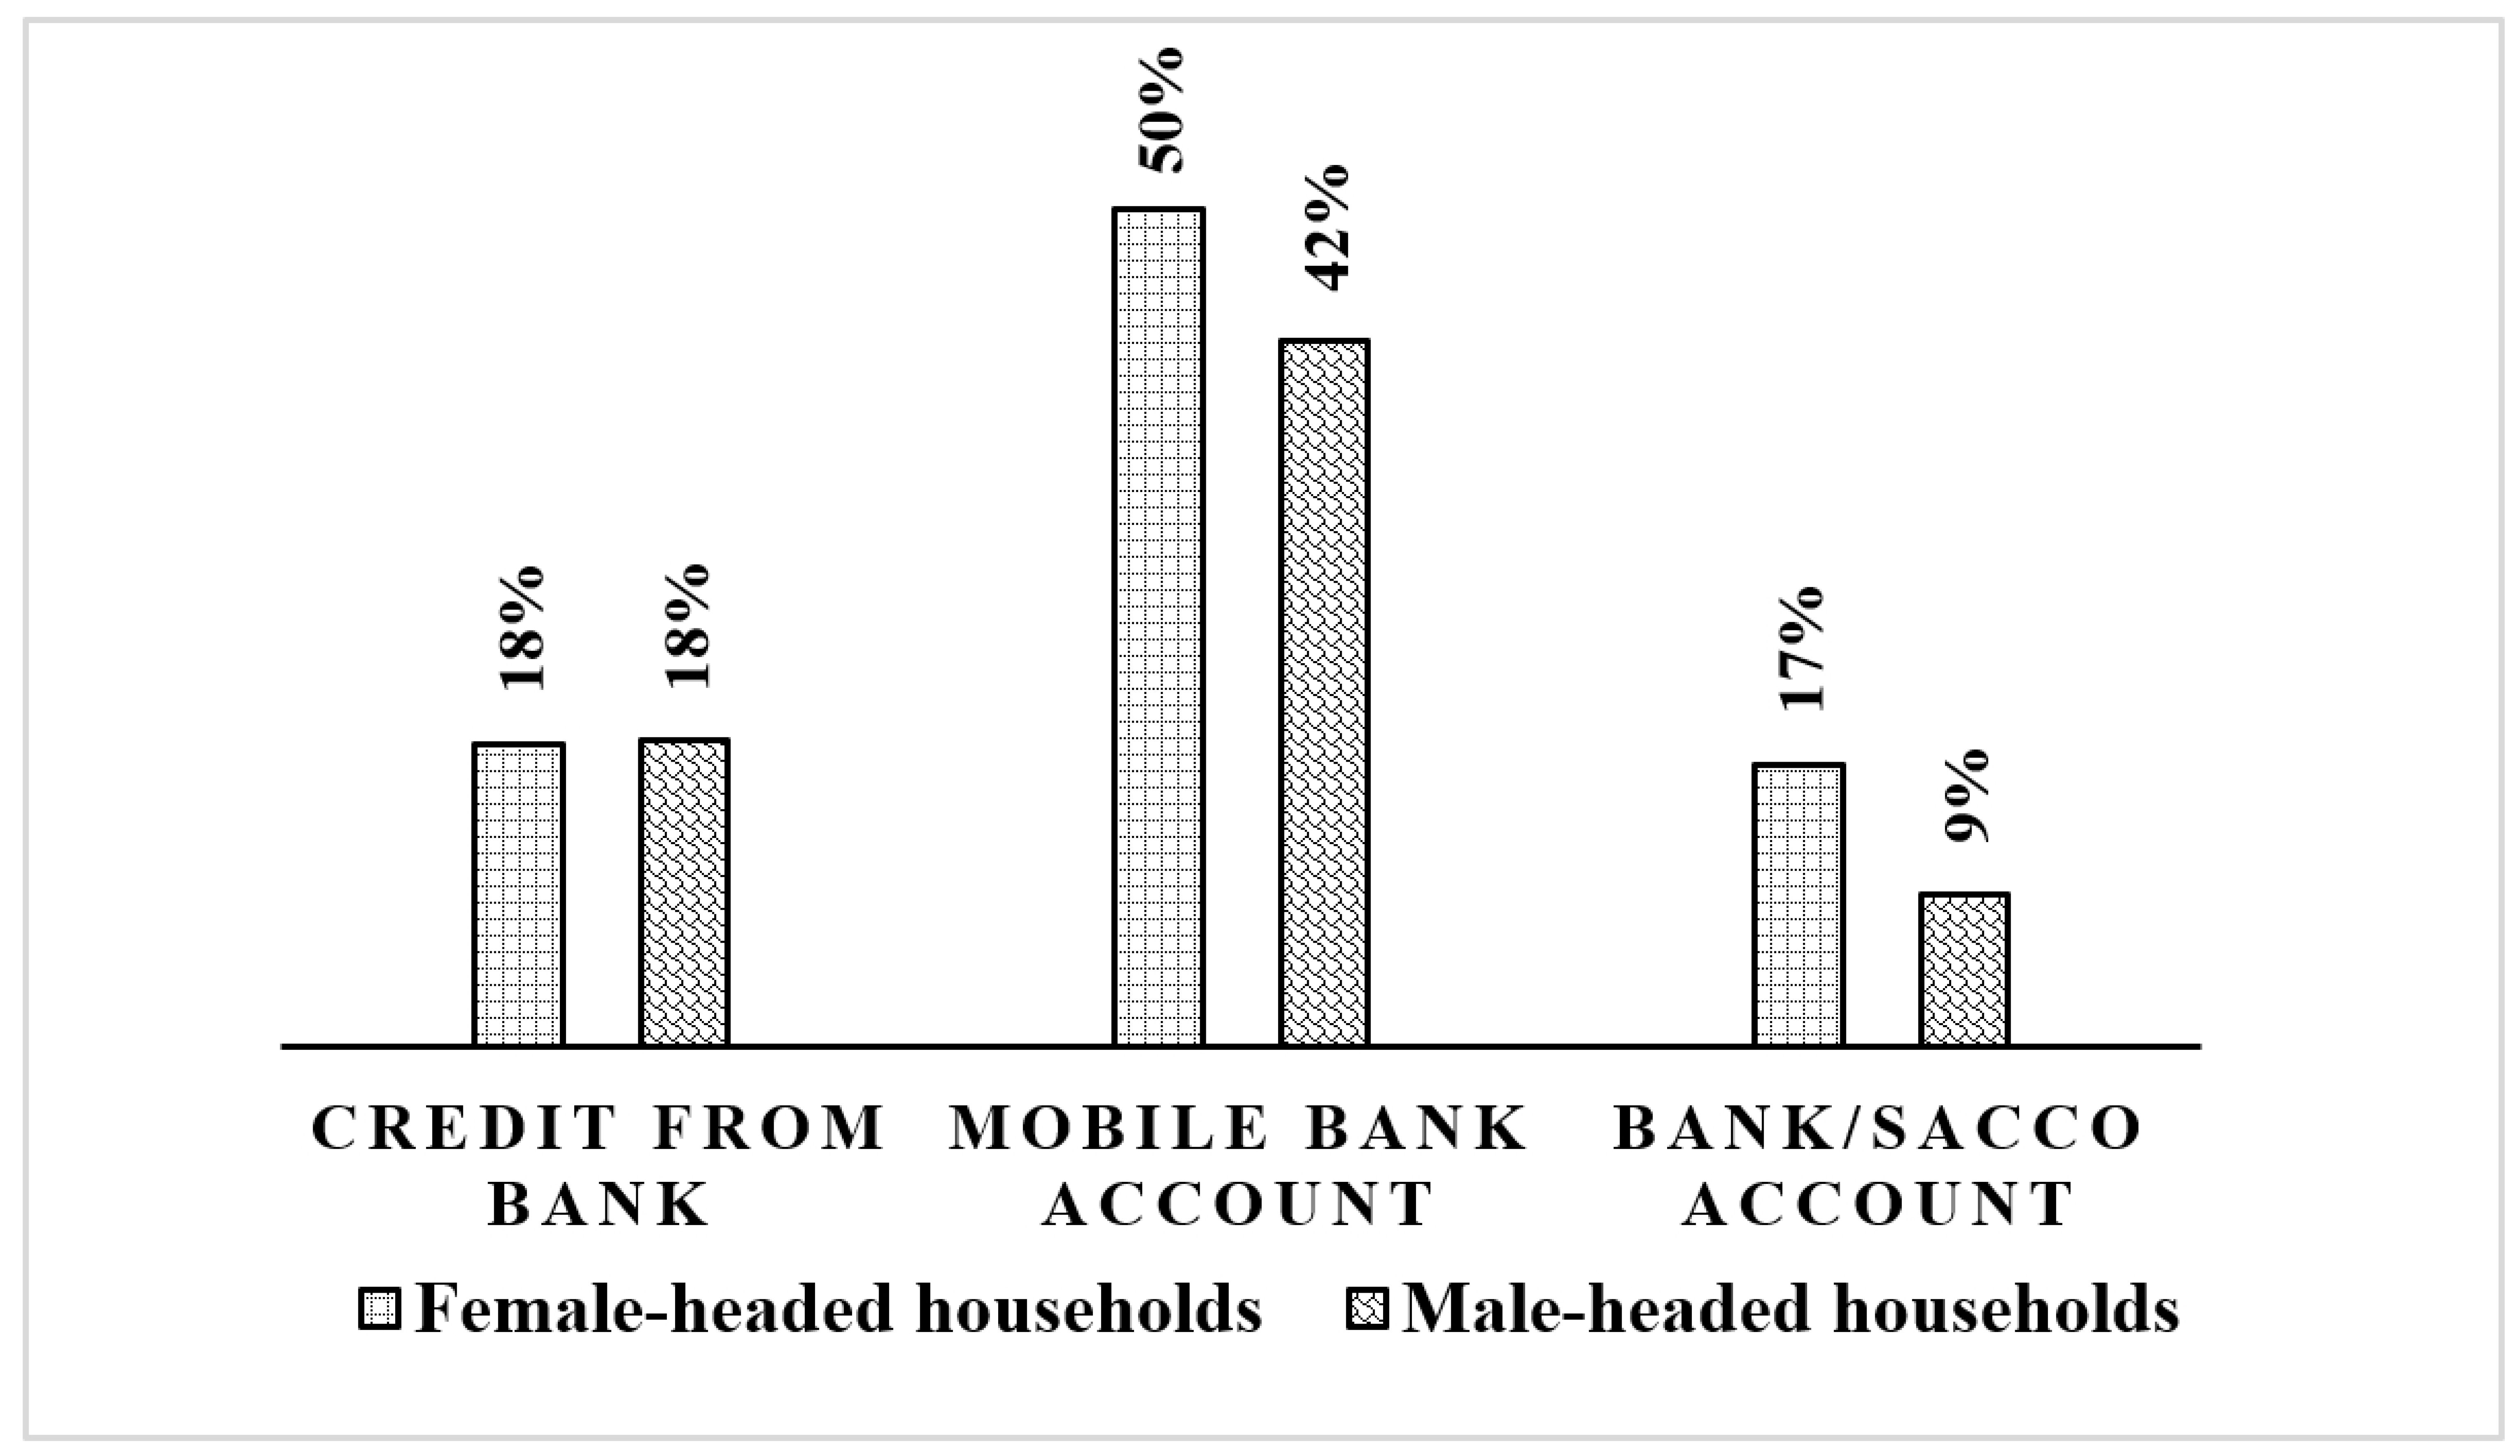
4.1. Social and Economic Profiles of Male and Female-Headed Households in Kakuma Refugee Camp in Kenya

Table 2 presents the means and percentages of the socio-economic characteristics of the households in the Kakuma refugee camp, stratified by the 735 male and 1094 female-headed households, including the pooled sample (1829). More than half of the households are female-headed. This is contrary to the recent UNHCR (2024d), which found 53 percent of the refugee population in Kakuma camp to be men. A comparison of the mean of financial inclusion suggests that female-headed households are more financially resilient, on average than male-headed households in the camp.
The average age of the household heads is 36 years, with male heads being significantly younger than their female counterparts. Thus, the bulk of the household heads belong to the workforce category and can engage in income-generating activities. Female-led households have significantly larger families and a higher dependency ratio than male-led households. This implies that female-headed households potentially utilize more financial and physical resources in their daily activities.
Nearly twice as many of the male household heads in the sample have obtained education in Kenya compared to their female counterparts, with 48 percent of the men having completed secondary education, compared with 28 percent of the women. This means that the male household heads are more educated and skilled, which can leverage them in securing skilled work, and this is consistent with 36 percent of male household heads who were able to earn weekly income (wages). This is consistent with the result that male-headed households engage in one more economic activity compared to the females. The male-headed households have significantly more asset accumulation, and nearly a quarter report having friends/relatives who have been resettled in high-income countries; this can supplement their income streams through remittances and investments in productive assets, which can be used as collateral to secure finances from formal institutions.
The social integration index indicates that male household heads are significantly more socially integrated than their female counterparts, implying that the former are more likely to feel safer, participate in community leadership, and have trust in their neighbors (Table 1). Almost two-thirds of the female household heads have a refugee identification card (ID) compared to slightly more than half of the male household heads, and this permits easy movement outside the camp and contributes to integration within the host region.

4.2. Drivers of Financial Inclusion Among Female and Male-Headed Households

This study used the ordered logit model to analyze the drivers of financial inclusion among female and male-headed households in the Kakuma refugee camp, as shown in Table 3. A multicollinearity test, as summarized in Table A1 (Appendix A) indicates the absence of multicollinearity among the variables with a Variance Inflation Factor (VIF) of 1.24, which is within the recommended threshold of less than 10. The dependent variable, financial inclusion, is a ranked categorical variable as households’ decisions to access financial services allocate each household to a low, moderate, or high financial inclusion category. The regression coefficients are presented as odds ratios based on the ordered logit model. Values of the odds ratio greater than one indicate higher probabilities of belonging to higher ranks of financial inclusion.
For female-headed households, having access to information increases the odds of belonging to higher categories of financial inclusion by about 55.8 percent. Having accumulated more assets increases the odds of being in higher categories of financial inclusion by about 77.4 percent, while those belonging to the highest category of food vulnerability have higher odds of being in higher ranks of financial inclusion by about 11.4 percent compared to those who are moderately food vulnerable. On the other hand, earning wages decreases the odds of being in higher ranks of financial inclusion by about 48.9 percent, and having friends/relatives resettled abroad decreases these odds by 40.4 percent. Interacting with neighbors similarly decreases the odds of belonging to higher categories of financial inclusion by 66.9 percent. An additional expenditure in education by one (1) Kenyan Shilling reduces the odds of being in higher ranks of financial inclusion by 88.5 percent.
For male-headed households, access to information increases the odds of belonging to higher categories of financial inclusion by about 76.0 percent, while having assets increases these odds by 37.2 percent. Similar to female-headed households, belonging to the highest rank of food vulnerable raises the odds of being in higher categories of financial inclusion by about 30.7 percent. The odds of being in higher categories of financial inclusion are reduced for households who earn wages by about 42.2 percent and similarly for those with friends/relatives resettled abroad by about 46.4 percent. In addition, both interacting with neighbors and being literate in English decrease the odds of being in higher categories of financial inclusion by 62.0 percent. Finally, an additional year in age lowers the odds by approximately 57.5 percent, while an increase in education expenditure by one (1) shilling reduces the odds by 87.1 percent.

4.3. Drivers of Social Integration Among Female and Male-Headed Households

The results of drivers of social integration among female and male-headed households in the Kakuma refugee camp are presented in Table 4. A VIF of 1.25 indicates there is no multicollinearity among the variables (Table A2, Appendix A). Similar to the results presented in Table 3, the values of the odds ratio greater than one indicate higher probabilities of belonging in higher ranks of social integration. For female-headed households, owning a smartphone increases the odds of being in higher categories of social integration by about 13.9 percent, while having friends/relatives resettled abroad increases these odds by about 27.5 percent. Being in the highest category of food vulnerability raises the odds of belonging in higher ranks of social integration by about 37.8 percent. Similarly, an increase in the household size by one member increases the odds of being in the higher category of social integration by about 54.8 percent, whereas an additional dependent in the household and being financially included reduces the odds by about 88.0 and 79.1 percent, respectively.
The results for the male-headed households indicate that a one-year increase in the age of the head increases the odds of belonging to the higher categories of social integration by about 19.6 percent. An additional member to the household increases these odds by about 26.0 percent while earning wages raises the odds by about 43.1 percent. Having friends resettled abroad and owning a smartphone increases the odds of being in higher ranks of social integration by about 43.1 percent and 62.0 percent, respectively. Whereas being highly food-vulnerable increases the odds of being in the higher categories of social integration by about 38.6 percent, being financially included lowers the odds by about 76.2 percent.

4.4. Estimation of the Gender Gap in Financial Inclusion

The study estimated the mean gender gap using the Blinder Oaxaca decomposition method. The estimated gender gap is shown in Table 5. The mean of the log of financial inclusion is 2.10 for male-headed households and 2.29 for their female counterparts; this significant result suggests that female-headed households are 19 percent more financially included. The endowment effect reveals the mean change in the financial inclusion of female-headed households, given similar characteristics to male-headed households. The endowment effect contributes 7 percent to the mean difference, while the coefficient effect, which is attributed to the structural aspects such as socio-economic and cultural norms, contributes 15 percent.

4.5. Estimation of the Gender Gap in Social Integration

In Table 6, the mean of the log of social integration is 1.10 for male-headed households and 1.09 for their female counterparts, yielding a statistically non-significant gender gap of 0.005. The endowment effect is statistically significant and contributes 2.1 percent to the gender gap.

5. Discussion

Vulnerability among refugee households can be a source of heterogeneity, which may stem from unequal access to resources and socio-cultural factors (Mendola & Pera, 2021). This could affect their active participation and successful integration into host communities. Addressing this heterogeneous vulnerability requires evidence-based policies drawn from studies of this nature, which analyze the gendered differences of the drivers of financial inclusion and social integration among refugees.
According to Daneshvar et al. (2017), financial inclusion is an important concept for inclusive transformation since it enhances productivity and livelihood diversification. The findings of the study provide evidence that access to needed information, participation in paid economic activity (proxied by earning a wage), having social ties in developed countries (proxied by having friends/relatives resettled abroad), wealth indicators and food (in)security are common factors that influence self-reliance of both male and female-headed refugee households. Access to necessary information can enhance the financial inclusion of vulnerable households. For example, male and female-headed households who receive the required information are more likely to be financially literate, thereby influencing their decisions to secure financial services such as owning a bank account (Njanike & Mpofu, 2024).
Male and female-headed refugee households that received wages from their participation in economic activities were less likely to be financially included. This finding contradicts Njanike and Mpofu (2024), who find that earning a wage/income increases the propensity of households to be more financially resilient. Households with accumulated assets were more likely to access formal financial products. A plausible explanation is that the formal nature of financial institutions can exclude individuals who lack collateral assets such as productive assets. These can be used to secure credit and reduce financial risk by the institutions. Although both male and female-headed households record higher levels of financial inclusion, the results suggest that women who have accumulated more assets are more likely than men to pursue formal financial services. This further suggests that when women are given more access to resources that would contribute to their wealth, they are more likely to own a bank account or access loans from their banks. This finding is consistent with Njanike and Mpofu (2024), who find that people in the highest wealth category are more likely to be financially resilient than those in lower wealth categories.
Social integration, proxied as interaction with neighbors for the analysis, was found to be an enabler of financial inclusion in both household types. Social integration, which is also gained through having friends and relatives resettled abroad, can be a major source of information, ideas, and support for individuals to acquire resources based on these relationships (Prayitno et al., 2022). It is, therefore, expected that this information flow would enhance financial literacy and consumption, which encompasses awareness of various financial services and products and their use (Potrich et al., 2015). The social network of refugees usually includes friends and relatives, and high remittance flows might reduce the tendency of refugees to access formal financial services, including bank accounts and loans. However, the finding contradicts Anarfo et al. (2020), who found that migrants who received remittances were less likely to be financially included.
Studies that analyze the relationship between food insecurity and financial inclusion have typically assessed the effects of financial inclusion on food insecurity (Arshad, 2022; Koomson et al., 2023). In this study, the influence of food insecurity on financial inclusion is measured using the food vulnerability index. The findings suggest that those households that experience higher levels of food insecurity are more likely to access formal financial products. These households are found to employ various strategies to access food. Considering that households in developing countries tend to spend a greater proportion of their income on purchasing food (Nsabimana et al., 2020), along with large household sizes (Table 2), it is possible that these refugee households are seeking financing to invest in agribusiness activities.
Female-headed households with high expenditures on education are less likely to seek formal financial products. While education should contribute positively to financial inclusion (Loaba, 2023), a plausible explanation for our finding may be that financial institutions lack project-specific products to support education policies, leading these households to prefer alternative financial sources.
Following a framework employed by Wither et al. (2023), social integration can be driven by human, physical, and social capital. Field (2016) argues that social capital covers bonding, bridging, and linking. Bonding social capital pertains to ties with close connections such as family, whereas bridging pertains to community (Putnam, 2001). Social capital consists of connections with people operating in different contexts that give access to resources that would otherwise be unavailable (Woolcock, 2001). Human and physical capital, on the other hand, refer to knowledge, experience, and wealth or assets. The findings of this study are consistent with the stipulations of the framework, as the results suggest that social integration is determined by factors including household size, connections abroad (social capital), age (human capital) and financial inclusion, ownership of smartphones, access to salaried employment, and food (in)security (financial or physical capital).
The study found that many of the drivers of social integration are intangible or non-materialistic, as noted by Wither et al. (2023). However, the findings suggest that incorporating these non-material factors into policy-making can contribute to the social integration of the refugees. This aligns with Park et al. (2024), who emphasized that non-economic factors can also contribute to migration decisions. For instance, demographic factors, including household size and age, are associated with social integration among male- and female-headed refugee households. According to Martey (2022), older people have more experience and wealth, which can strengthen community leadership structures.
The gender gap estimate for financial inclusion suggests that women-led households are better off than male-headed households, and this is consistent with the financial inclusion index, which is significantly higher for female-headed households than their male counterparts (Table 2). According to Bhatia and Singh (2019), the progressive development of financial systems has enhanced the scale of financial inclusion for women. The UNHCR (2024a) reports that a portion of cash assistance to refugee camps in Kakuma has been disbursed through bank accounts, with the majority of the beneficiaries being women. Women refugees have been empowered through training in artisanal and entrepreneurship skills that have enabled them to access different financial markets.
The study began by stating a clear hypothesis, and based on the findings established here, the study rejects the null hypothesis and concludes that there are significant socio-economic and institutional drivers of financial inclusion and social integration among refugees in Kakuma Refugee Camp.

6. Conclusions and Policy Implications

This study assessed the drivers of financial inclusion and social integration of refugee households in the Kakuma refugee camp in Kenya and estimated the gender gap in this context. The results suggest that access to information, employment, education expenditure, asset accumulation, and food vulnerability encourage financial inclusion among refugee households in the camp, regardless of gender. Interaction with neighbors and the age of the household head positively influence the financial inclusion of female- and male-led households, respectively. Social integration, irrespective of gender, is motivated by larger household sizes, ownership of a smartphone, and having ties in developed countries. Separately, a larger dependency ratio influences social integration in female-headed households, while age and employment influence social integration among the male counterparts. Based on the gender gap estimates, female-headed households are, on average, more financially included than male-headed refugee households, which suggests that female-headed households have experienced improved financial inclusion despite the persistence of structural factors. This requires further investigation to delve into the possible source(s) of the unexpected finding.
The study recommends that refugee households be provided with the information needed to make a relocation or integration decision, which can inform their extent of involvement in accessing formal financial services. The information can be provided through regular mobile message alerts. In addition, government and development partners can partner with older and more insightful refugee men on the preferred digital financial tools and embark on community sensitization activities to share information on how refugees can socially integrate more effectively with their host communities. This information can focus on the importance of group membership and interaction with neighbors as well as on building social cohesion and enhancing social integration in the host community.
Refugee households should also be empowered to accumulate assets relevant to their financial inclusion and insulate them against economic shocks. Since literacy in the English language enhances the financial inclusion of refugee households, it is recommended that policy-makers and development partners support refugees in acquiring the language skills necessary for understanding financial products. This may increase refugees’ willingness to participate in financial markets and access financial services critical to their economic empowerment.
Employment remains an important driver of financial inclusion and social integration in refugee households. This implies that policies that seek to enhance the self-reliance of refugee households should target job-creation efforts and ensure decent incomes. This can be achieved by promoting private and public partnerships that can enhance economic ventures, such as establishing business incubation centers where refugees can build skills while generating income. In this way, households can build their asset portfolios and convert them into income-generating assets.
Ownership of a smartphone, which is an indicator of digital inclusion, is an important driver of social integration for refugee households in Kenya. This calls for the extension of digital inclusion policies for refugee households to increase their social integration. By doing this, refugee households will find it easier to communicate with members of the broader society and access information.
Interestingly, both financial inclusion and social integration had positive and significant effects on each other when used as independent variables in the regressions. It confirms their interdependence and justification for joint consideration when designing refugee policies aimed at self-reliance. Stronger social integration can trigger the creation of social welfare/self-help groups to offer tailored financial products and benefits to members. It can enhance their bargaining power to approach formal financial institutions and obtain existing financial packages that would otherwise have been difficult to access as individuals. Public and private financial institutions can offer customized products such as interest-generating investment products for group-based clients and consequently boost a member’s access to personal financial services.
Finally, the finding on the gender gap suggests that financial inclusion and social integration among refugee households are characterized by substantial heterogeneities. This necessitates gender-sensitive policies that empower both female- and male-headed refugee households. The findings suggest that it is important to understand the sources of differences in degrees of financial inclusion and social integration between female- and male-headed refugee households to develop inclusive policies that can contribute to achieving holistic development for vulnerable groups such as refugees.
The main limitation of this study was that it did not capture emerging phenomena that pose a risk to self-reliance due to data limitations. For instance, climate-related factors are also relevant in the refugee context since the refugee camp is located in an arid area, which may contribute to different adaptation strategies. Hence, the conclusions can only be generalized within the scope of financial inclusion and social integration, as used in this study. The study adopted a methodological approach of defining and quantifying the thresholds (limits) of financial inclusion and social integration ex-post due to limited literature on predefined thresholds. Despite these limitations, the findings presented can provide valuable insights for policy-makers to implement targeted financial inclusion and social integration interventions. Future research can shed more light on innovative financial products used by refugees in their social institutions/groups that provide financial support. These can be examined and qualified as additional indicators of financial inclusion and social integration. The findings presented here reflect the specific context of Kakuma, and further research should verify whether similar findings are to be found in other camps/settlements.

Funding

This research was funded by the World Bank, grant number RS23501 and the APC was funded by the African Economic Research Consortium.

Informed Consent Statement

Informed consent was obtained from all subjects involved in the study.

Data Availability Statement

Data used in this study can be obtained in the UNHCR Microdata Library. “https://microdata.unhcr.org/index.php/catalog/302 (accessed on 2 October 2023)”.

Acknowledgments

Special thanks to the three anonymous reviewers, Tomson Ogwang, Rosemary Atieno, Erick Nyambedha, Germano Mwabu, Elizabeth Rose and fellow AERC colleagues for their technical contribution to this study.

Conflicts of Interest

The author declares no conflict of interest. The funders had no role in the design of the study, in the collection, analyses, or interpretation of data, in the writing of the manuscript, or in the decision to publish the results.

Appendix A

Table A1. Variance Inflation Factor (VIF) for drivers of financial inclusion.
VariableVIF1/VIF
Household size (ln)1.350.742359
Age of the household head (ln)1.480.676163
Access to information (yes)1.030.971774
Earned wages (yes)1.110.899302
Married (yes)1.050.951096
Friends/relatives resettled abroad (yes)1.110.899163
Education expenditure (Ksh., ln)1.230.813376
Asset index 1.270.78731
Food vulnerability
50th quantile1.370.730686
75th quantile1.450.688415
Interaction with neighbors (yes)1.030.971156
Dependency ratio (ln)1.160.858378
English literacy (yes)1.480.674891
Mean VIF1.24-
Table A2. Variance Inflation Factor (VIF) for drivers of social integration.
VariableVIF1/VIF
Household size (ln)1.350.742097
Age of household head (ln)1.470.681523
Access to information (yes)1.040.964652
Earned wages (yes)1.110.901216
Married (yes)1.050.956099
Friends/relatives resettled abroad (yes)1.10.91186
Education expenditure (log)1.250.801129
Dependency ratio (ln)1.170.854283
English literacy (yes)1.490.673347
Financial inclusion1.170.851299
Own smartphone (yes)1.180.845742
Food vulnerability
50th quantile1.380.72658
75th quantile1.450.691652
Mean VIF1.25-

Note

1
The exchange rate: 1 United States Dollar (USD) = 129.3 Kenya Shilling (KES) in August 2024.

References

  1. Alinovi, L., Mane, E., & Romano, D. (2009). Measuring household resilience to food insecurity: An application to palestinian households. In R. Benedetti, F. Piersimoni, M. Bee, & G. Espa (Eds.), Agricultural survey methods (pp. 557–582). Wiley. [Google Scholar]
  2. Allen, F., Demirguc-Kunt, A., Klapper, L., & Peria, M. S. M. (2016). The foundations of financial inclusion: Understanding ownership and use of formal accounts. Journal of Financial Intermediation, 27, 1–30. [Google Scholar] [CrossRef]
  3. Anarfo, E. B., Amewu, G., & Dzeha, G. C. (2020). Financial inclusion and migrant remittances in sub-Saharan Africa: A panel VAR approach. International Journal of Social Economics, 47, 809–829. [Google Scholar] [CrossRef]
  4. Arshad, A. (2022). Impact of financial inclusion on food security: Evidence from developing countries. International Journal of Social Economics, 49, 336–355. [Google Scholar] [CrossRef]
  5. Betts, A., Bloom, L., & Omata, N. (2022). Refugee economies: Forced displacement and development. Oxford University Press. [Google Scholar]
  6. Betts, A., Geervliet, R., MacPherson, C., Omata, N., Rodgers, C., & Sterck, O. (2018). Self-reliance in Kalobeyei? Socio-economic outcomes for refugees in North-West Kenya. Refugee Studies Centre, University of Oxford. [Google Scholar]
  7. Bhagat, A. (2020). Experimental financial inclusion as refugee management: Shelter insecurities at the bottom of the pyramid in Kenya. International Journal of Housing Policy, 21, 484–504. [Google Scholar] [CrossRef]
  8. Bhatia, S., & Singh, S. (2019). Empowering women through financial inclusion: A study of urban slum. Vikalpa, 44, 182–197. [Google Scholar] [CrossRef]
  9. Blinder, A. S. (1973). Wage discrimination: Reduced form and structural estimates. Journal of Human Resources, 8, 436–455. [Google Scholar] [CrossRef]
  10. Bloemraad, I., Esses, V. M., Kymlicka, W., & Zhou, Y. Y. (2023). Unpacking immigrant integration: Concepts, mechanisms, and context. World Development Report. [Google Scholar]
  11. Borjas, G. J. (2019). Immigration and economic growth. National Bureau of Economic Research. Working Paper 25836. [Google Scholar]
  12. Daneshvar, C., Garry, S., López, J., Santamaría, J., & Villarreal, F. G. (2017). Financial inclusion of small-scale rural producers: Trends and challenges. United Nations Economic Commission for Latin America and the Caribbean (ECLAC). [Google Scholar]
  13. Dhawan, S. M., Wilson, K., & Zademach, H.-M. (2024). From financial inclusion to financial health of refugees: Urging for a shift in perspective. Third World Quarterly, 45, 926–945. [Google Scholar] [CrossRef]
  14. Field, J. (2016). Social capital (3rd ed.). Routledge. [Google Scholar]
  15. Global Partnership for Financial Inclusion (GPFI). (2020). G20 2020 financial inclusion action plan. Available online: https://www.gpfi.org/publications (accessed on 24 February 2025).
  16. Government of Kenya. (2021). The Kenya poverty report based on the 2021 Kenya continuous household survey. Kenya National Bureau of Statistics. [Google Scholar]
  17. Government of Kenya. (2023). Third county integrated development plan: 2023–2027. Turkana County Government. [Google Scholar]
  18. Gujarati, D. N. (2015). Econometrics by example (2nd ed.). Palgrave Macmillan. [Google Scholar]
  19. Habib, R. R., El-Harakeh, A., Ziadee, M., Younes, E. A., & El Asmar, K. (2020). Social capital, social cohesion, and health of Syrian refugee working children living in informal tented settlements in Lebanon: A cross-sectional study. PLoS Medicine, 17, e1003283. [Google Scholar] [CrossRef]
  20. Hughes, K., & Bushell, H. (2013). A multidimensional approach for measuring resilience. Working paper. Oxfam GB. [Google Scholar]
  21. International Finance Corporation (IFC). (2018). Kakuma as a marketplace: A consumer and market study of a refugee camp and town in Northwest Kenya. World Bank. [Google Scholar]
  22. Jann, B. (2008). The blinder–oaxaca decomposition for linear regression models. The Stata Journal, 8, 453–479. [Google Scholar] [CrossRef]
  23. Jenson, J. (2010). Defining and measuring social cohesion. No. 1. Commonwealth Secretariat. [Google Scholar]
  24. Jiang, Y., & Liu, Y. (2022). Does financial inclusion help alleviate household poverty and vulnerability in China? PLoS ONE, 17, e0275577. [Google Scholar] [CrossRef]
  25. Kling, G., Pesqué-Cela, V., Tian, L., & Luo, D. (2020). A theory of financial inclusion and income inequality. The European Journal of Finance, 28(1), 137–157. [Google Scholar] [CrossRef]
  26. Koomson, I., Koomson, P., & Abdul-Mumuni, A. (2023). Trust in banks, financial inclusion and the mediating role of borrower discouragement. International Review of Economics and Finance, 88, 1418–1431. [Google Scholar] [CrossRef]
  27. Koomson, I., Villano, R. A., & Hadley, D. (2020). Effect of financial inclusion on poverty and vulnerability to poverty: Evidence using a multidimensional measure of financial inclusion. Social Indicators Research, 149, 613–639. [Google Scholar] [CrossRef]
  28. Krause, U. (2021). Difficult life in a refugee camp: Gender, violence, and coping in Uganda. Cambridge University Press. [Google Scholar]
  29. Le Roux, B., & Rouanet, H. (2010). Multiple correspondence analysis (Vol. 163). Sage. [Google Scholar]
  30. Link, A.-C., Zhu, Y., & Karutz, R. (2021). Quantification of resilience considering different migration biographies: A case study of Pune, India. Land, 10, 1134. [Google Scholar] [CrossRef]
  31. Loaba, S. (2023). Gender-related differences in access to financial accounts in sub-Saharan Africa. International Economic Journal, 37, 601–617. [Google Scholar] [CrossRef]
  32. Martey, E. (2022). Blessing or burden: The elderly and household welfare in Ghana. Social Indicators Research, 162, 803–827. [Google Scholar] [CrossRef]
  33. Masten, A. S. (2014). Global perspectives on resilience in children and youth. Child Development, 1, 6–20. [Google Scholar] [CrossRef]
  34. Mendola, D., & Pera, A. (2021). Vulnerability of refugees: Some reflections on definitions and measurement practices. International Migration, 5, 108–121. [Google Scholar] [CrossRef]
  35. Morsy, H. (2020). Access to finance—Mind the gender gap. The Quarterly Review of Economics and Finance, 78, 12–21. [Google Scholar] [CrossRef]
  36. Muricho, D. N., Otieno, D. J., Oluoch-Kosura, W., & Jirström, M. (2019). Building pastoralists’ resilience to shocks for sustainable disaster risk mitigation: Lessons from West Pokot County, Kenya. International Journal of Disaster Risk Reduction, 34, 429–435. [Google Scholar] [CrossRef]
  37. Naseh, M., Lee, J., Zeng, Y., Nabunya, P., Alvarez, V., & Safi, M. (2024). Understanding economic integration in immigrant and refugee populations: A scoping review of concepts and metrics in the United States. Economies, 12, 167. [Google Scholar] [CrossRef]
  38. Njanike, K., & Mpofu, R. T. (2024). Factors influencing financial inclusion for social inclusion in selected African countries. Insight on Africa, 16, 93–112. [Google Scholar] [CrossRef]
  39. Nsabimana, A., Swain, R. B., Surry, Y., & Ngabitsinze, J. C. (2020). Income and food engel curves in Rwanda: A household microdata analysis. Agricultural and Food Economics, 8, 1–20. [Google Scholar] [CrossRef]
  40. Oaxaca, R. (1973). Male-Female Wage Differentials in urban labor markets. International Economic Review, 14, 693–709. [Google Scholar] [CrossRef]
  41. Okello, A. O., Nzuma, J. M., Otieno, D. J., Kidoido, M., & Tanga, C. M. (2021). Farmers’ perceptions of commercial insect-based feed for sustainable livestock production in Kenya. Sustainability, 13(10), 5359. [Google Scholar] [CrossRef]
  42. Ozili, P. K. (2021). Financial inclusion research around the world: A review. Forum for Social Economics, 50(4), 457–79. [Google Scholar] [CrossRef]
  43. Papadopoulos, R. K. (2021). Involuntary dislocation: Home, trauma, resilience, and adversity-activated development. Routledge. [Google Scholar] [CrossRef]
  44. Park, J., Lee, S., & Park, J. (2024). The economic decision of international migration: Two empirical evidences from the United States and Canada. Economies, 12, 214. [Google Scholar] [CrossRef]
  45. Potrich, A. C. G., Vieira, K. M., & Kirch, G. (2015). Determinants of financial literacy: Analysis of the influence of socioeconomic and demographic variables. Revista Contabilidade and Finanças, 26, 362–377. [Google Scholar] [CrossRef]
  46. Prayitno, G., Dinanti, D., Efendi, A., Hayat, A., & Dewi, P. P. (2022). Social capital of Pujon Kidul communities in supporting the development of the COVID-19 resilience village. International Journal of Sustainable Development and Planning, 17, 251–257. [Google Scholar] [CrossRef]
  47. Putnam, R. (2001). Social capital: Measurement and consequences. Canadian Journal of Policy Research, 2, 41–51. [Google Scholar]
  48. Rutter, M. (2006). Implications of resilience concepts for scientific understanding. Annals of the New York Academy of Sciences, 1094, 1–12. [Google Scholar] [CrossRef] [PubMed]
  49. Sarma, M. (2008). Index of financial inclusion. Working paper. Indian Council for Research on International Economic Relations. [Google Scholar]
  50. Swamy, V. (2014). Financial inclusion, gender dimension, and economic impact on poor households. World Development, 56, 1–15. [Google Scholar] [CrossRef]
  51. UNHCR. (2018). Global compact on refugees indicator report. UNHCR. [Google Scholar]
  52. UNHCR. (2022). The global compact on refugees: Progress report. UNHCR. [Google Scholar]
  53. UNHCR. (2023). Global report: East and Horn of Africa and the Great Lakes. UNHCR. [Google Scholar]
  54. UNHCR. (2024a). Data-driven support for refugee resilience in East, Horn and Great Lakes of Africa. Available online: https://www.unhcr.org/blogs/data-driven-support-for-refugee-self-reliance-in-east-horn-and-great-lakes-of-africa/ (accessed on 4 August 2024).
  55. UNHCR. (2024b). Global population planning figures. Global Appeal. [Google Scholar]
  56. UNHCR. (2024c). Global trends: Forced displacement in 2023. UNHCR. [Google Scholar]
  57. UNHCR. (2024d). Kenya registered refugees and asylum seekers as of June 30, 2024. Kenya statistics package. Available online: https://www.unhcr.org/ke/what-we-do/reports-and-publications/kenya-operation-statistics (accessed on 4 August 2024).
  58. UNHCR & World Bank. (2019a). Socioeconomic survey of refugees in Kakuma. UNHCR Microdata Library. Available online: https://microdata.unhcr.org/index.php/catalog/302 (accessed on 24 February 2025).
  59. UNHCR & World Bank. (2019b). Understanding the socioeconomic conditions of refugees in Kenya (Vol. A). Kalobeyei Settlement. [Google Scholar]
  60. UNHCR & World Bank. (2021). Understanding the socioeconomic differences of urban and camp-based refugees in Kenya. Comparative Analysis Brief. [Google Scholar]
  61. Valentova, M. (2016). How do traditional gender roles relate to social cohesion? Focus on differences between women and men. Social Indicators Research, 127, 153–178. [Google Scholar] [CrossRef]
  62. van Horn, A., Weitz, C. A., Olszowy, K. M., Dancause, K. N., Sun, C., Pomer, A., Silverman, H., Lee, G., Tarivonda, L., Chan, C. W., Kaneko, A., Lum, J. K., & Garruto, R. M. (2019). Using multiple correspondence analysis to identify behaviour patterns associated with overweight and obesity in vanuatu adults. Public Health Nutrition, 22, 1533–1544. [Google Scholar] [CrossRef]
  63. Wellalage, N. H., & Locke, S. (2020). Remittance and financial inclusion in refugee migrants: Inverse probability of treatment weighting using the propensity score. Applied Economics, 52, 929–950. [Google Scholar] [CrossRef]
  64. Wessendorf, S., & Phillimore, J. (2019). New migrants’ social integration, embedding and emplacement in superdiverse contexts. Sociology, 53, 123–138. [Google Scholar] [CrossRef]
  65. Wither, D., Orchiston, C., & Nel, E. (2023). Using the living standards framework to analyse the drivers of social resilience in a disaster management context. Policy Quarterly, 19, 58–66. [Google Scholar] [CrossRef]
  66. Woolcock, M. (2001). The place of social capital in understanding social and economic outcomes. Canadian Journal of Policy Research, 2, 11–17. [Google Scholar]
  67. Wooldridge, J. M. (2010). Econometric analysis of cross section and panel data. MIT Press. [Google Scholar]
  68. World Bank. (2021). Refugee policy review framework. Technical note. World Bank. [Google Scholar]
Figure 1. Indicators of financial inclusion disaggregated by gender of the household head of refugees in Kakuma camp in Kenya. Source: author’s computation from survey data.
Economies 13 00075 g001
Table 1. Means of social integration indicators disaggregated on gender of household head in Kakuma refugee camp in Kenya.
Social Integration IndicatorsFemale-Headed Households (N = 1094)Male-Headed Households (N = 735)Pooled (N = 1829)
1.Do you feel that people in this neighborhood are trustworthy?4.15 (1.13)4.16 (1.12)4.15 (1.12)
2.Do you feel that most people in the host community are trustworthy?3.26 (1.28)3.37 (1.30)3.31 (1.29)
3.Would you feel safe if you went to Kakuma town by yourself?3.80 (1.12)3.81 (1.19)3.80 (1.15)
4.Would you feel comfortable if your child or grandchild were to socialize or be friends with
children of host community people?
3.10 (1.33)3.17 (1.34)3.13 (1.33)
5.Do you feel safe walking alone in your area/neighborhood during the day?4.35 (0.80)4.33 (0.89)4.34 (0.86)
6.Do you feel safe walking alone in your area/neighborhood at night?2.11 (1.11)2.19 (1.17)2.14 (1.14)
7.Do you feel that you are able to express your opinion through the existing community leadership structure?3.55 (1.16)3.59 (1.18)3.57 (1.17)
8.Do you feel like your opinion is being considered for decisions that affect your well-being?3.18 (1.18)3.29 (1.24)3.23 (1.21)
9.How much would you say the political system in Kenya allows people like you to have a say in what the government does?2.43 (1.37)2.53 (1.40)2.47 (1.38)
Notes: Response scale: 1 = strongly disagree, 2 = disagree, 3 = neither agree nor disagree, 4 = agree, 5 = strongly agree, and standard errors are in parentheses. Source: author’s computation from survey data.
Table 2. Social and economic profiles of male and female-headed households in Kakuma refugee camp in Kenya.
Female-Headed Households
(N = 1094,
59.81%)
Male-Headed Households
(N = 735,
40.19%)
Pooled
(N = 1829)
Household head characteristicsMean or %Mean or %Mean or %Difference in means by gender
Dependent variables
Financial inclusion index0.08 (0.03)−0.12 (0.04)6.55 × 10⁻⁹ (1.00)−4.28 ***
Social integration index−0.35 (2.26)0.22 (3.89)−0.12 (3.03)3.91 ***
Explanatory variables
Average age in years37.15 (11.11)33.39 (11.28)35.60 (11.33)−7.2149 ***
Age groups:
<18 years
18–60 years
>60 years

1.46
95.16
3.38

3.40
95.37
1.22

2.24
95.24
2.52
15.5119 ***
Average household size7.68 (3.70)5.85 (4.14)6.94 (3.99)−9.8410 ***
Dependency ratio1.46 (1.32)0.83 (0.94)1.21 (1.22)−11.1954 ***
Married (% yes)23.776.2616.7396.72 ***
Attended school in Kenya (% yes)41.7781.6357.79286.34 ***
Highest education attained (% Secondary and above)28.2447.7636.0972.56 ***
Average education expenditure in KES.6324.71 (12,178)6443 (10,056.73)6367.11 (11,463.95)0.1833
Earned wages (% yes)17.8236.1925.2178.66 ***
Average number of economic activities0.4 (0.82)0.66 (0.97)0.5 (0.89)−6.08 ***
Access to needed information (% yes)54.4854.5654.510.0011
Willing to leave Kenya (% yes)82.4583.5482.890.35
Possession of Refugee ID (% yes)61.5254.2958.619.48 ***
Asset accumulation index−0.33 (1.65)0.12 (2.04)0 (1)5.11 ***
Friends/relatives resettled abroad (% yes)16.3622.3118.7510.2283 ***
Interaction with neighbors outside the camp54.0249.5252.213.5651 *
Notes: *** and * represent 1 percent and 10 percent levels of statistical significance, respectively, and standard deviations are presented in parentheses; Kenya Shilling (KES).
Table 3. Drivers of financial inclusion among female and male-headed households in Kakuma refugee camp in Kenya.
Female-Headed Households Male-Headed
Households
VariablesOdds Ratioρ-ValueOdds Ratioρ-Value
Household size (ln)0.786 (0.101)0.0600.898 (0.109)0.375
Age of the household head (ln)0.943 (0.233)0.8110.575 ** (0.162)0.050
Access to information (yes)1.558 *** (0.203)0.0011.760 *** (0.283)0.000
Earned wages (yes)0.489 *** (0.086)0.0000.422 *** (0.075)0.000
Married (yes)1.180 (0.184)0.2870.772 (0.272)0.462
Friends/relatives resettled abroad (yes)0.404 *** (0.075)0.0000.464 *** (0.099)0.000
Education expenditure (KES., ln)0.885 ** (0.045)0.0170.871 ** (0.061)0.048
Asset index 1.774 *** (0.148)0.0001.372 *** (0.115)0.000
Food vulnerability
50th quantile1.567 *** (0.239)0.0031.667 ** (0.347)0.014
75th quantile2.114 *** (0.350)0.0002.307 *** (0.466)0.000
Interaction with neighbors (yes)0.669 *** (0.087)0.0020.620 *** (0.099)0.003
Dependency ratio (ln)1.023(0.054)0.6621.151 (0.128)0.208
English literacy (yes)0.990 (0.173)0.9540.620 *** (0.115)0.010
/Cut 1−1.216 (1.102) −3.571 (1.189)
/Cut 2−0.934 (1.102) −3.259 (1.188)
Pseudo R20.1096 *** 0.1165 ***
Observations1094 735
Notes: the dependent variable is ranked financial inclusion, ** and *** represent statistical significance at 5 percent and 1 percent, respectively; standard errors are in parentheses, and Cut1 and Cut2 are the intercepts for the second and third categories, while the intercept for category one is normalized to zero; Kenya Shilling (KES).
Table 4. Drivers of social integration among female and male-headed households in Kakuma refugee camp in Kenya.
Female-Headed Households Male-Headed Households
VariablesOdds Ratioρ-ValueOdds Ratioρ-Value
Household size (ln)1.548 *** (0.183)0.0001.260 ** (0.137)0.034
Age of household head (ln)1.319 (0.300)0.2243.196 *** (0.834)0.000
Access to information (yes)1.170 (0.141)0.1941.133 (0.169)0.403
Earned wages (yes)1.280 (0.202)0.1171.431 ** (0.235)0.030
Married (yes)1.329 (0.187)0.0431.666 (0.529)0.108
Friends/relatives resettled abroad (yes)2.275 *** (0.374)0.0001.620 *** (0.300)0.009
Education expenditure (KES, ln)0.979 (0.046)0.6480.957 (0.062)0.499
Dependency ratio (ln)0.880 ** (0.044)0.0111.041 (0.106)0.694
English literacy (yes)0.993 (0.574)0.9641.012 (0.177)0.946
Financial inclusion0.791 *** (0.053)0.0000.762 *** (0.060)0.001
Own smartphone (yes)3.139 *** (0.405)0.0003.734 *** (0.599)0.000
Food vulnerability
50th quantile1.173 (0.168)0.2661.107 (0.213)0.599
75th quantile1.378 *** (0.208)0.0331.386 * (0.258)0.080
/Cut 12.054 (1.006) 4.788 (1.094)
/Cut 23.708 (1.011) 6.212 (1.104)
Pseudo R20.1043 0.1354
Observations1094 735
Notes: The dependent variable is ranked social integration, *, **, and *** represent statistical significance at 10 percent, 5 percent, and 1 percent, respectively; standard errors are in parentheses, and Cut1 and Cut2 are the intercepts for the second and third categories while the intercept for category one is normalized to zero; Kenya Shilling (KES).
Table 5. Oaxaca decomposition of log value of financial inclusion.
Mean Gender DifferentialCoefficients
Mean male-headed household financial inclusion2.10 *** (0.04)
Mean female-headed household financial inclusion2.29 *** (0.03)
Mean gender gap in financial inclusion−0.19 *** (0.05)
Endowment effect−0.07 ** (0.03)
Coefficient effect−0.15 *** (0.06)
Interaction effect0.03 (0.05)
Notes: **, and *** represent statistical significance at 10 percent, 5 percent, and 1 percent, respectively; robust standard errors are in parentheses.
Table 6. Oaxaca decomposition of log value of social integration.
Mean Gender DifferentialCoefficients
Mean male-headed household social integration1.097 *** (0.011)
Mean female-headed household social integration1.092 *** (0.008)
Mean gender gap in social integration0.005 (0.014)
Endowment effect0.021 ** (0.008)
Coefficient effect−0.004 (0.016)
Interaction effect0.011 (0.013)
Notes: ** and *** represent statistical significance at 5 percent and 1 percent, respectively; robust standard errors are in parentheses.
Disclaimer/Publisher’s Note: The statements, opinions and data contained in all publications are solely those of the individual author(s) and contributor(s) and not of MDPI and/or the editor(s). MDPI and/or the editor(s) disclaim responsibility for any injury to people or property resulting from any ideas, methods, instructions or products referred to in the content.

