Review

Determinants of Household Debt: A Systematic Review of the Literature

by
Cloudio Kumbirai Chikeya
1,* and
Lungile Ntsalaze
2
1
Johannesburg Business School, University of Johannesburg, Johannesburg 2092, South Africa
2
College for Business & Economics, University of Johannesburg, Johannesburg 2092, South Africa
*
Author to whom correspondence should be addressed.
Economies 2025, 13(3), 76; https://doi.org/10.3390/economies13030076
Submission received: 8 November 2024 / Revised: 20 February 2025 / Accepted: 24 February 2025 / Published: 15 March 2025

Abstract

:
Household debt plays a crucial role in influencing the performance of the economy and its vulnerability to shocks. This study synthesises studies on this topic. We used the systematic literature review technique to analyse 97 studies from the EBSCO, Google Scholars, Sabinet African Journals, SAGE, ScienceDirect, Scopus, Springer Link, Taylor and Francis, and Web of Science databases from 2004 to 2024. The results reveal that country-level and household-specific factors are important in explaining debt. We delineate supply-side and demand factors that drive debt. Country-level factors that explain indebtedness include housing prices, unemployment, economic growth, interest rates, inflation, and income levels. At the household level, factors such as education level, behaviour, social status, employment, house prices, income, family size, occupation, wealth, and marital status explain indebtedness. Policies impact loan types differently; therefore, due consideration should be taken and prescriptions should aim to address both supply and demand factors. Future studies should rely on AI-driven methods and techniques that utilise natural language processing capabilities such as sentiment analysis in order to handle large data sets and ensure objectivity.

1. Introduction

Household debt plays a crucial role in the well-being of individuals, families, and the economy. Debt allows households to consume goods and services that would otherwise be beyond their reach, thus facilitating consumption smoothing and economic stability (Harari, 2018). Access to credit can also increase financial inclusion, reduce poverty, and support investments. Notwithstanding these benefits, rising household debt comes with significant risks, such as financial crises, rising income inequality, and economic instability (Stockhammer, 2015; Wong et al., 2023). For instance, in the event of economic shocks, high household debt levels result in non-performing loans that weaken bank balance sheets and spread to other financial institutions through the contagion effect. This could result in an unstable financial sector that restricts lending to profitable investments and deserving households. Ultimately, household consumption and investment decrease, thereby lowering economic growth.
The 2008/09 global financial crisis brought the debate about household indebtedness and its causes to the fore. Household debt rose before the crisis in most countries around the world, including Europe and Asia. Over the last few decades, the amount of debt has tripled globally, and so has the incidence of over-indebtedness (Abd Samad et al., 2020; Heintz-Martin et al., 2021; Jestl, 2023). However, there is no consensus regarding the drivers of this trend. As a result, the need to understand household credit behaviour has increased, and many studies (Abid et al., 2012; Annarelli, 2022; Barradas & Tomas, 2023; Barrot et al., 2022; Lewin-Epstein & Semyonov, 2016; Mamatzakis et al., 2023; Pan, 2023; Vijverberg, 2024) have attempted to identify the factors driving household indebtedness. In most instances, the results from different studies have been conflicting and inconclusive, leaving policymakers in a state of misperception. Some studies have concentrated on macroeconomic factors (Enache, 2022; Park & Lee, 2018; Zhou & Niyitegeka, 2023), whereas others have focused on household-specific factors (Comelli, 2021; Haq et al., 2018; Pandey, 2016). However, these studies have varied in terms of the period covered, geographical locations, methods used, and their parametric scope. No single study has been able to cover all the important factors. There has been no attempt to reconcile evidence from studies focusing on macroeconomic factors and those covering household factors to expand policy. This has left unanswered questions in the literature and left a quagmire for policymakers. For instance, what explain the rise in household debt across the world? Are the factors explaining household debt universal across countries in different regions? Do the various forms of debt respond to different factors in uniform manner? Therefore, this study contributes to the literature and policymaking by bridging the existing gap through conducting a comprehensive review of the existing empirical literature to reconcile theory and evidence, as well as evidence from numerous previous studies on the topic. Studies have largely shunned developing countries, concentrating on OECD and European Union countries. At the same time a clear distinction of supply and demand factors is lacking. Household studies have not exhausted behavioural factors that could explain household debt. Therefore, this review seeks to bridge this gap in a novel way through: (1) Combining studies conducted in different geographical regions in order to identify if results are in agreement. (2) It also combines studies that examined household and macroeconomic factors with the objective of identifying common variables. (3) This study explores if different types of debt respond in the same manner to common factors. (4) Lastly, it identifies the supply and demand factors that explain debt in order to help policymakers design policy prescriptions targeting relevant institutions.
This current study differs from past systematic literature reviews focusing on household debt conducted by Abd Samad et al. (2023) and Zinman (2015) in a number of ways. Firstly, Abd Samad et al. (2023) focused on the macroeconomic determinants of household debt, whereas the current study combines macroeconomic factors and household factors. Though Zinman (2015) touches on factors that influence household borrowing, their study explores the prevalence of household debt and the level, composition, and growth in household debt. Furthermore, Zinman (2015) focuses on measures of consumer choice and the effects of borrowing on the opportunity cost of consumption among other issues. More specifically, the review does not focus on comprehensively reviewing the determinants of household debt as is the subject of this paper. Secondly, neither study utilised the Preferred Reporting Items for Systematic reviews and Meta-Analyses (PRISMA) guidelines to conduct their reviews. This methodology difference makes the studies significantly different. Abd Samad et al. (2023) rely on reporting standards for systematic evidence synthesis (ROSES), whereas Zinman (2015) did not rely on a specific framework. Lastly, this research utilises nine databases as compared to Abd Samad et al. (2023) who selected articles from Scopus and Web of Science only.
Existing studies have identified several factors as determinants of household debt, such as income inequality (Jestl, 2023), having a child (Dharmadasa & Gunatilake, 2023), and risk attitude (Branten, 2022). Dumitrescu et al. (2022) revealed that economic growth, inflation, unemployment, and public expenditure lowered household debt in OECD countries, whereas house prices, investments, and mortgage interest rates had positive effects. The positive effect implies that these variables enhanced household indebtedness. Moore and Stockhammer (2018) investigated the impact of house prices, wages, interest rates, financial assets, expenditure, welfare, and age structure on household debt in OECD countries. They find that house prices have a robust positive effect only in the short run. Abd Samad et al. (2020) concentrated on emerging markets and found that financial development, housing prices, and lending interest rates had a positive effect on household debt, whereas inflation and lending rates had a negative effect. Meniago et al. (2013) established that household debt in South Africa is significantly affected by consumer prices, gross domestic product, and household consumption. House prices and household savings were positive but insignificant, whereas income was negative and insignificant. Evidently, the results vary and conflict, in some instances.
A significant number of authors (Biyanwila & Anuradha, 2023; Karambakuwa & Ncwadi, 2021; Leandro & Botelho, 2022; Mohammad et al., 2021) have examined the determinants of over-indebtedness for households. The current study distinguishes between household indebtedness and over-indebtedness. Over-indebtedness is defined as a permanent state in which an individual fails to meet recurrent expenditures (Sierminska, 2014). The European Commission (2008) defines it as a state in which current and future resources are insufficient to meet financial obligations without adversely affecting the standard of living. Consequently, measures such as the subjective perception of burden, the cost of servicing debt (more than 25% of gross income), and arrears have been used to measure over-indebtedness (D’Alessio & Iezzi, 2013). However, we concentrate on indebtedness, which is a state of owning money or holding debt. Our study combines both household-level and country-level studies. Further to that, we seek to identify the demand and supply factors that explain household debt.
This research distinguishes between country- and household-specific studies and compares the common factors identified in the literature to gain a comprehensive understanding of the supply and demand factors that explain household indebtedness. This study synthesises the literature on the determinants of household debt across time and geographical locations. This undertaking is crucial because (1) credit markets have evolved over the years due to changes in consumer behaviour, the advent of financial technology, prudential regulations, and economic policies such as financial liberalisation; (2) results from previous research are varied and conflicting; and (3) there is a need to highlight the current state of research on the subject by identifying gaps and important trends. This helps policymakers who usually have an overwhelming amount of information on which to base their decisions.
Despite conflicting results from past studies, the paper identifies factors that drive household debt, something that individual studies could not achieve. Increases in house prices enhances debt, whereas an increase in interest rates lowers the same. Unemployment, old age, and a lack of education reduce access to debt. As much as lower level of income makes the borrower less attractive to lenders, higher levels of income can also reduce reliance on debt to supplement consumption. Therefore, the impact of income and economic growth on debt largely depends on the levels of household debt as well. Households with more family members, with more children, and those located in towns are likely to have more debt. The effects of these variables vary with the type of debt. Supply factors, such as the level of financial development, financial deregulation, and the quality of institutions, positively influence financial intuitions’ willingness to extend credit to households. Theories, such as the house pricing hypothesis, the financial deregulation hypothesis, the credit supply hypothesis, and the age structure hypothesis, were confirmed by the evidence, whereas contradictory evidence was found in relation to the Rajan and expenditure cascade hypotheses. More studies are required to test the effects of income and economic growth.

2. Methodology

This study used a systematic literature review (SLR) to meet its objectives. It relies on the updated Preferred Reporting Items for Systematic reviews and Meta-Analyses (PRISMA) to ensure transparency and completeness in reporting (British Medical Journal [BMJ], 2021). The choice SLR was influenced by its efficiency in thoroughly scrutinising a specific topic or field. It reduces biassed and subjective deductions, and enhances the investigatory nature of the research by restricting sample selection bias (Khatib et al., 2022, 2023). The updated PRISMA 2020 statement contains a checklist of 27 items guiding reporting of SLRs and this research benefits from this guideline to enhance trustworthiness and the replicability of the study (British Medical Journal [BMJ], 2021). Despite these benefits, Abd Samad et al. (2023) highlighted weaknesses such as lack of optimality for non-health fields, a failure to accommodate methodological developments, and a focus on internal validity (Estoque et al., 2019). However, despite these concerns, we rely on PRISMA because it ensures efficiency, reduces subjectivity, reduces sample selection bias, and ensures the replicability of the research. It is widely used in finance and economics (Khatib et al., 2023) and has often been updated to ensure currency, relevancy, and to capture improvements in systematic literature review techniques and terminology (British Medical Journal [BMJ], 2021). This section describes how the literature was identified and synthesised in an unbiased manner. This section describes the search strategy and other important characteristics of the reviewed studies.

2.1. Search Strategy

The reviewed articles were initially extracted from multiple databases: EBSCO, Google Scholar, Sabinet African Journals, SAGE, ScienceDirect, Scopus, Springer Link, Taylor and Francis, and Web of Science. The number of databases was informed by the need to avoid selection bias, increase coverage, and acquire the relevant literature. Specific databases were identified based on the geographical coverage, the quality of journals indexed by these journals, and the coverage of the subject matter. The search strategy consisted of three phases: identification, screening, and eligibility determination. These stages ensure that the study captures relevant studies and eliminate those outside the scope of the study. A detailed explanation of the stages is provided below so that the study is a scientific inquiry that can be replicated.

2.1.1. Identification

This stage involved employing the keywords and synonyms used in this study: “determinants”, household indebtedness”, “household leverage” and “household debt”. The exact search string was “determinants of household indebtedness/household leverage/household debt”, “drivers of household debt/leverage/indebtedness”, and “factors explain household debt/leverage/indebtedness”. The list of words also included in the search string was “relationship between specific variables such as employment, behavioural factors, macroeconomic variables, overreaction, self-control, herding behaviour, household characteristics, education, house prices, income and household debt/household leverage/household indebtedness”. An example is “relationship between employment and household debt/leverage/indebtedness”. The variables used were picked from studies that came out after searching for determinants of household debt/leverage/indebtedness.

2.1.2. Screening

The screening stage involved setting the criteria for the inclusion and exclusion of articles. The downloaded papers were placed in an Excel file; initially, there were 675 results after removing 46 duplicates. Book chapters, dissertations, working papers, discussion papers, and qualitative studies were excluded from this initial list because they met the exclusion criteria. Studies published after December 2024 were excluded to avoid the study being an ongoing one and all English papers that analysed empirical data using quantitative methods were included. The time frame was open to all studies, except those published after December 2024, that looked at the topic of interest, as we considered that there was a need to be as inclusive as possible to identify evolving trends over time. These criteria resulted in the inclusion of studies that were published between 2004 and 2024. The period 2004 to 2024 informed the studies that were available and met the inclusion criteria.
The comprehensive screening criteria are presented in Table 1. Each record was screened by two independent reviewers. Differences were then resolved by consensus.

2.1.3. Eligibility

The eligibility phase involved determining which articles conformed to the eligibility criteria. Following the initial screening phase, we reviewed the abstracts, introductions, and, where necessary, the entire article. A total of 578 studies were excluded because they focused on over-indebtedness; some analysed individuals outside the household setup, and others focused on company capital structure. Book chapters, dissertations, reports, conference proceedings, and discussion papers were excluded because (1) some do not utilise empirical data to come up with results and (2) the absence of a rigorous peer review process that ensures the quality of findings. Therefore, the study included only peer reviewed articles from reputable journals. This ensured that the findings can be relied on and the results and conclusions of the current study are reliable and of high quality.
Over-indebtedness was excluded because it is a different concept from indebtedness, although it is closely related. Over-indebtedness relates to individuals who have acquired debt above their capability to repay, who are in default, or who fail to meet their debt obligations. For instance, Chichaibelu and Waibel (2018) defined over-indebtedness as a condition in which a family is in default or is paying more to repay the debt than what they retain. Achtziger et al. (2015) made a similar distinction between indebtedness and over-indebtedness. This resulted in 64 studies meeting the eligibility criteria. Snowballing was used to identify relevant studies from the reference sections of the remaining studies, resulting in a further 33 identified studies. Snowballing is a sample selection technique used to select a hidden population. It uses referrals from sampled respondents to identify other respondents with characteristics of interest (Johnson, 2014). Backward snowballing was utilised to identify relevant studies that were not obtained using direct searches. In this case, studies were identified from the references of the reviewed journal articles. The title of a paper and its authors indicated papers that could provide relevant information (Wohlin, 2014). The procedure included identifying papers with titles that focused on household debt and authors who have extensively or previously published in the area. This yielded a total of 94 studies. After applying the exclusion criteria in Table 1 and removing papers that had already been reviewed, a total of 33 studies remained. Combining the 64 studies with the 33 identified by snowballing gave us a total of 97 studies, which were then reviewed. The search strategy is summarised in Figure 1.

3. Results

This section analyses the results from the selected studies and discusses the findings in relation to the literature.

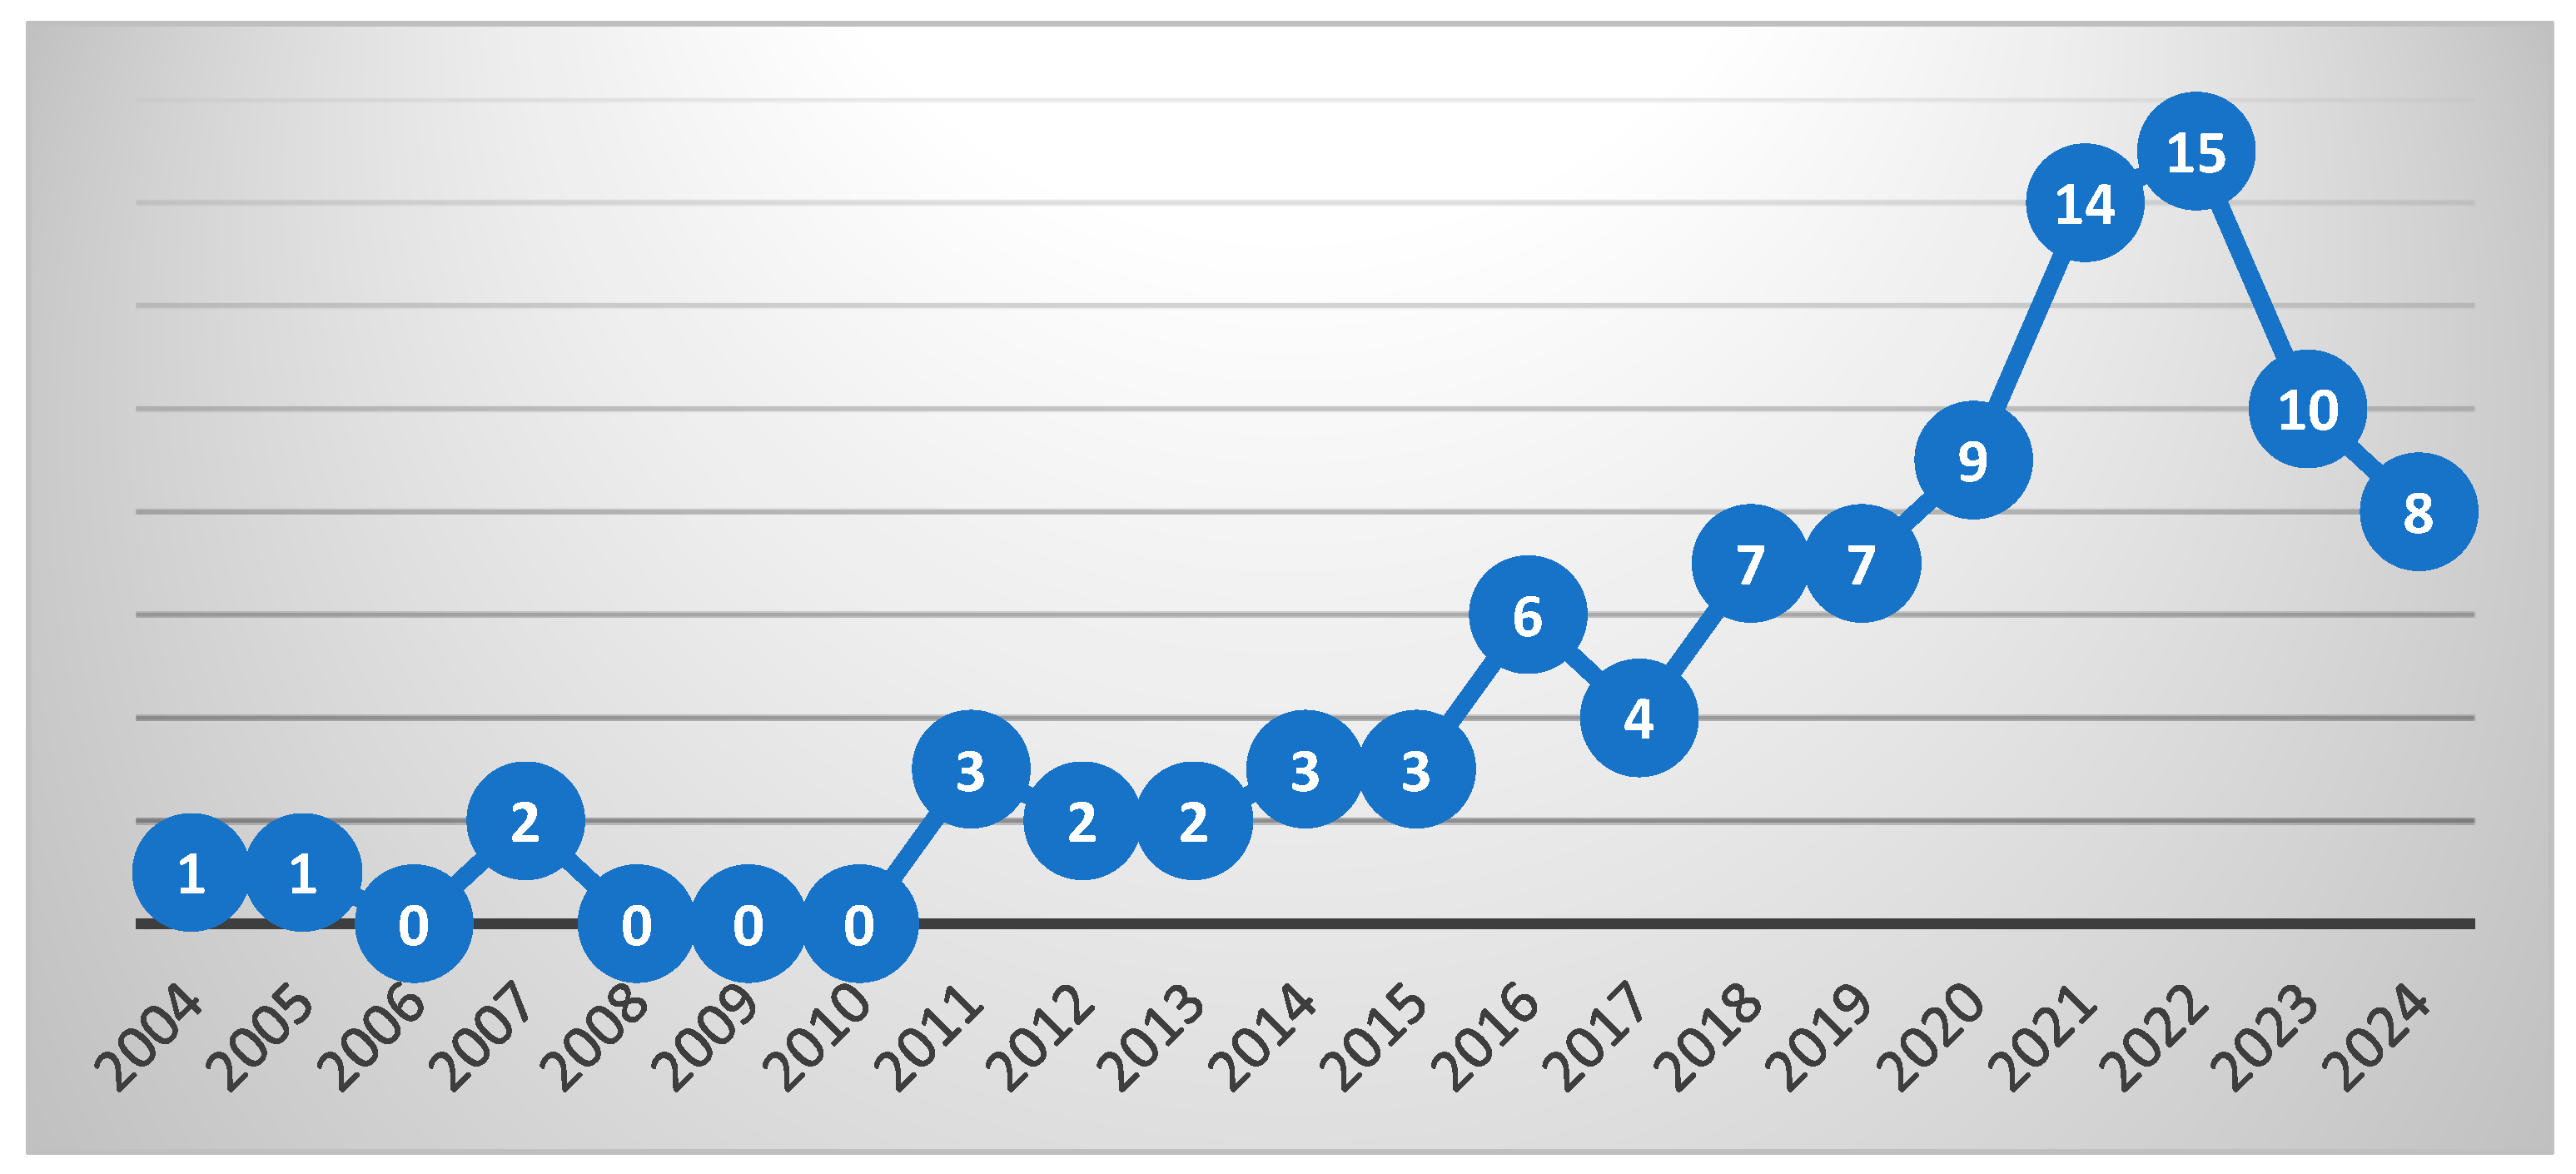
3.1. Descriptive Analysis of Publications

The study is composed of 97 papers published between 2004 and 2024. Figure 2 shows a burgeoning interest in research examining determinants of household debt in recent years. There was minimal research activity from 2004 to 2010, with a maximum of one article during the years in which there were publications. Research activity started to rise in 2011, reaching its peak in 2022. The rapid increase in publication shows renewed interest after the Global Financial Crisis since a number of researchers attribute the crisis to rising household debt (Vijverberg, 2024). A noticeable spike is observed from 2020 onwards mainly because of the economic disruptions caused by COVID-19. The pandemic led to a surge in household debt levels as households relied on debt to meet their needs. Mortgage debt rose sharply compared to other debt types (Cooper et al., 2021). During the same time, governments came up with various relief measures to ease the debt burden on households. These developments heightened the interest of researchers who endeavoured to determine the effect of COVID-19 and various government policies on household debt. At the same time, COVID-19 brought out the potential vulnerability of financial systems to heathy pandemics through high household debt levels. Similarly, COVID-19 brought out the important role played by household debt in cushioning hold holds during financial distress. All of these observation led to heightened interest in understanding household debt dynamics. This phenomenon also explains why there is a dearth of systematic literature reviews focusing on household debt. Research is still in its infancy and most studies are recent.

3.2. Country-Level Studies

The reviewed studies were divided into country-level and household studies for the better analysis and comparison of the results. Country-level studies used macro-level data to analyse household indebtedness, whereas household-level studies used household survey data to investigate the topic of interest.

3.2.1. Geographical Distribution of Country-Level Studies

Out of the sample of 97 studies (see Appendix A) covered in this research, 32 were country-level studies covering 57 countries. The highest concentration of studies was in the USA, with 16 studies, while Namibia, Botswana, Peru, and Taiwan had the lowest number of studies (one each), as shown in Table 2.
There were 17 cross-country studies, with the highest concentration in the OECD countries. Evidently, most studies covered European countries and developed markets and neglected Africa, South America, and other less-developed regions (refer to Appendix A).

3.2.2. Measures of Indebtedness

Various measures of household debt were used to depict indebtedness, with the most popular ones being the household debt-to-GDP ratio and household debt-to-income ratio, which were used in 29% of the studies each, constituting 58% of the total studies reviewed. Other measures included the debt service ratio, outstanding household debt, outstanding residential debt, volume of household loans, household consumer credit, ratio of household debt to private debt, and loans granted by credit institutions to individuals. The use of various measures by different studies provides a comprehensive understanding of the determinants of household indebtedness by considering different dimensions of indebtedness. Desirable and informative as this might be, it makes it difficult to compare studies and derive conclusive results. This explains why studies may not agree on a set of variables that explain indebtedness across time and geographical location.

3.2.3. Time Period Covered

The first publication was published in 2004, but studies cover a period spanning from 1913 to 2021, constituting 108 years in total. This period is long enough to capture the changes that were observed during different economic periods in world economic history. As a result, the conclusions drawn are not time-specific. Including studies covering data as recent as 2021 offers evidence that considers the current economic environment and makes the results more relevant for policymaking. There was variability in the average time period covered by single studies in the literature, with 15.6% of the studies covering 40 years and above. Studies covering a sample range of 20–39 years constituted 31.3%, while 34.4% ranged from 10 to 19 years. Those covering less than ten years account for 18.8% of the country-level literature. Studies covering less 10 years were mainly cross-country studies, and the single-country studies used mainly quarterly data. The largest number of studies covered the 20-year and 10-year ranges, allowing the literature to capture shifting trends and changes in the macroeconomic environment over a reasonably long period of time. Longer periods are desirable, because they better capture the impact of macroeconomic variables on household indebtedness. For instance, Runstler et al. (2018) showed that credit volumes, house prices, and GDP have cycles with lengths averaging 8 to 13 years.

3.2.4. Econometric Approaches

To estimate the determinants of household indebtedness, various factors were regressed against the measures of household indebtedness. Several models were employed depending on the data characteristics, such as panel and time-series data. The econometric models used for the estimations were ordinary least squares (OLS), Pedron’s heterogeneous panel vector autoregression (PHP VAR), the spatial error panel model (SEPM), autoregressive distributed lag (ARDL), nonlinear ARDL (NARDL), fixed effects two-stage least squares (FE2SLS), Artificial Neural Network VAR (ANN VAR), distributive panel lad analysis (DLPA), the generalised method of moments (GMM), instrumental variable two-stage least squares (IV2SLS), seemingly unrelated regressions (SUR), the vector error correction model (VECM), fixed effects (FEs), the least squares method (LSM), least squares dummy variable (LSDV), structural vector autoregression (SVAR), quantile regression (QR), progressive stepwise regression (PSR), the finite distributed lag model (FDL), and fully modified ordinary least squares (FMOLS). The OLS model dominates the frequency of use (see, e.g., Nomatye & Phiri, 2017; Park & Lee, 2018; Zain et al., 2019). The generalised method of moments (GMM), FE, QR, SUR, and VECM are the second most popular group (see Dumitrescu et al., 2022; Maneejuk et al., 2021; Park & Lee, 2018; Zhou & Niyitegeka, 2023). All other models, such as FMOLS, LSM, IV2SLS, and LSDV, have been used in the least number of studies.
Over-reliance on OLS could have introduced weaknesses in past studies. OLS assumptions, such as the linear relationship between variables and the independence and identical and normal distribution of errors around the regression line, are often violated. These assumptions simplify reality; however, when the model oversimplifies or misrepresents reality, OLS produces biassed and inefficient estimations (Currit, 2002). Recent evidence has shown that the behaviour of household debt is nonlinear (Nomatye & Phiri, 2017; Mishra & Bhardwaj, 2021), making models that assume linearity inappropriate. Macroeconomic relationships can be affected by endogeneity due to simultaneity, model misspecification, omitted variables, and measurement errors (Baltagi, 2005; Wooldridge, 2002). To address these challenges, future studies could use models, such as the GMM, IV2SLS, and QR (Chu, 2019; Tseng & Hsiao, 2022; Zwane, 2018). Moreover, AI methods such as machine learning, which are said to handle large datasets, learn from their mistakes and have better explanatory power and could improve the predictive ability of models and therefore the results. It would be more informative to examine how different levels of macroeconomic and household-specific factors affect household debt at different levels.

3.2.5. Theories Used

According to our review, various theories concerning the determinants of household indebtedness have been employed in this research. Table 3 shows that the life cycle hypothesis is the most frequently cited theory, followed by the permanent income, expenditure cascade, low interest, and Rajan hypotheses.
Some reviewed studies (Pan, 2023; Mamatzakis et al., 2023) did not anchor their research to specific theories though they tested variables covered under the theories highlighted in Table 2. The most relied on theory, the life cycle hypothesis, states that people strive to maintain the same level of consumption throughout their lifetime. Therefore, consumers resort to taking on debt or selling assets when income is low (usually during old age), and save more when income is high (during their prime years) (Modigliani & Brumberg, 1954). Its prominence demonstrates more applicability in different economic settings, hinting at the importance of age, income, and consumption in explaining borrowing behaviour (see, e.g., Bolibok, 2018). Other theories, such as the permanent income, expenditure cascade, low interest rate, Rajan, housing pricing, and financial deregulation hypotheses, among others, demonstrate that consumption, expenditure, inequality, interest rates, house prices, credit supply, and financial regulation are important factors to consider in understanding household borrowing patterns.

3.2.6. Determinants of Household Indebtedness

Our examination of country-level studies shows that interest rates negatively affect household debt. Nineteen studies examined how interest rates interact with indebtedness, and 42% found a negative effect. However, 21% had a positive effect, as shown in Appendix A, Table A1. This variable has received the most scholarly attention, reflecting its importance in determining indebtedness. Since interest rates are the cost of borrowing, higher interest rates can significantly reduce the demand for loans, while the reverse is also true. The negative effect shown by most studies agrees with the dominant negative effect of inflation, suggesting that during high-inflation periods, monetary authorities raise interest rates to arrest inflation, thereby making borrowing expensive.
House prices are the second most studied variable, as they were included in 16 studies. This review highlights the positive impact of house prices on household debt. Most studies (75%) show a positive impact of house prices on a household’s propensity to borrow, signalling the wealth effect. A paltry 13% show a negative impact and the remainder produces insignificant results. Rising house prices increase the value of collateral and make debt sustainable. Borrowers become comfortable borrowing, and bankers are incentivized to lend because of the lower risk of losing their principal amount. In instances where house prices rise above the amount owed on the mortgage, positive equity accumulates, which can be used as collateral for mortgage equity withdrawal (Coletta et al., 2018). The share of the retired population had a negative effect, whereas the effect of educational attainment was inconclusive. The share of the working-age population had an overwhelmingly positive effect, suggesting that employed people have easy access to debt and are therefore more indebted. This result concurs with the results that showed the negative effect of unemployment. Household consumption expenditure was investigated in seven studies, of which four (57%) found a positive effect, one was negative, and two were inconclusive. This result suggests that households rely on debt to fund consumption, and according to Maneejuk et al. (2021), this is prevalent at lower levels of household debt. When real wages decrease, consumers resort to borrowing to maintain their consumption, and when credit is readily available, they increase their consumption and fund the increase by using debt (Khan et al., 2016; Zimunya & Raboloko, 2015). This concurs with the life cycle hypothesis.
The results indicate that unemployment has a negative impact on household indebtedness. Of the twelve studies that included unemployment as an independent variable, seven found a negative impact, three a positive effect, and two found a statistically insignificant effect. Unemployment reduces household debt by reducing future earning capacity, thereby reducing an individual’s creditworthiness and ability to access debt. Unemployed individuals usually lack collateral, which can be used to acquire debt. At the country level, unemployment is associated with periods of economic contraction during which individuals become precautionary and reduce their reliance on debt (Zhou & Niyitegeka, 2023). Banks and other financial institutions reduce their credit extensions during periods of economic contraction. A closer look at the studies shows that the results were found in countries with different economic characteristics, suggesting that it is not country-dependent (see Abd Samad et al., 2020; Dumitrescu et al., 2022; Manole et al., 2016; Turinetti & Zhuang, 2011; Zhou & Niyitegeka, 2023). Inflation was controlled for in nine studies, of which two showed a positive effect, four showed a negative result, and three showed insignificant results. It is evident that inflation has a negative impact on household debt, contrary to expectations that individuals borrow more when inflation is high, because they pay less in the future. This demonstrates the existence of the supply effect, in which lenders reduce their credit supply due to the erosion of the principal (Dumitrescu et al., 2022). The negative effect of high interest rates could also explain this scenario since authorities usually increase interest rates during inflationary periods. Of the total sample, GDP was included in 13 studies, and the results indicate that it enhances household debt, as four of the studies produced negative coefficients. The other six showed a positive coefficient, while the others were insignificant. Savings show a negative impact on indebtedness, suggesting that when households have extra income to save, they are less likely to borrow (Coletta et al., 2018).
Income is another important variable in the literature. Income has a somewhat inconclusive impact on household debt, with 31% of studies showing a positive result. Only 38% found a negative effect, whereas the remaining 31% did not find a significant effect. This could be due to differences in the estimation methods, geographical scope, and temporary scope. Conceptually, rising income increases consumer confidence and positive sentiments regarding future income, thereby inducing households to borrow. At the opposite end of the spectrum, financial institutions are confident about households’ capability to repay as a result of the rising economic growth and large incomes that cushion lenders. However, an increase in income can reduce people’s reliance on debt for consumption, although this effect could be cancelled out by other forms of debt, such as mortgages and car loans, which are likely to increase with income. Seven studies that investigated inequality showed that 57% found a negative effect, while 43% found a positive effect. This result disagrees with the Rajan and expenditure cascade hypotheses, which suggest that income inequality increases household debt. However, Fasianos et al. (2017) confirm the Rajan hypothesis and further reveal that the relationship is asymmetric, where rising inequality increases household debt but a decrease in the same does not materially impact indebtedness. They also noted that the strength of the relationship varies over time with events such as economic and financial liberalisation strengthening the positive effect while wars reduce the effect. Population growth and wages positively impact household debt (Bolibok, 2015; Enache, 2022; Romao & Barradas, 2022). Domestic investment has a positive effect, while income inequality has a negative effect on household debt.
Other factors sporadically examined in the literature include the COVID-19 pandemic, the wage–productivity gap, welfare state expenditure, business cycles, tax incentives, money supply, and urbanisation, among others. For instance, Czech and Puszer (2021) examined the impact of the pandemic on household debt in the Czech Republic, Poland, Slovakia, and Hungary. They showed that the number of new COVID-19 tests positively affected household debt in the Czech Republic and Poland and negatively affected household debt in Slovakia. The number of deaths resulting from COVID-19 has reduced in Hungary and the Czech Republic. This result could be due to a reduction in both the supply and demand for loans as fear of an exacerbating crisis increased. An intensifying crisis reduces economic activity and affects people’s jobs, making both borrowing and lending riskier. In a study covering 26 OECD countries, Dumitrescu et al. (2022) demonstrated that the COVID-19 pandemic and the global crisis increased household debt, whereas high public expenditure had an adverse effect. These results show that households use debt to cushion themselves during times of instability, especially when their income and livelihoods are adversely affected. Such behaviour, although crucial in supporting economic activity, leaves financial systems vulnerable to potential crashes. Mamatzakis et al. (2023) used a novel artificial neural network (ANN) VAR in OECD countries to examine COVID-19-affected household debt. They reveal that household debt responded positively to the number of infections and deaths. Measures put in place in response to the pandemic such as lockdowns increased household debt but vaccinations and the number of people tested reduced debt. This shows that uncertainty and indications of a growing crisis induced people to borrow, whereas measures aimed at reducing the pandemic and bringing uncertainty down reduced debt. Kraft (2007) supports this notion with evidence showing that a history of economic instability positively affects household debt. However, events such as market crashes or financial crises can dampen credit extension as financial institutions become more cautious and increase their credit standards. For instance, Vijverberg (2024) shows that credit market uncertainty after a crisis reduces household debt, whereas monetary policy excesses promote a credit boom. The evidence on the impact of COVID-19 is biassed towards a positive impact, though the effect is negative in some countries. This shows that how households responded to COVID-19 could be explained by other factors such as trust in government capability and the effect of past crises on households in individual countries. Therefore, a lack of research covering less developed countries leaves a lot of unknowns in relation to the pandemic and household financial decision-making.
Bankruptcy rates were found to negatively affect car loans and credit card debt but did not affect mortgage loans (Christen & Morgan, 2005). This proves that banks reduce lending when bankruptcy rates are high but only for unsecured credit, thus hinting at the significance of safety concerns. The results also show that different debt types react differently to variables such as bankruptcy rates. Khan et al. (2016) show that, in Malaysia, interest rates have an adverse effect on mortgage debt but positively influence consumer debt. Housing prices enhanced mortgage debt, yet the same variable was insignificant in influencing consumer debt. Evidence by Christen and Morgan (2005) indicates that the positive effect of income inequality was more pronounced for car loans than mortgages. Similarly, bankruptcy rates reduced car loans and credit card loans but were insignificant in terms of mortgage debt and total outstanding debt. Non-financial assets on the other hand increased mortgage debt but reduced car loans and credit card debt. Though the studies are few, there is evidence that different debt types react differently to economic variables.
Using data from OECD countries, Annarelli (2022) demonstrated that welfare generosity reduces non-mortgage debt but does not have significant effect on mortgage debt. Credit access, current account balance, and past government deficits enhance both debt types and the population over 65 has the opposite effect. Money supply has a positive effect on non-mortgage debt only. Still on government policy actions, Lepers (2024) reveals that government fiscal subsidies affect household debt, though in different ways depending with the type of debt. For instance, fiscal subsidies positively impact mortgage debt but do not significantly impact total household debt and consumer credit. This shows that fiscal policy can act as credit policy by enhancing households’ appetite to acquire mortgage debt. Other macroeconomic variables such as interest rates had a positive impact on consumer debt and mortgage debt, whereas GDP growth adversely affected mortgage debt only. The global risk appetite enhanced household debt and mortgage debt.
Kakuru and Kaulihowa (2022) found evidence that mortgage loans were the major drivers of indebtedness in Namibia. Abd Samad et al. (2020) directly examined the influence of financial sector development as measured by credit extension by banks, and their results show the positive effect of financial sector development on household debt. Coletta et al. (2018) examined other variables closely related to financial development. Their results prove that the quality of credit registers, bankruptcy laws, and legal origin (Anglo-Saxon and Scandinavian) positively affect indebtedness. Life expectancy (positive), government effectiveness (negative), length of time to resolution of insolvencies (negative), financial wealth (positive), total wealth (positive), public debt (negative), socio-democratic model (positive), and liberal regime (positive) were all other factors found to significantly influence indebtedness. Kraft (2007) studies the interaction between stock market development and household debt. The outcome indicates that stock market development increases household debt, while low corruption and German or English legal origins (legal systems) also support indebtedness. Strong institutions and a well-developed financial sector contribute positively to indebtedness, highlighting that household debt is an outcome of both demand and supply factors. Factors such as financial sector development, quality of credit registers, bankruptcy laws, legal origin, time taken to resolve insolvencies, and strong institutions fall under supply factors due to their influence on credit supply. For instance, high levels of financial development ensure competition and the low cost of acquiring savings, thereby influencing the ability of banks to extend credit. Well-defined bankruptcy laws remove vagueness and protect providers of capital, making them comfortable to lend. Similarly, quality institutions ensure the timely and fair administration of justice which protects the interest of financial institutions.
Johnston et al. (2021) looked at the interaction of domestic institutions in the form labour markets and mortgage credit suppliers in explaining household debt, showing their co-dependency in OECD countries. Strong collective bargaining institutions and generous welfare states were found to enhance household debt but only in instances where mortgage-providing financial institutions are willing to extend credit. Closer to the strength of institutions in different countries, Pan (2023) shed light on the impact of political leadership style on household debt. The study demonstrates that populism negatively impacts household debt. This is so because left-wing populism reduces the credit supply and consumption, whereas right-wing populism reduces the bank credit supply and increases public debt. Reducing consumption lowers the reliance on household debt in line with the PIH and an increase in public debt signals a potential increase in taxation and interest rates in the future. Coupled with banks reducing the credit supply due to future uncertainty, household debt reduces significantly. The size of the government, regulation, and sound money increase household debt, whereas the freedom to trade adversely impacts debt.
The relative price of dwellings had a negative impact in a single-country study conducted in Poland, whereas the number of new dwellings and population growth (age 25–34) increased residential debt (Bolibok, 2015). However, Moore and Stockhammer (2018) found that age structure, among other variables, such as falling wages, a reduction in welfare expenditure, and an increase in the price of financial assets, have an insignificant effect on indebtedness. In another cross-country study covering 31 OECD countries, Bolibok (2018) found that the share of the population aged 25–39 increases indebtedness, coupled with the magnitude of the wage–productivity gap. This differs from the results of Moore and Stockhammer (2018) and Barradas and Tomas (2023), who found that, in 28 EU countries, welfare state expenditure enhances indebtedness and that financial asset prices have the opposite effect. This result highlights that liquidity, as depicted by financial assets, discourages households from borrowing. This result concurs with the findings on savings, suggesting that lack of liquidity encourages households to borrow. T. Long et al. (2024) examined whether education can reduce the adverse effect of ageing on household leverage in 52 countries. They show that ageing increases household debt, but that this effect is reduced by high education levels. Government debt, savings, economic development, and industrial development had a negative effect on debt whereas government size had a positive effect. Urbanisation and foreign currency reserves were insignificant. Bazillier et al. (2021) studied 30 OECD countries and show that the broad money ratio and oil prices enhanced household debt, whereas credit deregulation reduced the same.
The results reviewed here confirm the house price hypothesis, the age structure hypothesis, the credit supply hypothesis, the low interest rate hypothesis, and the financial deregulation hypothesis. However, results on the LCH and PIH remain inconclusive. Evidence from the studies reviewed here contradicts the Rajan hypothesis and the expenditure cascade hypothesis.
We further examined whether the results obtained by different studies were consistent even across countries with the same characteristics. The findings show that the results were not consistent in some instances. For example, Annarelli (2022), Bolibok (2018), Dumitrescu et al. (2022), and Park and Lee (2018) examined the impact of GDP on household debt in OECD countries. Three of the studies found a negative effect and one (1) found a positive effect. In South Africa, two studies agreed on the positive effect of GDP (Nomatye & Phiri, 2017; Meniago et al., 2013), whereas in Malaysia one study found a positive effect and another found an insignificant effect (Khan et al., 2016; Zain et al., 2019). Zimunya and Raboloko (2015) found a negative effect in Botswana. The results suggest that GDP negatively impacts household debt in high-income countries but enhances it in upper-middle-income countries. The results on the effect of unemployment are mixed as well. Results obtained in South Africa, Malaysia, USA, Poland, Romania, and emerging markets show a negative impact (Abd Samad et al., 2020; Bolibok, 2015; Manole et al., 2016; Turinetti & Zhuang, 2011; Zain et al., 2019; Zhou & Niyitegeka, 2023). In OECD counties, two (2) studies found an insignificant effect, two found a positive effect, and one (1) found a negative effect (Annarelli, 2022; Bolibok, 2018; Coletta et al., 2018; Dumitrescu et al., 2022; Park & Lee, 2018). The conflicting results from OECD countries show the impact of different measures of household debt, the sample of countries, and the econometric techniques utilised. Studies that utilised similar debt measures and different econometric techniques have similar results (Annarelli, 2022; Bolibok, 2018) while some that employed similar debt measures and econometric techniques have different results (Bolibok, 2018; Coletta et al., 2018). One parameter that was different for all of the studies is the sample of countries, suggesting that sampling could explain the differences in the results from OECD countries. Interest rates show a similar pattern to that of unemployment. Results from South Africa, USA, Poland, and Romania show a negative effect of interest rates on household debt, whereas those from Botswana and in a sample of emerging markets the effect is positive. Malaysia has one study that shows a positive effect and one with a negative effect, while evidence from Portugal shows an insignificant effect. Results from OECD countries show three (3) studies with an insignificant result and one (1) with a negative effect. Evidently, the results show that economic variables impact household debt differently in different contexts. Therefore, policy prescriptions should be based on a specific country’s circumstances.

3.3. Household-Level Studies

The review was split into country-level and household-level studies mainly because of the differences in the variables of interest, the methodologies used, the geographical coverage, and, therefore, the results obtained. In light of this, the following section considers the geographical distribution of household-level studies reviewed in this study.

3.3.1. Geographical Distribution

Household-level studies covered 53 countries, with China and the USA being the most studied countries with nine studies each (see Table 4). There were few cross-country studies (5), and the rest concentrated on single countries. As with country-level studies, household-level studies are concentrated in European and the OECD countries, with the exception of India, which had the highest number of studies. This could be a result of the availability of secondary data from surveys funded by the government and other non-government organisations in these countries. Regardless of the reasons, little is known about household-level indebtedness in Africa, South America, and parts of Asia.

3.3.2. Measures of Indebtedness

Studies have used a variety of indebtedness measures, ranging from having or not having debt to the amount of outstanding debt, participation in debt markets, the number of loans, debt-to-income ratio, debt levels, the percentage of income paying debts, requesting a loan, the debt-to-household wealth/assets ration, the debt-to-consumption ratio, applying for credit, and receiving credit. The most utilised measure, having or not having debt, was used by 11 out of the 51 studies. Again, variability in indebtedness measures makes it difficult to compare studies and produce conclusive results. However, different dimensions make the literature more informative.

3.3.3. Time Period Covered

The earliest year to be covered was 1984 (see Brown et al., 2019) while the latest data were collected in 2021 by Dharmadasa and Gunatilake (2023). A period spanning 38 years is long enough to capture evolving trends at the household level and provide valuable insights into important factors that explain indebtedness, even though the studies were conducted in different countries. The earliest publication was in 2005, and the latest was in 2024.The cut-off period is papers that were published in July 2024.

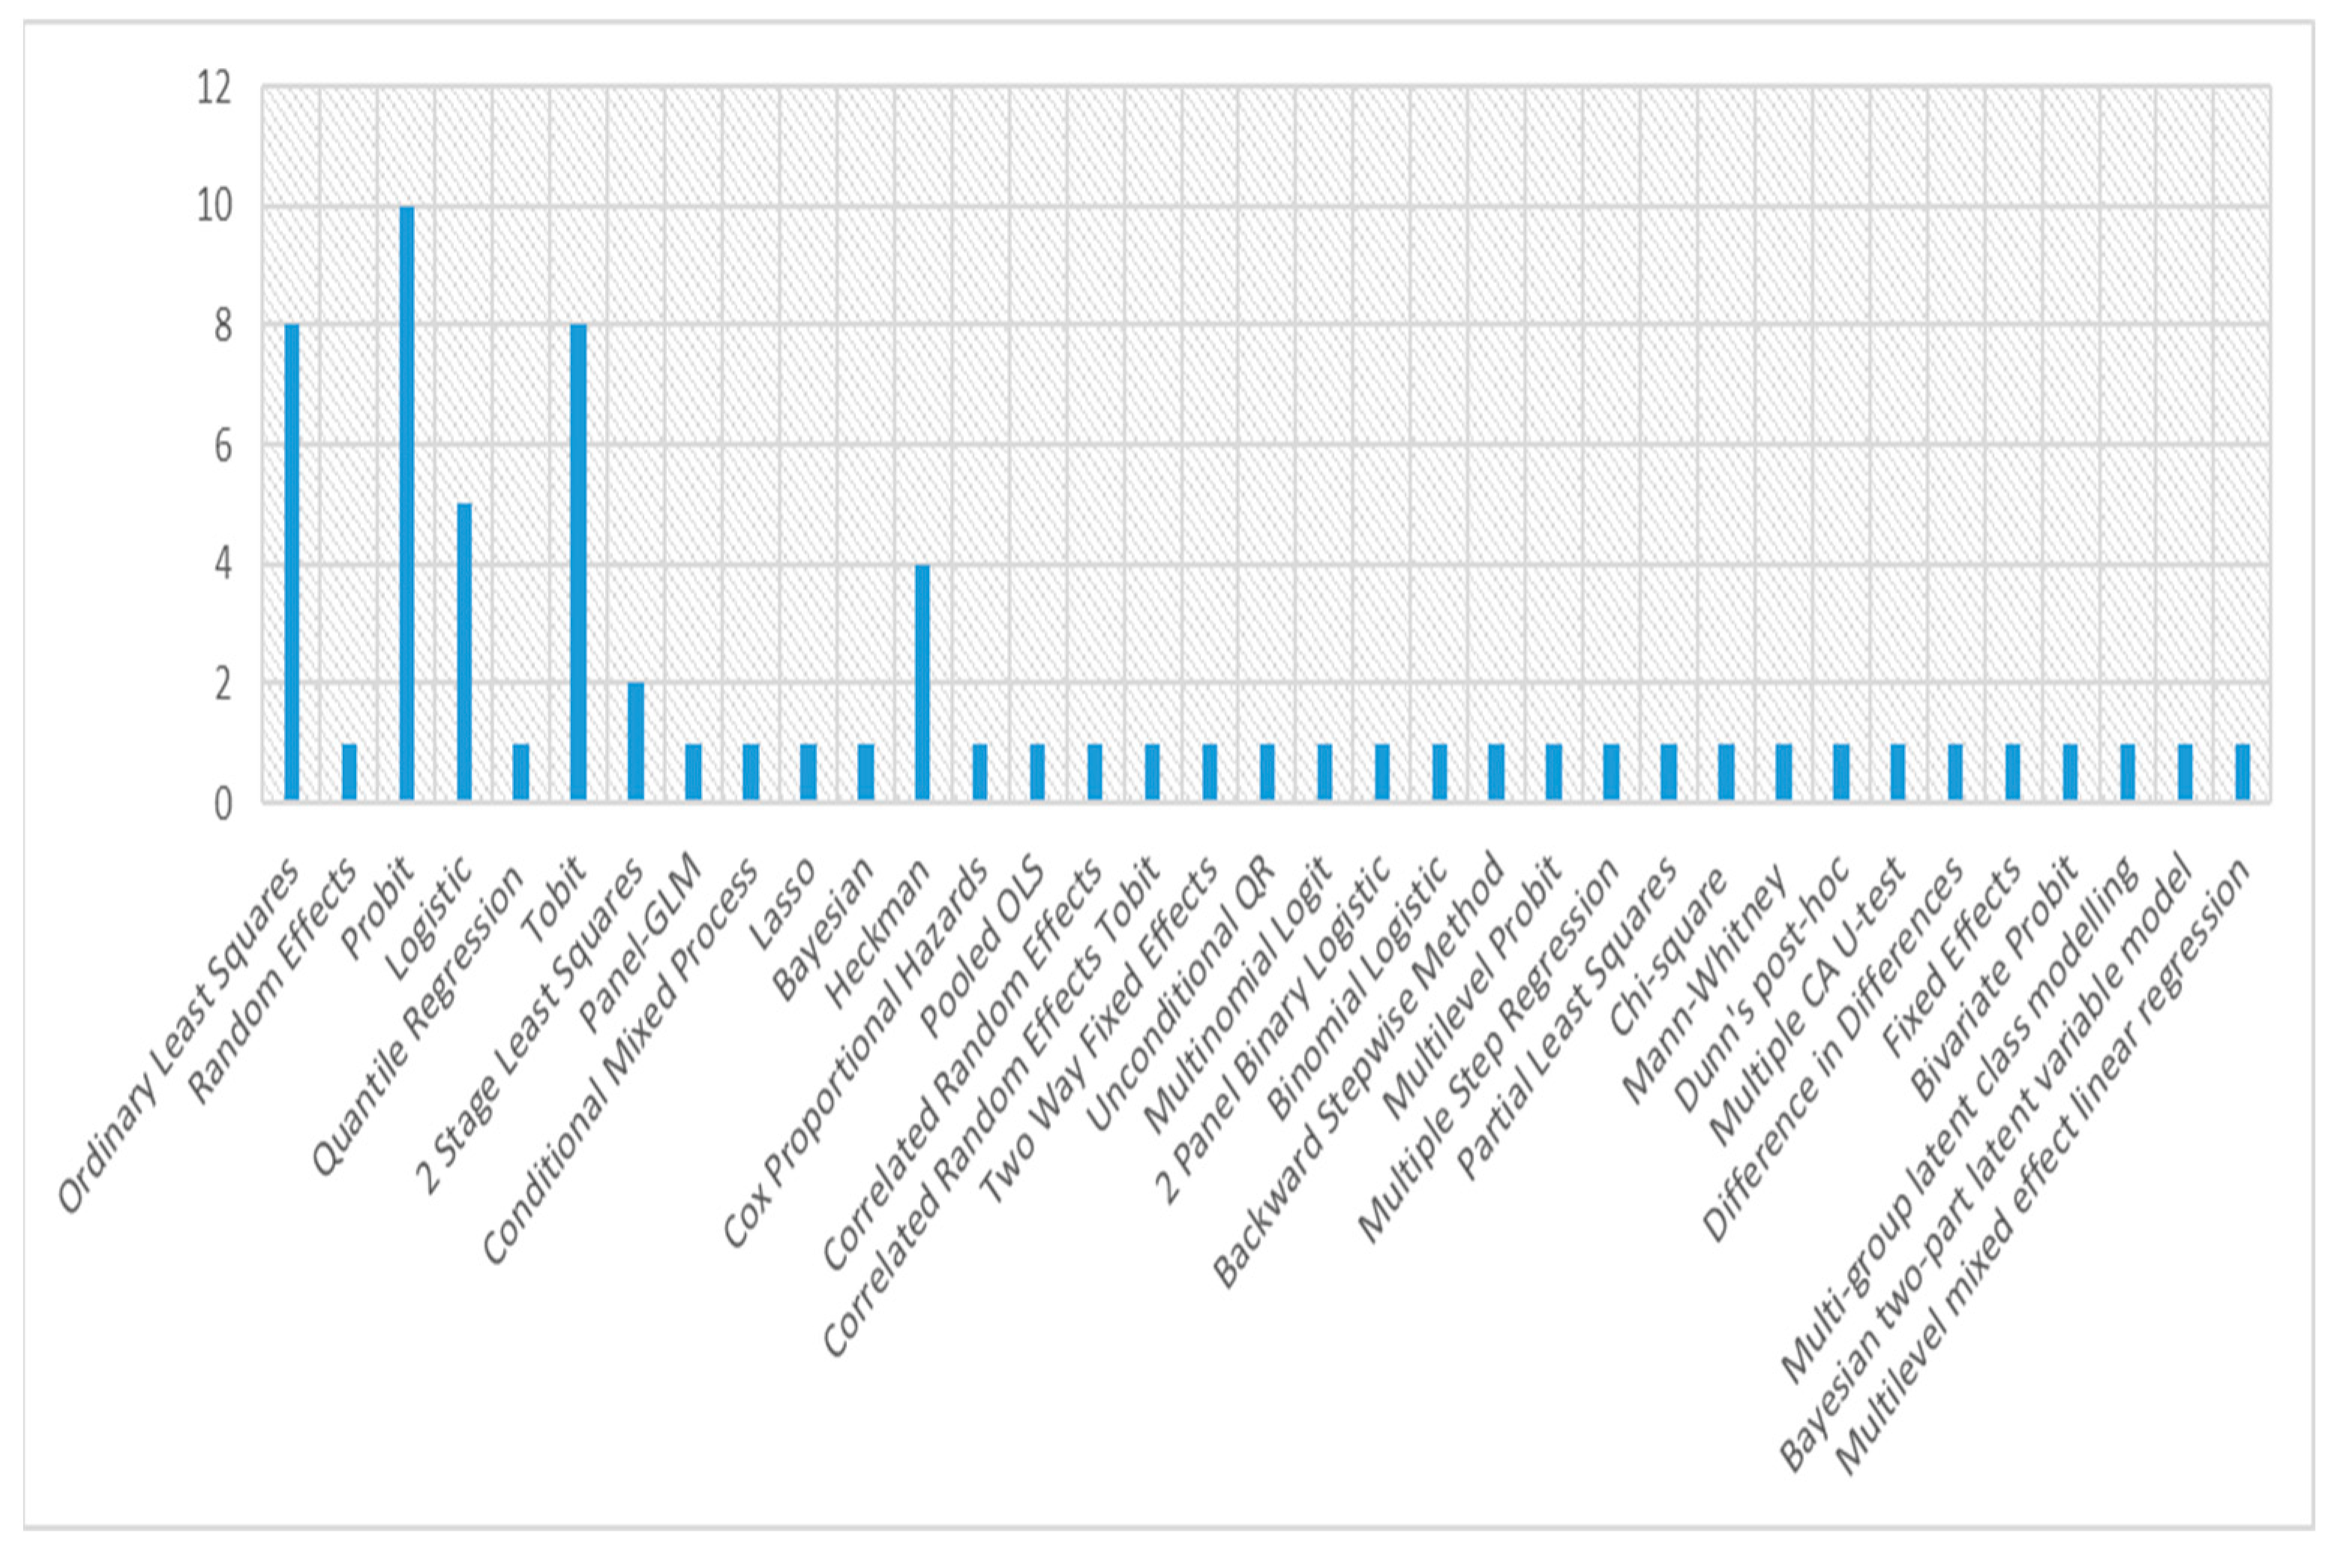
3.3.4. Methodological Approaches

The probit model, followed by the Tobit model, ordinary least squares, and the logistic regression model, were the most used econometric techniques in the studies reviewed. The probit is more popular because of its ability to estimate the probability of an observation falling into a certain category—in this case being indebted or not (see, e.g., Branten, 2022; Comelli, 2021; Wildemauwe & Sanroman, 2022). This makes the model popular for specifying binary response models that characterise household-level debt. Similarly, the logistic regression model is a binary regression model and therefore handles problems in the same way as the probit model. Although the models are different, there is hardly any difference between their results (Paap & Franses, 2000). Figure 3 shows that the probit is followed by the Tobit and ordinary least squares methods in terms of the frequency of their use. Other popular techniques include the Heckman selection model, followed by the two-stage least squares, which have a frequency of 2. All other techniques were applied once. The choice of methods did not show any time trend, suggesting that researchers resorted to better methods or new inventions in later studies. No studies have used new technologies, such as artificial intelligence (AI) and machine learning, to analyse data. For instance, machine learning uses algorithms that are capable of learning from mistakes while handling huge datasets. In the recent past, these learning models have proven to be more effective than traditional economic models because of their high explanatory power (Charpentier et al., 2018).
Therefore, the choice of methods seems to be influenced by the data type and objectives of the study. For instance, the Tobit model is used mainly when the dependent variable is the amount of outstanding debt, while the probit model is applied when the dependent variable is either having debt or not.

3.3.5. Theories Used

Similarly to country-level studies, household-level studies rely on a variety of theories that support these studies. The life cycle hypothesis was the most prominently cited theory, used in 16 out of 18 studies that identified specific theories. Their prominence demonstrates their applicability in real life. The permanent income hypothesis (PIH), on the other hand, was applied to 7 (39%) of 18 studies. PIH states that people spend money according to their future income expectations. The level of long-term income expectations becomes permanent income (Friedman, 1957). The level of debt can be determined by expenditures above the income level (Strzelecka & Zawadzka, 2020). As a result of uncertainties, a household can spend more than its permanent income, thus creating the need to resort to debt to cover the gap. Other theories include the financial accelerator model, expenditure cascades hypothesis, the hypothesis of Minskyian, post-Keynesian stock flow, the relative income theory of consumption, habit formation theory, the relative income hypothesis, the welfare–debt trade-off hypothesis, the complementary hypothesis, the intertemporal choice model, the theory of credit rationing, behavioural finance theory, precautionary motives, and the presence of liquidity (Comelli, 2021; Jestl, 2023; Lagomarsino & Spiganti, 2021; Nomatye & Phiri, 2017; Yaparatne & Senathissa, 2021). These theories largely informed the variables tested in the studies under review.

3.3.6. Determinants of Indebtedness

The evidence obtained from household-level studies shows that education has a positive impact on indebtedness, as shown in Appendix A, Table A2. Out of the 35 studies that tested for education level, 22 (63%) found a positive effect, 6 found a negative effect, and 7 studies found an insignificant relationship. The indication is that education increases the chances of employment, income levels, financial literacy, and the accumulation of assets, all variables relevant to accessing debt (Haq et al., 2018; Lewin-Epstein & Semyonov, 2016; Pandey, 2016; Singh et al., 2014). For instance, financial institutions are comfortable extending debt to individuals with a stable income and those with collateral, as they pose a lower risk of loss to the firm. At the same time, financial literacy increases the demand for credit, as it influences an individual’s propensity to use financial products. Feng et al. (2019) provided evidence that financial literacy enhances secured debt, but it reduces the amount of household unsecured debt. Another variable highly correlated with financial literacy, risk tolerance, increased both secured and unsecured debt. This assertion is supported by the fact that studies that controlled for both income and education largely found a positive effect of both income and education (see Cao-Alvira et al., 2020; Fernandez-Lopez et al., 2024; Manogna & Mishra, 2022). Tseng and Hsiao (2022) found evidence that the impact of education on indebtedness in China varies with the level of indebtedness, changing from negative to positive as the level of indebtedness increases. This suggests that highly educated people resort to debt, even when the debt burden is already high. This result suggests that the relationship between household debt and its determinants is nonlinear. The results for household income indicated a positive correlation between income and indebtedness, highlighting that people with a high income rely more on debt. Out of the 36 studies, 19 (53%) found a positive correlation, 9 (25%) found a negative correlation, and the remainder were insignificant. This result indicates that the capability to repay debts is a major factor influencing both the demand and supply of debt, thereby explaining indebtedness (Barrot et al., 2022; Olivero & Dvalishvili, 2021; Walks, 2013). Supporting evidence was obtained in Australia by Atalay et al. (2020), who showed that households that did not experience a negative shock in employment or income had more total debt and non-mortgage debt. This result affirms that income stability increases access to debt and the capability to take risks. Using data from Korean households, Jung and Kim (2020) reveal that increases in income volatility reduced household leverage. They posit that increases in income volatility heighten risk exposure and lower this exposure to their net wealth, hence households reduce debt.
Household wealth is also largely positive, as indicated by 10 (71%) studies that obtained a positive effect against 4 (29%) that came out with a negative result. The effects of collateral and the capability to pay are prominent. Brown and Taylor (2008) support this view by suggesting that debt and mortgageable assets are interdependent. Similarly, households rely on debt to increase their assets (Tseng & Hsiao, 2022). Rising housing prices have a positive effect on indebtedness. Only seven studies tested this relationship: six (86%) found a positive effect and one (14%) found a negative effect. A few studies (Branten, 2022; Brown et al., 2019; Fuentealba et al., 2021; Hake & Poyntner, 2022; Li et al., 2023; Padmaja & Ali, 2019; Pastrapa & Apostolopoulos, 2015) have investigated the house ownership–indebtedness nexus, and the results showed a positive association. All studies have found that house ownership has a positive effect on household indebtedness. Evidently, because houses can be used as collateral, they enhance a household’s ability to access all forms of debt. Again, house ownership is most likely correlated with other variables, such as income, education, and wealth, which have been found to positively influence indebtedness.
Household size was another important factor. Huge households rely more on debt than those with few family members. Twelve (80%) studies found a positive effect, two (13%) found a negative effect, and one (7%) found an insignificant effect. Large families are more likely to have high expenditure needs, requiring them to supplement their income using debt. On the other hand, large families could have various income sources, allowing family members to borrow and devote income to debt repayments. However, the availability of more income sources could discourage families from relying on external debts. They could easily lend to each other and combine their income to meet their needs. According to the reviewed studies, the former approach dominates the latter (Intarapak & Supapakorn, 2020; Olivero & Dvalishvili, 2021; Thorat et al., 2020).
Most studies have explored the interaction between the age of the head of a household and household indebtedness and found evidence supporting a positive relationship (see, e.g., Branten, 2022; Feng et al., 2019; Fernandez-Lopez et al., 2024; Fuentealba et al., 2021; Hake & Poyntner, 2022; Lee & Mori, 2021; Li et al., 2023; Manogna & Mishra, 2022; Pastrapa & Apostolopoulos, 2015; Tian, 2022; Wildemauwe & Sanroman, 2022). However, many studies have found negative associations (Altundere, 2014; Barrot et al., 2022; Brown et al., 2019; Comelli, 2021; Camoes & Vale, 2018; Jestl, 2023; Lagomarsino & Spiganti, 2021; Mishra & Bhardwaj, 2021; Tahir & Ahmed, 2021; Tseng & Hsiao, 2022). Age has a bearing on one’s ability to earn income through employment and accumulate assets and education. Old age, for instance, significantly hinders access to debt, as most people retire. Studies examining the effects of old age have found a largely negative association. Only 1 study out of 16 found a positive effect, while 12 found a negative effect. According to Comelli (2021), age and future financial expectations are linked to indebtedness, particularly long-term debt. Therefore, it follows that individuals who have reached old age are likely to have low future financial expectations and, therefore, low debt holdings. These findings are consistent with the age structure hypothesis. The condition of being retired also shows a negative effect on indebtedness, although it was investigated in only two studies. One study found a negative effect and the other found no effect (Fabbri & Padula, 2004; Lagomarsino & Spiganti, 2021). Haq et al.’s (2018) findings confirm these results. They discovered that mature workers (50–59 years) were more likely to have debt than those above 60 years old and those below 25 years old. The reasons attributed to this phenomenon range from investments, the purchase of houses and cars, usually carried out by mature workers and less so by old and young individuals. Further to that, they show that having more employed people who earn an income in a household increased household debt whereas the interaction between income and education is also positive, showing that education increases income and makes households eligible for debt.
Gender is also an important determinant of debt. Being female or male has been found to influence spending patterns, risk-taking behaviour, and, therefore, financial choices. The results show that female heads of households are less likely to take on debt, as shown by six studies that found a negative coefficient, two that found a positive relationship, and five that found an insignificant effect. Despite a low risk appetite, females might be disadvantaged by a lack of employment opportunities, collateral, and education (Manogna & Mishra, 2022). Employment positively influenced indebtedness. Of the 18 studies that controlled for employment, 14 (78%) found a positive effect, 3 (17%) were negative, and 1 (5%) was insignificant. Employed individuals are likely to access debt because they have a means of repayment and are most likely to be educated with significant assets. On the other hand, self-employment showed positive results as indicated by three out of six (50%) studies that found a positive effect whereas two (33%) found a negative coefficient and one was insignificant. Malan et al. (2020) went further to examine how the sector in which a household head is employed affects the debt-holding probability. Household heads employed in agriculture, sales, and as clerics are twice as likely to use an overdraft facility as those in transport and communication. Employment in clerical, professional, sales, administrative, managerial, and technical occupations increases the likelihood of taking up credit card debt compared to those in the transport and communication sectors. The results not only highlight the importance of occupations in explaining household debt but also reveal the differences in the sensitivity of debt types to similar variables.
Only four studies examined the effect of the number of children and all found a positive effect. (see Feng et al., 2019; Lewin-Epstein & Semyonov, 2016; Mishra & Bhardwaj, 2021). Having children, on the other hand, has a positive effect, indicating that households with children are likely to borrow more than those without. An overwhelming 80% of the studies found positive results and only 10% found a negative result. Combining the results for the number of children and having children bolsters the finding that family size positively affects indebtedness. The requirement to meet children’s wants and needs can influence families to resort to debt when their income is insufficient. Similarly, marital status also influences indebtedness. Married household heads are more likely to acquire debt, as shown by this variable’s positive impact. Eleven studies found a positive effect compared to five that found a negative effect out of a total eighteen studies that controlled for marital status. The combined effect of income from two spouses and a very large family size could contribute to indebtedness. Families seem to provide protection in the event of adverse circumstances, making it more comfortable for married people and individuals from large families to take on debt (Fernandez-Lopez et al., 2024). The number of family members is closely related to family size. All four of the studies that examined the number of family members had a positive effect.
Savings have a negative effect on indebtedness, suggesting that households with enough income to save may not need to resort to debt to support their lifestyle. Of the four studies that investigated savings, two (50%) were negative, one (25%) was positive, and one (25%) was insignificant. The financial asset results are inconclusive, as shown by three studies that found a negative coefficient, while two were positive and the remaining two found an insignificant coefficient. Interpreted with the savings results, there is a clear suggestion that liquidity mitigates indebtedness. Even though these two constitute assets, they are not usually used as collateral and are near-money; therefore, they can serve as a substitute for debt in times of need. The results show that interest rates negatively affect household debt. This concurs with the theory that suggests that higher interest rates imply a higher cost of borrowing money and discourage households from borrowing.
Singh et al. (2014) found evidence that laziness, high expenditure on the house, and the share of non-institutional loans increase indebtedness as measured by outstanding liabilities. Similar results were obtained by Wildemauwe and Sanroman (2022) with regard to consumer debt but not mortgage debt. The results show that banking relationships increase the demand for loans, but borrowing from non-institutional sources increases indebtedness. Non-institutional lenders are likely to charge usurious rates, while at the same time they practice very little risk management, so they may not assess an individual’s state of indebtedness before advancing credit. However, this may not hold true in countries with well-developed financial markets that provide credit to households. For instance, in Germany and Slovenia, informal credit was found to negatively affect debt ownership (Jestl, 2023). Pastrapa and Apostolopoulos (2015) shed light on the importance of credit history by showing that households with credit histories and those with more credit cards are likely to obtain loans. Households that settled their debts previously had good relationships with lenders and were more likely to obtain loans than those who had not borrowed before or those who did not repay their loans. The results suggest that the state of financial sector development has a bearing on the use of informal credit and the level of household indebtedness. Mian and Sufi (2011) show that credit scores had a negative effect on household debt in the USA while being male enhanced the same. Using Japanese data, Nagano and Yeom (2014) reveal that bank competition and a risk-taking attitude, particularly a preference for interest rate risk, are positively related to mortgage debt. Bank soundness negatively impacts debt, suggesting that, in areas where capital adequacy is restricted, household debt is high. Households headed by a young male are likely to acquire more debt. Contrary to the results of Lagomarsino and Spiganti (2021), Altundere (2014) finds that risk-tolerant households have a higher likelihood of holding non-mortgage debt. This result was supported by Branten’s (2022) study in Estonia. It is important to highlight that these seemingly contrasting results can also be explained by the different types of debt used in different studies. It is more likely that risk-tolerant investors will seek credit card debt, car loans, and other forms of unsecured debt than risk-averse individuals.
Sociability also increases the probability of indebtedness, while living in a big city increases the chance of holding mortgage debt (Altundere, 2014). In Italy, Lagomarsino and Spiganti (2021) found that risk-averse households tend to have more debt, while having a bank account, living in the centre of Italy, and being financially educated increases total debt. The finding on risk-averse households is surprising though it could be true for mortgage debt rather than unsecured debt. Kim et al. (2016) found supporting evidence, suggesting that an unfavourable credit attitude negatively impacts mortgage debt holdings. They also show that financial sophistication and liquidity constraints increase debt holdings whereas emergency fund saving adequacy reduces the same. Race or ethnicity was found to be an insignificant determinant of debt in China. In the US, Smith et al. (2012) also revealed that financial sophistication among older households increased household debt. Liquidity constraints and being black and Hispanic were also associated with more household debt.
Tian (2022) found an effect of geographical location on debt and noted that rural households were less likely to have debt. These studies show that limited access to financial services and, therefore, financial exclusion could mitigate against rural households and those who reside in less-developed areas (for similar results, see Wong et al., 2023). However, the advent of financial technology and digital finance platforms such as mobile banking is expected to reduce this disparity. Tellingly, a study by Wang et al. (2022) found that digital financial inclusion and the ratio of unhealthy family members had a positive effect on household indebtedness (see, also, Li et al., 2023; Tian, 2022). Usage intensity and the use of digital finance to make transfers enhances the chances of households acquiring debt from formal banking institutions (Li et al., 2023). In addition, the use of internet banking had a positive effect on debt burden, while having a checking account increased the probability of accessing debt (Fuentealba et al., 2021). Yao et al. (2024) reveal that e-commerce activity positively enhances rural household indebtedness through increasing bank credit. This was mainly through an increase in information channels. The effect was more significant in the western region where people happened to have low asset values and income levels and therefore have greater financial needs. Households headed by a male had more debt mainly due to heightened e-commerce activity. In China, Li et al. (2024) also found the positive effect of internet use on household debt. They also show that car ownership, poverty classification, and living in the central region enhances household debt. Receiving a subsidy, living in the eastern region, and a higher dependency ratio reduces debt. The negative impact of dependency ratio contradicts evidence by Okurut and Schoombee (2007) in Uganda.
Contrary to expectations, in Indonesia, subjective financial well-being negatively affects debt, whereas the perception of welfare reduces indebtedness. As households increasingly feel the possibility of fulfilling their financial well-being, they reduce debt, when they perceive themselves as able to meet their welfare needs and are hence less vulnerable, they also reduce debt (Handayani et al., 2016). Supporting evidence for the negative effect of financial well-being on debt was obtained by Tahir and Ahmed (2021) in Australia. However, Shang and Saffar (2023) investigated the impact of state-level labour protection laws in the US and found that enacting laws that protect labour increases household debt because lenders become comfortable in extending debt to workers protected by the law. Protective labour laws reduce layoff risk, making lenders more willing to extend mortgage debt. Macroeconomic-level variables, such as income per capita, economic growth, GDP growth, house price growth, and state unemployment, were not significant determinants of debt.
Rahman et al. (2020) investigated the behavioural aspects of indebtedness and found that emotion and materialism had positive effects on debt. This suggests that households might not be rational, as assumed by finance theory, but rather that their choices in terms of making financial decisions are affected by their emotions and physical possessions. Yaparatne and Senathissa (2021) found evidence supporting this notion in Sri Lanka by discovering that the most influential factor in household indebtedness was the desire to maintain social status by borrowing to purchase durable and luxury goods (see, also, Lee & Mori, 2021). In this regard, transitory income shocks have a positive effect on debt (Jestl, 2023). Furthermore, Yaparatne and Senathissa (2021) found that households that are not satisfied with their current jobs and those looking for employment are more likely to be indebted. Another behaviour, impulsivity, has been found to positively influence the probability of having consumer credit (Ottaviani & Vandone, 2011). Fernandez-Lopez et al. (2024) investigated self-control and noted that a lack of self-control enhances the probability of taking loans from family members and friends, acquiring unsecured loans, and borrowing with the use of credit cards. However, the supply side also regulates the effects of self-control.
Contrary to the Rajan hypothesis, Hake and Poyntner (2022) found that income inequality has a negative impact on debt at the bottom of the distribution but becomes positive at the top. In essence, the impact of income inequality depends on household income level, suggesting the need to maintain social status as a contributing factor, as observed by Yaparatne and Senathissa (2021). In the Indian context, evidence regarding social status was observed by Padmaja and Ali (2019), who investigated the effects of belonging to a social class. Intuitively, households that fell in the other backward class (OBC) and high social category had a high probability of being indebted. The below-poverty line (BPL) and Antyodaya social categories, both in the agricultural household sector, were less likely to have debts. However, Mishra and Bhardwaj (2021) observed that scheduled tribes (STs), the OBC, and scheduled castes (SCs) were less likely to have debt. They went further to examine how religious beliefs interact with indebtedness and proved that being a Christian or a Muslim reduced credit availability as opposed to beliefs in Jainism, Zoroastrianism, Buddhism, Sikhism, and Hinduism. In the context of the USA, Charron-Chenier and Seamster (2021) show that having household debt is largely explained by racial disparities, with white people more likely to have debt than black households. Differences in the number of children, labour force participation, education, financial literacy, and marital status explain very few of the differences attributed to race. Walks (2013) on the other hand demonstrates that people of Chinese origin, manufacturing workers, and those who rent are less likely to obtain credit in Canada. The results further cement that being a minority or of supposedly inferior race deprives a household of the chance to access credit.
Among farmers in India (Pandey, 2016), land ownership reduces the quantity of household debt, while tractor ownership, borrowing for non-productive activities, permanent road connectivity, and institutional credit increase indebtedness, contrary to the results obtained by Singh et al. (2014). In contrast, Padmaja and Ali (2019) found that the size of land holdings and agricultural income increase debt, while primary involvement in cereal production reduces the incidence of indebtedness. Similarly, using binomial logistic regression, Thorat et al. (2020) showed the positive effect of land size, although the effect was reduced at high land sizes. Okurut and Schoombee (2007) found that, in Uganda, household land size did not affect access to credit, but that asset value had a positive influence. Household expenditure, being male, and living in a central, eastern, or western region enhanced the amount of credit, whereas living in an urban area had a negative effect. These results contrast with the expectation that residing in an urban area enhances debt through close proximity to financial services, having collateral, and having a stable income. Confirming the positive effect of family size, a high dependency ratio was found to positively impact household debt.
Kandikuppa and Gray (2022) focus on the effects of temperature changes and household indebtedness. Their results indicated that winter temperature anomalies were closely associated with indebtedness, although the results varied across agro-ecological regions, whereas rainfall showed mixed results. Drought significantly increased debt, whereas hailstorms had the opposite effect. Lewin-Epstein and Semyonov (2016) focused on examining the probability of having mortgage debt among middle-aged and old households. Their results reveal that old age, illness in the household, and being single reduces the probability of having mortgage debt for both males and females. At the opposite end of the scale, household income, years of education, being employed, being self-employed, receiving a gift, and the number of children have an adverse effect. The researchers further examined how the same variables influence the total number of liabilities, and they show that being single, receiving a gift or inheritance, being old aged, and not having a mortgage reduce the debt held by households while having a mortgage or an illness in the household increase household debt. Their results indicate that some of the variables have differing effects on different debt types.
Intarapak and Supapakorn (2020) and Padmaja and Ali (2019) reveal that remittances have an adverse effect on household debt. Households that received remittances were likely to borrow less, thus bringing out the substitution effect of remittances. A similar result from Jestl (2023) highlights that receiving support from family is negatively associated with consumption-related debt. However, the effect of receiving an inheritance is mixed across the Euro-area countries covered in this research. Heintz-Martin et al. (2021) studied mothers’ indebtedness in Germany. They found that households with single mothers and migrant mothers were less likely to be indebted, whereas mothers supporting relatives, educated mothers, and those reporting economic deprivation were more likely to hold debt. Tseng and Hsiao (2022) discovered that a sense of security increased debt, and working for a government department showed mixed results. Comelli (2021) showed how government welfare policies interact with the level of household indebtedness. The researcher found that these policies influenced debt. Policy generosity has an adverse effect on debt, while employment coverage and sick pay generosity have a positive impact on debt in OECD countries. Policy initiatives can also inspire confidence among the citizens of a country. In Poland, consumer confidence influences household demand for mortgages and durable loans but reduces debt for consumption and incidental expenditure, according to results by Bialowoski (2019). The study highlights that when households are confident about the future of the economy, they are inclined to demand long-term debt because they are confident about their capability to pay even in the future. Still on sentiments, Bailey et al. (2016) show that a household’s belief about future house prices influences leveraging decisions. Pessimistic homebuyers increase leverage but chose small down payments in states with low default costs when house prices are expected to fall. House value misestimation was also found to influence household leverage in China. Liang and Gao (2021) found that a 10% increase in misestimating resulted in a 1.88 increase in household debt.
Government interventions in the form of stimulus packages during the global financial crisis were found to adversely affect household debt in the US by Olivero and Dvalishvili (2021). The findings show that households strive to reduce the cost of debt by using stimulus payments to reduce their outstanding liabilities. They bear out that the elasticity of debt is dependent on the debt type, with mortgage debt and bank loans being adversely affected while credit card debt is positively impacted by stimulus package payments. The deleveraging effect is more pronounced for bank loans and mortgages, indicating household priorities. Similarly, the effect of income and family size was also dependent on debt type. In the same country, Barrot et al. (2022) show that import completion and credit scores increase household debt whereas being employed in the manufacturing sector adversely affects debt holding. The effect of import competition is exacerbated by home equity extraction and more pronounced in areas where house prices are rising.
Fabbri and Padula (2004) examined the factors explaining a household’s probability of being denied a loan by a bank in Italy. They found that a high income, pledging collateral, and being married reduce the chances of being denied a loan. Weaker legal enforcement, as measured by the backlog of pending trials, increased the probability of households being denied loans. The results clearly show that lenders are willing to advance credit when it is highly likely that they will receive their money back and when it is easy to recover it in the event of a default. Zanin (2017) explored the factors that determine a household’s propensity to obtain informal loans. Surprisingly they found that having a mortgage and a loan from the banking sector is positively related to having an informal loan. Having an unemployed head of the household, a young head of the house hold, and living in a large municipality increases the chances of borrowing informally. Low-income households and those that are constrained in terms of liquidity are likely to contract informal debt. Tellingly, the results indicate that having outstanding loans makes a household an unattractive borrower in the eyes of lenders, therefore they are likely to rely on family and friends for debt. At the same time, being unemployed and having a low income increases default risk; therefore, banks are unwilling to extend credit to such individuals. They ultimately rely on informal debt.
Bank regulation is another important determinant of household debt, as it can constrain banks to extend credit. Using data from the USA, Brown et al. (2019) confirm that deregulation in the banking sector increased total and secured household debt. Regulatory changes implemented in Portugal in the form of macroprudential policies also impacted household debt. Abreu et al. (2024) used the difference in differences estimation technique to show that limits on loan-to-value ratios announced by the Banco de Portugal in 2018 reduced household debt for constrained households. Households responded by taking smaller loans and reducing their leverage. Brown et al. (2019) also show that being male is negatively correlated with total debt, unsecured debt, and secured debt; whereas, being white increases secured and total debt. Other than that, being widowed or divorced increases the chances of having all forms of debt while being healthy reduces total and unsecured debt. Feng et al. (2019) found supporting evidence on the negative impact of being healthy on both secured and unsecured debt in Poland. However, they found that being male enhances acquiring unsecured debt, signalling a possible high appetite for risk for the male gender.

4. Conclusions

From the 83 studies reviewed in this review, it is evident that there is increasing interest in comprehending the determinants of household indebtedness. This burgeoning interest emanates from the recognition that household debt is central to the welfare of households and the stability of the economy. Events such as the global financial crisis have highlighted the fragility of the economy when household debt is not well understood. This heightened attention has led to the publication of papers that stretch the boundaries of knowledge, thus establishing a solid foundation on which future research will be based. This study benefitted from past research and contributes to the literature by providing an overview of studies that examine the determinants of household indebtedness. We reviewed 83 articles published between 2004 and 2024, covering a diverse collection of theories and methodological approaches. Most studies covered in this research have concentrated on developed countries, particularly those belonging to the European Union and the OECD. In the case of household-level studies, India had the most studies reviewed, followed by other European countries. The most widely used theory is the life cycle hypothesis, while the dominant methodological approaches are the OLS and ARDL models for country-level studies, and probit, logistic, and OLS are the most popular in household-level studies.
The research delineated two sets of determinants of household indebtedness: household-specific and macroeconomic variables. Our review of empirical evidence shows that house prices, unemployment, GDP, inflation, interest rates, household expenditure, and income are the major macro-level determinants of household indebtedness. Household studies indicate that education level, household income, social class, employment, household wealth, housing prices, and family size are major determinants. Furthermore, the age of the head of the household, old age, gender, marital status, and savings were prominent factors explaining household indebtedness. All these factors identified here are demand factors because they influence the demand for household debt. Few studies examined supply factors such as financial development, bankruptcy rates, the quality of credit registers, the length of time to resolve insolvencies, and strong institutions. These variables influence financial institutions’ willingness and ability to extend credit to households, therefore they influence the supply of household debt. Our results from country-level studies concur with the common variables examined by these two sets of studies. For instance, employment shows a positive effect in household-level studies, while unemployment has a negative effect in country-level studies. This shows that being employed positively influences household debt at the macro level, whereas being unemployed reduces household debt at the household level. A similar pattern was observed for housing prices and income. House prices also influence debt at both the macro and household levels because data on house price changes can be obtained at the macro and household level. This enabled a comparison of how common factors affect household debt at different levels.
A number of theories, such as the house price hypothesis, the low interest hypothesis, the credit supply hypothesis, and the financial deregulation hypothesis, were supported by evidence. The Rajan hypothesis and expenditure cascade hypothesis were contradicted by most studies. More research is needed to test the impacts of inequality, income, and economic growth on household debt.

5. Practical Implications

This study has several important practical implications. The effect of the variables identified varies with the type of debt (e.g., car loans, credit card debt, mortgage debt) and the debt measure used, making it difficult to objectively compare different studies and their results as well as to generalise them. Therefore, it is important that there be due consideration when interpreting the results for the purpose of informing policy. For instance, there is evidence that the impact of income inequality is different for mortgage and non-mortgage debt, such as credit card debt and car loans (Christen & Morgan, 2005; Hake & Poyntner, 2022). Similar results were also found for the impact of occupation, income, employment status, life stage, family size, and financial assets on credit card debt, home loans, overdraft facilities, student loans, and vehicle financing (Malan et al., 2020). This implies that policies impact loan types differently; therefore, due consideration should be taken.
Policies meant to influence household debt should not only consider variables that affect demand for debt but should target variables that influence the supply of credit as well, in order to effectively influence indebtedness. When house prices are rising, interest rates are falling, deregulation is increasing, and financial markets are developing, household debt should be expected to rise. Therefore, countries can increase household debt by improving financial sector development, lowering the cost of debt, reducing financial sector regulation, reducing unemployment, enacting laws that protect creditor rights, and making debt recovery easy. To reduce household debt, efforts should be directed towards subsidising households during financial distress, increasing interest rates, and promoting household savings. However, it is important to emphasise that country-specific evidence should be obtained to inform policy decisions.
In addition, although the technique used in this study was based on the frequency of coefficients (taking the coefficient with the highest frequency between positive and negative), there is evidence that the results were mixed for most of the variables. This suggests that the results could vary depending on the country’s economic characteristics or the geographical location under study. Therefore, this calls for country-specific or region-specific studies owing to the lack of the generalizability of the studies. Moreover, the use of different econometric techniques, debt measures, debt types, periods covered, and sample sizes could lead to ambiguous results. Based on the results of these studies, policymakers can know which variables to target when studying their specific context and which questions to ask if their results are different.
We also identified some methodological gaps. Most studies relied on OLS, ARDL, probit, and logistic regression (Khan et al., 2016; Piovarci, 2021). The reliance on these models could introduce weaknesses due to problems of nonlinearity, endogeneity, omitted variables, and an inability to handle high-frequency data. Therefore, studies could derive benefits from using recent methods such as those driven by AI, GMM, QR, and IV-2SLS that handle large data sets, nonlinear data and address endogeneity. Techniques such as Sentiment Analysis which uses Natural Language Processing can ensure objectivity and accuracy capturing emotional intensity and behaviour. Predictive analysis that relies on machine learning and algorithms could also be useful in predicting the future of household debt.
There is a need for more studies on African and South American countries, which have been neglected by researchers. The unique characteristics of countries and households in these regions could affect how the variables covered in the literature relate to household indebtedness. Similarly, macroeconomic variables such as industrialisation, population density, capital flight, press freedom, subjective well-being, financial development, remittances, and democracy could be relevant in explaining household indebtedness. At the household level, characteristics such as race, black tax, ethnicity, and language, which have been neglected in previous studies, could also determine debt holding. Behavioural variables, such as self-control, risk appetite, and expectations about the future have been found to influence indebtedness, but other behaviours such as happiness, overreaction, and herding behaviour have not been examined. This leaves huge gaps that need to be addressed in future studies.
In addition to the gaps identified, this study is important for informing policy formulation. For instance, it highlights the importance of economic factors and individual characteristics such as education, behaviour, social class, wealth, geographical location, climatic conditions, and government policies in explaining indebtedness. Policymakers can therefore target specific economic and social policies that influence indebtedness. Moreover, the study elucidated the effect of demand and supply factors on household debt, so further informing policy on the option of influencing supply factors to control household debt.

6. Limitations and Areas for Future Research

A number of limitations were identified. Excluding non-English papers restricted the selection and omitted evidence from non-English-speaking countries that present research in their native language. The nine databases that were searched are not the total number of available databases. Though we tried to be as inclusive as possible, studies could have been missed. Moreover, the results may not be generalizable to developing regions and emerging markets due to their low representation in the sample.
Future research should focus on expanding the databases and including non-English papers. Also, there is a need to explore if variables that explain over-indebtedness are similar or different from variables that determine indebtedness or one’s access to debt. This review clearly showed that emerging markets and developing countries were neglected by past research, therefore more research should concentrate on these regions. Behavioural factors, among them happiness, heading, overreaction, underreaction, which are known to affect investment decision-making, should also be investigated in the context of household debt. Lastly, there is a need for research that extensively investigates how climate risk, the COVID-19 pandemic, and central bank independence impact household debt at the macro level.

Author Contributions

Conceptualization, C.K.C. and L.N.; methodology, C.K.C. and L.N.; validation, C.K.C. and L.N.; formal analysis, C.K.C. and L.N.; writing—original draft, C.K.C. and L.N.; writing—review and editing, C.K.C. and L.N. All authors have read and agreed to the published version of the manuscript.

Funding

This research received no external funding. The APC was funded by the University of Johannesburg.

Data Availability Statement

No new data was created. Only publicly available articles were reviewed. Detailed reference information is included under the references section.

Conflicts of Interest

The authors declare no conflict of interest.

Appendix A

Table A1. Macro-level studies.
AuthorsCountriesMethodPeriodUNINGDHPIROGISCSSREASWHSHCIPGIIDIW
1Annarelli (2022)15 OECDOLS1995–2010* + * *
2Pan (2023)30 OLS, GMM1960–2018 ** * +
3Turinetti and Zhuang (2011)USFDLM1980–2010- +- +--+ -
4Meniago et al. (2013)South AfricaVECM1985–2012 ++ +-
5Bolibok (2015)PolandLR and PCA1997–2013- -- +
6Mamatzakis et al. (2023)OECDANN VAR2020–2021
7Manole et al. (2016)RomaniaLSM2008–2015--
8Khan et al. (2016)MalaysiaARDL1999–2014 ++- + +
9Vijverberg (2024)USASEPM1999–2015 -
10Nomatye and Phiri (2017)South AfricaOLS and QR2002–2016 *+-- * +
11Moore and Stockhammer (2018)13 OECDECM1993–2011 +* * *
12Bolibok (2018)31 OECDFEPR 1996–2015* - - + - +
13Zain et al. (2019)MalaysiaOLS2010–2017- *++
14Fasianos et al. (2017)USANARDL1913–2008 +
15Berisha and Meszaros (2018)USAJEG1929–2009 + +
16Barradas and Tomas (2023)28 EUFE2SLS1995–2016 ++ - -
17Czech and Puszer (2021)V4PSP2019–2021
18Enache (2022)RomaniaSVAM2011–2021 - +
19Johnston et al. (2021)17 OECDDLPA1995–2007
20Zimunya and Raboloko (2015)BotswanaVECM1994–2012 - + +
21Park and Lee (2018)28 OECDOLS, SUR1995–2015+ -+* * *
22Lim (2019)42PHP VAR1970–2015 -
23Abd Samad et al. (2020)19 EMBCLSDV, GMM1995–2018-- ++ * **
24Maneejuk et al. (2021)ThailandPQRM2009–2017 +-
25Romao and Barradas (2022)PortugalNARDL1988–2016 ** + + +
26Dumitrescu et al. (2022)26 OECD QR, GMM2002–2020---+ +
27Zhou and Niyitegeka (2023)South AfricaVECM1980–2021- + + -
28Christen and Morgan (2005)USSUR and OLS1980–2003 - -* +
29Kakuru and Kaulihowa (2022)NamibiaARDL2004–2020
30Kraft (2007)90 OLS2003–2005 - +
31Coletta et al. (2018)33 OECDFE and IV1995–2016++ + -
32Lepers (2024)51 FE1990–2017 *+*
33T. Long et al. (2024)52FE1990–2019 +
34Yahya et al. (2023)MalaysiaSEM1991–2021+*+**
35Bazillier et al. (2021)30IV1970–2017 ++- - +
* = insignificant. CS = consumer sentiment/confidence; DI = domestic investment; EA = education attainment; GD = gross domestic product; HC = household consumption/expenditure; HP = house prices; HS = household savings; I = income; II = income inequality; IN = inflation; IR = interest rate; IS = interest rate spread; LE = life expectancy; OG = output growth volatility; PG = population growth; SR = share of retiring population; SW = share of working-age population; UN = unemployment; W = wage.
Table A2. Household-level studies.
AuthorsCountryMethodPeriodEDFSHPHOAGG fEIWOANCM mRTSFANMSEIRHC
1Lewin-Epstein and Semyonov (2016)14 EU and IsraelTobit2013* +* -+
2Olivero and Dvalishvili (2021)USAOLS2008 + +
3Abid et al. (2012)TunisiaProbit2010
4Barrot et al. (2022)USAOLS1999–2007 - +-
5Singh et al. (2014)IndiaMSR2013+
6Walks (2013)CanadaOLS2001–2009 + - - +
7Altundere (2014)13 EU Probit and Tobit2007–2007 - ++ + -+
8Haq et al. (2018)PakistanMMELR2001–2014++ -++* -
9Pandey (2016)IndiaTobit2011–2012- + +
10Handayani et al. (2016)IndonesiaOLS + +++ + +
11Rahman et al. (2020)MalaysiaPLS2016, 2017 + *
12Strzelecka and Zawadzka (2020)PolandC, MWMCA, U, DPH2004–2018+ + - + ++
13Hake and Poyntner (2022)10 EUMultilevel probit2008–2018+ ++ - +
14Piovarci (2021)SlovakiaLogistic2017- *+- + +
15Comelli (2021)30 OECDProbit1995–2017+ - +- +
16Yaparatne and Senathissa (2021)Sri LankaOLS2018+ +-
17G. M. Long (2018)USOLS1995–2013
18Padmaja and Ali (2019)IndiaHTSSM2013+ + -
19Intarapak and Supapakorn (2020)ThailandLogistic, BSM2017 + +
20Atalay et al. (2020)AustraliaHTSSM2002–2014 +
21Thorat et al. (2020)IndIaBLR2012–2013*+ **
22Cao-Alvira et al. (2020)ColombiaLogistic 2011–2015+ - + +
23Tahir and Ahmed (2021)AustraliaRE, TPBLR2002–2018+ -*+* *
24Heintz-Martin et al. (2021)GermanyLogistic 2019
25Wang et al. (2022)ChinaTWFE2013–2017** * *-* *
26Lagomarsino and Spiganti (2021)ItalyPOLS, RE, CRE, CRET1989–2016 - ++ -
27Mishra and Bhardwaj (2021)IndiaQR2002-+ -- -+ -
28Kandikuppa and Gray (2022)IndiaLogistic 2004–2012
29Tseng and Hsiao (2022)ChinaQR2015-/+ - ++
30Manogna and Mishra (2022)IndiaTobit, HTSSM2012–2013++ +- +
31Wildemauwe and Sanroman (2022)UruguayProbit2014, 2017- + +--
32Tian (2022)ChinaTobit, 2SLS 2019 + --
33Branten (2022)EstoniaProbit, HTSSM2013, 2017- ++ +
34Dharmadasa and Gunatilake (2023)Sri LankaMLR2021++ ** * * **
35Wong et al. (2023)Malaysia2SLS2019 -+
36Jestl (2023)15 EuroProbit2010* --+*- --
37Malan et al. (2020)South AfricaCPHRM1999–2013+- *+ + *
38Pastrapa and Apostolopoulos (2015)GreeceHTSSM, Probit, OLS2009 ++ + - + - -
39Camoes and Vale (2018)PortugalTobit2010+ - +++
40Ottaviani and Vandone (2011)ItalyProbit2008–2009* ** *+ + +
41Datta et al. (2017)IndiaBayesian, OLS, LR2015–2016 -
42Lee and Mori (2021)SingaporePanel-GLM2010–2012 - +- + -
43Fuentealba et al. (2021)ChileTobit, probit, CMP2014 and 2017++ ++ - -
44Fernandez-Lopez et al. (2024)SpainProbit2016–2017+ +*-+ - + *
45Li et al. (2023)ChinaFE2011–2017* ++_ + * + + +
46Fabbri and Padula (2004).ItalyProbit1989–1988*+ * + **
47Zanin (2017)ItalyBivariate Probit1995–2014
48Brown et al. (2019)USAProbit, Tobit1984–2005+ +- ++ + + -
49Bialowoski (2019)PolandMLCM2008–2018
50Feng et al. (2019)ChinaBTPLVM2015+++ + - ++
51Abreu et al. (2024)PortugalDiD2017–2019
52Mian and Sufi (2011)USAIV2002–2006 + - +
53Nagano and Yeom (2014)JapanOLS2001–2010 + - * -
54Okurut and Schoombee (2007)UgandaHTSSM1999–2000 + *
55Yao et al. (2024)ChinaOLS/2SLS
56Kim et al. (2016)ChinaProbit2010, 2013+ - +- + -
57Li et al. (2024)ChinaCMPM2017*- - + +
58Shang and Saffar (2023)USAOLS1984–1999++ -- ++ ++
59Bailey et al. (2016)USAFE2008, 2014
60Jung and Kim (2020)Korea 2012–2017
61Smith et al. (2012)USAMLR1995–2007+ + * +
62Liang and Gao (2021)ChinaOLS, 2SLS2013 + - - +
* = Insignificant; AG = age; E = employment; ED = education; FA = financial assets; FS = family size; G f = gender (female); HC = having children; HO = house ownership; HP = house prices; I = income; IR = interest rates; M m = marital status (married); NC = number of children; NFM = number of family members; OA = old age level; RE = random effects; RT = retired; S = saver; SE = self-employed; W = wealth.

References

  1. Abd Samad, K., Idris, N. H., Abd Rahman, N. H., Sani, A., & Mohd Soffian Lee, U. H. (2023). Systematic literature review on the macroeconomic factors of household debt. In European proceedings of finance and economics. European Publisher. [Google Scholar] [CrossRef]
  2. Abd Samad, K., Mohd Daud, S. N., & Mohd Dali, N. R. S. (2020). Determinants of household debt in emerging economies: A macro panel analysis. Cogent Business and Management, 7(1), 1831765. [Google Scholar] [CrossRef]
  3. Abid, L., Zouari, D., & Zouari-Ghorbel, S. (2012). Household indebtedness in Tunisia. Journal of Business Management and Economics, 3(10), 341–350. [Google Scholar]
  4. Abreu, D., Felix, S., Oliveira, V., & Silva, F. (2024). The impact of a macro prudential borrower-based measure on households’ leverage and housing choices. Journal of Housing Economics, 64, 101995. [Google Scholar] [CrossRef]
  5. Achtziger, A., Hubert, M., Kenning, P., Raab, G., & Reisch, L. (2015). Debt out of control: The links between self-control, compulsive buying, and real debts. Journal of Economic Psychology, 49, 141–149. [Google Scholar] [CrossRef]
  6. Altundere, B. M. (2014). The relationship between sociability and household debt. ADAM AKADEMİ, Cilt 4(2), 27–58. [Google Scholar] [CrossRef]
  7. Annarelli, M. K. (2022). Welfare generosity, credit access and household debt: Clarifying relationships through a new welfare-debt typology. New Political Economy, 27(4), 680–696. [Google Scholar] [CrossRef]
  8. Atalay, K., Barrett, F. G., Edwards, R., & Yu, C. (2020). House price shocks, credit constraints and household indebtedness. Oxford Economic Papers, 72(3), 780–803. [Google Scholar] [CrossRef]
  9. Bailey, M., Davila, E., Kuchler, T., & Stroebel, J. (2016). House price beliefs and mortgage leverage choice. Review of Economic Studies 86, 2403–2452. [Google Scholar] [CrossRef]
  10. Baltagi, B. H. (2005). Econometric analysis of panel data (3rd ed.). Cambridge University Press. [Google Scholar]
  11. Barradas, R., & Tomas, I. (2023). Household indebtedness in the European Union countries: Going beyond the mainstream interpretation. PSL Quarterly Review, 76(304), 21–49. [Google Scholar] [CrossRef]
  12. Barrot, J., Loualiche, E., Plosser, M., & Sauvagnat, J. (2022). Import competition and household debt. The Journal of Finance, LXXVII(6), 3037–3091. [Google Scholar] [CrossRef]
  13. Bazillier, R., Hericourt, J., & Ligonneire, S. (2021). Structure of income inequality and household leverage: Cross country causal evidence. European Economic Review, 132, 103629. [Google Scholar] [CrossRef]
  14. Berisha, E., & Meszaros, J. (2018). Household debt, consumption, and income inequality. International Economic Journal, 32(2), 161–176. [Google Scholar] [CrossRef]
  15. Bialowoski, P. (2019). Economic sentiment as a driver for household financial behaviour. Journal of Behavioral and Experimental Economics, 80, 59–66. [Google Scholar] [CrossRef]
  16. Biyanwila, K. U. P. B., & Anuradha, S. N. A. P. (2023). Behavioral factors affecting household over-indebtedness: A systematic review. Vidyodaya Journal of Management, 9(I), 84–107. [Google Scholar] [CrossRef]
  17. Bolibok, P. (2015). An empirical evaluation of the demand-side drivers of household residential debt: The case of Poland. Finanse, Rynki Finansowe, Ubezpieczenia nr, 74, 597–608. [Google Scholar]
  18. Bolibok, P. (2018). The macroeconomic drivers of household debt-to-income ratio: An evidence from the OECD countries. Copernican Journal of Finance & Accounting, 7(2), 29–41. [Google Scholar] [CrossRef]
  19. Branten, E. (2022). The role of risk attitudes and expectations in household borrowing: Evidence from Estonia. Baltic Journal of Economics, 22(2), 126–145. [Google Scholar] [CrossRef]
  20. British Medical Journal [BMJ]. (2021). PRISMA 2020 explanation and elaboration: Updated guidance and exemplars for reporting systematic reviews. BMJ, 372, n160. [Google Scholar] [CrossRef]
  21. Brown, S., Gray, D., & Montagnoli, A. (2019). Credit supply shocks and household leverage: Evidence from the US banking deregulation. Journal of Financial Stability, 42, 97–115. [Google Scholar] [CrossRef]
  22. Brown, S., & Taylor, K. (2008). Household debt and financial assets: Evidence from Germany, Great Britain and the USA. Journal of the Royal Statistical Society, 171, 615–643. [Google Scholar] [CrossRef]
  23. Camoes, F., & Vale, S. (2018). I feel wealthy: A major determinant of Portuguese households’ indebtedness? Empirical Economics, 58, 1953–1978. [Google Scholar] [CrossRef]
  24. Cao-Alvira, J. J., Novoa-Hoyos, A., & Nunez-Torres, A. (2020). On the financial literacy, indebtedness, and wealth of Colombian households. Review of Development Economics, 25, 978–993. [Google Scholar] [CrossRef]
  25. Charpentier, A., Flachaire, E., & Antoine, L. (2018). Econometrics and machine learning. Economics and Statistics, 505, 147–169. [Google Scholar] [CrossRef]
  26. Charron-Chenier, R., & Seamster, L. (2021). Racialized debts: Racial exclusion from credit tools and information networks. Critical Sociology, 47(6), 977–992. [Google Scholar] [CrossRef]
  27. Chichaibelu, B. B., & Waibel, H. (2018). Over-indebtedness and its persistence in rural households in Thailand and Vietnam. Journal of Asian Economics, 56, 1–23. [Google Scholar] [CrossRef]
  28. Christen, M., & Morgan, M. R. (2005). Keeping up with the Joneses: Analyzing the effect of income inequality on consumer borrowing. Quantitative Marketing and Economics, 3, 145–173. [Google Scholar] [CrossRef]
  29. Chu, J. (2019). Accruals, investment, and future performance. A Journal of Accounting, Finance and Business Studies, 55(4), 783–809. [Google Scholar] [CrossRef]
  30. Coletta, M., De Bonis, R., & Piermattei, S. (2018). Household debt in OECD countries: The role of supply-side and demand-side factors. Social Indicators Research, 143, 1185–1217. [Google Scholar] [CrossRef]
  31. Comelli, M. (2021). The impact of welfare on household debt. Sociological Spectrum, 41(2), 154–176. [Google Scholar] [CrossRef]
  32. Cooper, C. R., Mullins, M., & Weinstock, L. R. (2021). COVID-19: Household debt during the pandemic. Congressional research service report. Available online: https://crsreports.congress.gov (accessed on 9 September 2024).
  33. Currit, N. (2002). Inductive regression: Overcoming OLS limitations with the general regression neural network. Computers, Environment and Urban Systems, 26(4), 335–353. [Google Scholar] [CrossRef]
  34. Czech, M., & Puszer, B. (2021). Impact of the COVID-19 pandemic on the consumer credit market in V4 countries. Risks, 9, 229. [Google Scholar] [CrossRef]
  35. D’Alessio, G., & Iezzi, S. (2013). Household over-indebtedness: Definition and measurement with Italian data. Bank of Italy Occasional Paper No. 149. Bank of Italy. [Google Scholar] [CrossRef]
  36. Datta, S., Tiwari, K. A., & Shylajan, C. S. (2017). An empirical analysis of nature, magnitude and determinants of farmers’ indebtedness in India. International Journal of Social Economics, 45(6), 888–908. [Google Scholar] [CrossRef]
  37. Dharmadasa, C., & Gunatilake, M. M. (2023). Determinants of household credit behavior of low-income households in Sri Lanka. Asian Economic and Financial Review, 13(10), 715–726. [Google Scholar] [CrossRef]
  38. Dumitrescu, B. A., Enciu, A., Hândoreanu, C. A., Obreja, C., & Blaga, F. (2022). Macroeconomic determinants of household debt in OECD Countries. Sustainability, 14, 3977. [Google Scholar] [CrossRef]
  39. Enache, C. (2022). Macroeconomic determinants of household indebtedness in Romania: An econometric approach. Journal of Social and Economic Statistics, 11(1–2), 102–117. [Google Scholar] [CrossRef]
  40. Estoque, R. C., Togawa, T., Ooba, M., Gomi, K., Nakamura, S., Hijioka, Y., & Kameyama, Y. (2019). A review of quality of life (QOL) assessments and indicators: Towards a “QOL-Climate” assessment framework. Ambio, 48(6), 619–638. [Google Scholar] [CrossRef]
  41. European Commission. (2008, February). Towards a common operational European definition of over-indebtedness. Available online: www.bristol.ac.uk/media-library/sites/geography/migrated/documents/pfrc0804.pdf (accessed on 3 July 2024).
  42. Fabbri, D., & Padula, M. (2004). Does poor legal enforcement make households credit-constrained? Journal of Banking & Finance, 28, 2369–2397. [Google Scholar]
  43. Fasianos, A., Raza, H., & Kinsella, S. (2017). Exploring the link between household debt and income inequality: An asymmetric approach. Applied Economics Letters, 24(6), 404–409. [Google Scholar] [CrossRef]
  44. Feng, X., Lu, B., Song, X., & Ma, S. (2019). Financial literacy and household finances: A Bayesian two-part latent variable modelling approach. Journal of Empirical Finance, 51, 119–137. [Google Scholar] [CrossRef]
  45. Fernandez-Lopez, S., Castro-González, S., Rey-Ares, L., & Rodeiro-Pazos, D. (2024). Self-control and debt decisions relationship: Evidence for different credit options. Current Psychology, 43, 340–357. [Google Scholar] [CrossRef]
  46. Friedman, M. (1957). A theory of the consumption function. Princeton University Press. [Google Scholar]
  47. Fuentealba, D. L. C., Mendoza, A. M. J., Yelpo, S. M. S., Ramos, V. L. C., & Fuentes-Solis, A. R. (2021). Household debt, automatic bill payments and inattention: Theory and evidence. Journal of Economic Psychology, 85, 102385. [Google Scholar] [CrossRef]
  48. Hake, M., & Poyntner, P. (2022). Keeping up with the Novaks? Income distribution as a determinant of household debt in CESEE. Review of Income and Wealth Series, 68(S1), S224–S260. [Google Scholar] [CrossRef]
  49. Handayani, D., Salamah, U., & Yusacc, N. R. (2016). Indebtedness and subjective financial wellbeing of households in Indonesia. Economics and Finance in Indonesia, 62(2), 78–87. [Google Scholar] [CrossRef]
  50. Haq, W., Ismail, A. N., & Satar, M. N. (2018). Household debt in different age cohorts: A multilevel study. Cogent Economics & Finance, 6(1), 1455406. [Google Scholar] [CrossRef]
  51. Harari, D. (2018). Household debt: Statistics and impact on economy (House of Commons Briefing Paper 7584). UK Parliament. Available online: https://commonslibrary.parliament.uk/research-briefings/cbp-7584/ (accessed on 3 September 2024).
  52. Heintz-Martin, V., Recksiedler, C., & Langmeyer, N. A. (2021). Household debt, maternal well-being, and child adjustment in Germany: Examining the family stress model by family structure. Journal of Family and Economic Issues, 43, 338–353. [Google Scholar] [CrossRef] [PubMed]
  53. Intarapak, S., & Supapakorn, T. (2020). Application of logistic regression analysis to household debt of Bangkok and metropolitan area of Thailand. WSEAS Transactions on Business and Economics, 17, 676–680. [Google Scholar] [CrossRef]
  54. Jestl, S. (2023). The impact of income inequality on household indebtedness in Euro area countries. European Journal of Economics and Economic Policies: Intervention, 20(2), 151–182. [Google Scholar] [CrossRef]
  55. Johnson, P. T. (2014). Snowball sampling: Introduction. In Wiley statsref: Statistics reference online. Wiley. [Google Scholar] [CrossRef]
  56. Johnston, A., Fuller, W. G., & Regan, A. (2021). It takes two to tango: Mortgage markets, labor markets and rising household debt in Europe. Review of International Political Economy, 28(4), 843–873. [Google Scholar] [CrossRef]
  57. Jung, D., & Kim, S. Y. (2020). Income volatility, household leverage, and consumption in Korea. Japan and World Economy, 53, 100994. [Google Scholar] [CrossRef]
  58. Kakuru, C., & Kaulihowa, T. (2022). Determinants of house price dynamics and household indebtedness in Namibia. Studies in Economics and Econometrics, 46(3), 185–200. [Google Scholar] [CrossRef]
  59. Kandikuppa, S., & Gray, C. (2022). Climate change and household debt in rural India. Climatic Change, 173(3), 20. [Google Scholar] [CrossRef]
  60. Karambakuwa, T. R., & Ncwadi, R. (2021). Determinants of household over-indebtedness in South Africa. International Journal of Business and Economic Development, 9(2), 11–24. [Google Scholar] [CrossRef]
  61. Khan, A. H. H., Abdullah, H., & Samsudin, S. (2016). Modelling the determinants of Malaysian household debt. International Journal of Economics and Financial Issues, 6(4), 1468–1473. [Google Scholar]
  62. Khatib, S. F. A., Abdullah, D. F., Al Amosh, H., Bazhair, A. H., & Kabara, A. S. (2022). Shariah auditing: Analyzing the past to prepare for the future. Journal of Islamic Accounting and Business Research, 13, 791–818. [Google Scholar] [CrossRef]
  63. Khatib, S. F. A., Al Amosh, H., & Ananzeh, H. (2023). Board compensation in financial sectors: A systematic review of twenty-four years of research. International Journal of Financial Studies, 11, 92. [Google Scholar] [CrossRef]
  64. Kim, K. T., Seay, M. C., & Smith, H. L. (2016). After the great recession: Financial sophistication and housing leverage. Applied Economics Letters, 23(18), 1285–1288. [Google Scholar] [CrossRef]
  65. Kraft, E. (2007). The boom in household lending in transition countries: A Croatian case study and a cross-country analysis of determinants. Comparative Economic Studies, 49, 345–366. [Google Scholar] [CrossRef]
  66. Lagomarsino, E., & Spiganti, A. (2021). Risk aversion and the size of desired debt. Italian Economic Journal, 9, 369–396. [Google Scholar] [CrossRef]
  67. Leandro, C. J., & Botelho, D. (2022). Consumer over-indebtedness: A review and future research agenda. Journal of Business Research, 145, 535–551. [Google Scholar] [CrossRef]
  68. Lee, O. K., & Mori, M. (2021). Conspicuous consumption and household indebtedness. Real Estate Economics, 49, 557–586. [Google Scholar] [CrossRef]
  69. Lepers, E. (2024). Fiscal policy as credit policy: Homeownership subsidization and the household debt boom. Economy and Society, 53(2), 322–349. [Google Scholar] [CrossRef]
  70. Lewin-Epstein, N., & Semyonov, M. (2016). Household debt in midlife and old age: A multinational study. International Journal of Comparative Sociology, 57(3), 151–172. [Google Scholar] [CrossRef]
  71. Li, G., Lv, X., & Han, X. (2023). Digital financial inclusion and household debt in China. Applied Economics Letters, 3019, 2862–2866. [Google Scholar] [CrossRef]
  72. Li, J., Vatsa, P., & Ma, W. (2024). Internet use and household debt: Insights from rural China. Applied Economics, 110, 1–21. [Google Scholar] [CrossRef]
  73. Liang, P., & Gao, N. (2021). Homevalue misestimation and household leverage: An empirical study of Chinese urban households. Cities, 109, 103043. [Google Scholar] [CrossRef]
  74. Lim, H. (2019). The response of household debt to income inequality shocks: A heterogeneous approach. Applied Economics Letters, 2698, 684–689. [Google Scholar] [CrossRef]
  75. Long, G. M. (2018). Pushed into the red? Female-headed households and the pre-crisis credit expansion. Forum for Social Economics, 47(2), 224–236. [Google Scholar] [CrossRef]
  76. Long, T., Bu, K., Du, P., & Wang, Z. (2024). Can educational investment mitigate the impact of aging on household leverage ratio? International Review of Economics and Finance, 89, 1335–1347. [Google Scholar] [CrossRef]
  77. Malan, S., De Clercq, B., & Meiring, J. (2020). Personal conversion factors influencing debt uptake amongst young households in South Africa. Journal of Economic and Financial Sciences, 13(1), 452. [Google Scholar] [CrossRef]
  78. Mamatzakis, C. M., Ongena, S., & Tsionas, G. M. (2023). The response of household debt to COVID-19 using a neural networks VAR in OECD. Empirical Economics, 65, 65–91. [Google Scholar] [CrossRef]
  79. Maneejuk, P., Teerachai, S., Ratchakit, A., & Yamaka, W. (2021). Analysis of difference in household debt across regions of Thailand. Sustainability, 13, 12253. [Google Scholar] [CrossRef]
  80. Manogna, R. L., & Mishra, K. A. (2022). Determinants of indebtedness and institutional credit to rural agricultural households: An empirical evidence from South India. International Journal of Social Economics, 49(9), 1387–1400. [Google Scholar]
  81. Manole, D. S., Petrescu, C., & Vlada, I. R. (2016). Determinants of household loans. Theoretical and Applied Economics, 4(609), 89–102. [Google Scholar]
  82. Meniago, C., Mukuddem-Petersen, J., Petersen, A. M., & Mongale, P. I. (2013). What causes household debt to increase in South Africa? Economic Modelling, 33, 482–492. [Google Scholar] [CrossRef]
  83. Mian, A., & Sufi, A. (2011). House prices, home equity–based borrowing, and the US household leverage crisis. American Economic Review, 101(5), 2132–2156. [Google Scholar] [CrossRef]
  84. Mishra, K. A., & Bhardwaj, V. (2021). The determinants of access to informal credits in India: An application of quantiles via moments method. Journal of Quantitative Economics, 20, 1–22. [Google Scholar] [CrossRef]
  85. Modigliani, F., & Brumberg, R. (1954). Utility analysis and the consumption function: An interpretation of cross-section data. In K. K. Kurihara (Ed.), Post-keynesian economics. Rutgers University Press. [Google Scholar]
  86. Mohammad, Z., Kamil, M. A. B., & Mazlan, B. R. A. (2021). Causes of household indebtedness: A systematic review. Journal of Tianjin University Science and Technology, 54(12), 53–78. [Google Scholar] [CrossRef]
  87. Moore, L. G., & Stockhammer, E. (2018). The drivers of household indebtedness reconsidered: An empirical evaluation of competing arguments on the macroeconomic determinants of household indebtedness in OECD countries. Journal of Post Keynesian Economics, 41(4), 547–577. [Google Scholar] [CrossRef]
  88. Nagano, M., & Yeom, D. (2014). Another determinant of household leverage: Evidence from Japan’s mortgage loan data. International Review of Finance, 14(1), 105–139. [Google Scholar] [CrossRef]
  89. Nomatye, A., & Phiri, A. (2017). Investigating the macroeconomic determinants of household debt in South Africa (Munich Personal RePEc Archive Paper No. 83303). University Library of Munich. Available online: https://ideas.repec.org/p/pra/mprapa/83303.html (accessed on 5 June 2024).
  90. Okurut, F. N., & Schoombee, A. (2007). Credit market access in Uganda: Evidence from household survey data 1999/2000. South African Journal of Economic and Management Sciences, 10(3), 371–383. [Google Scholar] [CrossRef]
  91. Olivero, M. P., & Dvalishvili, M. (2021). What do fiscal stimulus packages mean for household debt? Contemporary Economic Policy, 41(2), 282–299. [Google Scholar] [CrossRef]
  92. Ottaviani, C., & Vandone, D. (2011). Impulsivity and household indebtedness: Evidence from real life. Journal of Economic Psychology, 32, 754–761. [Google Scholar] [CrossRef]
  93. Paap, R., & Franses, H. P. (2000). A dynamic multinomial probit model for brand choice with different long-run and short-run effects of marketing-mix variables. Journal of Applied Econometrics, 15(6), 717–744. [Google Scholar] [CrossRef]
  94. Padmaja, S. S., & Ali, J. (2019). Correlates of agrarian indebtedness in rural India. Journal of Agribusiness in Developing and Emerging Economies, 9(2), 125–138. [Google Scholar] [CrossRef]
  95. Pan, W. (2023). Household debt in the times of populism. Journal of Economic Behavior and Organization, 205, 202–215. [Google Scholar] [CrossRef]
  96. Pandey, K. G. (2016). Extent, magnitude and determinants of indebtedness among farmers in eastern India: A survey-based study. Indian Journal of Agricultural Economics, 71(4), 450–462. [Google Scholar]
  97. Park, J., & Lee, Y. (2018). Corporate income taxes, corporate debt, and household debt. International Tax and Public Finance, 26, 506–535. [Google Scholar] [CrossRef]
  98. Pastrapa, E., & Apostolopoulos, C. (2015). Estimating determinants of borrowing: Evidence from Greece. Journal of Family Economic Issues, 36, 210–223. [Google Scholar] [CrossRef]
  99. Piovarci, V. (2021). The effect of socio-economic and demographic factors on household indebtedness: Evidence from Slovakia. Economic Review, 50(2), 181–201. [Google Scholar]
  100. Rahman, M., Azma, N., Masud, K. A. M., & Ismail, I. (2020). Determinants of indebtedness: Influence of behavioral and demographic factors. International Journal of Financial Studies, 8(8), 1–14. [Google Scholar] [CrossRef]
  101. Romao, A., & Barradas, R. (2022). Macroeconomic determinants of households’ indebtedness in Portugal: What really matters in the era of financialisation? International Journal of Finance & Economics, 29(1), 383–401. [Google Scholar] [CrossRef]
  102. Runstler, G., Balfoussia, H., Burlon, L., & Buss, G. (2018). Real and financial cycles in EU countries: Stylised facts and modelling implications (European Central Bank Occasional Paper Series No. 205). European Central Bank. Available online: https://www.ecb.europa.eu/pub/pdf/scpops/ecb.op205.en.pdf (accessed on 22 April 2024).
  103. Shang, L., & Saffar, W. (2023). Employment protection and household mortgage debt. Journal of Banking & Finance, 149, 106817. [Google Scholar] [CrossRef]
  104. Sierminska, E. (2014). Indebtedness of households and the cost of debt by household type and income group. European Commission Research Note 10/2014. European Commission. [Google Scholar]
  105. Singh, S., Bhogal, S., & Singh, R. (2014). Magnitude and determinants of indebtedness among farmers in Punjab. Indian Journal of Agricultural Economics, 69(2), 243–256. [Google Scholar]
  106. Smith, H. L., Finke, S. M., & Huston, J. S. (2012). Financial sophistication and housing leverage among older households. Journal of Family Economic Issues, 33, 315–327. [Google Scholar] [CrossRef]
  107. Stockhammer, E. (2015). Rising inequality as a cause of the present crisis. Cambridge Journal of Economics, 39(3), 935–958. [Google Scholar] [CrossRef]
  108. Strzelecka, A., & Zawadzka, D. (2020). Why households borrow money? Socio-economic factors affecting households’ debts: A model approach. European Research Studies Journal, 23(2), 820–839. [Google Scholar] [CrossRef]
  109. Tahir, M. S., & Ahmed, D. A. (2021). Australians’ financial wellbeing and household debt: A panel analysis. Journal of Risk and Financial Management, 14, 513. [Google Scholar] [CrossRef]
  110. Thorat, S. V., Garde, Y., & Arhant, A. (2020). Incidence and determinants of indebtedness of agricultural households in Gujarat. Economic Affairs, 65(2), 249–254. [Google Scholar] [CrossRef]
  111. Tian, G. (2022). Influence of digital finance on household leverage ratio from the perspective of consumption effect and income effect. Sustainability, 14, 16271. [Google Scholar] [CrossRef]
  112. Tseng, Y., & Hsiao, I. (2022). Decomposing the factors influencing household debt: The case of China. Applied Economics, 54(23), 2627–2642. [Google Scholar] [CrossRef]
  113. Turinetti, E., & Zhuang, H. (2011). Exploring determinants of U. S. household debt. The Journal of Applied Business Research, 27(6), 85–92. [Google Scholar] [CrossRef]
  114. Vijverberg, C. C. (2024). Income inequality and household debt: A U.S. state-level spatial analysis. Economic Modelling, 138, 106772. [Google Scholar] [CrossRef]
  115. Walks, A. (2013). Mapping the urban debtcape: The geography of household debt in Canadian cities. Urban Geography, 34(2), 153–187. [Google Scholar] [CrossRef]
  116. Wang, Z., Zhang, D., & Wang, J. (2022). How does digital finance impact the leverage of Chinese households? Applied Economics Letters, 29(6), 555–558. [Google Scholar] [CrossRef]
  117. Wildemauwe, R. I. J., & Sanroman, G. (2022). Household debt and debt to income: The role of business ownership. Quarterly Review of Economics and Finance, 83, 52–68. [Google Scholar] [CrossRef]
  118. Wohlin, C. (2014). Guidelines for snowballing in systematic literature studies and a replication in software engineering. Blekinge Institute of Technology. [Google Scholar] [CrossRef]
  119. Wong, Z. Y., Kusairi, S., & Halim, A. Z. (2023). The nexus between households’ indebtedness and consumption: The role of gender, geographical area and income groups. International Journal of Development Issues, 22(1), 72–90. [Google Scholar] [CrossRef]
  120. Wooldridge, J. M. (2002). Econometric analysis of panel and cross-sectional data. MIT Press. [Google Scholar]
  121. Yahya, C. N., Zaki., B. M., Azid, N. N., Ali, N. F., & Hussain, N. A. (2023). The determinants of household debt in Malaysia. Information Management and Business Review, 15(3), 183–194. [Google Scholar] [CrossRef]
  122. Yao, L., Yi, F., & Cai, Y. (2024). The impact of e-commerce activities on rural household leverage. Applied Economics Letters, 31(5), 461–464. [Google Scholar] [CrossRef]
  123. Yaparatne, Y. M. N. D. K., & Senathissa, W. A. (2021). An empirical analysis to identify the major factors affecting household indebtedness in Sri Lanka. Sri Lanka Journal of Economics, Statistics, and Information Management, 1(1), 55–68. [Google Scholar]
  124. Zain, M. Z., Atory, A. A. N., & Hanafi, A. S. (2019). Determinants of household debt in Malaysia from the year 2010 to 2017. Advances in Business Research International Journal, 5, 91–101. [Google Scholar] [CrossRef]
  125. Zanin, L. (2017). Determinants of the conditional probability that a household has informal loans given liquidity constraints regarding access to credit banking channels. Journal of Behavioral and Experimental Finance, 13, 16–24. [Google Scholar] [CrossRef]
  126. Zhou, S., & Niyitegeka, O. (2023). On the dynamic relationship between household debt and income inequality in South Africa. Journal of Risk and Financial Management, 16, 427. [Google Scholar] [CrossRef]
  127. Zimunya, M. F., & Raboloko, M. (2015). Determinants of household debt in Botswana: 1994–2012. Journal of Economics and Public Finance, 1(1), 14. [Google Scholar] [CrossRef]
  128. Zinman, J. (2015). Household debt: Facts, puzzles, theories, and policies. Annual Review of Economics, 7(1), 251–276. [Google Scholar] [CrossRef]
  129. Zwane, T. T. (2018). Assessing the determinants and effects on non monetary household asset poverty in South Africa [Ph.D. Thesis, University of Johannesburg]. Available online: https://www.uj.ac.za/library/information-resources/e-theses-and-dissertations/ (accessed on 20 October 2024).
Figure 1. PRISMA Flow Diagram.
Economies 13 00076 g001
Figure 2. Number of publications over time.
Economies 13 00076 g002
Figure 3. Methodological Techniques.
Economies 13 00076 g003
Table 1. Screening criteria.
CriteriaEligibilityExclusion
Type of literaturePeer reviewed articles from reputable journals based on empirical data analysed by quantitative methodsBook chapters, dissertations, reports, conference proceedings, and conceptual discussion papers
LanguageEnglishNon-English papers
TimeOpenPapers published after December 2024
Unit of analysisCountry-level and household data or articles on indebtednessIndividual and company indebtedness articles and those that treated over-indebtedness
Table 2. Number of studies per country.
CountryStudiesCountryStudiesCountryStudiesCountryStudiesCountryStudiesCountryStudies
USA16Czechia12Swirtzerland 10Chile6Singapore4Hong Kong2
Spain14Denmark12Korea9Luxembourg6China3Israel2
Belgium14France12Greece9Bulgaria6Luthuania3Argentina2
Sweden14Ireland12Norway8Slovenia6Mexico3Namibia1
Germany14Japan11Slovakia8Latvia5Croatia3Botswana1
Australia13Portugal11South Africa7Brazil5Thailand3Peru1
Italy13Austria11Estonia7Russia5Malta3Taiwan1
Finland13Hungary11Romania7Colombia4Turkey3
Poland12UK11New Zealand7India4Iceland3
Netherlands12Canada10Malaysia7Indonesia4Cyprus3
Table 3. Theories used in research on determinants of household indebtedness.
TheoryFrequency
Life cycle hypothesis19
Permanent income hypothesis5
Rajan hypothesis4
House price hypothesis3
Age structure hypothesis3
Low interest rate hypothesis2
Financial deregulation2
Welfare retrenchment hypothesis2
Post Keynesian and consumption wealth effects2
Expenditure cascade hypothesis1
Hyperbolic effects1
Conspicuous consumption and income inequality1
Irrationality of household financial behaviour1
Expectations1
Rational bubbles1
Confidence of storytelling1
Absolute income hypothesis1
Housing boom hypothesis1
Financial asset hypothesis1
Credit supply hypothesis1
Falling wages hypothesis1
Fixed income theory1
Table 4. Number of studies per country.
Country StudiesCountryStudiesCountryStudiesCountryStudiesCountryStudiesCountryStudies
China9Austria4Malaysia2Pakistan1Ireland1South Africa1
USA9Czechia4Hungary2Indonesia1Uruguay1Singapore1
India8Estonia3Chile2Bulgaria1Latvia1Uganda1
Italy8Slovakia3Finland2Croatia1Lithuania1
Germany5Australia3Slovenia2Romania1New Zealand1
Poland5Denmark3Sri Lanka2Albania1Norway1
Spain5Sweden3Japan2Bosnia 1Thailand1
Belgium4Canada2Korea2North Macedonia1Colombia1
Netherlands4Switzerland2UK1Serbia1Cyprus1
France4Luxembourg2Portugal1Tunisia1Malta1
Disclaimer/Publisher’s Note: The statements, opinions and data contained in all publications are solely those of the individual author(s) and contributor(s) and not of MDPI and/or the editor(s). MDPI and/or the editor(s) disclaim responsibility for any injury to people or property resulting from any ideas, methods, instructions or products referred to in the content.

