Abstract
Transport is among the fastest-growing contributors to carbon dioxide (CO2) emissions in the Gulf Cooperation Council (GCC) region, where rapid urbanization, population growth, and high mobility demand continue to shape energy use. This study aims to quantify the extent to which economic growth and urbanization drive transport-related CO2 emissions across Bahrain, Kuwait, Oman, Qatar, Saudi Arabia, and the United Arab Emirates between 2012 and 2022. Using sector-specific data from the International Energy Agency and World Bank, we apply panel and country-level log–log regression models to estimate long-run and short-run elasticities of transport CO2 emissions with respect to GDP and urban population. The analysis also includes robustness checks excluding the COVID-19 pandemic year to isolate structural effects from temporary shocks. Results show that transport emissions remain strongly correlated with GDP in most countries, indicating emissions-intensive growth, while the influence of urbanization varies: positive in Kuwait and Saudi Arabia, where expansion is car-dependent, and negative in Oman and Qatar, where compact urban forms and transit investments mitigate emissions. The findings highlight the importance of differentiated policy responses—fuel-pricing reform, vehicle efficiency standards, electrification, and transit-oriented planning—to advance low-carbon mobility. By integrating elasticity-based diagnostics with decoupling analysis, this study provides the first harmonized empirical framework for the GCC to assess progress toward transport-sector decarbonization.
1. Introduction
Transport is among the largest and fastest-growing sources of energy-related carbon dioxide (CO2) emissions (Akinyemi & Ramonu, 2019). Over recent decades, rapid motorization, expanding freight activity, and urban growth have made the sector central to national decarbonization strategies (Szczepański et al., 2025). Although many countries have begun to separate, or “decouple,” emissions from economic output, the extent and stability of decoupling in transport varies widely across regions and over time (Foster et al., 2023).
In the Gulf Cooperation Council (GCC), Bahrain, Kuwait, Oman, Qatar, Saudi Arabia, and the United Arab Emirates, transport systems have evolved rapidly alongside high urbanization rates, large infrastructure programs, and shifting energy-price policies (Ramadan, 2015). The GCC is already one of the most urbanized regions in the world, with large shares of people living in a handful of metropolitan areas (Marzouk, 2017). For two decades, everyday mobility in these cities was shaped by cheap fuel and abundant road capacity, which made private cars the default transport option and limited the business case for mass transit (Qadir et al., 2024). That combination is locked in high car ownership, long average trip distances, and rising transport energy use (Al-Thani, 2023).
Since 2015–2016, governments have begun to reform energy prices and phase out parts of fuel subsidies, lifting pump prices closer to international levels (The Official Portal of the UAE Government, 2023; The Peninsula Newspaper, 2016). At the same time, they have launched big public-transport investments, metro and Bus Rapid Transit (BRT) systems, investment in renewable energy solutions (Hassabou et al., 2025) (Melhim & Isaifan, 2025), along with policies to promote electric vehicles (EVs) and charging networks (Yahia et al., 2025). These shifts raise the operating cost of car travel while improving the speed, reliability, and convenience of non-car options (Koimur et al., 2014). Hence, the pricing and infrastructure changes are reshaping travel demand and technology choices: nudging some trips away from private cars, improving the efficiency of remaining road travel, and accelerating the diffusion of cleaner vehicle technologies. Consequently, the policy environment is moving from one that reinforced car dependency to one that supports a gradual decoupling of transport emissions from growth.
A large body of literature investigates whether economic growth can be decoupled from emissions. Results are mixed: some high-income economies exhibit relative or absolute decoupling, whereas many others do not (Foster et al., 2023). For transport specifically, cross-country studies often find positive income–emissions links, but the magnitude of elasticities and their persistence differ by context (Amer et al., 2025). Urbanization can reduce per capita emissions through density and transit viability, or raise them if growth occurs through low-density, car-dependent expansion (Sinha, 2003). In the GCC, empirical work has grown significantly, but is still dominated by economy-wide CO2 studies; fewer papers estimate sector-specific transport elasticities with comparable country-level time series (Binsuwadan, 2024). In addition, despite major investments and policy changes in the GCC, there is no consistent set of country-level estimates that quantify how transport CO2 responds to income and urban population using sector-specific data. Existing publications often use aggregate emissions, mix countries in panels that hide country dynamics, or report associations without an elasticity/decoupling lens.
Against this backdrop, a compact, replicable dashboard of transport-sector elasticities for all six GCC economies (2012–2022) is developed in this work to address a key research gap and to quantify the sensitivity of transport CO2 emissions to changes in income and urban population. Sensitivity is measured using elasticities, the percentage change in emissions associated with a 1% change in a driver, and patterns are compared across countries and over time, with a robustness specification that excludes the exceptional year 2020.
Despite growing interest in the environmental dynamics of Gulf economies, the transport sector remains underexplored in quantitative carbon studies. Most prior GCC analyses have focused on aggregate CO2 emissions, leaving a significant gap in sector-specific evidence, particularly on transport. Furthermore, the few available studies often rely on inconsistent datasets or time spans, limiting comparability across countries and over time. No prior work has produced a harmonized set of transport CO2 elasticities derived from common and validated sources such as the International Energy Agency (IEA) and the World Development Indicators (WDI). Equally important, the dual influence of economic growth and urbanization on transport emissions has rarely been modeled jointly; existing research typically treats them as independent or secondary variables rather than as parallel structural drivers. Finally, empirical understanding of shock sensitivity, especially in relation to the COVID-19 period, remains fragmentary; most Gulf studies omit or understate how short-term disruptions interact with long-run elasticity trends. By addressing these four gaps, this study provides the first integrated, cross-country elasticity assessment that quantifies the simultaneous effects of income and urbanization on transport-related CO2 emissions in the GCC and tests their robustness to pandemic-era fluctuations. Ultimately, our contribution is to produce a consistent, country-level elasticity dashboard with decoupling diagnostics and policy-relevant interpretation for Bahrain, Kuwait, Oman, Qatar, Saudi Arabia, and the UAE (2012–2022).
To guide this analysis, the study addresses the following research questions:
- To what extent are transport-related CO2 emissions in GCC countries driven by economic growth and urbanization during 2012–2022?
- Do patterns of elasticity differ across countries, and can these differences be interpreted as evidence of relative or absolute decoupling?
- How does the exclusion of the COVID-19 pandemic year affect the stability and direction of these elasticities?
- What policy insights can be derived from the observed relationships for achieving low-carbon transport systems in the GCC?
Based on the literature and contextual trends, the following hypotheses are tested:
H1.
Economic growth exerts a positive and elastic influence on transport CO2 emissions across GCC countries (elasticity > 1), indicating emissions-intensive growth.
H2.
The effect of urbanization on transport CO2 emissions is heterogeneous—positive in low-density, car-oriented countries and negative where compact urban form and public transport investments prevail.
H3.
Excluding the pandemic year reduces elasticity magnitudes, reflecting structural rather than shock-driven relationships between economic activity, urbanization, and transport emissions.
2. Literature Review
2.1. Global Transport-Emissions Trends and Context
Across assessment syntheses and agency statistics, transport remains a major and fast-growing source of CO2 (Kaššaj & Peráček, 2024). It was reported that transport directly emitted ~8.9 GtCO2-eq in 2019, 23% of global energy-related CO2, with steady growth since 1990 (Akimoto, 2023; IPCC, 2020). Recent IEA tracking shows energy-related CO2 rose 0.9% in 2022 to 36.8 Gt, with oil-related rebounds (notably aviation) important post-pandemic (IEA, 2023). Within transport, on-road modes dominate the global sectoral CO2 (≈three-quarters), with aviation and shipping forming sizable shares, implying that road policy and technology (efficiency, electrification, modal shift) are central to near-term mitigation (IEA, 2023).
Having established the global context and scale of transport-related CO2 emissions, it is essential to interpret these trends within a conceptual framework that distinguishes between growth-driven emissions and structural improvements in efficiency (Dong et al., 2020). Understanding whether rising transport activity necessarily implies higher emissions, or whether economic expansion can occur with reduced carbon intensity, requires a systematic lens for analyzing the relationship between output and emissions. The next section, therefore, introduces the concept of decoupling, outlines the principal metrics used to quantify it, and situates this study within the broader empirical literature on elasticity-based assessments of transport emissions.
2.2. Decoupling: Concepts, Metrics, and Global Evidence
In climate and energy economics, “decoupling” describes the weakening, or breaking, of the historical link between economic growth and emissions. The most widely used classification is the Tapio framework, which evaluates how emissions change relative to GDP (Tapio, 2005). Under this approach, absolute decoupling is said to occur when the economy expands while emissions decline; relative decoupling refers to cases where emissions still increase but at a slower rate than GDP; and no decoupling (or coupling) describes situations in which emissions grow as fast as, or faster than, the economy (Table 1).

Table 1.
Elasticities from log–log regressions implications.
In practice, decoupling can be diagnosed with several complementary metrics: comparisons of GDP and emissions growth rates (the Tapio lens), declines in CO2 intensity of GDP, and elasticity estimates from log–log models that quantify the percentage change in emissions associated with a one-percent change in economic activity (Tapio, 2005). Applied to the transport sector, these indicators provide a consistent way to judge whether mobility systems are becoming cleaner as economies expand and, in the GCC context, compare progress across countries and policy periods.
Foster et al. (2023) conducted a large cross-country World Bank study (145 countries) where they applied a modified Tapio approach to transport CO2 specifically (Foster et al., 2023). The authors reported that absolute decoupling is rare, relative decoupling occurs in many cases, and progress is closely tied to intensity improvements and policy/structural factors. This underlines why both elasticities (percent responsiveness of CO2 to GDP) and intensity (CO2 per unit GDP) should be tracked together (Foster et al., 2023).
While decoupling frameworks provide a valuable foundation for understanding the macroeconomic relationship between growth and emissions, they do not fully capture the spatial and demographic forces shaping energy demand in the transport sector. Urbanization, in particular, alters mobility patterns, modal choices, and land-use intensity, factors that can either amplify or mitigate transport-related emissions depending on urban form and infrastructure planning. To contextualize the elasticity results within these structural dynamics, the next section reviews the literature linking urban expansion and transport CO2 emissions, emphasizing how Gulf cities’ unique settlement patterns and policy environments influence their decarbonization trajectories.
2.3. Urbanization, Urban Form, and Transport CO2
Urbanization affects transport emissions through density, spatial form, and modal structure. Recent empirical work shows heterogeneity: some contexts see higher density and transit access moderate transport CO2; others see rapid, car-dependent expansion raise it. City-scale analyses document that urban CO2 is rising overall, but the drivers differ by development level (density vs. per capita demand) (Luqman et al., 2023). Several multi-country studies report mixed signs for the urbanization–CO2 link once income and other controls are added, reinforcing the need for sector-specific estimation and careful interpretation (Fan et al., 2023). For the GCC, where urban shares are already high and growing, separating income from urban population effects (partial elasticities) is essential to avoid conflating correlated drivers.
2.4. Evidence from the GCC
Time-series studies for GCC economies (1960s–2010s) often find long-run links among GDP, energy use, and CO2, with causality patterns varying by country. These papers typically use aggregate emissions, not transport-specific series (Magazzino, 2016). Transport-focused analyses are also emerging. Recent GCC work begins to use transport CO2 directly and to examine modal channels (e.g., air transport). Results generally show positive long- and short-run associations between economic activity (and air traffic) and transport CO2, using time-series methods (Aldegheishem, 2024). Country case studies (e.g., Oman) document rising transport shares of national GHG over 2000–2015, underscoring the sector’s growing importance in regional inventories (Charabi et al., 2020). Moreover, in terms of policy context, the UAE deregulated fuel prices in August 2015, moving to monthly price setting linked to global markets; Saudi Arabia has also undertaken fuel-price reforms and studied fuel-demand elasticities to gauge impacts on transport emissions. Such policies can break historical relationships by changing consumption incentives (The Official Portal of the UAE Government, 2023).
While there is a sizeable GCC literature on aggregate emissions and several transport-specific case studies, there are few comparable, country-by-country estimates of transport CO2 elasticities with respect to GDP and urban population using the same data definitions and years.
3. Methods
3.1. Study Design and Scope
This study estimates the responsiveness of transport CO2 emissions to income and urbanization in six GCC countries (2012–2022) through log–log regressions for long-run elasticities and log-growth ratios for short-run elasticities, with robustness checks excluding the 2020 COVID-19 shock.
In addition to the quantitative techniques applied in this study, several general scientific methods were systematically employed to structure the research process in accordance with Kaššaj and Peráček (2024). The analytical method was used to decompose the complex relationship between transport-related CO2 emissions, economic growth, and urbanization into measurable components and variables. The synthetic method then integrated these findings to construct a coherent regional understanding across the GCC, combining national results into a comparative framework. The deductive method guided hypothesis formulation from established economic-environmental theories, whereas the inductive method supported generalization from the observed empirical patterns identified through regression and elasticity estimation. The comparative method was also essential in evaluating differences in elasticity magnitudes and decoupling patterns among GCC countries, allowing the study to highlight structural and policy-based contrasts.
3.2. Data Sources and Construction
Transport CO2 emission data (megatons) were extracted from the International Energy Agency’s CO2 by sector statistics for the Transport sector (International Energy Agency, 2025). However, the GDP (constant 2015 USD), total population, urban population (total), and the urban percentage share data were taken from the World Bank World Development Indicators (World Bank Group, 2025). For each year, the parameters in Table 2 have been defined.
Table 2.
Parameters derived from open-source data used in this research.
Observations with zero/blank values (which invalidate logs) are excluded from regressions, which was the reason why the time window 2012–2022 was chosen for this study.
3.3. Long-Run Elasticity Model
For each country, we estimate the log–log linear model:
lnCO2t = β0 + β1·lnGDPt + β2·lnUrbant + εt.
Here β1 is the partial elasticity of transport CO2 with respect to GDP (holding urban population fixed), and β2 is the partial elasticity with respect to urban population (holding GDP fixed). A value β in (0, 1) indicates relative decoupling; β ≈ 0 indicates weak sensitivity; β < 0 indicates absolute decoupling (emissions fall as the driver rises).
3.4. Estimation Procedure
Parameters are estimated by ordinary least squares (OLS). In the accompanying workbook, the model is implemented with STATA (BE 18 64-bit) and Excel’s LINEST on the filtered country rows as shown in Appendix A. To align coefficient order with labels, predictors are stacked as [lnUrbant, lnGDPt] so the first returned slope corresponds to GDP. We report coefficients (elasticities), standard errors, t-statistics, two-tailed p-values, and R2.
3.5. Short-Run Elasticities
Year-over-year elasticities are computed as ratios of log growth rates. These are descriptive indicators of short-horizon responsiveness and can spike during shocks. They provide high-frequency signals of responsiveness and can flag policy or shock years but are noisier. We summarize them as:
- εYoY > 1 (emissions grow faster than GDP/urban);
- 0< εYoY ≤ 1 (relative decoupling);
- εYoY < 0 (absolute decoupling).
Log transformation was applied to reduce skewness and produce interpretable elasticity coefficients. Given the relatively small sample size for each country (around 10–11 years), formal time-series corrections would lack statistical power; therefore, the analysis emphasizes effect sizes, the stability of coefficients across specifications (including and excluding 2020), and visual inspection of log–log scatter plots with fitted regression lines. Potential multicollinearity between lnGDP and lnUrban was monitored through large standard errors and coefficient instability across specifications, with bivariate fits provided as a robustness check.
Elasticities were jointly interpreted with the evolution of CO2 intensity trends to assess decoupling dynamics. A decline in CO2 per unit of GDP (kg/USD) supports a decoupling narrative even when statistical significance is weak due to small sample size. Based on this diagnostic framework, outcomes were categorized as absolute decoupling (β < 0), relative decoupling (0 < β < 1), proportional growth (β ≈ 1), or emissions-intensive growth (β > 1).
To test the robustness of results, two main model specifications, with and without the year 2020, were estimated. Complementary analyses included bivariate regressions (lnCO2 on lnGDP and lnCO2 on lnUrban), alternative time windows to capture the effect of fuel-price reforms (pre- and post-2015), and rolling seven-year regressions to examine how elasticities evolved over time.
All data transformations and computations, including logs, growth rates, intensities, and elasticity estimates, were formula-based within the shared Excel workbook and supported by STATA output reports (Figure A1 and Figure A2). The “Regressions” sheet in the workbook allows users to replicate country-specific estimates using a dropdown menu for country selection and a toggle to include or exclude 2020, ensuring full transparency and reproducibility of the analysis.
4. Results and Discussions
4.1. Historical Trend of Transport CO2 Emissions and GDP/Capita
Figure 1 shows the historical trend of transport CO2 emissions and GDP/capita in the GCC countries for the period studied (2012–2022).
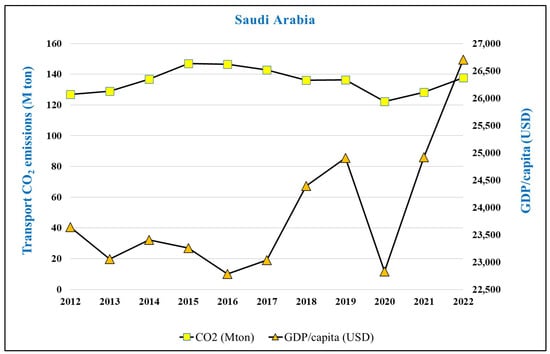
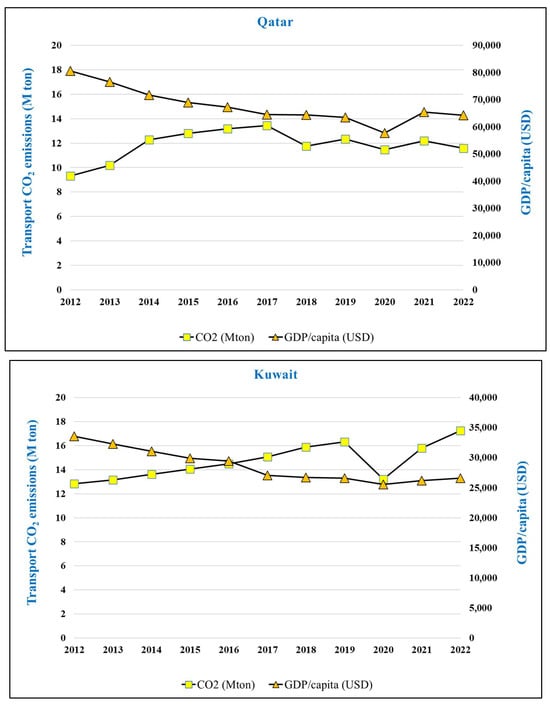
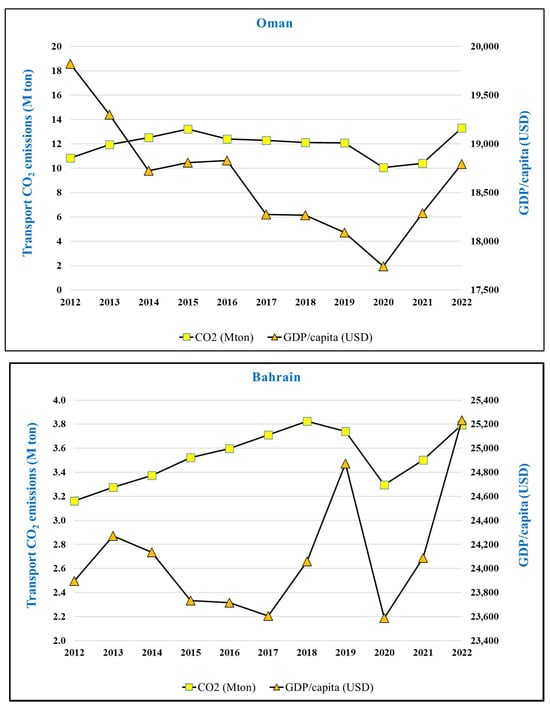
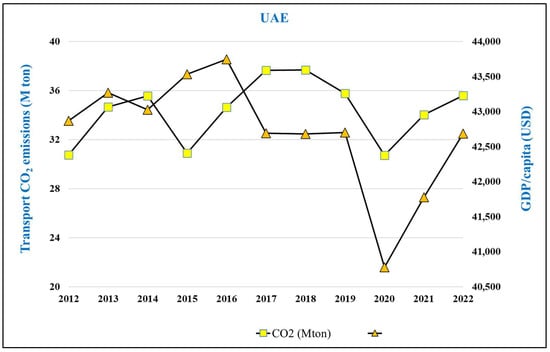
Figure 1.
Historic trend in Transport CO2 emissions and GDP/capita in the GCC countries.
Across the Gulf Cooperation Council (GCC), transport-related carbon dioxide (CO2) emissions have followed distinct yet converging trajectories over the past decade, reflecting each country’s economic structure, energy policy, and progress toward sustainability. While economic growth remains closely tied to hydrocarbon revenues, several GCC economies have shown early signs of decoupling transport emissions from income growth, signaling improved energy efficiency and a gradual transition toward lower-carbon mobility (Hamdi & Sbia, 2013).
In Saudi Arabia, emissions fluctuated between 120 and 145 million tons of CO2 despite substantial changes in GDP per capita, which ranged from USD 26,000 in 2012 to nearly USD 27,000 in 2022. Following an initial rise linked to oil-driven prosperity, emissions stabilized after 2016 as the government began reforming fuel subsidies and promoting diversification under Vision 2030 (Moshashai et al., 2020). This steady emissions profile, combined with rising income levels, indicates progress toward energy-efficient transport and partial decoupling.
Qatar presents an even clearer case of divergence between emissions and income. Transport CO2 emissions grew modestly from about 9 to 13 million tons until 2017, then declined to roughly 11–12 million tons by 2022 amid improvements in vehicle efficiency, cleaner fuels, and expanded public transport. Meanwhile, GDP per capita fell from about USD 85,000 to USD 60,000, reflecting population growth and shifting investment priorities. The opposite movements of income and emissions illustrate successful decoupling, consistent with Qatar’s National Vision 2030 and its emphasis on sustainable mobility.
In Kuwait, emissions climbed steadily from 13 to 17 million tons, while GDP per capita dropped from USD 37,000 to roughly USD 30,000. This pattern reveals persistent carbon intensity and limited progress in transport efficiency. The dominance of private vehicles and slow adoption of low-emission alternatives suggest that Kuwait remains more tightly coupled to fuel consumption than its regional peers, underscoring the need for fuel-pricing reform and public transit investment.
Oman exhibited moderate and relatively balanced trends. Emissions increased slightly from 10 to 13 million tons by 2015, then stabilized near that level through 2022, while GDP per capita declined from nearly USD 19,800 to around USD 19,000. The stability of emissions despite income fluctuations indicates partial decoupling, supported by emerging policies on energy efficiency and public transport expansion.
In Bahrain, emissions remained largely stable, around 3 to 4 million tons, throughout the decade, even as GDP per capita swung sharply with oil market cycles, dipping after 2013 and rising again to roughly USD 25,000 by 2022. The resilience of emissions to economic volatility suggests a more efficient, mature transport sector relative to its size.
Finally, in the United Arab Emirates, transport CO2 emissions rose from 31 to 38 million tons by 2016 but later stabilized at about 35 million tons as the country advanced low-carbon transport and urban planning initiatives. GDP per capita followed a cyclical pattern, peaking near USD 43,500 and recovering to similar levels by 2022. The UAE’s steady emissions despite a strong economic recovery reflect significant decoupling driven by electric mobility, clean fuels, and urban sustainability measures under the UAE Net Zero 2050 strategy.
4.2. GCC Transport-CO2-Emission Elasticities
Figure 2 shows the results of the elasticity analysis for the period 2012–2022. Across the Gulf Cooperation Council, transport CO2 is primarily driven by economic activity. Long-run log–log regressions indicate GDP elasticities above unity in Qatar, Kuwait, Oman, and the United Arab Emirates, implying that a 1% increase in GDP is associated with more than a 1% rise in transport emissions, conditional on urbanization.
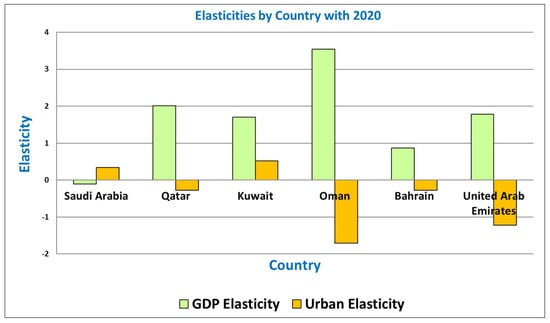
Figure 2.
Comparison of GDP elasticity and urban elasticity across six GCC countries. Green bars represent GDP elasticity, and orange bars represent urban elasticity. Source: The authors.
In Bahrain, the GDP elasticity is close to one, while Saudi Arabia exhibits a near-zero (slightly negative) coefficient with very low explanatory power. Urbanization effects are heterogeneous: they are positive in Kuwait and Saudi Arabia, consistent with car-oriented expansion, and negative in Oman, UAE, Qatar, and Bahrain, a pattern compatible with densification, transit capture, or residual collinearity with income.
As per Table 3, the model fit varies widely, with higher R2 in Kuwait (~0.78), Bahrain (~0.71), and Qatar (~0.65), moderate fit in Oman (~0.59), and modest to weak fit in the UAE (~0.34) and Saudi Arabia (~0.07). In this log–log setting, an elasticity of 1.70, for example, means that a 1% increase in GDP is associated with a 1.7% increase in transport CO2, holding the other regressor constant.
Table 3.
Regression analysis results showing GDP and urban elasticity coefficients and model fit (R2) for six GCC countries.
Country patterns align with these aggregates. Saudi Arabia shows limited explanatory power from aggregate GDP and urbanization, suggesting that sector-specific factors, fuel-price reforms, aviation/freight cycles, and the timing of major infrastructure play a larger role. Qatar displays elastic GDP sensitivity and a small negative urban coefficient with a good overall fit, indicating that growth pressures dominate while urban structure may modestly dampen emissions. Kuwait combines elastic GDP and a positive urban effect, consistent with car-dependent urban growth and a well-explained series. Oman presents a very elastic GDP and a strongly negative urban coefficient; while this could reflect concentration of activity along efficient corridors, it also warrants caution given multicollinearity and the 2020 shock. Bahrain exhibits a near-unit GDP elasticity with a slightly negative urban effect, which may be influenced by compact geography and cross-border traffic. The UAE shows elastic GDP and a negative urban coefficient but only a modest fit, again pointing to omitted sectoral drivers (e.g., aviation, pricing, network roll-outs).
Policy implications follow directly. Where GDP elasticities exceed one, growth-driven pressure will outpace incremental efficiency unless binding measures are adopted: fuel-economy/CO2 standards, accelerated EV uptake with corridor fast-charging, bus electrification, and heavy-duty vehicle efficiency and logistics programs. Where urbanization raises emissions (Kuwait, Saudi Arabia), priority should fall on urban form and pricing, including transit-oriented development, parking, road-space management, and first/last-mile integration. Where urbanization appears emissions-dampening (Oman, UAE, Bahrain, Qatar), investments should consolidate those gains through network quality, access, and land-use coordination. Across the region, freight decarbonization is likely high yield given its large share of transport CO2. Monitoring should be resilient to shocks: excluding 2020, modeling it with a dummy variable, or using multi-year windows, reduces the influence of anomalous years on elasticity (Table 4).
Table 4.
Summary of main transport–CO2 policy priorities by GCC country (2012–2022).
These findings should be interpreted with standard caveats. Samples are short (≈11 years), and GDP and urbanization trend together, which inflate standard errors and can destabilize signs, particularly for the urban coefficient. Sectoral coverage and the mix of road versus aviation/freight can differ across countries, affecting comparability. The estimates describe associations rather than causal effects. Robustness checks (with/without 2020; bivariate fits; intensity and per capita views) and, where data permit, extensions that incorporate fuel prices, vehicle stock composition, transit supply, aviation passengers, and freight activity can strengthen inference and sharpen policy targeting.
4.3. GCC Transport-CO2 Elasticities Emission Excluding 2020
Figure 3 shows the results of the elasticity analysis excluding the year 2020. Removing 2020 yields a cleaner read on structural relationships by minimizing pandemic-driven distortions.
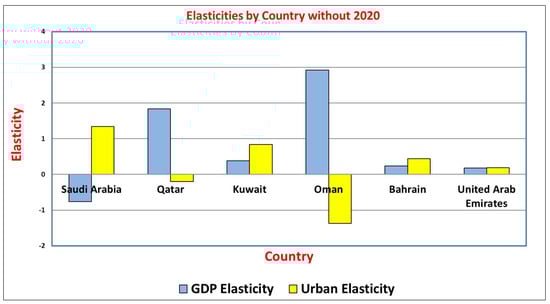
Figure 3.
Comparison of GDP elasticity and urban elasticity across six GCC countries, excluding 2020. Blue bars represent GDP elasticity, and yellow bars represent urban elasticity. Source: The authors.
Two broad patterns emerge. First, GDP elasticities fall in most countries relative to the full sample but remain elastic (>1) in Qatar (~1.83) and Oman (~2.92), indicating that income growth still raises transport CO2 more than proportionally. In Kuwait (~0.38), Bahrain (~0.24), and the UAE (~0.17), GDP becomes inelastic, consistent with relative decoupling. Second, urbanization effects diverge; they are positive in Kuwait (~0.83), Bahrain (~0.44), Saudi Arabia (~1.34), and UAE (~0.19)—consistent with car-oriented expansion—while remaining negative in Oman (~−1.37) and Qatar (~−0.20), suggesting densification or transit capture once income is controlled for. Model fit improves or remains strong in several cases (Kuwait R2 ≈ 0.98; Bahrain 0.86; Qatar 0.65), is moderate in Saudi Arabia (0.59) and Oman (0.39), and remains modest in the UAE (0.30) (all n = 10).
In terms of regression, and as shown in Table 5, country patterns align with these aggregates. Saudi Arabia shows a negative GDP coefficient (−0.76) and a positive urban effect (+1.34) with R2 ≈ 0.59, implying that aggregate macro variables alone do not capture key sector drivers; price reforms, aviation/freight cycles, and fleet composition likely mediate emissions.
Table 5.
Regression analysis, excluding 2020, results showing GDP and urban elasticity coefficients and model fit (R2) for six GCC countries.
Qatar retains a robust, elastic GDP effect (+1.83) and a small negative urban coefficient (−0.20) with R2 ≈ 0.65, indicating growth-driven pressure tempered slightly by urban structure. Kuwait pivots to an urban-dominant profile (GDP +0.38; Urban +0.83) with very high fit (R2 ≈ 0.98), pointing to land-use and modal mix as primary levers. Oman remains GDP-elastic (+2.92) with negative urban (−1.37) but lower fit (R2 ≈ 0.39), suggesting omitted sectoral variables (freight corridors, ports, fuel pricing). Bahrain exhibits inelastic GDP (+0.24) and a positive urban effect (+0.44) with R2 ≈ 0.86, consistent with a compact yet car-reliant setting influenced by cross-border flows. In the UAE, both elasticities shrink toward zero (GDP +0.17; Urban +0.19) and R2 ≈ 0.30, indicating that aggregate GDP/urban proxies under-explain transport CO2 amid aviation cycles, logistics growth, and rapid EV/transit roll-outs.
5. Conclusions and Policy Implications
5.1. Key Findings
The analysis shows that transport CO2 emissions in the GCC remain closely tied to GDP growth. Long-run elasticities indicate that a one percent rise in GDP is associated with more than a one percent increase in transport emissions in Qatar, Oman, Kuwait, and the UAE, even after excluding the 2020 pandemic year, confirming emissions-intensive growth where economic expansion outpaces incremental efficiency gains. Urbanization exerts heterogeneous effects across the region. In Kuwait, Saudi Arabia, Bahrain, and the UAE, the positive elasticities are consistent with car-dependent urban expansion, while the negative elasticities observed in Oman and Qatar suggest either densification benefits or statistical overlap with income. Model performance also varies markedly between countries: Kuwait and Bahrain display high explanatory power, whereas Saudi Arabia and the UAE show weaker fits, pointing to sector-specific drivers such as fuel-price reforms, aviation cycles, and freight activity that macro indicators alone cannot capture. Across the GCC, freight emerges as a major decarbonization priority because freight movements account for a disproportionate share of transport CO2 and therefore offer the highest leverage for emissions reductions.
5.2. Policy Implications
Policy implications follow directly from the elasticities. Where GDP remains elastic (Qatar, Oman), binding measures are required to prevent emissions from outpacing growth: fuel-economy/CO2 standards for light- and heavy-duty vehicles (Harrington & Krupnick, 2012), accelerated EV adoption with corridor fast-charging (Wolbertus & Van den Hoed, 2019), accelerated EV adoption with corridor fast-charging (Chiranjivi et al., 2024), and logistics efficiency programs (Dachkovskyi, 2021). Where urbanization is the main amplifier (Kuwait; also, Bahrain and Saudi Arabia to a degree), urban form and pricing dominate transit-oriented development, BRT/bus network upgrades with first/last-mile access, and parking/road-space management. Where macro elasticities are small (UAE), sector-specific levers—aviation and logistics efficiency, public-fleet electrification, targeted EV codes—are more informative than macro proxies for near-term planning.
These results should be interpreted with standard caveats. Samples are short (n = 10), and lnGDP and lnUrban are highly collinear in several countries, inflating standard errors and occasionally destabilizing signs. The estimates are associational, not causal. Reporting both panels (with and without 2020) or including a 2020, alongside bivariate checks and intensity/per capita trends, provides a transparent and defensible portrayal of elasticity-based decoupling across the GCC.
5.3. Limitations and Future Work
This study’s conclusions should be interpreted with caution because of several limitations. The time series is relatively short at around ten to eleven years, which makes the elasticities sensitive to outliers, structural breaks, and COVID-19 shocks. GDP and urban population also trend together, inflating standard errors and sometimes destabilizing coefficients, particularly for the urban variable. Incorporating additional controls such as fuel prices, vehicle stock composition, transit supply, aviation passengers, and freight volumes would sharpen inference and allow clearer attribution of effects. The estimates presented here describe statistical responsiveness rather than direct causality; future research could employ instrumental-variable approaches, structural models, or panel methods to identify causal channels. Sectoral granularity is another limitation, since aviation, shipping, and road freight are aggregated in some national datasets; disaggregating transport CO2 by mode and energy type would enable more targeted policy recommendations. Finally, rolling or time-varying elasticities and scenario analyses would reveal how fuel-price reforms, electric-vehicle adoption, and infrastructure investments alter elasticities over time, helping policymakers design adaptive strategies that respond to evolving transport and energy systems.
Author Contributions
Conceptualization, S.H.M.; methodology, S.H.M.; software, S.H.M.; validation, S.H.M.; formal analysis, S.H.M.; investigation, S.H.M.; resources, S.H.M.; data curation, S.H.M.; writing—original draft preparation, S.H.M.; writing—review and editing, S.H.M. and R.J.I.; visualization, S.H.M. All authors have read and agreed to the published version of the manuscript.
Funding
This research received no external funding.
Data Availability Statement
All data related to this research is included in this manuscript and the Appendix A and Appendix B.
Conflicts of Interest
The authors declare no conflicts of interest.
Appendix A
Table A1.
STATA Analysis Including 2020.
Table A1.
STATA Analysis Including 2020.
| Country | Year | Transport_co2_Mt | gdp_const_2015_usd | urban_pop_total | urban_pop_pct | pop_total | co2_per_capita_tonnes | co2_per_usd_kg | ln_co2 | ln_gdp | ln_urban_pop | Growth_co2_pct | Growth_gdp_pct | Growth_urban_pct | yoy_elasticity_vs_gdp | yoy_elasticity_vs_urban |
|---|---|---|---|---|---|---|---|---|---|---|---|---|---|---|---|---|
| Saudi Arabia | 2012 | 126.81 | 618,711,129,254 | 21,594,544 | 82.52 | 26,168,861 | 4.85 | 0.20 | 4.84 | 27.15 | 16.89 | |||||
| Saudi Arabia | 2013 | 128.90 | 636,936,502,413 | 22,856,101 | 82.74 | 27,624,004 | 4.67 | 0.20 | 4.86 | 27.18 | 16.94 | 1.64 | 2.90 | 5.68 | 0.56 | 0.29 |
| Saudi Arabia | 2014 | 136.72 | 662,570,908,160 | 23,485,373 | 82.96 | 28,309,273 | 4.83 | 0.21 | 4.92 | 27.22 | 16.97 | 5.89 | 3.95 | 2.72 | 1.49 | 2.17 |
| Saudi Arabia | 2015 | 146.94 | 693,414,400,000 | 24,801,267 | 83.18 | 29,816,382 | 4.93 | 0.21 | 4.99 | 27.26 | 17.03 | 7.21 | 4.55 | 5.45 | 1.58 | 1.32 |
| Saudi Arabia | 2016 | 146.45 | 705,230,699,063 | 25,816,111 | 83.40 | 30,954,198 | 4.73 | 0.21 | 4.99 | 27.28 | 17.07 | −0.33 | 1.69 | 4.01 | −0.20 | −0.08 |
| Saudi Arabia | 2017 | 142.91 | 713,567,089,639 | 25,903,884 | 83.62 | 30,977,355 | 4.61 | 0.20 | 4.96 | 27.29 | 17.07 | −2.45 | 1.18 | 0.34 | −2.08 | −7.21 |
| Saudi Arabia | 2018 | 136.10 | 736,593,549,190 | 25,317,770 | 83.84 | 30,196,281 | 4.51 | 0.18 | 4.91 | 27.33 | 17.05 | −4.88 | 3.18 | −2.29 | −1.54 | 2.13 |
| Saudi Arabia | 2019 | 136.43 | 748,758,860,046 | 25,273,133 | 84.07 | 30,063,799 | 4.54 | 0.18 | 4.92 | 27.34 | 17.05 | 0.24 | 1.64 | −0.18 | 0.15 | −1.36 |
| Saudi Arabia | 2020 | 122.32 | 720,270,347,023 | 26,594,664 | 84.29 | 31,552,510 | 3.88 | 0.17 | 4.81 | 27.30 | 17.10 | −10.92 | −3.88 | 5.10 | 2.81 | −2.14 |
| Saudi Arabia | 2021 | 128.22 | 767,229,070,839 | 26,015,266 | 84.51 | 30,784,383 | 4.17 | 0.17 | 4.85 | 27.37 | 17.07 | 4.71 | 6.32 | −2.20 | 0.75 | −2.14 |
| Saudi Arabia | 2022 | 137.77 | 859,301,066,621 | 27,261,746 | 84.73 | 32,175,224 | 4.28 | 0.16 | 4.93 | 27.48 | 17.12 | |||||
| Qatar | 2012 | 9.30 | 138,866,156,528 | 1,699,995 | 98.70 | 1,722,438 | 5.40 | 0.07 | 2.23 | 25.66 | 14.35 | |||||
| Qatar | 2013 | 10.19 | 146,581,616,624 | 1,893,141 | 98.79 | 1,916,426 | 5.32 | 0.07 | 2.32 | 25.71 | 14.45 | 9.10 | 5.41 | 10.76 | 1.68 | 0.85 |
| Qatar | 2014 | 12.27 | 154,400,753,941 | 2,127,387 | 98.87 | 2,151,745 | 5.70 | 0.08 | 2.51 | 25.76 | 14.57 | 18.56 | 5.20 | 11.67 | 3.57 | 1.59 |
| Qatar | 2015 | 12.79 | 161,739,955,577 | 2,319,822 | 98.95 | 2,344,557 | 5.46 | 0.08 | 2.55 | 25.81 | 14.66 | 4.20 | 4.64 | 8.66 | 0.90 | 0.48 |
| Qatar | 2016 | 13.18 | 166,695,978,169 | 2,452,713 | 99.02 | 2,477,113 | 5.32 | 0.08 | 2.58 | 25.84 | 14.71 | 2.99 | 3.02 | 5.57 | 0.99 | 0.54 |
| Qatar | 2017 | 13.45 | 164,199,531,362 | 2,522,348 | 99.08 | 2,545,820 | 5.28 | 0.08 | 2.60 | 25.82 | 14.74 | 2.04 | −1.51 | 2.80 | −1.35 | 0.73 |
| Qatar | 2018 | 11.76 | 166,227,185,730 | 2,558,411 | 99.14 | 2,580,734 | 4.56 | 0.07 | 2.46 | 25.84 | 14.75 | −13.44 | 1.23 | 1.42 | −10.95 | −9.47 |
| Qatar | 2019 | 12.33 | 167,371,229,300 | 2,617,231 | 99.19 | 2,638,657 | 4.67 | 0.07 | 2.51 | 25.84 | 14.78 | 4.74 | 0.69 | 2.27 | 6.91 | 2.09 |
| Qatar | 2020 | 11.45 | 161,416,823,769 | 2,772,773 | 99.24 | 2,794,148 | 4.10 | 0.07 | 2.44 | 25.81 | 14.84 | −7.39 | −3.62 | 5.77 | 2.04 | −1.28 |
| Qatar | 2021 | 12.18 | 164,042,828,071 | 2,486,825 | 99.28 | 2,504,910 | 4.86 | 0.07 | 2.50 | 25.82 | 14.73 | 6.18 | 1.61 | −10.88 | 3.83 | −0.57 |
| Qatar | 2022 | 11.58 | 170,908,036,354 | 2,639,210 | 99.32 | 2,657,333 | 4.36 | 0.07 | 2.45 | 25.86 | 14.79 | |||||
| Kuwait | 2012 | 12.85 | 112,054,550,828 | 3,337,109 | 100.00 | 3,337,109 | 3.85 | 0.11 | 2.55 | 25.44 | 15.02 | |||||
| Kuwait | 2013 | 13.15 | 113,342,579,056 | 3,507,844 | 100.00 | 3,507,844 | 3.75 | 0.12 | 2.58 | 25.45 | 15.07 | 2.35 | 1.14 | 4.99 | 2.06 | 0.47 |
| Kuwait | 2014 | 13.62 | 113,910,328,740 | 3,665,876 | 100.00 | 3,665,876 | 3.71 | 0.12 | 2.61 | 25.46 | 15.11 | 3.48 | 0.50 | 4.41 | 6.97 | 0.79 |
| Kuwait | 2015 | 14.05 | 114,585,555,831 | 3,834,574 | 100.00 | 3,834,574 | 3.66 | 0.12 | 2.64 | 25.46 | 15.16 | 3.14 | 0.59 | 4.50 | 5.31 | 0.70 |
| Kuwait | 2016 | 14.50 | 117,938,416,139 | 4,004,096 | 100.00 | 4,004,096 | 3.62 | 0.12 | 2.67 | 25.49 | 15.20 | 3.15 | 2.88 | 4.33 | 1.09 | 0.73 |
| Kuwait | 2017 | 15.08 | 112,380,895,320 | 4,154,812 | 100.00 | 4,154,812 | 3.63 | 0.13 | 2.71 | 25.45 | 15.24 | 3.90 | −4.83 | 3.69 | −0.81 | 1.06 |
| Kuwait | 2018 | 15.89 | 115,463,874,741 | 4,323,515 | 100.00 | 4,323,515 | 3.68 | 0.14 | 2.77 | 25.47 | 15.28 | 5.25 | 2.71 | 3.98 | 1.94 | 1.32 |
| Kuwait | 2019 | 16.31 | 118,077,765,457 | 4,442,316 | 100.00 | 4,442,316 | 3.67 | 0.14 | 2.79 | 25.49 | 15.31 | 2.58 | 2.24 | 2.71 | 1.15 | 0.95 |
| Kuwait | 2020 | 13.21 | 112,389,026,890 | 4,400,267 | 100.00 | 4,400,267 | 3.00 | 0.12 | 2.58 | 25.45 | 15.30 | −21.06 | −4.94 | −0.95 | 4.26 | 22.14 |
| Kuwait | 2021 | 15.80 | 114,268,887,222 | 4,360,865 | 100.00 | 4,360,865 | 3.62 | 0.14 | 2.76 | 25.46 | 15.29 | 17.89 | 1.66 | −0.90 | 10.79 | −19.89 |
| Kuwait | 2022 | 17.24 | 121,991,940,847 | 4,589,643 | 100.00 | 4,589,643 | 3.76 | 0.14 | 2.85 | 25.53 | 15.34 | |||||
| Oman | 2012 | 10.84 | 70,318,260,490 | 2,751,277 | 77.56 | 3,547,106 | 3.06 | 0.15 | 2.38 | 24.98 | 14.83 | |||||
| Oman | 2013 | 11.95 | 73,994,291,063 | 3,024,267 | 78.88 | 3,833,913 | 3.12 | 0.16 | 2.48 | 25.03 | 14.92 | 9.72 | 5.10 | 9.46 | 1.91 | 1.03 |
| Oman | 2014 | 12.54 | 74,950,483,987 | 3,207,755 | 80.15 | 4,002,439 | 3.13 | 0.17 | 2.53 | 25.04 | 14.98 | 4.83 | 1.28 | 5.89 | 3.76 | 0.82 |
| Oman | 2015 | 13.21 | 78,710,793,238 | 3,404,412 | 81.35 | 4,184,895 | 3.16 | 0.17 | 2.58 | 25.09 | 15.04 | 5.23 | 4.90 | 5.95 | 1.07 | 0.88 |
| Oman | 2016 | 12.41 | 82,682,873,556 | 3,622,474 | 82.50 | 4,390,877 | 2.83 | 0.15 | 2.52 | 25.14 | 15.10 | −6.24 | 4.92 | 6.21 | −1.27 | −1.00 |
| Oman | 2017 | 12.30 | 82,934,277,089 | 3,791,448 | 83.56 | 4,537,396 | 2.71 | 0.15 | 2.51 | 25.14 | 15.15 | −0.87 | 0.30 | 4.56 | −2.88 | −0.19 |
| Oman | 2018 | 12.14 | 84,001,727,416 | 3,886,999 | 84.54 | 4,597,877 | 2.64 | 0.14 | 2.50 | 25.15 | 15.17 | −1.37 | 1.28 | 2.49 | −1.07 | −0.55 |
| Oman | 2019 | 12.09 | 83,053,651,985 | 3,922,894 | 85.44 | 4,591,241 | 2.63 | 0.15 | 2.49 | 25.14 | 15.18 | −0.38 | −1.14 | 0.92 | 0.33 | −0.41 |
| Oman | 2020 | 10.05 | 80,246,670,661 | 3,901,830 | 86.28 | 4,522,497 | 2.22 | 0.13 | 2.31 | 25.11 | 15.18 | −18.46 | −3.44 | −0.54 | 5.37 | 34.29 |
| Oman | 2021 | 10.41 | 82,318,780,120 | 3,917,349 | 87.04 | 4,500,424 | 2.31 | 0.13 | 2.34 | 25.13 | 15.18 | 3.45 | 2.55 | 0.40 | 1.35 | 8.70 |
| Oman | 2022 | 13.30 | 88,892,516,940 | 4,150,773 | 87.75 | 4,730,226 | 2.81 | 0.15 | 2.59 | 25.21 | 15.24 | |||||
| Bahrain | 2012 | 3.16 | 28,888,050,242 | 1,073,101 | 88.76 | 1,208,964 | 2.61 | 0.11 | 1.15 | 24.09 | 13.89 | |||||
| Bahrain | 2013 | 3.28 | 30,416,985,616 | 1,113,272 | 88.84 | 1,253,191 | 2.61 | 0.11 | 1.19 | 24.14 | 13.92 | 3.57 | 5.16 | 3.68 | 0.69 | 0.97 |
| Bahrain | 2014 | 3.37 | 31,727,610,008 | 1,168,843 | 88.92 | 1,314,562 | 2.57 | 0.11 | 1.22 | 24.18 | 13.97 | 2.95 | 4.22 | 4.87 | 0.70 | 0.61 |
| Bahrain | 2015 | 3.52 | 32,523,297,872 | 1,219,573 | 89.00 | 1,370,322 | 2.57 | 0.11 | 1.26 | 24.21 | 14.01 | 4.29 | 2.48 | 4.25 | 1.73 | 1.01 |
| Bahrain | 2016 | 3.60 | 33,764,059,499 | 1,268,397 | 89.09 | 1,423,726 | 2.53 | 0.11 | 1.28 | 24.24 | 14.05 | 2.16 | 3.74 | 3.93 | 0.58 | 0.55 |
| Bahrain | 2017 | 3.71 | 35,436,675,411 | 1,338,785 | 89.19 | 1,501,116 | 2.47 | 0.10 | 1.31 | 24.29 | 14.11 | 3.04 | 4.84 | 5.40 | 0.63 | 0.56 |
| Bahrain | 2018 | 3.82 | 36,164,044,588 | 1,342,065 | 89.29 | 1,503,091 | 2.54 | 0.11 | 1.34 | 24.31 | 14.11 | 3.03 | 2.03 | 0.24 | 1.49 | 12.37 |
| Bahrain | 2019 | 3.74 | 36,906,448,211 | 1,326,389 | 89.39 | 1,483,756 | 2.52 | 0.10 | 1.32 | 24.33 | 14.10 | −2.22 | 2.03 | −1.17 | −1.09 | 1.89 |
| Bahrain | 2020 | 3.29 | 34,724,774,104 | 1,317,711 | 89.51 | 1,472,204 | 2.24 | 0.09 | 1.19 | 24.27 | 14.09 | −12.70 | −6.09 | −0.66 | 2.08 | 19.35 |
| Bahrain | 2021 | 3.50 | 36,235,315,986 | 1,348,242 | 89.62 | 1,504,365 | 2.33 | 0.10 | 1.25 | 24.31 | 14.11 | 6.12 | 4.26 | 2.29 | 1.44 | 2.67 |
| Bahrain | 2022 | 3.80 | 38,474,716,945 | 1,368,305 | 89.74 | 1,524,693 | 2.49 | 0.10 | 1.33 | 24.37 | 14.13 | |||||
| United Arab Emirates | 2012 | 30.76 | 316,857,313,566 | 6,264,178 | 84.75 | 7,391,448 | 4.16 | 0.10 | 3.43 | 26.48 | 15.65 | |||||
| United Arab Emirates | 2013 | 34.67 | 332,876,224,084 | 6,544,154 | 85.07 | 7,693,031 | 4.51 | 0.10 | 3.55 | 26.53 | 15.69 | 11.97 | 4.93 | 4.37 | 2.43 | 2.74 |
| United Arab Emirates | 2014 | 35.58 | 346,742,821,790 | 6,880,747 | 85.38 | 8,059,440 | 4.41 | 0.10 | 3.57 | 26.57 | 15.74 | 2.58 | 4.08 | 5.02 | 0.63 | 0.51 |
| United Arab Emirates | 2015 | 30.88 | 370,275,469,571 | 7,286,777 | 85.67 | 8,505,237 | 3.63 | 0.08 | 3.43 | 26.64 | 15.80 | −14.16 | 6.57 | 5.73 | −2.16 | −2.47 |
| United Arab Emirates | 2016 | 34.63 | 390,868,305,597 | 7,681,054 | 85.97 | 8,935,095 | 3.88 | 0.09 | 3.54 | 26.69 | 15.85 | 11.46 | 5.41 | 5.27 | 2.12 | 2.17 |
| United Arab Emirates | 2017 | 37.66 | 393,741,456,224 | 7,954,847 | 86.25 | 9,223,225 | 4.08 | 0.10 | 3.63 | 26.70 | 15.89 | 8.39 | 0.73 | 3.50 | 11.46 | 2.40 |
| United Arab Emirates | 2018 | 37.67 | 398,914,879,875 | 8,086,953 | 86.52 | 9,346,701 | 4.03 | 0.09 | 3.63 | 26.71 | 15.91 | 0.02 | 1.31 | 1.65 | 0.02 | 0.01 |
| United Arab Emirates | 2019 | 35.78 | 403,336,245,504 | 8,197,902 | 86.79 | 9,445,785 | 3.79 | 0.09 | 3.58 | 26.72 | 15.92 | −5.15 | 1.10 | 1.36 | −4.67 | −3.78 |
| United Arab Emirates | 2020 | 30.71 | 383,342,656,333 | 8,183,416 | 87.05 | 9,401,038 | 3.27 | 0.08 | 3.42 | 26.67 | 15.92 | −15.28 | −5.08 | −0.18 | 3.00 | 86.38 |
| United Arab Emirates | 2021 | 34.02 | 400,036,290,964 | 8,359,012 | 87.30 | 9,575,152 | 3.55 | 0.09 | 3.53 | 26.71 | 15.94 | 10.24 | 4.26 | 2.12 | 2.40 | 4.82 |
| United Arab Emirates | 2022 | 35.59 | 430,077,804,445 | 8,819,937 | 87.54 | 10,074,977 | 3.53 | 0.08 | 3.57 | 26.79 | 15.99 | 4.50 | 7.24 | 5.37 | 0.62 | 0.84 |


Figure A1.
Stata data analysis of 6 GCC countries including 2020.
Figure A1.
Stata data analysis of 6 GCC countries including 2020.


Appendix B. STATA Analysis Excluding 2020


Figure A2.
Stata data analysis of 6 GCC countries excluding 2020.
Figure A2.
Stata data analysis of 6 GCC countries excluding 2020.


References
- Akimoto, K. (2023). Assessment of road transportation measures for global net-zero emissions considering comprehensive energy systems. IATSS Research, 47(2), 196–203. [Google Scholar] [CrossRef]
- Akinyemi, T. O., & Ramonu, O. J. (2019). Mitigation of CO2 emissions in transportation and industrial processes using renewable energy technologies: A review. European Journal of Engineering and Technology Research, 4(5), 58–66. [Google Scholar] [CrossRef]
- Aldegheishem, A. (2024). The impact of air transportation, trade openness, and economic growth on CO2 emissions in Saudi Arabia. Frontiers in Environmental Science, 12, 1366054. [Google Scholar] [CrossRef]
- Al-Thani, M. (2023). Traffic accident predictive model for better resources in Qatar. Hamad bin Khalifa University. [Google Scholar]
- Amer, E. A. A. A., Xiuwu, Z., Meyad, E. M. A., Alareqi, M. M., Bather, S. M. H., & Abdelwahed, A. (2025). Urbanization, growth, and carbon footprints: A GCC perspective on sustainable development. Sustainable Futures, 9, 100631. [Google Scholar] [CrossRef]
- Binsuwadan, J. (2024). Transport sector emissions and environmental sustainability: Empirical evidence from GCC economies. Sustainability, 16(23), 10760. [Google Scholar] [CrossRef]
- Charabi, Y., Al Nasiri, N., Al Awadhi, T., Choudri, B. S., & Al Bimani, A. (2020). GHG emissions from the transport sector in Oman: Trends and potential decarbonization pathways. Energy Strategy Reviews, 32, 100548. [Google Scholar] [CrossRef]
- Chiranjivi, D. M., Suresh, M. K., & Siddartha, M. M. (2024). Navigating the present and future dynamics of electric vehicle fast charging and its impact on grid. CVR Journal of Science and Technology, 26(1), 68–75. [Google Scholar] [CrossRef]
- Dachkovskyi, V. (2021). Methods of evaluation of efficiency of logistic operations. Social Development and Security, 11(1), 179–196. [Google Scholar] [CrossRef]
- Dong, B., Xu, Y., & Fan, X. (2020). How to achieve a win-win situation between economic growth and carbon emission reduction: Empirical evidence from the perspective of industrial structure upgrading. Environmental Science and Pollution Research, 27(35), 43829–43844. [Google Scholar] [CrossRef]
- Fan, J., Meng, X., Tian, J., Xing, C., Wang, C., & Wood, J. (2023). A review of transportation carbon emissions research using bibliometric analyses. Journal of Traffic and Transportation Engineering (English Edition), 10(5), 878–899. [Google Scholar] [CrossRef]
- Foster, V., Dim, J. U., Vollmer, S., & Zhang, F. (2023). Understanding the challenge of decoupling transport-related CO2 emissions from economic growth in developing countries. World Development Sustainability, 3, 100111. [Google Scholar] [CrossRef]
- Hamdi, H., & Sbia, R. (2013). Dynamic relationships between oil revenues, government spending and economic growth in an oil-dependent economy. Economic Modelling, 35, 118–125. [Google Scholar] [CrossRef]
- Harrington, W., & Krupnick, A. (2012). Improving fuel economy in heavy-duty vehicles (SSRN Scholarly Paper No. 2038842). Social Science Research Network. [CrossRef][Green Version]
- Hassabou, A., Melhim, S. H., & Isaifan, R. J. (2025). Techno-economic analysis and assessment of an innovative solar hybrid photovoltaic thermal collector for transient net zero emissions. Sustainability, 17(18), 8304. [Google Scholar] [CrossRef]
- IEA. (2023). CO2 emissions in 2022. IEA. [Google Scholar]
- International Energy Agency. (2025). Energy statistics data browser—Data tools. Available online: https://www.iea.org/data-and-statistics/data-tools/energy-statistics-data-browser (accessed on 29 August 2025).
- IPCC. (2020). Transport. Available online: https://www.ipcc.ch/report/ar6/wg3/chapter/chapter-10/?utm_source=chatgpt.com (accessed on 29 August 2025).
- Kaššaj, M., & Peráček, T. (2024). Synergies and potential of industry 4.0 and automated vehicles in smart city infrastructure. Applied Sciences, 14(9), 3575. [Google Scholar] [CrossRef]
- Koimur, İ., Kangogo, L. K., & Nyaoga, R. (2014). Assessment of commuter preferences of 14-seater public service vehicles versus alternative modes of public service transport in Nairobi city. Journal of Business Economics and Finance, 3(1), 115–132. [Google Scholar]
- Luqman, M., Rayner, P. J., & Gurney, K. R. (2023). On the impact of urbanisation on CO2 emissions. Npj Urban Sustainability, 3(1), 6. [Google Scholar] [CrossRef]
- Magazzino, C. (2016). The relationship between real GDP, CO2 emissions, and energy use in the GCC countries: A time series approach. Cogent Economics & Finance, 4(1), 1152729. [Google Scholar] [CrossRef]
- Marzouk, O. A. (2017, November 13–14). Benchmarking the trends of urbanization in the gulf cooperation council: Outlook to 2050. 1st National Symposium on Emerging Trends in Engineering and Management (NSETEM’2017) (pp. 1–9), Muscat, Oman. [Google Scholar]
- Melhim, S. H., & Isaifan, R. J. (2025). The energy-economy nexus of advanced air pollution control technologies: Pathways to sustainable development. Energies, 18(9), 2378. [Google Scholar] [CrossRef]
- Moshashai, D., Leber, A. M., & Savage, J. D. (2020). Saudi Arabia plans for its economic future: Vision 2030, the national transformation plan and saudi fiscal reform. British Journal of Middle Eastern Studies, 47(3), 381–401. [Google Scholar] [CrossRef]
- Qadir, S. A., Ali, A., Islam, M. T., & Shahid, M. (2024, November 24–27). Evolution in the GCC: Assessing the progress and prospects of electric vehicle policies. 2024 IEEE Sustainable Power and Energy Conference (iSPEC) (pp. 291–296), Kuching, Malaysia. [Google Scholar] [CrossRef]
- Ramadan, E. (2015). Sustainable urbanization in the arabian gulf region: Problems and challenges. Arts and Social Sciences Journal, 6(2), 1000109. [Google Scholar] [CrossRef]
- Sinha, K. C. (2003). Sustainability and urban public transportation. Journal of Transportation Engineering, 129(4), 331–341. [Google Scholar] [CrossRef]
- Szczepański, E., Żochowska, R., Izdebski, M., & Jacyna, M. (2025). Decision-making problems in urban transport decarbonization strategies: Challenges, tools, and methods. Energies, 18(15), 3970. [Google Scholar] [CrossRef]
- Tapio, P. (2005). Towards a theory of decoupling: Degrees of decoupling in the EU and the case of road traffic in Finland between 1970 and 2001. Transport Policy, 12(2), 137–151. [Google Scholar] [CrossRef]
- The Official Portal of the UAE Government. (2023). Deregulation of fuel prices. Available online: https://u.ae/en/information-and-services/environment-and-energy/water-and-energy/energy-and-fuel-prices/deregulation-of-fuel-prices?utm_source=chatgpt.com (accessed on 29 August 2025).
- The Peninsula Newspaper. (2016, April 26). Qatar to link petrol and diesel prices to global market from May 1. Available online: https://thepeninsulaqatar.com/article/26/04/2016/Qatar-to-link-petrol-and-diesel-prices-to-global-market-from-May-1 (accessed on 29 August 2025).
- Wolbertus, R., & Van den Hoed, R. (2019). Electric vehicle fast charging needs in cities and along corridors. World Electric Vehicle Journal, 10(2), 45. [Google Scholar] [CrossRef]
- World Bank Group. (2025). World development indicators databank. Available online: https://databank.worldbank.org/reports.aspx?source=2&country=WLD (accessed on 29 August 2025).
- Yahia, O., Chohan, A. H., Arar, M., & Awad, J. (2025). Toward sustainable urban mobility: A systematic review of transit-oriented development for the appraisal of dubai metro stations. Smart Cities, 8(1), 21. [Google Scholar] [CrossRef]


Disclaimer/Publisher’s Note: The statements, opinions and data contained in all publications are solely those of the individual author(s) and contributor(s) and not of MDPI and/or the editor(s). MDPI and/or the editor(s) disclaim responsibility for any injury to people or property resulting from any ideas, methods, instructions or products referred to in the content. |
© 2025 by the authors. Licensee MDPI, Basel, Switzerland. This article is an open access article distributed under the terms and conditions of the Creative Commons Attribution (CC BY) license (https://creativecommons.org/licenses/by/4.0/).