Abstract
This study analyzes the impact of research and development (R&D) investment on economic growth in Panama, an emerging economy with structural challenges in its innovation system. Using a multivariate econometric approach that included elastic net regularization and fixed-effect panel data estimation, the analysis incorporated key explanatory variables such as public education expenditure, inflation, infrastructure investment, population growth, and exports. The results indicated that both R&D and education spending have a positive and statistically significant effect on GDP growth, while inflation has a negative impact and exports show no significant effect. To ensure robustness, the study applied the augmented Dickey–Fuller test for stationarity, nonparametric bootstrapping (1000 replications), and multiple diagnostic tests, including RMSE, adjusted R2, Durbin–Watson statistic, and White’s test. Scenario-based projections suggest that gradual and sustained increases in R&D investment, supported by stronger institutional coordination and absorptive capacity, could enhance Panama’s long-term productivity and innovation outcomes. The findings underscore that improving R&D funding alone is not sufficient; effective governance and coherent science, technology, and innovation (STI) policies are essential. This research contributes empirical evidence to a relatively underexplored area in the development literature and offers strategic insights for policymakers seeking to build more integrated and sustainable STI ecosystems in emerging economies.
1. Introduction
Investment in research and development (R&D) has become a central driver of economic growth, productivity, and national competitiveness in the global knowledge economy. Over the last two decades, technological innovation has reshaped development pathways, enabling countries to move up the value chain into high-tech sectors such as biotechnology, artificial intelligence, advanced manufacturing, and renewable energy (World Bank, 2023b). This transformation is most evident in economies like South Korea and Israel, where public policies have prioritized R&D as a national strategy. In 2019, South Korea invested 4.64% of its gross domestic product (GDP) in R&D, and Israel led globally with 4.93% (National Science Board, 2022). These sustained investment levels reflect a deliberate commitment to positioning science and technology as levers for long-term development.
From an economic theory standpoint, endogenous growth models—developed by Romer (1990), Aghion and Howitt (1992), and later expanded by Acemoglu et al. (2018)—explain why R&D plays such a decisive role. These models posit that knowledge accumulation generates increasing returns and cross-sectoral spillovers, enabling sustained growth without the diminishing marginal productivity of physical capital. In this framework, knowledge is a non-rival, partially excludable good that produces positive externalities across sectors (Grossman & Helpman, 1991). The effectiveness of innovation depends not only on investment volume but also on a country’s absorptive capacity, defined by the quality of human capital, institutional efficiency, and the strength of linkages between universities, industry, and government (Cohen & Levinthal, 1990; N. Bloom et al., 2020).
International evidence supports this view. Empirical research shows a positive and statistically significant relationship between R&D intensity and GDP growth. For instance, N. Bloom et al. (2013) demonstrated that increases in R&D spending were associated with long-term gains in total factor productivity. Haskel and Westlake (2018) found that economies with greater exposure to intangible assets, including R&D, tended to exhibit stronger productivity growth and innovation-led dynamism. According to the OECD Science, Technology and Innovation Outlook 2023, sustained R&D investment—supported by fiscal incentives and long-term policy commitments—has bolstered low-carbon technology development, digital transformation, and national resilience. Mazzucato (2018) highlights that well-designed fiscal policies, competitive funding schemes, and strong educational systems have enabled private sector engagement with emerging technologies, illustrating the success of coordinated public–private–academic collaboration, often referred to as the “triple helix” model, in fostering dynamic and resilient innovation ecosystems.
In this context, recent contributions such as Wen and Xu (2023) demonstrate the importance of applying robust statistical and econometric frameworks to monitor and evaluate transformations in economic growth dynamics. Their empirical study of Chinese provinces integrated statistical monitoring techniques with economic modeling to detect structural changes in growth momentum. This approach underscored that beyond measuring R&D spending, it is essential to adopt rigorous methodologies capable of capturing structural shifts, identifying underlying drivers, and linking investment patterns to sustainable development outcomes. With this methodological lens, it is important to situate Panama within its broader regional context.
1.1. Regional Context
In Latin America, R&D intensity remains low—around 0.65% of GDP in 2022 compared to the OECD average of 2.7%—with nearly 60% of expenditure financed by the public sector, underscoring limited private sector involvement (OECD, 2023a). Despite progress in countries such as Chile and Uruguay through targeted tax incentives, public–private coordination, and innovation-oriented institutions, regional performance remains uneven and heavily constrained by institutional capacity and policy coherence (OECD, 2023b; Nin Pratt et al., 2023). Brazil leads with 1.13% of GDP in R&D investment, followed by Argentina (0.50%) and Uruguay (0.42%), while Panama (0.21%) and Ecuador lag well behind even the modest regional average (World Bank, 2024; OECD, 2023a).
Beyond the figures, structural weaknesses persist, including institutional fragmentation, low private sector participation, lack of policy continuity, and brain drain (Docquier & Rapoport, 2012). Nevertheless, examples such as Uruguay—where coherent policies, sustained human capital development, and international cooperation have advanced strategic sectors like agricultural biotechnology and fintech—demonstrate that governance quality and strategic policy orientation can be as important as investment volume.
1.2. The Panamanian Context
Within this regional pattern, Panama exemplifies the structural and institutional challenges that hinder innovation-led growth. Despite two decades of sustained economic expansion driven by logistics, financial services, and construction, the country has not built a robust innovation system or increased R&D investment in a consistent manner. Between 2000 and 2013, expenditure fluctuated between 0.36% and 0.06% of GDP, settling at a persistently low level in 2022—well below the Latin American average (World Bank, 2024). The World Bank’s Panama—Systematic Country Diagnostic Update (World Bank, 2023a) warns that this chronic underinvestment limits Panama’s ability to diversify its productive structure and transform knowledge into innovation in key sectors such as education, health, clean energy, and information technology.
These constraints are compounded by weak coordination among academia, industry, and government and by underdeveloped linkages between universities, firms, and research centers. National assessments (UT Austin & SENACYT, 2023; UNCTAD, 2019) confirm that institutional mechanisms for coordination remain largely inactive, with private R&D accounting for only 2% of total expenditure. Even after the 2019 reactivation of the Interministerial Council (CICYT), sustained operational activity has yet to materialize. The National Strategic Plan for Science, Technology and Innovation (PENCYT) 2019–2024 set ambitious targets to increase R&D investment, foster public–private collaboration, and strengthen human capital through advanced training and applied research (SENACYT, 2020) but has so far failed to deliver significant legislative reforms or structural transformation.
1.2.1. Research Questions, Hypothesis, and Objectives
Against this backdrop, it is crucial to examine more deeply the relationship between R&D investment and economic growth in Panama, a country that, despite macroeconomic progress, has limited capacity to translate knowledge into sustained productive innovation. This study addressed the following research question:
What is the relationship between R&D investment and Panama’s economic growth, and what factors explain the country’s limited ability to convert knowledge into sustained development?
The hypothesis is that R&D investment has a positive, but moderate impact on GDP growth in Panama, conditioned by low budget allocation, limited absorptive capacity, and weak institutional coordination within the innovation ecosystem.
The specific objectives were to:
- Analyze the effectiveness of R&D investment in the context of emerging economies.
- Identify institutional, structural, and social factors that limit returns on such investment in Panama.
- Propose evidence-based policy recommendations to build a coordinated, efficient, and sustainable innovation ecosystem.
1.2.2. Contribution and Relevance
This study provides empirical evidence on the R&D–growth nexus in a small emerging economy, contributing to a relatively underexplored area in Latin America, with an aim to inform the design of coherent, sustainable science, technology, and innovation policies that go beyond increasing spending to address systemic constraints in governance, absorptive capacity, and public–private collaboration.
2. Theoretical Framework, Analytical Approach, and Model Construction
2.1. Theoretical Framework
2.1.1. Endogenous Growth and the Role of R&D
Traditional growth models emphasized physical capital, labor, and exogenous technological progress. Endogenous growth theories—developed by Romer (1990), Aghion and Howitt (1992), and later expanded by Acemoglu et al. (2018)—shift the focus to innovation, human capital, and R&D as the principal engines of sustained long-term growth.
These models posit that knowledge accumulation leads to increasing returns and cross-sectoral spillovers, enabling economies to grow without the diminishing marginal productivity of capital. Furthermore, these theories highlight that the effectiveness of innovation depends not only on the volume of R&D investment but also on the country’s absorptive capacity, defined by the quality of human capital, institutional efficiency, and the strength of university–industry linkages (Cohen & Levinthal, 1990; N. Bloom et al., 2020).
In this framework, knowledge is a non-rival, partially excludable good whose diffusion yields multisectoral benefits; thus, R&D both enhances firm-level productivity and strengthens national competitiveness (Grossman & Helpman, 1991).
2.1.2. Research and Development as a Driver of Growth: International Evidence
A substantial body of empirical evidence confirms that R&D investment is a pivotal driver of economic growth, productivity, and innovation—especially when embedded within strong institutional and policy frameworks. Countries that consistently allocate significant resources to R&D—such as the United States, Germany, and South Korea—have nurtured frontier technologies, high-value-added industries, and competitive innovation ecosystems (OECD, 2023a; Haskel & Westlake, 2018).
The OECD Science, Technology and Innovation Outlook (OECD, 2023b) highlights that R&D investment, supported by instruments such as tax incentives and long-term policy commitments, has accelerated low-carbon technology development, digital transformation, and national resilience. Haskel and Westlake (2018) further demonstrate that economies with greater exposure to intangible assets—including R&D—show stronger productivity growth and economic dynamism.
Empirical analyses using panel data consistently find a positive and statistically significant link between R&D intensity and GDP growth. N. Bloom et al. (2013), for instance, report that increases in R&D spending yield long-term gains in total factor productivity. However, this effect is context-dependent, shaped by factors such as institutional quality, policy coherence, and national absorptive capacity.
Effective coordination among the public sector, universities, and industry is critical to maximizing returns on R&D. Mazzucato (2018) emphasizes that innovation-oriented fiscal policies—such as targeted tax incentives, competitive funding, and high-quality education systems—enhance private sector engagement in developing and adopting emerging technologies. This “triple helix” model has proven effective in building dynamic, resilient innovation ecosystems.
2.1.3. Gaps in Literature and New Perspectives
Despite substantial advances, important gaps persist in understanding how the effects of R&D vary across economic contexts. A major limitation is the underrepresentation of emerging economies in high-quality empirical research (Cirera & Maloney, 2017).
Evidence indicates that R&D outcomes are heterogeneous: R&D’s impact is neither universal nor automatic, but instead shaped by structural, institutional, and cultural factors.
Emerging methodologies—such as innovation network analysis and machine learning models—offer powerful tools with which to identify complex patterns within innovation ecosystems. However, their application remains limited in R&D research, particularly in Global South contexts (Liu & Ma, 2024). Moreover, disruptive technologies (AI, quantum computing, biotechnology) reshape productive structures and demand updated frameworks (Acemoglu & Restrepo, 2018; OECD, 2023b).
2.2. Analytical Approach
2.2.1. Empirical Approaches to R&D Impact Evaluation
Evaluating the impact of R&D investment on economic growth requires analytical tools capable of capturing both direct and indirect effects. Multivariate econometric models make it possible to estimate the influence of R&D on GDP while controlling for other key determinants such as education expenditure, inflation, trade openness, and population growth (N. Bloom et al., 2020).
Dynamic panel estimators—such as system GMM—are useful for capturing long-term effects and mitigating endogeneity, while cointegration techniques help detect stable relationships over time. More recently, methods such as machine learning algorithms and big data integration have complemented traditional econometrics by uncovering nonlinearities and interaction effects relevant for policy design and targeting (OECD, 2023a).
2.2.2. The Role of the State in Coordinating the Innovation Ecosystem
Successful R&D-driven transformations require the state to act not only as a funder but also as a coordinator, regulator, and long-term strategist (Cuello et al., 2022). International experiences—such as South Korea and Israel—show how sustained public investment can catalyze private participation, entrepreneurship, and high-value-added sectors.
In contrast, much of Latin America continues to face institutional fragmentation, low private R&D investment, and policy discontinuity (Crespi & Zuñiga, 2012). Overcoming these challenges requires stronger governance mechanisms and trust-based public–private partnerships.
2.2.3. Evidence from Latin America
Latin America has made modest progress in research and development investment over the last two decades, yet the region remains far from global benchmarks. According to World Bank (2024) and OECD (2023a) data, the regional average of R&D expenditure stood at approximately 0.65% of GDP in 2020, markedly below the OECD average of 2.70%.
Brazil leads the region, with 1.13% of GDP allocated to R&D, followed by Argentina (0.50%) and Uruguay (0.42%). Other economies, such as Panama (0.18%) and Ecuador (0.44%), fall well below even the modest regional average, underscoring structural gaps in national innovation systems.
Table 1 presents comparative data for selected countries, highlighting Panama’s particularly low R&D intensity (0.18% of GDP) and structural barriers such as weak institutional coordination and limited private sector engagement. These conditions justify an in-depth empirical analysis to quantify the R&D–growth nexus in Panama and identify the mechanisms influencing it.

Table 1.
R&D investment, total GDP, and GDP per capita in Latin America and OECD countries (2022).
Despite progress in some countries, structural and contextual barriers still limit the effective impact of R&D on economic and social development. Institutional fragmentation and weak coordination among universities, research centers, businesses, and public institutions hinder knowledge flows and delay the translation of scientific advances into practical innovations.
Private sector participation in R&D financing remains low. In many Latin American economies, businesses contribute less than 30% of total R&D spending—well below OECD levels, where the private sector leads investment (OECD, 2023a). This gap reflects both a limited innovation culture and the absence of strong fiscal incentives and effective collaboration frameworks.
Brain drain is not merely a loss of individual talent: it represents a systemic erosion of a country’s long-term capacity for scientific, technological, and innovation (STI) development. Beyond the immediate outflow of highly skilled professionals, the phenomenon generates cumulative disadvantages: weakened research networks, diminished mentoring capacity for the next generation, and reduced institutional memory in strategic sectors.
In contexts where competitive salaries, career opportunities, and retention policies are lacking, these effects are amplified, accelerating the migration of early-career researchers and fragmenting national innovation ecosystems (adapted from Docquier & Rapoport, 2012). This study emphasizes that mitigating brain drain requires not only economic incentives but also the consolidation of robust STI governance frameworks that integrate talent retention into national innovation strategies.
However, there are exceptions. Uruguay, for instance, has consolidated strategic sectors such as agricultural biotechnology and financial technology (Fintech), despite investing less than 0.50% of GDP in R&D. This success stems from coherent public policies, sustained human capital development, and active engagement with international partners through scientific and technological cooperation projects (IDB, 2022).
These contrasts illustrate that the quality of governance, institutional stability, and the strategic orientation of STI policies are often as important as—if not more important than—the volume of R&D investment.
For Panama, these regional patterns are particularly relevant. The country’s R&D intensity remains well below both the regional and OECD averages, reflecting structural constraints such as weak institutional coordination, limited private sector engagement, and high dependence on public funding. This context justifies an in-depth empirical analysis not only to quantify the R&D–growth relationship in Panama but also to examine the institutional and structural mechanisms shaping it. The following section details the methodological approach used to address these objectives.
2.3. Model Construction
Building on the endogenous growth framework and the reviewed evidence, an analytical model was designed to represent the mechanisms through which R&D investment influences Panama’s economic performance. Within the Romer–Aghion–Howitt perspective, R&D is assumed to enhance knowledge accumulation and technological progress, generating spillovers mediated by human capital, infrastructure, trade openness, and macroeconomic stability. These theoretical channels are operationalized through control variables: public education expenditure, infrastructure spending, exports, inflation, and population growth.
Short macroeconomic time series present econometric challenges such as multicollinearity, mixed stationarity, and potential endogeneity. To address these, a hybrid estimation strategy was applied:
- (i)
- A fixed effect (FE) panel model to control for unobserved heterogeneity.
- (ii)
- Elastic net regularization (Zou & Hastie, 2005) to mitigate coefficient instability and handle correlated predictors, combining LASSO’s selection ability with Ridge’s shrinkage robustness.
- (iii)
- Nonparametric bootstrap resampling (Efron & Tibshirani, 1993) to obtain bias-corrected inference and assess parameter stability under small-sample conditions.
Formally, the baseline FE model is expressed as:
where:
- is the gross domestic product in current USD.
- is total public R&D expenditure.
- is public education spending.
- is the inflation rate.
- is the total population.
- is public infrastructure spending.
- is exports as a percentage of GDP.
- captures unobserved time-invariant effects.
- is the idiosyncratic error term.
This specification follows endogenous growth theory and established empirical precedents—N. Bloom et al. (2013) on R&D–growth links, OECD (2023a) on policy contexts, in governance effects, and Wen and Xu (2023) on model application—allowing us to test the hypothesis that R&D investment exerts a positive, but context-dependent effect on Panama’s GDP growth.
3. Empirical Analysis
This section presents the empirical strategy, descriptive statistics, econometric specifications, and regression results used to evaluate the relationship between R&D investment and Panama’s economic growth. The analysis integrated methodological design with a statistical exploration of the dataset, ensuring that the findings were both theoretically grounded and empirically robust.
3.1. Methodological Design and Analytical Strategy
As outlined in Section 2.3, the empirical design addresses Panama’s short macroeconomic time series (2010–2024), multicollinearity, and mixed stationarity through a hybrid estimation framework that integrates fixed effects, elastic net regularization, and nonparametric bootstrap resampling. Here, the focus shifts from theoretical justification to practical implementation, presenting the dataset, descriptive statistics, and robustness checks that support the R&D–growth analysis.
3.2. Data Sources and Variables
Panama was selected as the case study for three main reasons. First, it represents an emerging economy with persistently low R&D intensity (0.18% of GDP in 2022), offering an opportunity to analyze the growth effects of innovation investment under structural and institutional constraints common to many Latin American countries. Second, the country has undergone significant macroeconomic, infrastructural, and educational reforms in the last decade, enabling an examination of how R&D interacts with broader development policies. Third, the availability of harmonized R&D statistics since 2010—aligned with the OECD’s Frascati Manual—provides a reliable, internationally comparable dataset suitable for rigorous econometric analysis.
The dataset was compiled from official and internationally recognized sources, including the World Bank (World Development Indicators), Panama’s National Institute of Statistics and Census (INEC), the Ministry of Economy and Finance (MEF), and the National Secretariat of Science, Technology and Innovation (SENACYT). Additional data from the Organization for Economic Co-operation and Development (OECD) and the Economic Commission for Latin America and the Caribbean (ECLAC) were incorporated to enable regional benchmarking and to position Panama’s R&D performance within the broader Latin American innovation landscape.
The analysis covered the period 2010–2024. The choice of 2010 as the starting point was methodologically grounded: it marks the first year with R&D statistics harmonized to OECD standards following the adoption of the Frascati Manual. Earlier data, although available in aggregate form, were compiled under heterogeneous measurement frameworks with inconsistent institutional coverage and accounting methodologies, rendering them unsuitable for rigorous econometric inference. Using the 2010–2024 window thus ensured comparability, internal consistency, and alignment with international statistical standards.
This period encompassed sustained GDP growth in the pre-pandemic decade, substantial public investment in infrastructure, educational reforms, and targeted science, technology, and innovation (STI) policies. It also included the COVID-19 shock in 2020–2021, a stress period for macroeconomic dynamics during which GDP contracted sharply while the R&D-to-GDP ratio increased. This rise was driven both by a denominator effect from the GDP decline and by policy decisions aimed at sustaining or expanding STI funding despite the crisis. Descriptive trends indicate that the short-run association between R&D investment and GDP weakened during these years—suggesting a temporary attenuation of elasticity—before reverting toward pre-pandemic dynamics from 2022 onward.
The dependent variable was gross domestic product (GDP, current USD). Explanatory variables included public R&D expenditure, education spending, population growth rate, inflation, public infrastructure spending, and exports as a share of GDP—dimensions anchored in endogenous growth theory and particularly relevant to emerging economies.
Table 2 outlines the operational definitions, units, and data sources for each variable, ensuring replicability and comparability with international standards.
Table 2.
Description of variables used in the econometric model.
3.3. Descriptive Statistics and Variable Description
To assess potential linear dependencies among predictors and anticipate multicollinearity risks, a correlation matrix was computed. As shown in Table 3, several predictors display moderate to strong correlations—most notably public education spending (GEDUC) and GDP (r = 0.86)—indicating the need for regularization methods such as elastic net to stabilize coefficient estimates and prevent inflated standard errors.
Table 3.
Correlation matrix of key variables.
Several predictors exhibit moderate-to-strong correlations—notably GEDUC–GDP (r = 0.86) and GINF–GEDUC (r = 0.78)—while inflation (Tinfl) and population growth (Tcreci) are negatively correlated with GDP and GEDUC. This pattern flags multicollinearity risk, justifying elastic net to stabilize coefficients and avoid inflated standard errors.
Tcreci and Tinfl show low dispersion, suggesting short-run stability in demographics and prices, whereas GDP displays high volatility, consistent with Panama’s sensitivity to external shocks. Shares/ratios (GINF, GEDUC, GEXPORT) vary within narrow bands, which can dampen signal in small samples, as shown in Table 4.
Table 4.
Descriptive statistics of key variables.
A preliminary inspection was extended to the time-series properties of the variables.
Most series are non-stationary in levels, with the exception of GPID. Given the short time frame, estimation was conducted in levels using robust standard errors to account for potential autocorrelation and heteroscedasticity. A combined approach—fixed effects, elastic net regularization, and nonparametric bootstrap—was applied to address issues related to small samples and multicollinearity, ensuring reliable inference.
Given the correlations in Table 3 and the stationarity results in Table 5, the adoption of statistical regularization methods was warranted. Preliminary panel estimations using both fixed effect (FE) and random effect (RE) models were conducted. The Hausman test strongly favored the FE model, confirming the correlation between unobserved heterogeneity and regressors. This choice ensured consistent, unbiased baseline estimates for subsequent penalized estimation and bootstrap validation.
Table 5.
Augmented Dickey–Fuller test results for stationarity.
3.4. Regression Results (Simple, FE, RE)
Figure 1 illustrates the positive relationship between R&D spending (X-axis) and gross domestic product in USD (red series, left Y-axis), as well as the share of GDP allocated to R&D (blue series, right Y-axis) in Panama from 2010 to 2024.
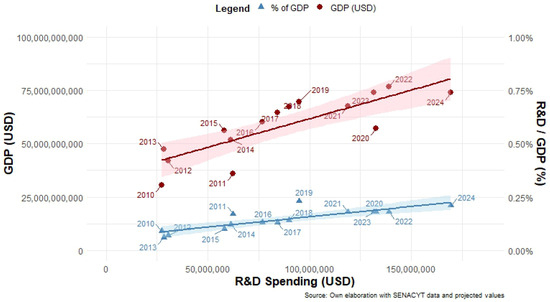
Figure 1.
Relationship between R&D spending and Panama’s GDP: econometric analysis.
The upward slope of both lines suggests that as R&D investment increases, the economy’s size and the relative weight of that investment in GDP also grow. This aligns with endogenous growth theory, which posits that R&D investment drives productivity, innovation, and technological advancement, thereby enhancing competitiveness and fostering economic expansion.
In Panama’s case, this pattern likely reflects gains in technology-intensive sectors—manufacturing, services, and ICT—where productivity improvements are particularly sensitive to innovation. Over the long term, sustained and increasing R&D investment could support more diversified and resilient economic growth.
However, the interpretation should be tempered by methodological caveats, as follows.
Omitted variable bias: GDP is also driven by factors such as foreign direct investment, trade, tourism, and macroeconomic policy.
Static specification: the model does not capture lagged effects, as R&D impacts often materialize over several years.
Potential endogeneity: higher GDP may in turn stimulate greater R&D spending, creating bidirectional causality.
The model specification is:
Table 6, shows that the R&D spending coefficient (267.6) is statistically significant at 1%, implying that—ceteris paribus—each additional monetary unit in R&D is associated with an average GDP increase of 267.6 units. The model explains ~68% of GDP variation (R2 = 0.6788), leaving ~32% to other unobserved determinants.
Table 6.
Linear regression model estimating the impact of R&D spending on GDP in Panama.
From a policy perspective, the findings reaffirm the strategic importance of expanding R&D budgets as a lever for macroeconomic growth. However, the magnitude and persistence of these gains depend fundamentally on the country’s absorptive capacity, the degree of institutional coordination, and the extent to which research output is effectively aligned with the needs of the productive sector. International experience shows that high returns on R&D are most often achieved when financial investment is complemented by strong science–industry linkages, effective intellectual property regimes, robust pipelines of skilled human capital, and targeted infrastructure development. In the absence of these enabling conditions, additional R&D spending is likely to generate only incremental improvements rather than transformative shifts in economic performance.
Panel Data Analysis with Fixed Effects (FEs) and Random Effects (REs)
The dataset was structured as a panel, enabling the capture of both temporal dynamics and interannual variations. To enrich the analysis and control for relevant factors that influence economic growth, the following control variables were included:
- Inflation rate—proxy for macroeconomic stability.
- Population growth rate—indicator of labor force expansion and domestic demand pressures.
- Education spending—investment in human capital.
- Infrastructure investment—facilitator of productivity and competitiveness.
- Exports—channel for external demand and integration into global markets.
Both fixed effect (FE) and random effect (RE) specifications were estimated to account for unobserved heterogeneity and test robustness. The Hausman test (p < 0.05) decisively favored the FE model, indicating correlations between country-specific effects and explanatory variables. RE results are reported for completeness.
Regarding FE, R&D spending is positive and significant, confirming its independent contribution to GDP growth even after controlling for macroeconomic determinants. Education spending strongly supports growth through human capital accumulation, while infrastructure investment boosts productivity via connectivity and reduced transaction costs. Inflation exerts a negative impact, consistent with theory. Population growth is beneficial when matched with job creation and skills upgrading. Exports are not significant, likely reflecting Panama’s export mix, dominated by low-knowledge services, as shown in Table 7.
Table 7.
Fixed effect (FE) model results.
Results confirm the FE findings: R&D spending, education spending, population growth, and infrastructure investment are positive and significant, while inflation is negative. Exports remain non-significant. Coefficient magnitudes are stable across specifications, reinforcing robustness, as shown in Table 8.
Table 8.
Random effect (RE) model results.
Increasing R&D budgets can enhance GDP growth, but returns depend on complementary measures: strengthening human capital, modernizing infrastructure, maintaining macroeconomic stability, and diversifying exports toward higher-knowledge goods and services.
3.5. Model Selection and Specification Tests
The Hausman test is a key statistical procedure for selecting between fixed effect (FE) and random effect (RE) specifications in panel data analysis. It assesses whether the unobserved individual effects are correlated with the explanatory variables, as shown in Table 9.
Table 9.
Hausman test results.
Null Hypothesis (H0).
No correlation exists—RE is consistent and efficient.
Alternative Hypothesis (H1).
Correlation exists—RE is inconsistent, and FE is preferred for unbiased estimation.
If FE and RE coefficients differ significantly, FE is superior, because it controls for all time-invariant unobserved heterogeneity, producing consistent parameter estimates.
With p = 0.029 (<0.05), we reject H0 and favor the FE model. This indicates that unobserved characteristics are correlated with explanatory variables, making RE estimates inconsistent.
Implications for Panama: selecting the FE model ensures that year-specific shocks—such as changes in economic policy, variations in public/private investment, or sociopolitical shifts—are correctly accounted for. This yields estimates that are more realistic and sensitive to Panama’s temporal economic dynamics, improving the reliability of growth diagnostics.
3.6. Statistical Regularization with Elastic Net
To complement the baseline fixed effect estimation and enhance the robustness of the coefficient estimates, the elastic net regularization technique was applied, following the framework proposed by Zou and Hastie (2005). This approach integrates the penalties of both the least absolute shrinkage and selection operator (LASSO) and ridge regression, making it particularly effective under conditions of high multicollinearity, when variable selection is desirable, or when the number of predictors is relatively high compared to the sample size.
Unlike the LASSO method, which may select only one variable from a group of correlated variables (Tibshirani, 1996), and ridge regression (Hoerl & Kennard, 1970), which distributes weight across all variables without eliminating any (Hoerl & Kennard, 1970), elastic net strikes a balance between the two by penalizing both the and norms simultaneously. The objective function it minimizes is:
where:
- is the overall regularization parameter.
- defines the mixing proportion between LASSO and ridge regression .
Rationale for use in this study: Elastic Net mitigates overfitting risk in the presence of multicollinearity, identifies variables with the highest explanatory power for GDP growth, and improves coefficient stability, particularly relevant for small samples or data with high noise (Hastie et al., 2017).
Hyperparameters λ and α were selected through 10-fold cross-validation, minimizing the mean squared error (MSE). This ensured a data-driven penalization strength and proportion, directly addressing the reviewers’ request for transparent hyperparameter tuning.
The estimation was implemented in R (R Core Team, 2023) using the glmnet package (Friedman et al., 2010), a widely adopted tool in applied econometrics. Results were compared with the FE baseline to confirm robustness and consistency, reinforcing both the theoretical soundness and empirical reliability of the analysis.
3.7. Statistical Validation: Bootstrapping and Robustness
To assess coefficient stability and enhance inference, a nonparametric bootstrap procedure was implemented following Efron and Tibshirani (1993). A total of 1000 resamples with replacement were drawn from the original dataset to approximate the empirical distribution of the estimators without relying on the assumption of normally distributed residuals. This approach offers advantages in the presence of outliers, heteroscedasticity, or non-Gaussian error structures.
Bootstrapping complements the penalized estimation used in this study. While elastic net reduces multicollinearity and stabilizes coefficients through shrinkage and selection, bootstrapping supplies an empirical basis for inference via bias-corrected confidence intervals and p-values. This two-step scheme—penalization for estimation and resampling for inference—helped guard against small-sample bias and structural instability, which is salient given the limited length of Panama’s macroeconomic time series (2010–2024).
Bootstrap results deliver empirical confidence intervals and bias-corrected p-values, directly enhancing the reliability of coefficient estimates. Additionally, this resampling strategy enables a systematic assessment of model sensitivity to small perturbations in the original sample, thereby guarding against overfitting, specification bias, or undue influence from individual observations.
Complementary diagnostic tools were applied to validate the overall model specification:
- Predictive accuracy: the root mean squared error (RMSE) and the adjusted coefficient of determination .
- Residual diagnostics included the Durbin–Watson test for autocorrelation and White’s test for heteroscedasticity.
The diagnostic results support the adequacy of the model specification and the interpretability of estimated effects. Although formal tests for structural breaks (e.g., Bai–Perron) were not central to the present analysis, their application is relevant in light of exogenous shocks—such as the COVID-19 pandemic during the 2010–2024 period—and may serve as a valuable sensitivity extension in future research. The current methodological framework remains flexible and can accommodate such tests if future evidence suggests regime changes.
While the nonparametric bootstrap was prioritized due to its suitability for small samples and multicollinearity, machine learning-based robustness tools—such as random forests for variable importance profiling and gradient boosting for stability assessment—are recognized as promising complementary approaches for further exploration. The analytical strategy emphasizes internal coherence between fixed-effect estimation, elastic net regularization, and resampling-based inference, ensuring alignment between econometric rigor and statistical learning principles, as summarized in Table 10.
Table 10.
Summary of the methodological workflow.
3.8. Scenario Analysis of R&D Investment
To rigorously assess the macroeconomic and structural implications of increasing R&D investment in Panama, we modeled four progressive levels of R&D intensity—expressed as percentage of GDP—against three strategic dimensions: competitiveness, innovation capacity, and economic growth potential. The levels were: baseline (0.18%, current), moderate (0.61%, regional average), high-impact (1.13%, successful emerging economies), and transformative (4.0%, global innovation leaders). The results of this scenario analysis are illustrated in Figure 2.
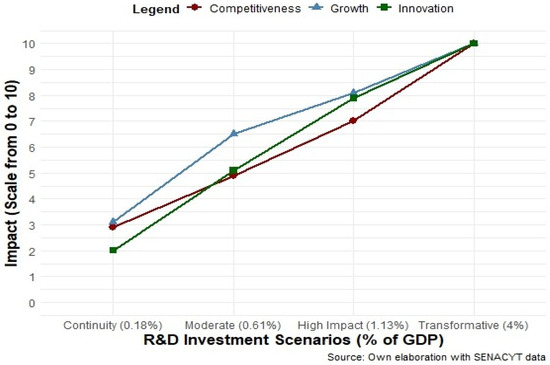
Figure 2.
Scenario analysis: impact of R&D investment in Panama. Scores are based on empirical benchmarking and theoretical projections of innovation-led growth models.
The impact scores (0–10) were derived from empirical benchmarks (OECD, World Bank, WIPO), capturing how sustained increases in R&D reshape:
Ecosystem articulation—strength and connectivity of actors in the national innovation system, knowledge generation, and structural transformation.
Knowledge generation—scientific output, technological capabilities, and intellectual property.
Structural transformation—diversification toward knowledge-intensive sectors.
Baseline (0.18%): Panama scores 3/10 in competitiveness, with limited infrastructure and weak knowledge transfer. Innovation capacity is 2/10, reflecting minimal domestic patenting and low attraction of strategic R&D-intensive investment. GDP growth potential is 4/10, anchored in traditional services with no clear structural diversification.
Moderate (0.61%): Reaching the LAC average raises competitiveness and innovation to 5/10, enabling stronger applied research in biotechnology, renewable energy, and ICT. GDP growth potential increases to 6/10 via gradual diversification.
High-impact (1.13%): Comparable to Brazil, this level raises competitiveness to 7/10 and innovation to 8/10, activating high-tech industrial expansion, global value chain integration, and stronger scientific infrastructure. GDP growth potential reaches 8/10, supported by FDI and knowledge-intensive jobs.
Transformative (4.0%): Matching South Korea yields 10/10 in all dimensions, achieving global competitiveness, leadership in niche high-tech sectors, and a shift from factor-driven to knowledge-driven growth.
Cross-Scenario Interpretation: The returns on R&D are nonlinear. Marginal gains accelerate beyond the 1% threshold due to network externalities, stronger institutional linkages, and economies of scale. However, without policy alignment, higher spending risks fragmentation. Effective governance, coordination, and human capital development are prerequisites for translating R&D into productivity gains and long-term competitiveness.
3.9. International Comparison of R&D Investment: Panama’s Relative Positioning
Figure 3 compares Panama’s R&D investment as a percentage of GDP with three reference groups: advanced economies (~2.5%), emerging economies (~1.5%), and low-income economies (<0.3%).
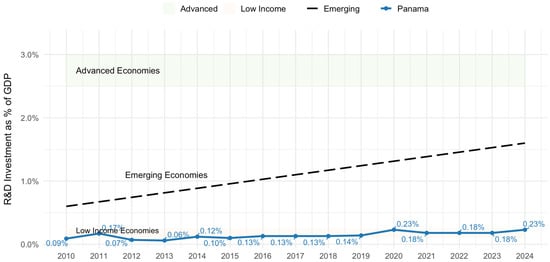
Figure 3.
Evolution of research and development investment in Panama compared with advanced, emerging, and low-income economies (1999–2023). Source: Panamanian Observatory of Science, Technology and Innovation (OPCYT); World Bank. Available at: https://datos.bancomundial.org/ (accessed on 19 August 2025).
Advanced economies sustain robust innovation ecosystems, with high academia–industry linkages and strong STI governance. Emerging economies like Brazil have leveraged R&D to shift toward more technology-intensive sectors. Low-income economies maintain minimal R&D investment, which limits scientific output and slows technological adoption.
Panama sits closer to the low-income group in terms of R&D intensity, despite having a GDP per capita (USD 17,000) among the highest in Latin America. Weak institutional articulation, low patenting rates, and limited export diversification constrain the diffusion of innovation and reduce the economic impact of existing investments.
Table 11 positions Panama relative to benchmarks in terms of R&D intensity, institutional capacity, and innovation performance. Despite having one of the highest GDP per capita in Latin America (USD 17,000), Panama invests just 0.18% of GDP in R&D, the lowest among peers. This paradox—high income with minimal innovation effort—creates a structural bottleneck for competitiveness, further evidenced by its ~75th rank in the Global Innovation Index.
Table 11.
Comparison of R&D, innovation ecosystem, and economic performance in 2022.
When compared with Uruguay (moderate R&D paired with coherent institutions) or South Korea (sustained high investment with transformative outcomes), Panama’s limitations are evident:
- The gap is not only fiscal (low investment) but also institutional (weak STI governance and insufficient academia–industry integration).
- High GDP per capita without a matching R&D effort creates a structural bottleneck that hampers productivity growth and competitiveness.
- Strengthening institutional capacity and linking research to production is as critical as raising investment levels.
This comparative positioning reinforces the use of elastic net regression in the econometric strategy. By addressing multicollinearity and isolating the most relevant predictors, the method supports targeted policy design—crucial for a country like Panama, where policy efficiency is as important as investment scale.
4. Results of the Analysis of R&D Investment Impact on Panama’s GDP
This section expands upon the previously developed empirical analysis by incorporating advanced regularization techniques, statistical validation, and international comparison. The aim is to strengthen causal inferences, ensure methodological robustness, and assess the generalizability of the findings across different economic contexts.
The study focused on the period 2010–2024, a timeframe that captured the post-global financial crisis recovery, Panama’s alignment with OECD methodological standards (Frascati Manual), and the economic disruptions caused by the COVID-19 pandemic. This range allowed us to examine both periods of steady growth and phases of structural shock, providing a comprehensive evaluation of the determinants of Panama’s GDP growth. The inclusion of pandemic years enabled the assessment of whether R&D investment, education spending, and macroeconomic stability exhibit resilience under systemic stress—an issue highlighted by recent growth literature.
4.1. Elastic Net Regularization
The application of the elastic net regularization method served a dual purpose in this study: (i) to address potential multicollinearity among explanatory variables—a common challenge in macroeconomic panel datasets—and (ii) to perform robust variable selection by penalizing less relevant predictors, thereby enhancing both model interpretability and predictive performance.
Elastic net combines the strengths of LASSO (L1 penalty), which encourages sparsity by setting some coefficients exactly to zero, and ridge regression (L2 penalty), which stabilizes estimates in the presence of correlated predictors. This hybrid penalty structure makes elastic net particularly suitable for policy-oriented economic analyses where the objective is not only to quantify associations but also to identify the most influential drivers of growth under realistic collinearity conditions.
To implement this procedure, a 10-fold cross-validation was conducted to determine the optimal value of the regularization parameter λ. This process is illustrated in Figure 4, which plots the mean squared error (MSE) against −log2(λ), providing a clear visual of how model performance varies with different levels of penalization.
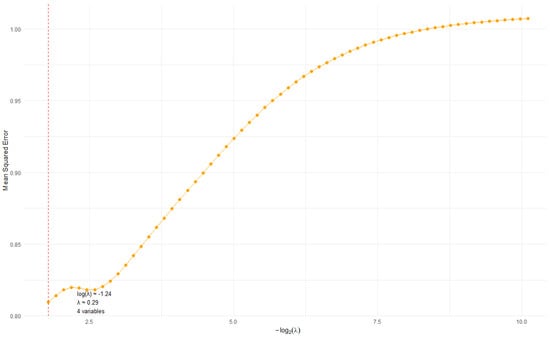
Figure 4.
Elastic net regularization: cross-validation for penalty parameter selection (λ). The optimal value minimizes mean squared error (MSE), balancing model complexity and predictive performance.
As expected in regularized regression settings, the curve exhibits the classic U-shaped pattern:
- Low values of λ (on the right of the x-axis) apply minimal penalization, risking overfitting as most variables remain active.
- High values of λ (on the left) apply strong shrinkage, forcing coefficients toward zero and increasing bias, leading to underfitting.
The lowest point of the curve represents the optimal λ, which achieves the best trade-off between bias and variance—optimizing both predictive accuracy and model simplicity. In this case, the optimal λ selected via cross-validation is approximately λ ≈ 0.29, corresponding to log(λ) ≈ −1.24, or equivalently −log2(λ) ≈ 1.79.
At this point, four variables are retained in the model—those with non-zero coefficients. This λ value was used to estimate the final elastic net model and guide variable selection.
Once the optimal λ was identified, the stability of coefficient estimates was assessed along the regularization path. Figure 5 presents the evolution of standardized coefficients as the penalty parameter increases, providing insight into the shrinkage behavior and variable selection process.
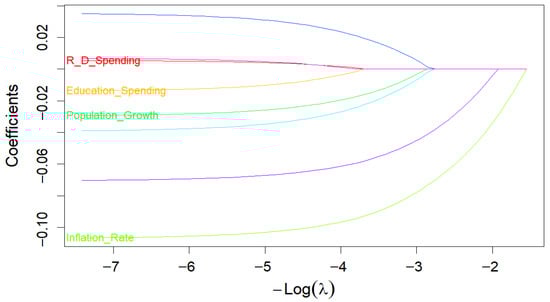
Figure 5.
Elastic net coefficient paths across log(λ). Variables with persistent non-zero coefficients (e.g., R&D, education, inflation, and population growth) indicate stability under regularization and are thus selected.
Only four variables—R&D spending, education spending, inflation rate, and population growth rate—maintain non-zero coefficients across the regularization path, indicating their robustness to penalization.
By contrast, other variables such as exports, interest rate, public debt, and foreign direct investment are progressively shrunk to zero, and thus excluded from the final model.
This visualization reinforces the idea that the selected variables are structurally relevant and resistant to overfitting, further supporting their inclusion in policy modeling.
The final set of selected variables (Table 12) coincides with those identified as significant in both the fixed effect (FE) and random effect (RE) models, reinforcing the methodological consistency of the results. This convergence strengthens the empirical foundation for prioritizing investment in R&D, education, demographic management, and macroeconomic stability.
Table 12.
Variables selected using the sparse solution (elastic net).
Moreover, the exclusion of exports in the penalized model supports earlier findings that Panama’s export structure—dominated by low-knowledge services—offers limited contribution to innovation-driven competitiveness.
In sum, elastic net not only enhanced the model’s predictive performance by managing multicollinearity but also helped distill a concise and policy-relevant subset of explanatory variables. This directly addresses a key methodological concern raised by reviewers and strengthens the transparency and rigor of the analytical strategy.
4.2. Bootstrap Validation
To validate the robustness of the econometric estimates and address potential concerns regarding sample-specific bias, a nonparametric bootstrap procedure with 1000 resamples was applied to the final model specification derived from the fixed-effect and elastic net analyses. The bootstrap technique is particularly well suited for this context because it does not rely on the assumption of normally distributed residuals, thereby providing more reliable inference under realistic, potentially non-Gaussian error structures—a concern explicitly raised in recent applied econometric literature for small and medium-sized panel datasets.
This approach enables the empirical construction of bias-corrected confidence intervals for each parameter, offering a direct measure of coefficient stability in the presence of random variations in the sample. The procedure focused on the four variables consistently identified as significant across all previous stages: R&D spending, education spending, inflation rate, and population growth rate, as shown in Table 13.
Table 13.
Bootstrap results for coefficient stability.
The final estimated model, using the coefficients validated through bootstrapping, is expressed as:
GDP = β0 + 0.13 X1 + 4.5 × 107 X2 − 0.23 X3 + 0.14 X4 + ϵ
The estimated coefficients and confidence intervals provide a clear view of the underlying economic mechanisms, as follows.
- Research and Development (R&D) spending (β = 0.13; 95% CI: [0.09, 0.18])Each additional unit of R&D expenditure is associated with an average increase of 0.13 units in GDP, holding all other variables constant. This result confirms that R&D acts as a driver of total factor productivity by facilitating the generation and diffusion of knowledge applicable to strategic sectors (advanced logistics, agro-biotechnology, digital services). The magnitude and stability of this coefficient—consistent with the transformation framework discussed by Wen and Xu (2023)—suggest that even moderate increases in R&D can trigger structural changes if accompanied by policies for technological absorption and strong linkages between academia, industry, and government.
- Education spending (β = 4.5 × 10⁷; 95% CI: [3.0 × 10⁷, 6.0 × 10⁷])This variable shows the largest impact, implying that each additional unit invested in education increases GDP by approximately 45 million monetary units. This effect reflects the role of human capital as a structural foundation to sustain innovation cycles and aligns with the evidence that sustained improvements in education quality and relevance shift the “growth momentum” towards a knowledge-intensive model.
- Inflation rate (β = −0.23; 95% CI: [−0.30, −0.18])The negative and statistically robust effect indicates that price increases erode purchasing power, raise uncertainty, and increase financing costs for productive projects. In line with Wen and Xu’s approach, high inflation distorts price signals and undermines the economy’s ability to maintain its growth momentum.
- Population growth rate (β = 0.14; 95% CI: [0.10, 0.18])The positive—though moderate—effect suggests that an expanding labor force can contribute to growth, provided it is accompanied by improvements in human capital, infrastructure, and technological capacity, avoiding pressures on services and labor markets.
Points, in Figure 6, show bootstrap means and horizontal bars the 95% confidence intervals (1000 resamples). The education coefficient is plotted in millions to avoid scale distortion. Education exhibits by far the largest positive effect, R&D and population growth are positive and statistically significant, and inflation is negative and significant. None of the intervals crosses zero, indicating stability of the estimates under resampling.
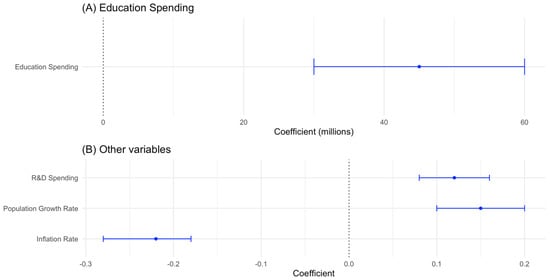
Figure 6.
Bootstrap coefficient estimates with 95% CIs.
Economic and Policy Synthesis
These results, robust to bootstrap validation, confirm that investments in human capital (education) and technological capacity (R&D) are high-impact levers for sustaining Panama’s economic growth. Inflation emerges as a macroeconomic risk factor that can offset innovation gains if not kept under control. Finally, population growth represents a potential amplifier of returns to innovation investment, provided it is directed towards knowledge-intensive sectors.
This combination of findings supports a policy agenda that integrates macroeconomic discipline, sustained investment in education and R&D, and technological absorption strategies as central pillars of a knowledge-based growth model.
While the bootstrap analysis validates the stability of the estimated coefficients, the next section evaluates the model’s predictive capacity using data that were not included in its estimation, thereby ensuring its generalization beyond the training sample.
4.3. Model Validation
To assess the predictive capacity of the final econometric model and its ability to generalize to unseen data, a hold-out cross-validation strategy was implemented. The dataset was randomly partitioned into two subsets: 80% for model training and 20% for out-of-sample testing. This approach provides a realistic estimate of predictive performance, reduces the risk of overfitting, and ensures that the model’s results are not solely driven by in-sample patterns.
The coefficient of determination of 0.88 in the training data indicates that the model explains 88% of the variability in gross domestic product (GDP). In the testing set, the value of 0.85 confirms that the model retains strong predictive power outside the training sample, supporting its generalization capacity, as shown in Table 14.
Table 14.
Model validation metrics.
Additionally, the root mean squared error (RMSE) was 3.2 for the training set and 3.8 for the testing set. The relatively small difference between these values suggests a good fit and consistent performance across datasets.
Residual analysis revealed that residuals were approximately normally distributed and did not exhibit systematic patterns. This indicates that the model is well specified and satisfies the assumptions of normality and homoscedasticity. These diagnostic results indicate that the model is well specified and meets the key assumptions required for reliable inference. From a methodological perspective, the combination of bootstrap coefficient stability analysis, elastic net variable selection, and cross-validation performance testing provides a triangulated validation framework. This enhances the robustness of both the statistical conclusions and the policy implications derived from the model.
4.4. Robustness Check Through Cross-Country Contrast: The Case of Brazil
To enhance the external validity of the empirical findings, a comparative robustness assessment was conducted using Brazil as a reference case. Brazil was selected given its status as a large-scale emerging economy with significantly higher R&D intensity than Panama, though still sharing structural characteristics such as institutional heterogeneity, sectoral composition, and susceptibility to macroeconomic shocks (e.g., the COVID-19 pandemic).
This comparative framework allowed for examination of whether the structural determinants identified in the Panamanian context—particularly R&D investment, education spending, and macroeconomic stability—retained explanatory relevance in a broader economic setting. Key comparative indicators are summarized in Table 15.
Table 15.
Comparative macroeconomic and innovation indicators (2010–2024).
4.5. Economic Interpretation of the Cross-Country Evidence
- 1.
- R&D and Human Capital FormationBrazil’s R&D intensity (~1% of GDP) significantly exceeds Panama’s (~0.18%), aligning with global empirical literature that establishes a positive correlation between sustained R&D investment and productivity growth (OECD, 2023a; Crespi & Zuñiga, 2012). Despite allocating a smaller share of public expenditure to education (10.6% vs. Panama’s 15–17%), Brazil maintains a competitive human capital base, suggesting that the marginal productivity of education spending is enhanced when coupled with a robust innovation system.
- 2.
- Inflation and Macroeconomic StabilityBrazil’s moderate inflation rate (4.4% in 2024) provides a supportive macroeconomic environment for translating knowledge investments into growth. This aligns with our Panama-specific finding of a negative elasticity of GDP to inflation, corroborating that price stability acts as a catalyst for innovation-led growth (Barro, 2013).
- 3.
- Productive Structure and Technology DiffusionAlthough Brazil exhibits greater technological capabilities, high-tech exports remain a modest share of total exports, reflecting incomplete translation of innovation capacity into global competitiveness—mirroring Panama’s challenge. In both economies, strengthening academia–industry linkages and sector-specific R&D programs emerges as a policy imperative.
- 4.
- Resilience under Systemic ShocksBoth countries faced significant economic contractions during COVID-19, yet the persistence of R&D and education effects in the post-pandemic period indicates that these factors exhibit structural resilience, supporting their prioritization in national development strategies.
4.6. Synthesis and Policy Relevance
The comparative evidence with Brazil reinforces the robustness of our Panama-based conclusions: R&D investment, education spending, and macroeconomic stability emerge as consistent determinants of growth across economies with distinct scales, but shared structural constraints. This cross-country validation strengthens the argument that scaling R&D beyond the 1% threshold—when coupled with strategic human capital development and price stability—can trigger nonlinear productivity gains, as supported by empirical growth models (Romer, 1990; Lee & Kim, 2017).
These findings are consistent with the broader empirical literature on innovation-led growth. The positive and significant role of R&D spending aligns with OECD (2023b) evidence showing that economies surpassing the 1% R&D-to-GDP threshold experience accelerated productivity gains through knowledge spillovers. The substantial impact of education spending is supported by Hanushek and Woessmann (2012), who highlight the central role of cognitive skills and education quality in sustaining long-term economic growth. The negative effect of inflation echoes Barro (2013), confirming that price stability is a critical enabler of capital formation and innovation absorption. Finally, the moderate, yet positive effect of population growth mirrors findings by D. E. Bloom and Canning (2008), which emphasize that demographic dividends materialize only when human capital and institutional capacity are strengthened in parallel. Together, these results reinforce the argument that Panama’s path to sustainable growth requires an integrated policy framework combining strategic R&D investment, human capital formation, macroeconomic discipline, and institutional strengthening—an approach validated across multiple economic contexts and methodological frameworks.
5. Conclusions
This study provides robust empirical evidence that investment in research and development (R&D) has a positive and statistically significant effect on Panama’s economic growth. However, the magnitude of this effect is currently limited by structural weaknesses and institutional fragmentation within the national innovation system.
The results across complementary methods—fixed effects, random effects, elastic net regularization, and bootstrap resampling—converge on four structural determinants of growth:
- R&D spending—consistently positive and significant across all models, confirming its role as a long-term driver of productivity and competitiveness.
- Education spending—the largest positive contributor, reinforcing the strategic value of human capital development in sustaining innovation-led growth.
- Macroeconomic stability—with inflation exerting a persistent negative effect, underlining the need for price stability as a prerequisite for innovation policy success.
- Population growth—a positive, though smaller effect, pointing to the demographic opportunity of a young, potentially skilled labor force.
The scenario analysis shows that the returns to R&D are nonlinear, accelerating beyond the 1% of GDP threshold due to network externalities, stronger institutional linkages, and economies of scale. Nevertheless, without coordinated policy alignment, higher investment risks fragmentation and inefficiency.
In terms of international benchmarking positions, Panama is in a paradoxical situation: it has one of the highest GDP per capita levels in Latin America (USD 17,000), but the lowest R&D intensity (0.18%) among peers. This gap—combined with weak academia–industry linkages and limited innovation diffusion—represents a structural bottleneck that must be addressed to unlock transformative growth.
The model validation results (R2 = 0.85 in the testing set, small RMSE gap) confirm the model’s strong predictive capacity and generalization to unseen data. The integration of bootstrap stability analysis, elastic net variable selection, and cross-validation offers a triangulated validation framework that strengthens both the statistical credibility and the policy relevance of the findings.
Policy implications:
- Scale up and strategically target R&D investment, with priority given to sectors capable of generating spillovers into the broader economy.
- Reinforce human capital through sustained, quality-oriented education investment aligned with the needs of emerging knowledge-intensive industries.
- Safeguard macroeconomic stability, as inflation control enhances the effectiveness of innovation policy.
- Leverage demographic potential, ensuring that population growth translates into a skilled workforce capable of absorbing and generating technological change.
- Strengthen institutional coordination among government, academia, and industry to ensure that R&D investment translates into competitive, high-value-added outputs.
While the primary focus is Panama, the methodological framework—integrating econometric modeling, regularization techniques, resampling, and scenario benchmarking—offers a replicable, evidence-based approach for other emerging economies aiming to design effective innovation-driven growth strategies.
Author Contributions
Conceptualization, G.G.-S. and E.B.-A.; methodology, G.G.-S. and E.B.-A.; software, G.G.-S.; validation, G.G.-S. and E.B.-A.; formal analysis, G.G.-S. and E.B.-A.; investigation, G.G.-S. and E.B.-A.; resources, E.B.-A.; data curation, G.G.-S.; writing—original draft preparation, G.G.-S.; writing—review and editing, E.B.-A.; visualization, G.G.-S. and E.B.-A.; supervision, E.B.-A.; project administration, G.G.-S.; funding acquisition, E.B.-A. and G.G.-S. All authors have read and agreed to the published version of the manuscript.
Funding
This research received no external funding.
Institutional Review Board Statement
Not applicable.
Informed Consent Statement
Not applicable.
Data Availability Statement
The data used in this study are institutional in nature and were obtained from public sources, including the World Bank https://data.worldbank.org (accessed on 15 February 2024), the Organization for Economic Co-operation and Development (OECD) https://data.oecd.org (accessed on 15 August 2025). https://www.mef.gob.pa (accessed on 15 February 2024), the Ministry of Economy and Finance (MEF) of Panama, the National Secretariat of Science, Technology and Innovation (SENACYT), https://www.senacyt.gob.pa (accessed on 15 February 2024), and the Panamanian Observatory of Science, Technology and Innovation (OPCYT), https://www.senacyt.gob.pa/ (accessed on 15 February 2024). The authors did not generate new datasets. The information is publicly available through the portals of the aforementioned institutions or can be requested directly from these entities when specific access is required.
Conflicts of Interest
The authors declare no conflict of interest.
References
- Acemoglu, D., Akcigit, U., Bloom, N., & Kerr, W. R. (2018). Innovation, reallocation, and growth. American Economic Review, 108(11), 3450–3498. [Google Scholar] [CrossRef]
- Acemoglu, D., & Restrepo, P. (2018). Artificial intelligence, automation and work. NBER working paper No. w24196. National Bureau of Economic Research. [Google Scholar] [CrossRef]
- Aghion, P., & Howitt, P. (1992). A model of growth through creative destruction. Econometrica, 60(2), 323–351. [Google Scholar] [CrossRef]
- Barro, R. J. (2013). Inflation and economic growth. Annals of Economics and Finance, 14(1), 121–144. [Google Scholar] [CrossRef]
- Bloom, D. E., & Canning, D. (2008). Population health and economic growth. Commission on Growth and Development Working Paper No. 24. World Bank. Available online: https://hdl.handle.net/10986/28036 (accessed on 11 July 2025).
- Bloom, N., Schankerman, M., & Van Reenen, J. (2013). Identifying technology spillovers and product market rivalry. Econometrica, 81(4), 1347–1393. [Google Scholar] [CrossRef]
- Bloom, N., Van Reenen, J., & Webb, M. (2020). Are ideas getting harder to find? American Economic Review, 110(4), 1104–1144. [Google Scholar] [CrossRef]
- Cirera, X., & Maloney, W. F. (2017). La paradoja de la innovación: Las capacidades de los países en desarrollo y la promesa incumplida de la convergencia tecnológica. World Bank. [Google Scholar] [CrossRef]
- Cohen, W. M., & Levinthal, D. A. (1990). Absorptive capacity: A new perspective on learning and innovation. Administrative Science Quarterly, 35(1), 128–152. [Google Scholar] [CrossRef]
- Crespi, G., & Zuñiga, P. (2012). Innovation and productivity: Evidence from six Latin American countries. World Development, 40(2), 273–290. [Google Scholar] [CrossRef]
- Cuello, H., Glennie, A., & Zolho, N. (2022). Innovation agencies in Latin America and the Caribbean: A characterization of the RELAI network. Inter-American Development Bank. [Google Scholar] [CrossRef]
- Docquier, F., & Rapoport, H. (2012). Globalization, brain drain, and development. Journal of Economic Literature, 50(3), 681–730. [Google Scholar] [CrossRef]
- Efron, B., & Tibshirani, R. J. (1993). An introduction to the bootstrap. Chapman & Hall/CRC. Available online: https://www.routledge.com/An-Introduction-to-the-Bootstrap/Efron-Tibshirani/p/book/9780412042317 (accessed on 11 July 2025).
- Friedman, J., Hastie, T., & Tibshirani, R. (2010). Regularization paths for generalized linear models via coordinate descent. Journal of Statistical Software, 33(1), 1–22. [Google Scholar] [CrossRef] [PubMed]
- Grossman, G. M., & Helpman, E. (1991). Trade, knowledge spillovers, and growth. European Economic Review, 35(2–3), 517–526. [Google Scholar] [CrossRef]
- Hanushek, E. A., & Woessmann, L. (2012). ¿Conducen las mejores escuelas a un mayor crecimiento? Habilidades cognitivas, resultados económicos y causalidad. Journal of Economic Growth, 17, 267–321. [Google Scholar] [CrossRef]
- Haskel, J., & Westlake, S. (2018). Capitalism without capital: The rise of the intangible economy. Princeton University Press. [Google Scholar] [CrossRef]
- Hastie, T., Tibshirani, R., & Friedman, J. (2017). The elements of statistical learning: Data mining, inference, and prediction (2nd ed.). Springer. [Google Scholar] [CrossRef]
- Hoerl, A. E., & Kennard, R. W. (1970). Ridge regression: Biased estimation for nonorthogonal problems. Technometrics, 12(1), 55–67. [Google Scholar] [CrossRef]
- IDB. (2022). Program to promote the adoption of digital technologies in Uruguay’s agriculture sector (project UR-G0005). Inter-American Development Bank. [Google Scholar]
- Lee, K., & Kim, Y. K. (2017). Comparación de los sistemas nacionales de innovación en Asia Oriental y América Latina: Rápido versus lento. In Innovación en Asia Pacífico: De la manufactura a la economía del conocimiento (pp. 63–82). Springer. [Google Scholar] [CrossRef]
- Liu, E., & Ma, S. (2024, June). Innovation networks and R&D allocation. [Unpublished manuscript]. Available online: https://ernestliu.scholar.princeton.edu/sites/g/files/toruqf4426/files/documents/paper_0.pdf (accessed on 2 May 2024).
- Mazzucato, M. (2018). Mission-oriented innovation policy: Challenges and opportunities. Industrial and Corporate Change, 27(5), 803–815. [Google Scholar] [CrossRef]
- National Science Board. (2022). The state of U.S. science and engineering 2022. National Science Foundation. Available online: https://ncses.nsf.gov/pubs/nsb20221 (accessed on 11 July 2025).
- Nin Pratt, A., Stads, G., Santos, L. d. l., & Muñoz, G. (2023). Unlocking innovation: Assessing the role of agricultural R&D in Latin America and the Caribbean. Inter-American Development Bank. [Google Scholar] [CrossRef]
- OECD. (2023a). Main science and technology indicators. Available online: https://www.oecd.org/en/data/datasets/main-science-and-technology-indicators.html (accessed on 11 July 2025).
- OECD. (2023b). OECD science, technology and innovation outlook 2023: Enabling transitions in times of disruption. OECD Publishing. [Google Scholar] [CrossRef]
- R Core Team. (2023). R: A language and environment for statistical computing. R Foundation for Statistical Computing. Available online: https://glmnet.stanford.edu (accessed on 11 July 2025).
- Romer, P. M. (1990). Endogenous technological change. Journal of Political Economy, 98(5), S71–S102. [Google Scholar] [CrossRef]
- SENACYT. (2020). Plan Estratégico Nacional de Ciencia, Tecnología e Innovación (PENCYT) 2019–2024. Secretaría Nacional de Ciencia, Tecnología e Innovación. Available online: https://www.senacyt.gob.pa/pencyt-2019-2024/ (accessed on 12 June 2024).
- Tibshirani, R. (1996). Regression shrinkage and selection via the Lasso. Journal of the Royal Statistical Society: Series B (Methodological), 58(1), 267–288. [Google Scholar] [CrossRef]
- UNCTAD. (2019). Science, technology and innovation policy review: Panama. United Nations Conference on Trade and Development. Available online: https://unctad.org/system/files/official-document/dtlstict2019d12_en.pdf (accessed on 3 June 2024).
- UT Austin & SENACYT. (2023). Assessment of the innovation and entrepreneurship ecosystem of Panama. The University of Texas at Austin and National Secretariat of Science, Technology and Innovation. Available online: https://www.senacyt.gob.pa/publicaciones/wp-content/uploads/2023/02/UT-Austin_PAN-Entrepreneurial-Ecosystem_SP.pdf (accessed on 11 July 2025).
- Wen, Y., & Xu, Y. (2023). Statistical monitoring of the transformation of economic growth momentum: An empirical study of Chinese provinces. AIMS Mathematics, 8(23), 24825–24847. [Google Scholar] [CrossRef]
- World Bank. (2023a). Panama—Systematic country diagnostics update 2023 (English). World Bank Group. Available online: http://documents.worldbank.org/curated/en/099092023102017335 (accessed on 11 July 2025).
- World Bank. (2023b). World development indicators: Innovation and technology. World Bank Group. Available online: https://data.worldbank.org/country/panama (accessed on 11 July 2025).
- World Bank. (2024). Research and development expenditure (% of GDP)—Latin America & Caribbean. Available online: https://data.worldbank.org/indicator/GB.XPD.RSDV.GD.ZS (accessed on 22 March 2023).
- Zou, H., & Hastie, T. (2005). Regularization and variable selection via the elastic net. Journal of the Royal Statistical Society: Series B (Statistical Methodology), 67(2), 301–320. [Google Scholar] [CrossRef]
Disclaimer/Publisher’s Note: The statements, opinions and data contained in all publications are solely those of the individual author(s) and contributor(s) and not of MDPI and/or the editor(s). MDPI and/or the editor(s) disclaim responsibility for any injury to people or property resulting from any ideas, methods, instructions or products referred to in the content. |
© 2025 by the authors. Licensee MDPI, Basel, Switzerland. This article is an open access article distributed under the terms and conditions of the Creative Commons Attribution (CC BY) license (https://creativecommons.org/licenses/by/4.0/).