Article

Servicification in Global Value Chains in Emerging and Developing Asian Economies

Strategic Research Center, Saitama University, 255 Shimo-Okubo Sakura-Ku, Saitama 338-8570, Japan
*
Author to whom correspondence should be addressed.
Economies 2024, 12(6), 125; https://doi.org/10.3390/economies12060125
Submission received: 28 March 2024 / Revised: 25 April 2024 / Accepted: 15 May 2024 / Published: 21 May 2024
(This article belongs to the Special Issue The Asian Economy: Constraints and Opportunities)

Abstract

:
Servicification in global value chains (GVCs) in emerging and developing Asian economies has become a trend recently. However, there have been no scientific studies to elucidate the mechanism of servicification in GVCs. To fill this gap, this study aims to investigate the involvement of service sectors in GVCs in Asian economies in terms of the quantitative interactions between service inputs and manufacturing exports and inputs and between service inputs and service exports. For this purpose, a panel vector-autoregressive model and the Trade in Value Added database of the Organization for Economic Cooperation and Development (OECD) were used for the empirical analysis during 1995–2018. The estimation results find that, first, there exist reciprocal interactions between the business services and manufacturing sectors; foreign business service inputs are induced by manufacturing exports, whereas manufacturing inputs are induced by business service exports. Second, foreign manufacturing inputs facilitate foreign business service inputs. Third, business service inputs are promoted by business service exports. These trends in the involvement of business services’ involvement in GVCs have accelerated since the mid-2000s. To enhance the role of services in GVCs, Asian economies should facilitate the removal of explicit restrictions in service trade and address regulatory divergence across countries.

1. Introduction

Global value chains (GVCs) have been a remarkable trend in world economic activities over the past decades, becoming a great concern for policymakers and academics. GVCs were initially conceptualized by Koopman et al. (2014) in their study on tracing value-added by country in global production chains and measuring vertical specialization in international trade. Empirical studies have intensified since Koopman et al. (2014) provided an analytical framework for GVCs.
GVCs have experienced two kinds of structural changes in recent decades, namely, “slowbalization” and “servicification”. Slowbalization means that GVC activities were slowed in the wake of the global financial crisis of 2008–2009, and since then, the pace of globalization, including the GVCs trend, has noticeably slowed (e.g., World Bank 2020; Alvarez et al. 2021). Servicification represents a more intensive involvement of service sectors in the GVCs processes. The modality of servicification in the GVCs is described by Nano and Stolzenburg (2021) in the following two ways: (1) service sectors are involved in GVCs to support manufacturing as the inevitable inputs of manufacturing production and exports (servicification in manufacturing) and (2) service sectors increasingly form their own GVCs because the “production” processes of certain services allow for fragmentation similar to that in manufacturing sectors (GVCs within service sectors).
Multiple studies have found that the share of services in value-added trade is both large (significantly larger than the share of services in gross trade) and increasing. The background of the increased presence of service sectors in GVCs is that the inclusion of services, such as information and communication technology services and professional business services in GVCs, have enabled firms to perform better and invest in new business opportunities for better production technologies (Heuser and Mattoo 2017). COVID-19 may have accelerated the involvement of services in GVCs because the growth of global e-commerce trade accelerated during the COVID-19 pandemic (WTO 2021).
The GVCs’ analyses have so far concentrated on the scope within the manufacturing sectors (Kimura 2006), and the empirical studies of servicification in GVCs have just started by mainly showing the increased presence of service sectors in GVCs. There have been no scientific studies to deeply elucidate the mechanism of servicification in GVCs in terms of “servicification of manufacturing” and “GVCs within service sectors” presented by Nano and Stolzenburg (2021). The motivation of this study is to fill this missing gap in the research on the mechanism of servicification in GVCs.
The purpose of this study is to clarify the involvement of service sectors in GVCs from the following two perspectives: “servicification of manufacturing” by quantifying the interactions between service inputs and manufacturing exports and inputs, and “GVCs within service sectors” by quantifying the interactions between service inputs and service exports. This study proposes the following two hypotheses in line with the two perspectives aligning with this study’s purpose: (1) to determine whether manufacturing exports have induced business service inputs, including information technology (IT) and professional service inputs, to enhance business performances and (2) whether business service exports themselves have facilitated business service inputs, including IT and professional service inputs as a result of service sectors’ fragmentation.
For the methodologies, this study considers a panel vector-autoregressive (PVAR) model using the Trade in Value Added (TiVA) database of the Organization for Economic Cooperation and Development (OECD).1 This study targets emerging and developing Asian economies because the Asian region is a major player in GVCs expansion (Kimura 2006; Taguchi and Thet 2021; Alvarez et al. 2021) and shows the progress in servicification in GVCs (Baldwin et al. 2015). The application of a PVAR model with the TiVA database is justified by this study’s purpose and hypotheses. This study did not use case studies regarding specific sectors and countries but a comprehensive and data-driven approach to clarify the mechanism of servicification in GVCs in multiple countries. In addition, the key variables in this study, the ones of service and manufacturing exports and inputs, are interdependent with one another. Thus, single-equation regressions would lead to biased and inconsistent estimators due to variables’ endogeneities. Instead, a PVAR model allows for endogeneity among estimation variables and lets the data determine the causality between targeted variables.
The remainder of this study is organized as follows. Section 2 reviews the literature, focusing on theoretical and empirical studies on servicification in GVCs and emphasizing this study’s contribution. Section 3 presents empirical methods, including data on key variables and methodologies for PVAR estimation. Section 4 shows estimation outcomes with interpretation. The final section summarizes, concludes, and highlights the implications of the study.

2. Literature Review and Contribution

This section reviews the literature related to servicification issues in GVCs and emphasizes this study’s contribution. Discussions on servicification can be categorized into emerging patterns, causes, and impacts.
The emerging patterns of services in GVCs are illustrated by a large and increasing share of services in value-added trade (e.g., OECD et al. 2014; Johnson and Noguera 2017). In this context, Heuser and Mattoo (2017) have demonstrated that services, as a share of value-added trade, increased from below 30% in 1980 to more than 40% in 2009, while in terms of gross export, they have remained at approximately 20% since 1980. Asian and Central and Eastern European economies are no exception to this pattern (Baldwin et al. 2015; Kordalska and Olczyk 2021). From a sectoral perspective, some studies have verified the increasing role of digital services in GVCs dynamics (Blázquez et al. 2023; Baek et al. 2023). Service involvement in GVCs may be complex and not necessarily follow a linear trend. Qiu (2020) has argued that service inputs help develop manufacturing in proximate districts but hinder it in faraway districts and that service inputs have an inverted U-shaped effect on GVC development.
The causes of servicification in GVCs have been explained by Baldwin et al. (2015) and Heuser and Mattoo (2017) as follows: (1) reclassification―many services traditionally sourced in-house by manufacturing firms, thus classified as manufacturing, began to be outsourced at arm’s length and classified accordingly as services; (2) task-composition shift: connecting services—GVC emergence requires connections among geographically separated production sites, which involve services links including telecommunications, transportation, and mailing; (3) task-composition shift: changes in final goods―many manufactured goods have become more intensive in services such as software in cars and sophisticated design in machines; and (4) task–relative price shift―the prices of services tasks have increased relative to those of manufacturing tasks because manufacturing tasks are easier to offshore to lower cost locations.
The impact of servicification on GVCs can be described by the following two key aspects of economic performance: productivity growth and evolution of comparative advantage (Heuser and Mattoo 2017). Cheng and Xiao (2021) have demonstrated that the growth of producer services in the context of GVCs helps improve the productivity of final goods and services and reduces the cost of supplying producer services. Díaz-Mora et al. (2018) have argued that the foreign services value-added content of exports positively contributes to export performance. Through interviews and case studies of firms operating as suppliers of embedded services to wind and power projects in South Africa, Hansen et al. (2022) have displayed upgrades to their services in the GVCs context.
Regarding policy issues on GVC servicification, Findlay and Roelfsema (2023) have stated that restricting trade in services is detrimental to GVC participation, especially for ASEAN members. Accordingly, they have emphasized the need for policy actions to follow up on trade liberalization with a new round of lower restrictions on services trade.
Considering the aforementioned literature, this study focuses on the patterns of GVC servicification. However, the existing literature illustrated the increased presence of service sectors in GVCs as its patterns, and there have been no scientific studies to elucidate deeply the mechanism of servicification in GVCs. The novelty of this study is that it clarifies the servicification mechanism by visualizing the endogenous interactions between gross exports and inputs in business service and manufacturing sectors by checking their causalities using a PVAR framework.

3. Empirical Methods

This section empirically analyzes the involvement of the service sector in GVCs, focusing on selected emerging and developing Asian economies. This study targets the following eight Asian economies: Cambodia, China, India, Indonesia, Malaysia, the Philippines, Thailand, and Vietnam. This section involves a descriptive analysis, followed by econometric methods, containing data on key variables and methodologies for PVAR estimation.

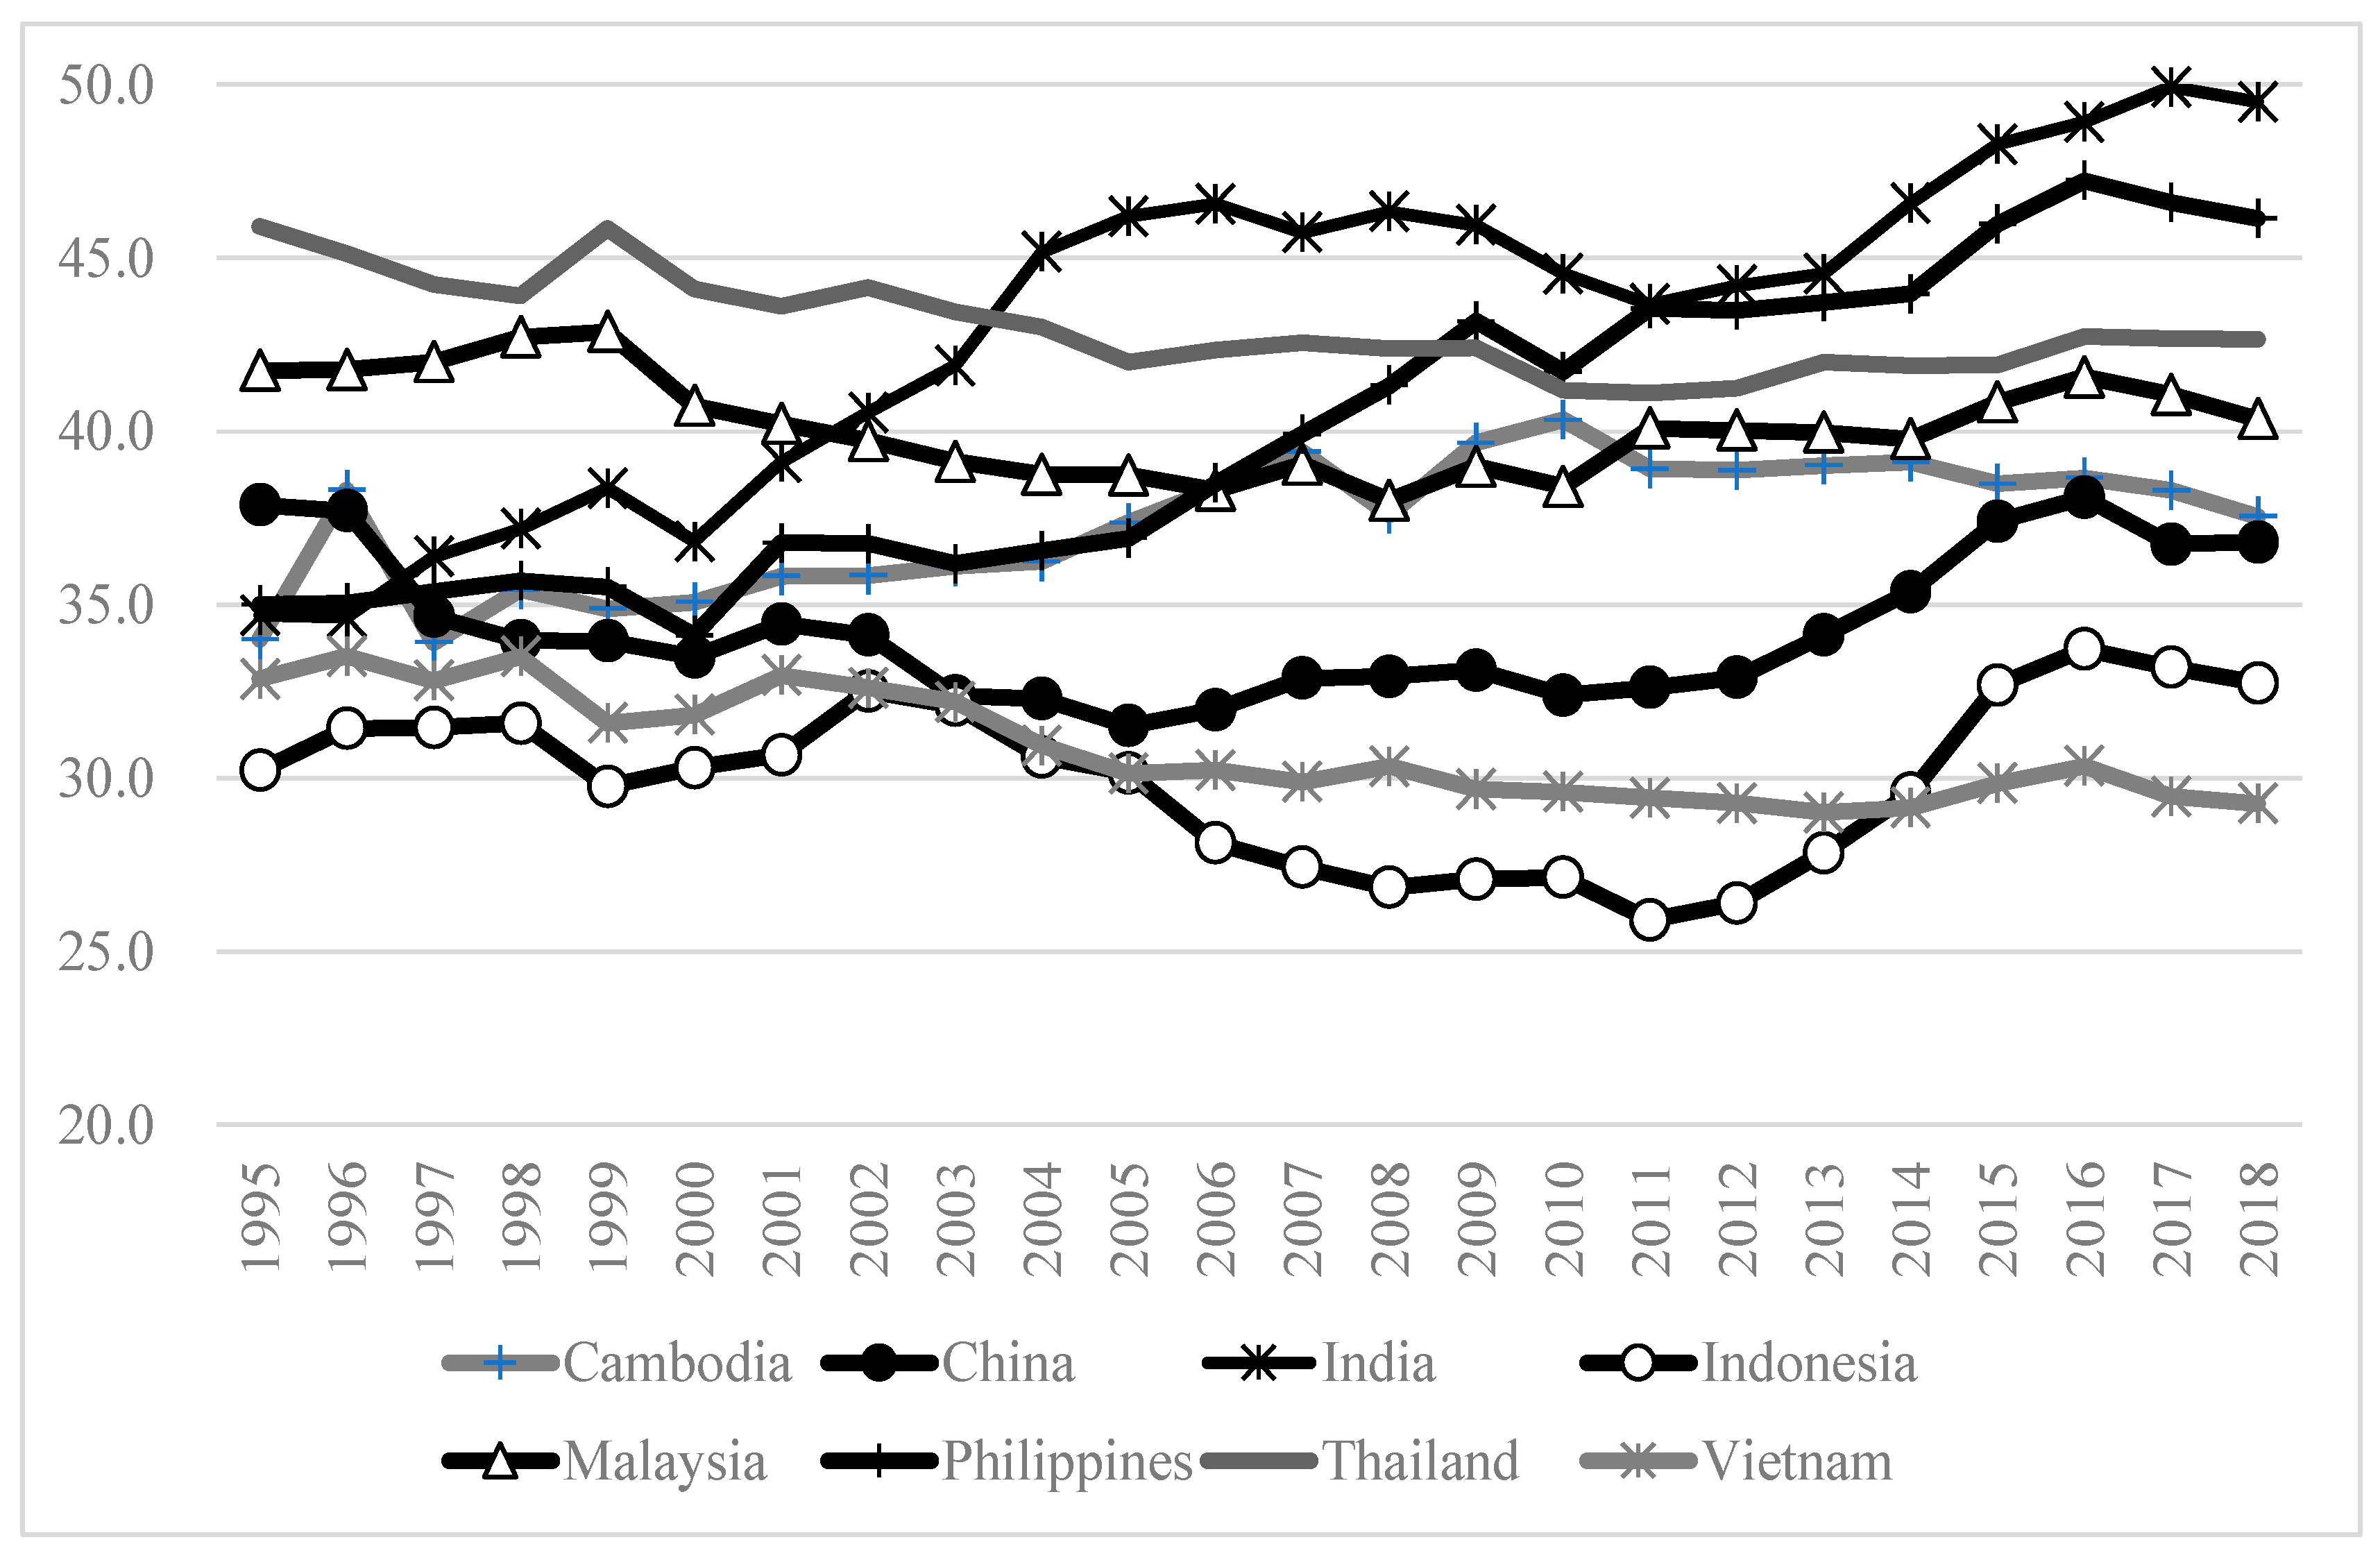
3.1. Descriptive Analysis

Figure 1 shows the trends in the ratio of business service content to gross exports for the eight sample economies. The trend is computed using the “total business sector services” as an industrial origin of value-added, divided by the “total gross exports” from the OECD TiVA database. These trends could be classified into three groups. Cambodia and Vietnam, with lower-middle incomes, show decreasing trends in their ratios; India and the Philippines show increasing trends; and China, Indonesia, Malaysia, and Thailand, with upper-middle incomes, display inverted U-shaped trends.2 Thus, servicification has progressed in the selected Asian economies, except for in those with lower-middle incomes, especially since the mid-2000s. This observation motivates us to conduct a PVAR model estimation to determine how the service inputs have been linked with manufacturing and service exports and whether the service inputs have domestic or foreign origins.

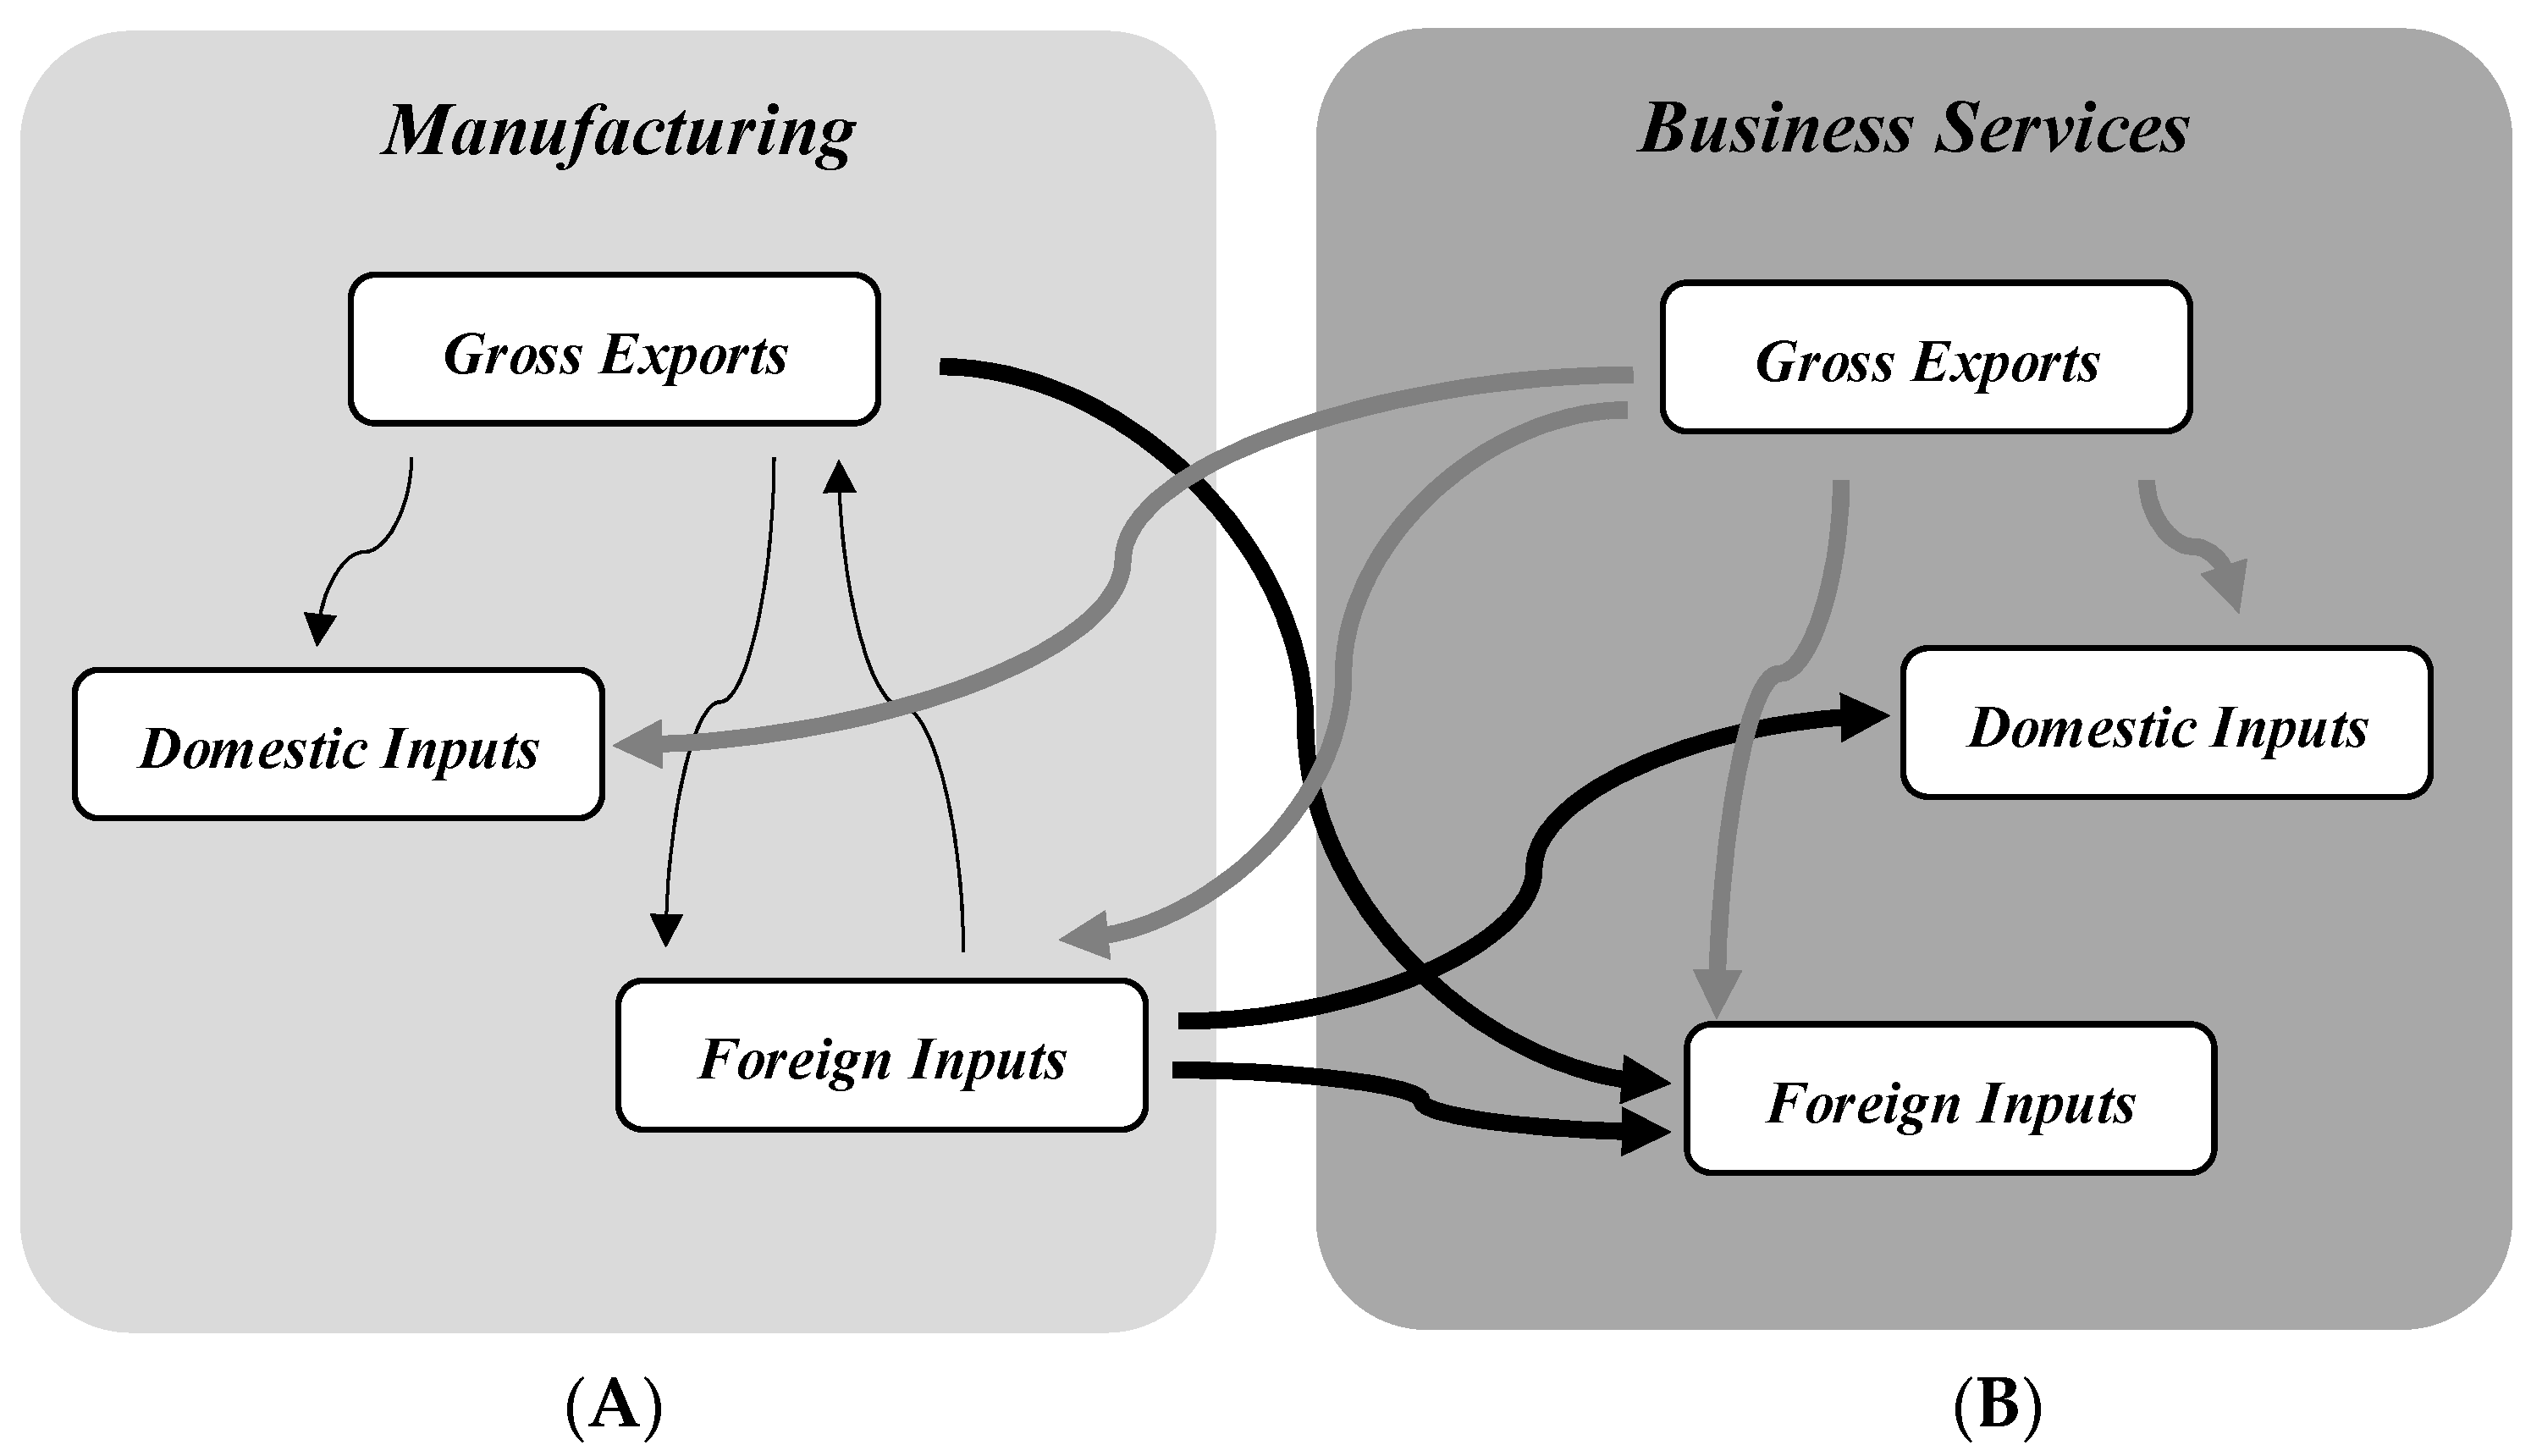
3.2. Variables and Data

This subsection identifies the variables for the PVAR model estimation. For all variables, the study samples include time-series data for the maximum data available from 1995 to 2018. Then, the study constructs a set of panel data for the eight sample countries.
Examining the interactions between service inputs and manufacturing exports and inputs requires the following variables: gross exports of manufacturing (mex), manufacturing value-added as the domestic origin of mex (modm) and foreign origin of mex (mofm), and value-added of “total business sector services” (hereafter, business services) as the domestic origin of mex (mods) and foreign origin of mex (mofs). The following variables are used to represent the specific vital sectors within the total business sector: the value-added of “information technology and other information services” (hereafter, IT services) as domestic origin of mex (mods_it) and foreign origin of mex (mofs_it) and value-added of “professional, scientific and technical activities” (hereafter, professional services) as domestic origin of mex (mods_pr) and foreign origin of mex (mofs_pr). Estimating the interactions between business service inputs and exports and manufacturing inputs requires the following variables: gross exports of business services (sex), manufacturing value-added as domestic origin of sex (sodm) and a foreign origin of sex (sofm), business service value-added as domestic origin of sex (sods) and foreign origin of sex (sofs), IT service value-added as domestic origin of sex (sods_it) and foreign origin of sex (sofs_it), and professional service value-added as domestic origin of sex (sods_pr) and foreign origin of sex (sofs_pr). The data source for all value-added trade variables is the OECD TiVA database (in millions of USD).
The real GDP per capita (pcy) is inserted as a control (exogenous) variable in the PVAR model estimation because the industrial structure might be affected by the development stage of an economy, according to Petty–Clark’s law (Clark 1940). The data are retrieved from United Nations Conference on Trade and Development (UNCTAD) Stat3, particularly the “GDP per capita, constant (2015) prices”. A list of variables and data sources is presented in Table 1, and their descriptive statistics are presented in Table 2.
The estimation adds another important variable, that is, the period dummy variable for 2006–2018 (d06), to identify the acceleration of servicification in sample economies since the mid-2000s, as shown in Section 3.1. The dummy value takes one for 2006–2018 and is attached to the following service input variables: mods, mofs, mods_it, mofs_it, mods_pr, mofs_pr, sods, sofs, sods_it, sofs_it, sods_pr, and sofs_pr.

3.3. Data Property

Before conducting the PVAR model estimation, this study investigates the stationarity of the data by employing panel unit root tests for each variable and, if required, a panel co-integration test for a set of variables. Panel unit-root tests are first conducted on the null hypothesis, suggesting that the level and/or first difference of the individual data have a unit root. If the unit-root tests reveal that each variable’s data are not stationary at a given level but stationary in the first difference, a set of variables’ data corresponds to the case of I(1). Then, it can be further examined using a co-integration test for “level” data. If a set of variables’ data are identified to have co-integration, using “level” data is justified for model estimation.
For the panel unit-root tests, this study applies the Levin, Lin, and Chu (LLC) test (Levin et al. 2002) as a common unit-root test and the Fisher-ADF and Fisher-PP tests (Choi 2001; Maddala and Wu 1999) and Im, Pesaran, and Shin test (Im et al. 2003) as individual unit-root tests. The common unit-root test assumes that there is a common unit-root process across cross-sections, whereas the individual unit-root test allows for individual unit-root processes to vary across cross-sections. This study conducts a Johansen-Fisher panel co-integration test (Maddala and Wu 1999). All test equations contain individual intercepts and trends, with the lag length being the automatic selection.
Table 3 and Table 4 list the test results. The common and individual unit root tests do not reject the null hypothesis of a unit-root in level data at conventional significance levels4; however, the null hypothesis is rejected in the first differences for all variables. Therefore, the variables follow the case of I(1). Subsequently, the panel co-integration test is conducted on the combinations of variables, and the results (trace and max-eigenvalues) suggest that the level series for a set of variables’ data are co-integrated. Thus, this study utilizes level data for subsequent estimations.

3.4. PVAR Model Specification

This study adopts a PVAR model to examine the quantitative interactions between service inputs and manufacturing exports and inputs and those between service inputs and service exports. The application of a PVAR model is justified by this study’s property with a comprehensive and data-driven approach to clarify the mechanism of servicification in GVCs in multiple countries. In addition, the key variables in this study, the ones of service and manufacturing exports and inputs, are interdependent with each other. Thus, single-equation regressions would lead to biased and inconsistent estimators due to variables’ endogeneities. Instead, a PVAR model allows for endogeneity among estimation variables and lets the data determine the causality between targeted variables. There have been no scientific studies to elucidate the mechanism of servicification in GVCs with a PVAR model. The PVAR model can be specified for the estimation as follows:
yit = μ + V1 yit−1 + V2 zit + fi + ft + εt
where the subscripts i and t denote the eight sampled Asian economies and the years 1995–2018. y is a column vector of the endogenous variables, that is, y = (mex, modm, mofm, mods, mods*d06, mofs, mofs*d06)’ to examine the interactions between business service inputs and manufacturing exports and inputs; y = (mex, modm, mofm, mods_it, mods_it*d06, mofs_it, mofs_it*d06)’ to examine the interactions between IT service inputs and manufacturing exports and inputs; y = (mex, modm, mofm, mods_pr, mods_pr*d06, mofs_pr, mofs_pr*d06)’ to examine the interactions between professional service inputs and manufacturing exports and inputs; y = (sex, sodm, sofm, sods, sods*d06, sofs, sofs*d06)’ to examine the interactions between business service inputs and exports and manufacturing inputs; y = (sex, sodm, sofm, sods_it, sods_it*d06, sofs_it, sofs_it*d06)’ to examine the interactions among IT service inputs, business service exports and manufacturing inputs; and y = (sex, sodm, sofm, sods_pr, sods_pr*d06, sofs_pr, sofs_pr*d06)’ to examine the interactions among professional service inputs, business service exports and manufacturing inputs.
The other vectors are as follows: y−1 is a vector of the one-year lagged endogenous variables rooted in a limited number of time-series data; z is the control variable of real GDP per capita (pcy); fi and ft represent time-invariant country-specific and country-invariant time-specific fixed effects, respectively; μ is a constant vector; V1 and V2 are coefficient matrices; and εt is a vector of the random error terms in the system. This panel estimation applies the fixed-effects model represented by fi and ft for the following reasons. From a statistical perspective, the Hausman specification test (Hausman 1978) is generally used to choose between fixed- and random-effects models. However, this study emphasizes the existence of exogenous factors affecting value-added trade. For instance, time-invariant factors, such as political systems, institutional quality, technology-absorbing capacity, and economic strategies, might widely differ among the sample economies, and these country-specific factors might be correlated with value-added trade. There are also country-invariant time-specific factors, namely, economic fluctuations caused by external shocks, such as the Asian financial crisis in 1997–1998 and the global financial crisis in 2008–2009. Accordingly, because these factors are correlated with the error term among the sample economies for the given sample period, simple pooled estimates that ignore this correlation may lead to an inefficient estimation. Additionally, adopting the fixed-effects model can alleviate the endogeneity problem by absorbing unobserved heterogeneity among the sample countries. Thus, a fixed-effects model is adopted for all estimations in this study.
Based on these specifications, the analysis estimates the PVAR model and examines Granger causalities among the endogenous variables using a block exogeneity test. The block exogeneity test provides a data-driven toolkit to determine whether a variable should be included or excluded from an estimation model. This test justifies the inclusion of a variable based on Granger causality in the PVAR framework. Granger causality was identified by rejecting the null hypothesis that a variable is excluded from the PVAR model.

4. Estimation Results and Discussion

Table 5 shows the PVAR model estimation results, and Table 6 presents the block exogeneity test results based on the PVAR model estimation. The estimation results are summarized in the following subsections.

4.1. Causalities between Business Service Inputs and Manufacturing Exports and Inputs

The Granger causalities with positive signs and conventionally significant levels are confirmed in Table 5a and Table 6a as follows: from foreign manufacturing inputs (mofm) to manufacturing exports (mex), from manufacturing exports (mex) to domestic and foreign manufacturing inputs (modm and mofm), from foreign manufacturing inputs (mofm) to domestic business service inputs and their cross-term with a period dummy for 2006–2018 (mods and mods*d06), and from manufacturing exports and foreign manufacturing inputs (mex and mofm) to foreign business service inputs and their cross-term with a period dummy for 2006–2018 (mofs and mofs*d06).
These results can be interpreted as follows. First, within manufacturing sectors, reciprocal interactions between manufacturing exports and inputs, except domestic ones, are identified. This implies a solid linkage in manufacturing GVCs, where foreign manufacturing inputs are the driving forces behind manufacturing exports. Second, regarding the interactions between business service inputs and manufacturing exports and inputs, the estimation results suggest that business service inputs, particularly foreign inputs, have been facilitated by manufacturing exports and foreign manufacturing inputs. This trend has accelerated since the mid-2000s. This finding implies that business services are actively involved in manufacturing GVC activities.
Delving into individual service sectors, namely, IT and professional services, the Granger causalities with positive signs and conventionally significant levels are confirmed in Table 5b and Table 6c as follows: from foreign manufacturing inputs (mofm) to foreign IT service inputs and their cross-term with a period dummy for 2006–2018 (mofs_it and mofs_it*d06), from domestic and foreign manufacturing inputs (modm and mofm) to domestic professional service inputs and their cross-term with a period dummy for 2006–2018 (mods_pr and mods_pr*d06), and from foreign manufacturing inputs (mofm) to foreign professional service inputs and their cross-term with a period dummy for 2006–2018 (mofs_pr and mofs_pr*d06). These results suggest that IT and professional service inputs, particularly foreign inputs, are promoted by foreign manufacturing inputs. This trend has also accelerated since the mid-2000s. This implies the active involvement of IT and professional services in manufacturing GVC activities.

4.2. Causalities between Business Service Inputs and Exports and Manufacturing Inputs

The Granger causalities with positive signs and conventionally significant levels are verified in Table 5d–f and Table 6d as follows: from business service exports (sex) to domestic and foreign manufacturing inputs (sodm and sofm), from business service exports (sex) to domestic and foreign business service inputs and their cross-term with a period dummy for 2006–2018 (sods, sods*d06, sofs, and sofs*d06), and from business service exports (sex) to domestic and foreign professional service inputs and their cross-term with a period dummy for 2006–2018 (sods_pr, sods_pr*d06, sofs_pr, and sofs_pr*d06). These results suggest that, first, both domestic and foreign manufacturing inputs are induced by business service exports. Second, within business service sectors, business service inputs and professional service inputs, regardless of whether they are domestic or foreign, have been facilitated by business service exports. These trends have also accelerated since the mid-2000s. This finding implies the active involvement of business services, including professional services, in business service GVC activities.

4.3. Summary of Findings and Policy Implications

In the block exogeneity tests in this study, all the combinations between gross exports and inputs in business service and manufacturing sectors were comprehensively examined in terms of causalities through Section 4.1 and Section 4.2 based on Table 6. Thus, no significant results were left unanalyzed regarding the mechanism of servicification in GVCs. The key findings of the test results (illustrated in Figure 2) are as follows: First, reciprocal interactions between the business services and manufacturing sectors are confirmed. Thus, foreign business service inputs are induced by manufacturing exports, whereas manufacturing inputs are induced by business service exports. Second, foreign business service inputs, including IT and professional services, are facilitated by foreign manufacturing inputs. Third, business service inputs, including professional service inputs, are promoted by business service exports. These trends in the involvement of business services, including IT and professional services in GVC activities, have accelerated since the mid-2000s in all aspects. These findings to support servicification in GVCs, including IT and professional services, are consistent with the existing literature on servicification, such as OECD et al. (2014), Johnson and Noguera (2017), Heuser and Mattoo (2017), Baldwin et al. (2015), Blázquez et al. (2023), and Baek et al. (2023). However, this study is different from earlier studies in that it provided deep insights into the mechanism of servicification in GVCs by quantifying the interactions between gross exports and inputs in business service and manufacturing sectors. In addition, this study demonstrated the role of IT and professional services in servicification in GVCs. This finding implies that “Task-composition shift: changes in final goods” as one of the causes of servicification (presented by Baldwin et al. 2015, and Heuser and Mattoo 2017) has a significant effect, ensuring that servicification can contribute to productivity growth and evolution of comparative advantage.
The policy implication is that there should be room to create better environments for trade in services, especially considering that servicification in the GVC processes has accelerated in Asian economies. Heuser and Mattoo (2017) have put forth the following two types of policy issues inhibiting the enhanced role of services in GVCs: explicit restrictions on foreign services and service suppliers and regulatory divergence across countries, which reduce the intercompatibility of goods, services, and service components needed for fragmenting production across countries. The World Bank provides the Services Trade Restrictions Index that represents the restrictiveness of service trade policies across countries5. This index is based on data collected between 2008 and 2010 from 103 countries; it ranges from zero (completely open) to 100 (completely closed). Focusing on the sample economies in this study, the index scores of China (36.6), India (65.7), Indonesia (50.0), Malaysia (46.1), the Philippines (53.5), Thailand (48.0), and Vietnam (41.5) exceed the world sample average (28.4) (only Cambodia’s index, 23.7, is below the average). This observation suggests that even the Asian economies that have reaped huge benefits from trade liberalization and investment in goods continue to restrict foreign presence in services. Findlay and Roelfsema (2023) have also pointed out the restrictions on trade in services in developing Asian countries, arguing that they are detrimental to GVCs' participation as ASEAN members. Instead, there are empirical studies demonstrating that reducing trade restrictions on service trade can provide spillover benefits for firms in manufacturing sectors as well as service sectors (Francois and Hoekman 2010; Beverelli et al. 2017; Shepherd 2019). Thus, regulatory cooperation in Asia is necessary to address regulatory divergence and facilitate the removal of explicit restrictions.

5. Concluding Remarks

This study investigated the involvement of service sectors in GVCs in selected emerging and developing Asian economies by examining the quantitative interactions between service inputs and manufacturing exports and inputs and those between service inputs and service exports using a PVAR model based on the OECD TiVA database. This study aimed to visualize the endogenous interactions of value-added trade variables related to service sectors by checking their causalities in a PVAR framework, especially considering that previous studies have failed to do so.
The main findings of the estimation results are as follows. First, reciprocal interactions between the business services and manufacturing sectors are confirmed. Therefore, foreign business service inputs are induced by manufacturing exports, whereas manufacturing inputs are induced by business service exports. Second, foreign business service inputs, including IT and professional service inputs, are facilitated by foreign manufacturing. Third, business service inputs, including professional service inputs, are promoted by business service exports. These trends in the involvement of business services, including IT and professional services in GVC activities, have accelerated since the mid-2000s in all aspects.
A policy implication of this study is that there should be room to create better environments for trade in services following the post-COVID-19 era because servicification in GVC processes has accelerated in Asian economies. Since Asian economies, having reaped huge benefits from trade liberalization and investment in goods, have continued to maintain restrictions on foreign presence in services, regulatory cooperation in the Asian region is necessary to address regulatory divergence and facilitate the removal of explicit restrictions.
The limitation of this study is its lack of more detailed and in-depth analyses of servicification in GVCs in Asian economies. By conducting case studies on individual sectors and countries to examine the complexity of servicification in Asian GVCs, as well as studies as to how regulatory divergence has hindered their services in trade, it would be possible to validate the evidence found in this study and to develop more concrete recommendations for facilitating servicification in Asian GVCs.

Author Contributions

Conceptualization, H.T. and N.L.; methodology, H.T. and N.L.; software, H.T. and N.L.; validation, H.T.; formal analysis: H.T.; investigation, H.T. and N.L.; resources, N.L.; data curation, H.T.; writing—original draft preparation, H.T.; writing—review and editing, H.T. and N.L.; supervision, H.T.; project administration, H.T. All authors have read and agreed to the published version of the manuscript.

Funding

This research received no external funding.

Informed Consent Statement

Not applicable in this study.

Data Availability Statement

Data are contained within the article.

Conflicts of Interest

The authors declare no conflicts of interest.

Notes

1
See the website: https://stats.oecd.org/ (accessed on 1 February 2024).
2
The income classification is based on World Bank’s classification. Please see https://datahelpdesk.worldbank.org/knowledgebase/articles/906519 (accessed on 1 February 2024).
3
See the website: https://unctadstat.unctad.org/datacentre/ (accessed on 1 February 2024).
4
In the variable pcy, a unit-root is rejected; however, when considering only the LLC, a weak significant level is seen.
5

References

  1. Alvarez, Julian B., Kristina Baris, Maverick C. Crisostomo, Janine P. de Vera, Yuning Gao, Krizia Anne V. Garay, P. B. Gonzales, Christian J. Jabagat, Angeli S. Juani, Angelo B. Lumba, and et al. 2021. Recent Trends in Global Value Chains. In Global Value Chain Development Report 2021: Beyond Production. Edited by Asian Development Bank, the Research Institute for Global Value Chains at the University of International Business and Economics, the World Trade Organization, the Institute of Developing Economies–Japan External Trade Organization and the China Development Research Foundation. Available online: https://www.adb.org/publications/global-value-chain-development-report-2021 (accessed on 1 February 2024).
  2. Baek, Nuri, Kaustubh Chahande, Kodjovi Eklou, Tidiane Kinda, Vatsal Nahata, Umang Rawat, and Ara Stepanyan. 2023. ASEAN-5: Further Harnessing the Benefits of Regional Integration amid Fragmentation Risks. Washington, DC: International Monetary Fund, IMF Working Papers No. WP/23/191. [Google Scholar]
  3. Baldwin, Richard, Rikard Forslid, and Tadashi Ito. 2015. Unveiling the Evolving Sources of Value Added in Exports. IDE–JETRO Joint Research Program Series. No. 161; Available online: https://www.ide.go.jp/English/Publish/Reports/Jrp/161.html (accessed on 1 February 2024).
  4. Beverelli, Cosimo, Matteo Fiorini, and Bernard Hoekman. 2017. Services Trade Policy and Manufacturing Productivity: The Role of Institutions. Journal of International Economics 104: 166–82. [Google Scholar] [CrossRef]
  5. Blázquez, Leticia, Carmen Díaz-Mora, and Belén González-Díaz. 2023. Slowbalisation or a ‘New’ type of GVC participation? The role of digital services. Journal of Industrial and Business Economics 50: 121–47. [Google Scholar] [CrossRef]
  6. Cheng, Dazhong, and Zhiguo Xiao. 2021. Producer Services and Productivity: A Global Value Chain Perspective. Review of Income and Wealth 67: 418–44. [Google Scholar] [CrossRef]
  7. Choi, In. 2001. Unit root tests for panel data. Journal of International Money and Finance 20: 249–72. [Google Scholar] [CrossRef]
  8. Clark, Colin. 1940. The Conditions of Economic Progress. New York: Macmillan. [Google Scholar]
  9. Díaz-Mora, Carmen, Rosario Gandoy, and Belén González-Díaz. 2018. Looking into global value chains: Influence of foreign services on export performance. Review of World Economics 154: 785–814. [Google Scholar] [CrossRef]
  10. Findlay, Christopher, and Hein Roelfsema. 2023. Services trade in the ASEAN region and participation in GVCs. Journal of the Asia Pacific Economy 28: 986–1006. [Google Scholar] [CrossRef]
  11. Francois, Joseph, and Bernard Hoekman. 2010. Services Trade and Policy. Journal of Economic Literature 48: 642–92. [Google Scholar] [CrossRef]
  12. Hansen, Ulrich Elmar, Ivan Nygaard, Mike Morris, and Glen Robbins. 2022. Servicification of Manufacturing in Global Value Chains: Upgrading of Local Suppliers of Embedded Services in the South African Market for Wind Turbines. The Journal of Development Studies 58: 787–808. [Google Scholar] [CrossRef]
  13. Hausman, Jerry A. 1978. Specification Tests in Econometrics. Econometrica 46: 1251–72. [Google Scholar] [CrossRef]
  14. Heuser, Cecilia, and Aaditya Mattoo. 2017. Services Trade and Global Value Chains. In Global Value Chain Development Report 2017: Measuring and Analyzing the Impact of GVCs on Economic Development. Edited by World Bank, Institute of Developing Economies—Japan External Trade Organization, Organization for Economic Co-operation and Development, University of International Business and Economics and World Trade Organization. Available online: https://www.wto.org/english/res_e/publications_e/gvcd_report_17_e.htm (accessed on 1 February 2024).
  15. Im, Kyung So, Mohammed H. Pesaran, and Yongcheol Shin. 2003. Testing for unit roots in heterogeneous panels. Journal of Econometrics 115: 53–74. [Google Scholar] [CrossRef]
  16. Johnson, Robert C., and Guillermo Noguera. 2017. A Portrait of Trade in Value Added over Four Decades. The Review of Economics and Statistics 99: 896–911. [Google Scholar] [CrossRef]
  17. Kimura, Fukunari. 2006. International production and distribution networks in East Asia: Eighteen facts, mechanics, and policy implications. Asian Economic Policy Review 1: 326–44. [Google Scholar] [CrossRef]
  18. Koopman, Robert, Zhi Wang, and Shang-Jin Wei. 2014. Tracing Value-Added and Double Counting in Gross Exports. American Economic Review 104: 459–94. [Google Scholar] [CrossRef]
  19. Kordalska, Aleksandra, and Magdalena Olczyk. 2021. Linkages between services and manufacturing as a new channel for GVC development: Evidence from CEE countries. Structural Change and Economic Dynamics 58: 125–37. [Google Scholar] [CrossRef]
  20. Levin, Andrew, Chien-Fu Lin, and Chia-Shang James Chu. 2002. Unit root tests in panel data: Asymptotic and finite-sample properties. Journal of Econometrics 108: 1–24. [Google Scholar] [CrossRef]
  21. Maddala, G. S., and Shaowen Wu. 1999. A comparative study of unit root tests with panel data and a new simple test. Oxford Bulletin of Economics and Statistics 61: 631–52. [Google Scholar] [CrossRef]
  22. Nano, Enrico, and Victor Stolzenburg. 2021. The Role of Global Services Value Chains for Services-Led Development. In Global Value Chain Development Report 2021: Beyond Production. Edited by Asian Development Bank, the Research Institute for Global Value Chains at the University of International Business and Economics, the World Trade Organization, the Institute of Developing Economies–Japan External Trade Organization and the China Development Research Foundation. Available online: https://www.adb.org/publications/global-value-chain-development-report-2021 (accessed on 1 February 2024).
  23. OECD (Organization for Economic Co-operation and Development), WTO (World Trade Organization), and World Bank Group. 2014. Global Value Chains: Challenges, Opportunities and Implications for Policy. Paper presented at the G20 Trade Ministers Meeting, Sydney, Australia, July 19. [Google Scholar]
  24. Qiu, Ying. 2020. Promotion or hindrance? The threshold effect of services on global value chains. Applied Economics Letters 27: 406–411. [Google Scholar] [CrossRef]
  25. Shepherd, Ben. 2019. Services Policies and Manufacturing Exports. In Leveraging Services for Development: Prospects and Policies. Edited by Matthias Helble and Ben Shepherd. Tokyo: Asian Development Bank Institute. [Google Scholar]
  26. Taguchi, Hiroyuki, and Mon Soe Thet. 2021. Quantitative linkage between global value chains’ backward participation and logistics performance in the host country: A structural gravity model analysis of emerging ASEAN economies. Asia-Pacific Journal of Regional Science 5: 453–75. [Google Scholar] [CrossRef]
  27. World Bank. 2020. World Development Report—Trading for Development in the Age of Global Value Chains. Washington, DC: World Bank. [Google Scholar]
  28. World Trade Organization (WTO). 2021. World Trade Report 2021: Economic Resilience and Trade. Geneva: WTO. [Google Scholar]
Figure 1. Ratio of service content to gross exports. Sources: author’s calculation based on the OECD Stat database.
Economies 12 00125 g001
Figure 2. Key findings of causalities between manufacturing and business services. Note: A → B denoted the causality from A to B. Sources: authors’ illustration.
Economies 12 00125 g002
Table 1. List of variables and data sources.
VariablesDescriptionSources
mexGross exports: manufacturingOECD
TiVA
modmDomestic industrial origin of mex: manufacturing
mofmForeign industrial origin of mex: manufacturing
modsDomestic industrial origin of mex: total business sector services
mofsForeign industrial origin of mex: total business sector services
mods_itDomestic industrial origin of mex: IT and other information services
mofs_itForeign industrial origin of mex: IT and other information services
mods_prDomestic industrial origin of mex: professional, scientific and technical activities
mofs_prForeign industrial origin of mex: professional, scientific and technical activities
sexGross exports: total business sector services
sodmDomestic industrial origin of sex: manufacturing
sofmForeign industrial origin of sex: manufacturing
sodsDomestic industrial origin of sex: total business sector services
sofsForeign industrial origin of sex: total business sector services
sods_itDomestic industrial origin of sex: IT and other information services
sofs_itForeign industrial origin of sex: IT and other information services
sods_prDomestic industrial origin of sex: professional, scientific and technical activities
sofs_prForeign industrial origin of sex: professional, scientific and technical activities
pcyGDP per capita, constant (2015) pricesUNCTAD
Sources: Authors’ description. Note: the unit of TiVA data are millions of USD, and that of GDP per capita is USD.
Table 2. Descriptive statistics.
VariablesObs.MedianStd. Dev.Min.Max
mex19256,505 362,669 542 1,985,752
modm19220,890 172,045 304 950,085
mofm1927235 28,101 73 144,141
mods1927107 74,214 52 440,950
mofs1926794 25,860 77 129,591
mods_it19244 1716 0 11,340
mofs_it192178 792 1 4685
mods_pr19281 4370 1 26,168
mofs_pr192614 2979 6 15,292
sex19222,765 79,381 248 394,099
sodm1921209 8583 15 43,641
sofm1921133 1919 28 9447
sods19216,258 59,220 156 303,352
sofs1921710 3154 29 15,079
sods_it192211 12,542 1 71,096
sofs_it19271 143 1 706
sods_pr192701 3657 3 20,940
sofs_pr192173 470 3 2055
pcy1922256 2491 383 10,778
Sources: Authors’ description. Note: the unit of TiVA data are millions of USD, and that of GDP per capita is USD.
Table 3. Panel unit-root tests.
VariablesObs.MedianStd. Dev.Min.Max
mex19256,505 362,669 542 1,985,752
modm19220,890 172,045 304 950,085
mofm1927235 28,101 73 144,141
mods1927107 74,214 52 440,950
mofs1926794 25,860 77 129,591
mods_it19244 1716 0 11,340
mofs_it192178 792 1 4685
mods_pr19281 4370 1 26,168
mofs_pr192614 2979 6 15,292
sex19222,765 79,381 248 394,099
sodm1921209 8583 15 43,641
sofm1921133 1919 28 9447
sods19216,258 59,220 156 303,352
sofs1921710 3154 29 15,079
sods_it192211 12,542 1 71,096
sofs_it19271 143 1 706
sods_pr192701 3657 3 20,940
sofs_pr192173 470 3 2055
pcy1922256 2491 383 10,778
Sources: authors’ estimation. Note: * and *** denote statistical significance at the 10% and 1% levels, respectively.
Table 4. Panel co-integration test.
Johansen Fisher Panel Cointegration Test
GroupTrace TestMax-Eigen Test
mex, modm, mofm, mods, mofs259.9 ***168.1 ***
mex, modm, mofm, mods_it, mofs_it209.8 ***136.3 ***
mex, modm, mofm, mods_pr, mofs_pr225.8 ***157.4 ***
sex, sodm, sofm, sods, dofs202.2 ***134.6 ***
sex, sodm, sofm, sods_it, dofs_it254.3 ***171.9 ***
sex, sodm, sofm, sods_pr, dofs_pr222.2 ***132.6 ***
Sources: authors’ estimation. Note: *** denotes statistical significance at the 1% level.
Table 5. PVAR model estimation results.
(a) Interactions between IT service inputs and manufacturing exports and inputs.
mexmodmmofmmodsmods*d06mofsmofs*d06
mex−11.853 ***0.457 *0.130 *0.0730.190.162 **0.211 **
[3.098][1.755][1.741][0.858][1.514][2.394][2.424]
modm−1−0.0050.818 **−0.0880.1820.046−0.127−0.200 *
[−0.006][2.244][−0.843][1.516][0.261][−1.335][−1.646]
mofm−111.216 ***4.989 ***2.303 ***1.280 **1.438 *1.496 ***1.395 **
[2.987][3.054][4.902][2.381][1.822][3.511][2.559]
mods−1−5.588 ***−2.589 ***−0.510 ***0.287−0.398−0.514 ***−0.517 ***
[−4.129][−4.397][−3.012][1.484][−1.400][−3.345][−2.631]
mods*d06−12.698 **1.350 **0.2590.1550.703 **0.2210.176
[2.001][2.302][1.536][0.804][2.483][1.446][0.901]
mofs−1−13.703 **−6.031 **−1.781 **−1.798 *−2.134−1.119−1.672 *
[−2.124][−2.149][−2.207][−1.948][−1.574][−1.529][−1.786]
mofs*d06−1−3.719 *−1.739 **−0.398 *−0.182−0.246−0.3250.301
[−1.948][−2.094][−1.668][−0.668][−0.613][−1.503][1.087]
pcy36.793 ***16.550 ***4.297 ***3.354 **4.761 **3.844 ***5.599 ***
[3.640][3.763][3.398][2.318][2.242][3.352][3.816]
adj. R^20.990.9920.9740.9950.990.9740.960
(b) Interactions between IT service inputs and manufacturing exports and inputs.
mexmodmmofmmods_itmods_it*d06mofs_itmofs_it*d06
mex−10.068−0.322 **−0.057−0.001−0.000−0.001−0.000
[0.212][−2.300][−1.507][−0.444][−0.028][−0.756][−0.003]
modm−11.791 ***1.607 ***0.128 *0.0050.0050.0030.001
[2.972][6.131][1.816][0.989][0.814][1.191][0.436]
mofm−16.472 ***2.546 ***1.669 ***−0.031 ***−0.0000.018 ***0.022 ***
[4.590][4.151][10.140][−2.908][−0.034][3.338][3.579]
mods_it−113.5496.660.6661.083 ***1.280 ***0.0650.247 **
[0.592][0.669][0.249][6.195][5.383][0.766][2.453]
mods_it*d06−115.9368.722.021−0.161−0.0180.03−0.091
[0.882][1.109][0.958][−1.169][−0.097][0.443][−1.150]
mofs_it−1−210.96 **−85.809 **−27.825 ***1.325 *−1.3950.092−1.103 ***
[−2.351][−2.199][−2.658][1.932][−1.497][0.276][−2.796]
mofs_it*d06−1−53.719−23.444−9.343−0.5310.585−0.1930.749 ***
[−1.030][−1.034][−1.535][−1.333][1.079][−0.990[3.267]
pcy25.092 **10.586 **4.430 ***0.149 **0.0630.125 ***0.140 ***
[2.531][2.455][3.829][1.962][0.611][3.377][3.207]
adj. R^20.990.9910.9760.9730.9460.9690.959
(c) Interactions between professional service inputs and manufacturing exports and inputs.
mexmodmmofmmods_prmods_pr *d06mofs_prmofs_pr *d06
mex−10.887 **0.0080.07−0.013 ***−0.013 ***0.0060.006
[2.386][0.047][1.510][−3.427][−2.801][1.329][0.983]
modm−11.306 **1.456 ***−0.0230.041 ***0.044 ***00.001
[1.994][5.150][−0.282][6.289][5.427][0.048][0.124]
mofm−15.666 ***2.055 ***1.760 ***0.073 ***0.078 ***0.087 ***0.074 ***
[3.324][2.793][8.313][4.291][3.698][3.974][2.580]
mods_pr−1−28.931−19.286 *−2.0841.119 ***1.081 ***−0.0770.673
[−1.097][−1.695][−0.636][4.248][3.322][−0.228][1.513]
mods_pr*d06−12.4667.0370.357−0.540 **−0.540 *−0.140−0.921 **
[0.093][0.613][0.108][−2.032][−1.646][−0.409][−2.054]
mofs_pr−1−84.806 **−29.662 **−13.567 ***−1.176 ***−1.473 ***−0.532−1.280 **
[−2.510][−2.034][−3.232][−3.484][−3.533][−1.225][−2.247]
mofs_pr*d06−1−2.893−4.349−0.4530.397 **0.678 ***0.0511.038 ***
[−0.171][−0.596][−0.216][2.350][3.249][0.234][3.644]
pcy45.425 ***20.759 ***5.925 ***0.222 **0.1910.561 ***0.590 ***
[4.625][4.897][4.856][2.266][1.579][4.440][3.561]
adj. R^20.9910.9920.9760.9940.9910.9780.963
(d) Interactions between business service inputs and exports and manufacturing inputs.
sexsodmsofmsodssods *d06sofssofs *d06
sex−13.247 ***0.350 ***0.093 ***1.396 ***2.473 ***0.178 ***0.243 ***
[4.658][4.525][3.096][3.024][4.024][3.948][4.619]
sodm−1−3.776 ***0.324 ***−0.164 ***−2.033 ***−3.399 ***−0.285 ***−0.388 ***
[−3.504][2.713][−3.521][−2.848][−3.578][−4.083][−4.771]
sofm−1−1.7410.3270.775 ***−2.027−3.720−0.171−0.351
[−0.457][0.773][4.711][−0.802][−1.107][−0.694][−1.220]
sods−1−2.304 ***−0.372 ***−0.093 ***−0.416−2.058 ***−0.174 ***−0.242 ***
[−3.203][−4.662][−3.007][−0.874][−3.246][−3.729][−4.465]
sods*d06−10.07870.0270.0010.0210.541 ***−0.002−0.007
[0.457][1.420][0.135][0.184][3.562][−0.208][−0.513]
sofs−1−4.569−0.971 ***−0.170−2.451−2.6410.482 **−0.111
[−1.546][−2.965][−1.335][−1.252][−1.014][2.518][−0.490]
sofs*d06−1−2.082−0.357 *−0.084−1.116−1.831−0.0480.605 ***
[−1.204][−1.862][−1.120][−0.974][−1.201][−0.425][4.643]
pcy5.647 **0.980 ***0.277 ***3.094 **5.290 **0.294 *0.626 ***
[2.373][3.714][2.699[1.962][2.522][1.908][3.489]
adj. R^20.9870.9860.9580.990.9830.9650.959
(e) Interactions among IT service inputs, business service exports, and manufacturing inputs.
sexsodmsofmsods_itsods_it *d06sofs_itsofs_it *d06
sex−10.834 ***−0.016−0.0000.015−0.0030.001−0.000
[4.353][−0.711][−0.008][0.629][−0.096][0.914][−0.485]
sodm−10.7040.966 ***−0.0310.0450.192−0.0040
[0.517][6.100][−0.538][0.259][0.818][−0.869][0.037]
sofm−11.2310.477 **0.950 ***−0.923 ***−0.798 **−0.0070.001
[0.602][2.002][10.903][−3.560][−2.267][−0.911][0.078]
sods_it−10.730.0120.0011.232 ***0.911 ***0.0020.007
[0.974][0.143][0.025][12.977][7.062][0.676][2.174]
sods_it*d06−1−0.1420.0380.008−0.196 ***0.228 **−0.003−0.004 **
[−0.259][0.602][0.354][−2.832][2.421][−1.295][−2.022]
sofs_it−10.134−2.905−0.66411.184 ***9.276 *0.722 ***0.064
[0.004][−0.781][−0.488][2.762][1.686][6.296][0.502]
sofs_it*d06−1−22.679−3.404−1.145−2.3610.9820.0030.745 ***
[−0.963][−1.242][−1.143][−0.791][0.242][0.030][7.898]
pcy4.932 *0.847 ***0.260 **−0.069−0.1990.025 ***0.041 ***
[1.880][2.772][2.323][−0.208][−0.440][2.692][3.880]
adj. R^20.9860.9840.9560.9910.98360.9440.937
(f) Interactions among professional service inputs, business service exports, and manufacturing inputs.
sexsodmsofmsods_prsods_pr *d06sofs_prsofs_pr *d06
sex−11.114 ***0.0190.012 **0.035 ***0.039 ***0.005 ***0.004 **
[8.378][1.201][2.114][4.916][4.869][3.566][2.401]
sodm−1−0.6430.777 ***−0.065−0.057−0.033−0.026 ***−0.023 *
[−0.631][6.524][−1.496][−1.051][−0.537][−2.623][−1.951]
sofm−1−0.8940.3830.922 ***−0.254−0.2320.0370.027
[−0.284][1.039][6.880][−1.517][−1.221][1.230][0.757]
sods_pr−1−7.245 *−1.220 **−0.1970.154−0.396−0.001−0.010
[−1.726][−2.485][−1.102][0.690][−1.564][−0.037][−0.203]
sods_pr*d06−15.4750.988 *0.080.3780.846 ***−0.024−0.017
[1.262][1.947][0.430][1.642][3.234][−0.579][−0.354]
sofs_pr−124.2081.714−0.373−0.563−0.8610.388−0.035
[0.909][0.550][−0.328][−0.398][−0.536][1.517][−0.117]
sofs_pr*d06−1−25.141−3.272−0.392−0.880−0.6060.2190.815 ***
[−1.427][−1.588][−0.522][−0.940][−0.571][1.292][4.073]
pcy3.6040.630 **0.204 **0.405 ***0.426 ***0.0190.046 *
[1.593][2.382][2.115][3.366][3.120][0.857][1.796]
adj. R^20.9860.9840.9560.9810.9770.9630.954
Sources: authors’ estimation. Note: *, **, and *** denote rejection of the null hypothesis at 90%, 95%, and 99% levels, respectively. The t-statistics are shown in parentheses.
Table 6. Block exogeneity test results.
(a) Causalities between business service inputs and manufacturing exports and inputs.
Dependent VariableExcludedChi-sqdfProbability
mexmodm010.996
mofm8.91910.003
mods17.04910.000 (negative)
mofs4.51210.034 (negative)
modmmex3.08110.079
mods19.33510.000 (negative)
mofs4.61810.032 (negative)
mofmmex3.0310.082
mods9.07310.003 (negative)
mofs4.87310.027 (negative)
modsmex0.73610.391
modm2.29810.13
mofm5.66910.017
mods*d06mex2.29310.13
modm0.06810.794
mofm3.32110.068
mofsmex5.72910.017
modm1.78110.182
mofm12.32910
mofs*d06mex5.87810.015
modm2.71110.1
mofm6.54910.011
(b) Causalities between IT service inputs and manufacturing exports and inputs.
Dependent VariableExcludedChi-sqdfProbability
mods_itmex0.19710.657
modm0.97810.323
mofm8.45710.004 (negative)
mods_it*d06mex0.00110.977
modm0.66310.416
mofm0.00110.973
mofs_itmex0.57210.449
modm1.41910.234
mofm11.14410.001
mofs_it*d06mex010.997
modm0.1910.663
mofm12.80610
(c) Causalities between professional service inputs and manufacturing exports and inputs.
Dependent VariableExcludedChi-sqdfProbability
mods_prmex11.74210.001 (negative)
modm39.55510
mofm18.41610
mods_pr*d06mex7.84610.005 (negative)
modm29.44910
mofm13.67410
mofs_prmex1.76710.184
modm0.00210.962
mofm15.7910
mofs_pr*d06mex0.96610.326
modm0.01510.901
mofm6.65710.01
(d) Causalities among business service, IT service, and professional service inputs, business service exports, and manufacturing inputs.
Dependent VariableExcludedChi-sqdfProbability
sexsodm12.27610.001 (negative)
sofm0.20810.648 (negative)
sods10.25610.001 (negative)
sodm2.39110.122 (negative)
sodmsex20.47810
sods21.7310.000 (negative)
sofs8.78910.003 (negative)
sofmsex9.58410.002
sods9.03910.003 (negative)
sofs1.78210.182 (negative)
sodssex9.14210.003
sods*d0616.19310
sofs15.58410
sofs*d0621.33810
sods_itsex0.39610.529
sods_it*d060.00910.924
sofs_it0.83610.361
sofs_it*d060.23510.628
sods_prsex24.16410
sods_pr*d0623.71110
sofs_pr12.71810
sofs_pr*d065.76610.016
Sources: authors’ estimation.
Disclaimer/Publisher’s Note: The statements, opinions and data contained in all publications are solely those of the individual author(s) and contributor(s) and not of MDPI and/or the editor(s). MDPI and/or the editor(s) disclaim responsibility for any injury to people or property resulting from any ideas, methods, instructions or products referred to in the content.

