
Convergence and Divergence Tendencies in the European Union: New Evidence on the Productivity/Institutional Puzzle


Abstract
1. Introduction
2. Theoretical Background
3. Methodology and Data
3.1. Productivity and Institutions
- 1.
- WGI1—Voice and Accountability;
- 2.
- WGI2—Political Stability and Absence of Violence/Terror;
- 3.
- WGI3—Government Effectiveness;
- 4.
- WGI4—Regulatory Quality;
- 5.
- WGI5—Rule of Law;
- 6.
- WGI6—Control of Corruption;
3.2. Econometric Specifications
- 7.
- Cross-sectional ordering;
- 8.
- Core group formation;
- 9.
- Sieving individuals for new club members;
- 10.
- Recursion and stopping rule;
- 11.
- Club merging.
3.3. Data
4. Results and Discussion
5. Conclusions
Author Contributions
Funding
Informed Consent Statement
Data Availability Statement
Conflicts of Interest
Appendix A

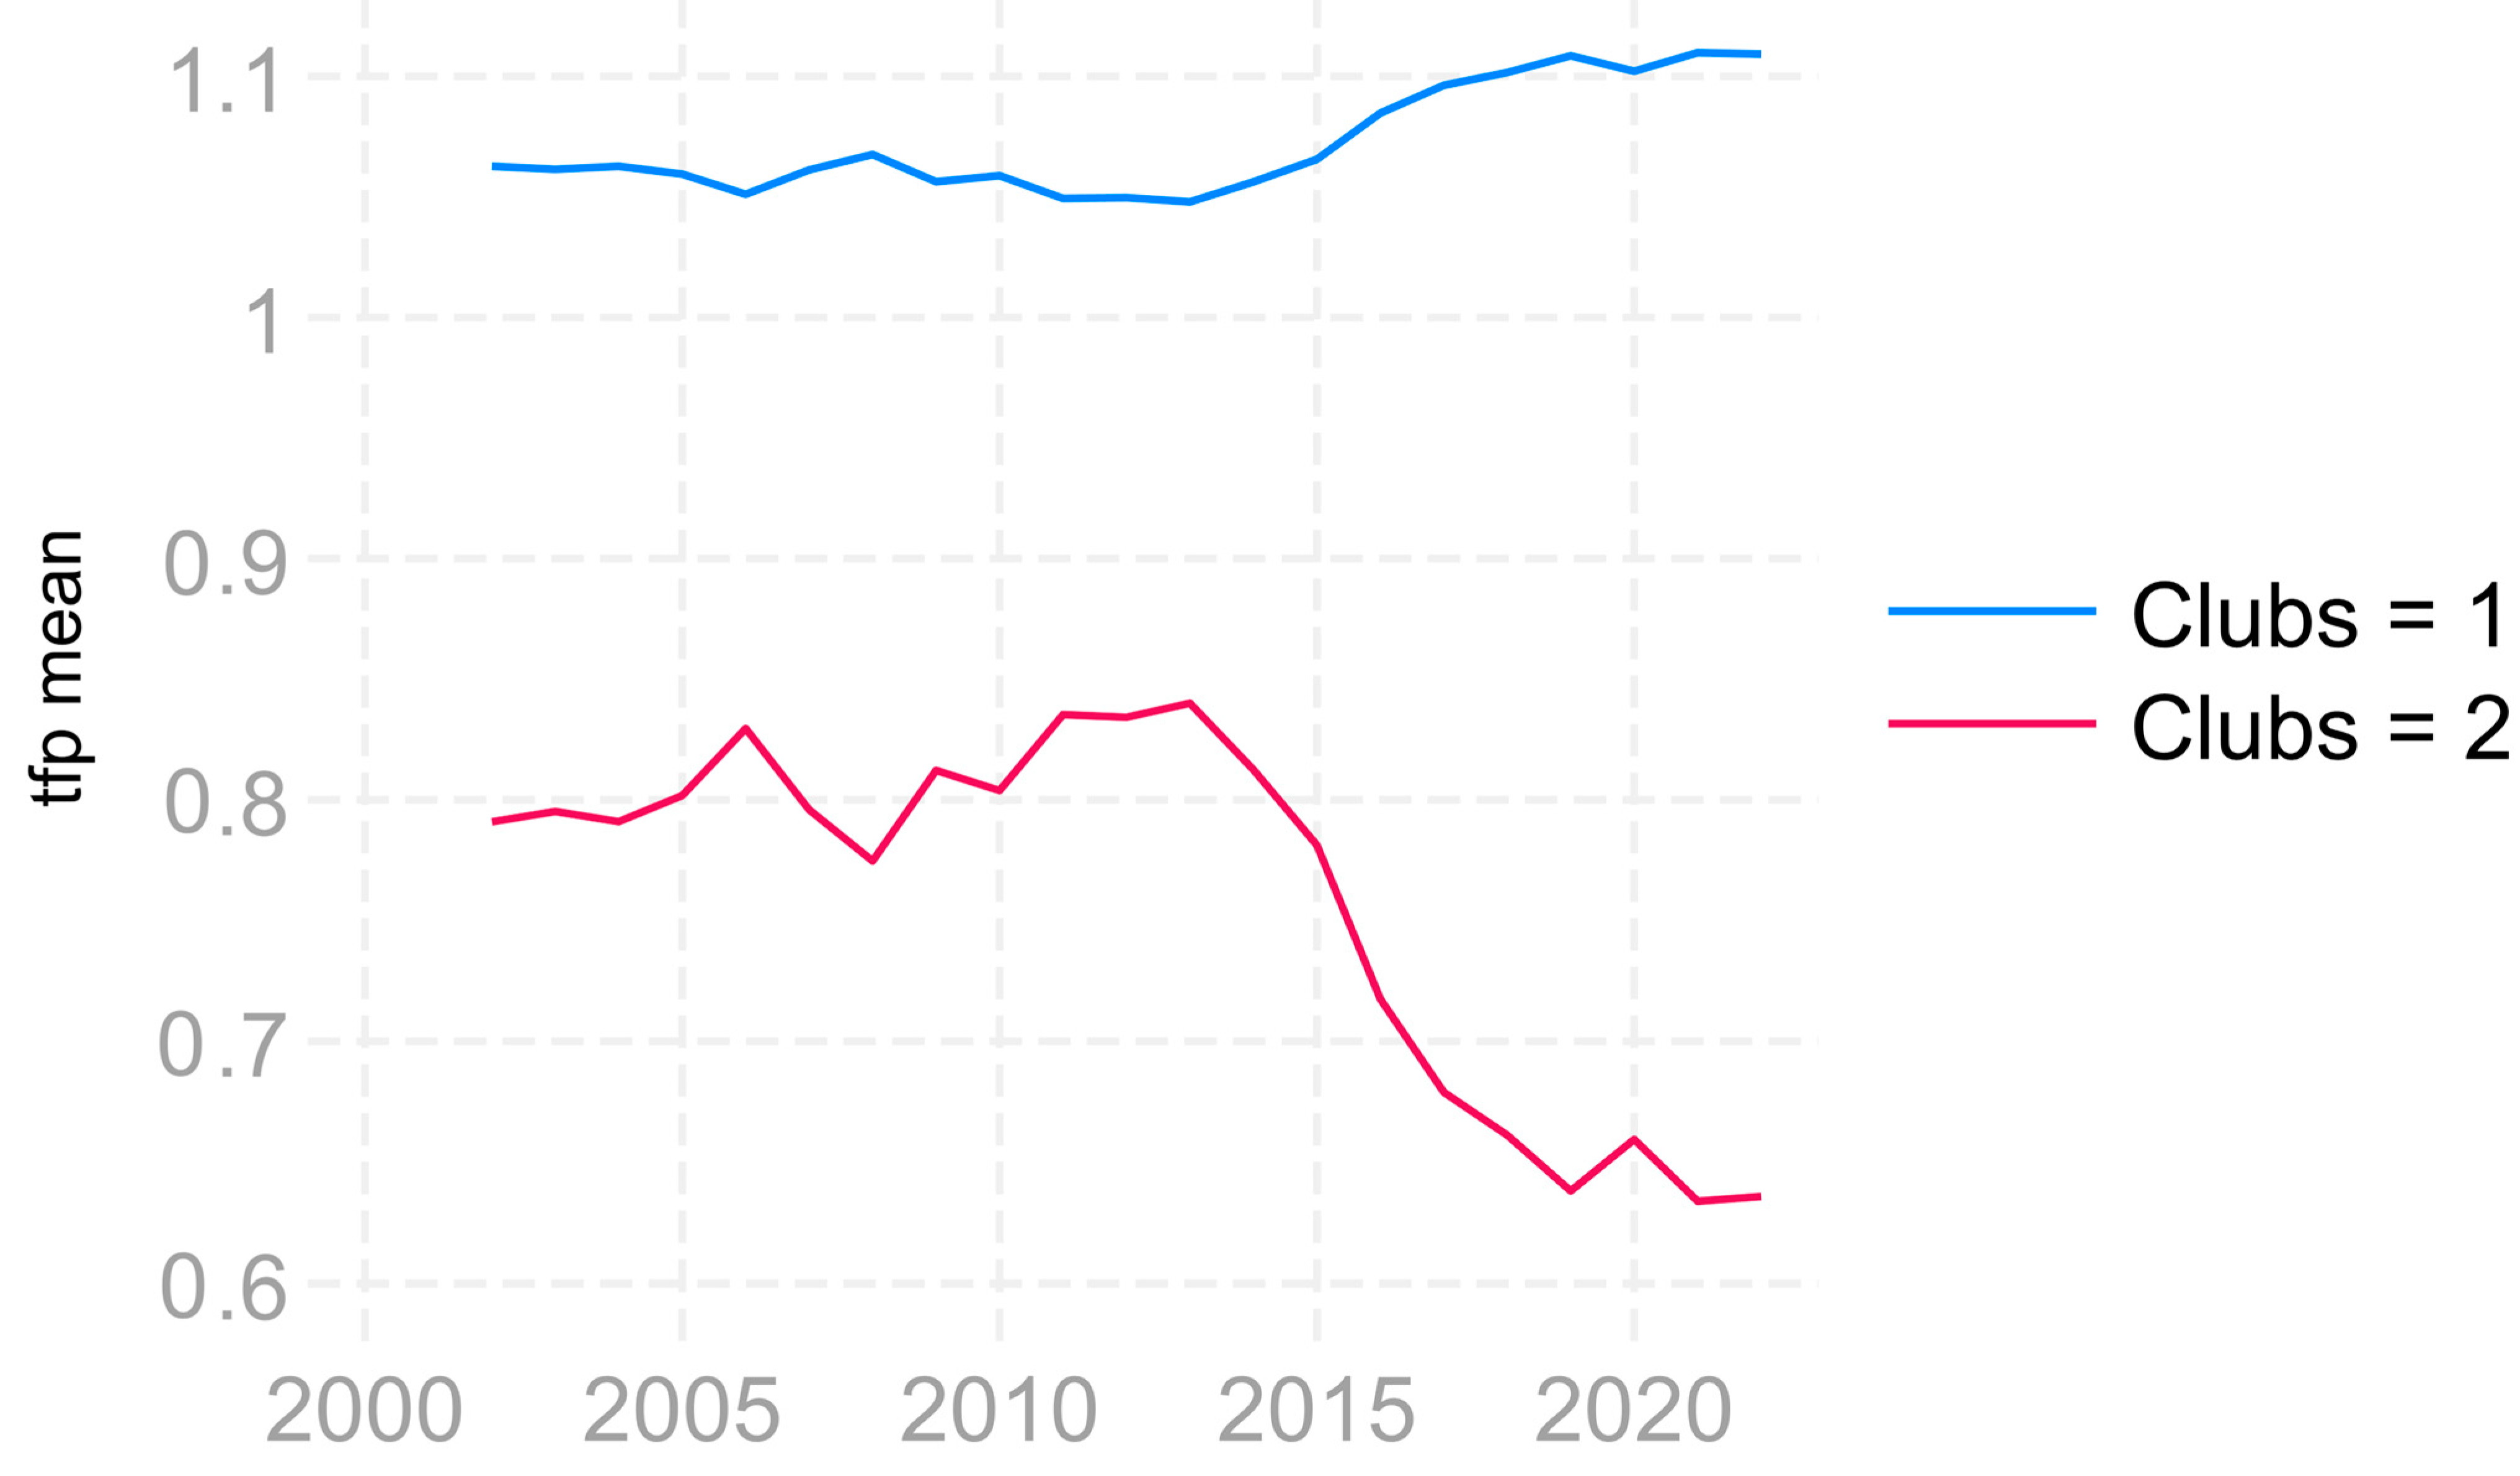
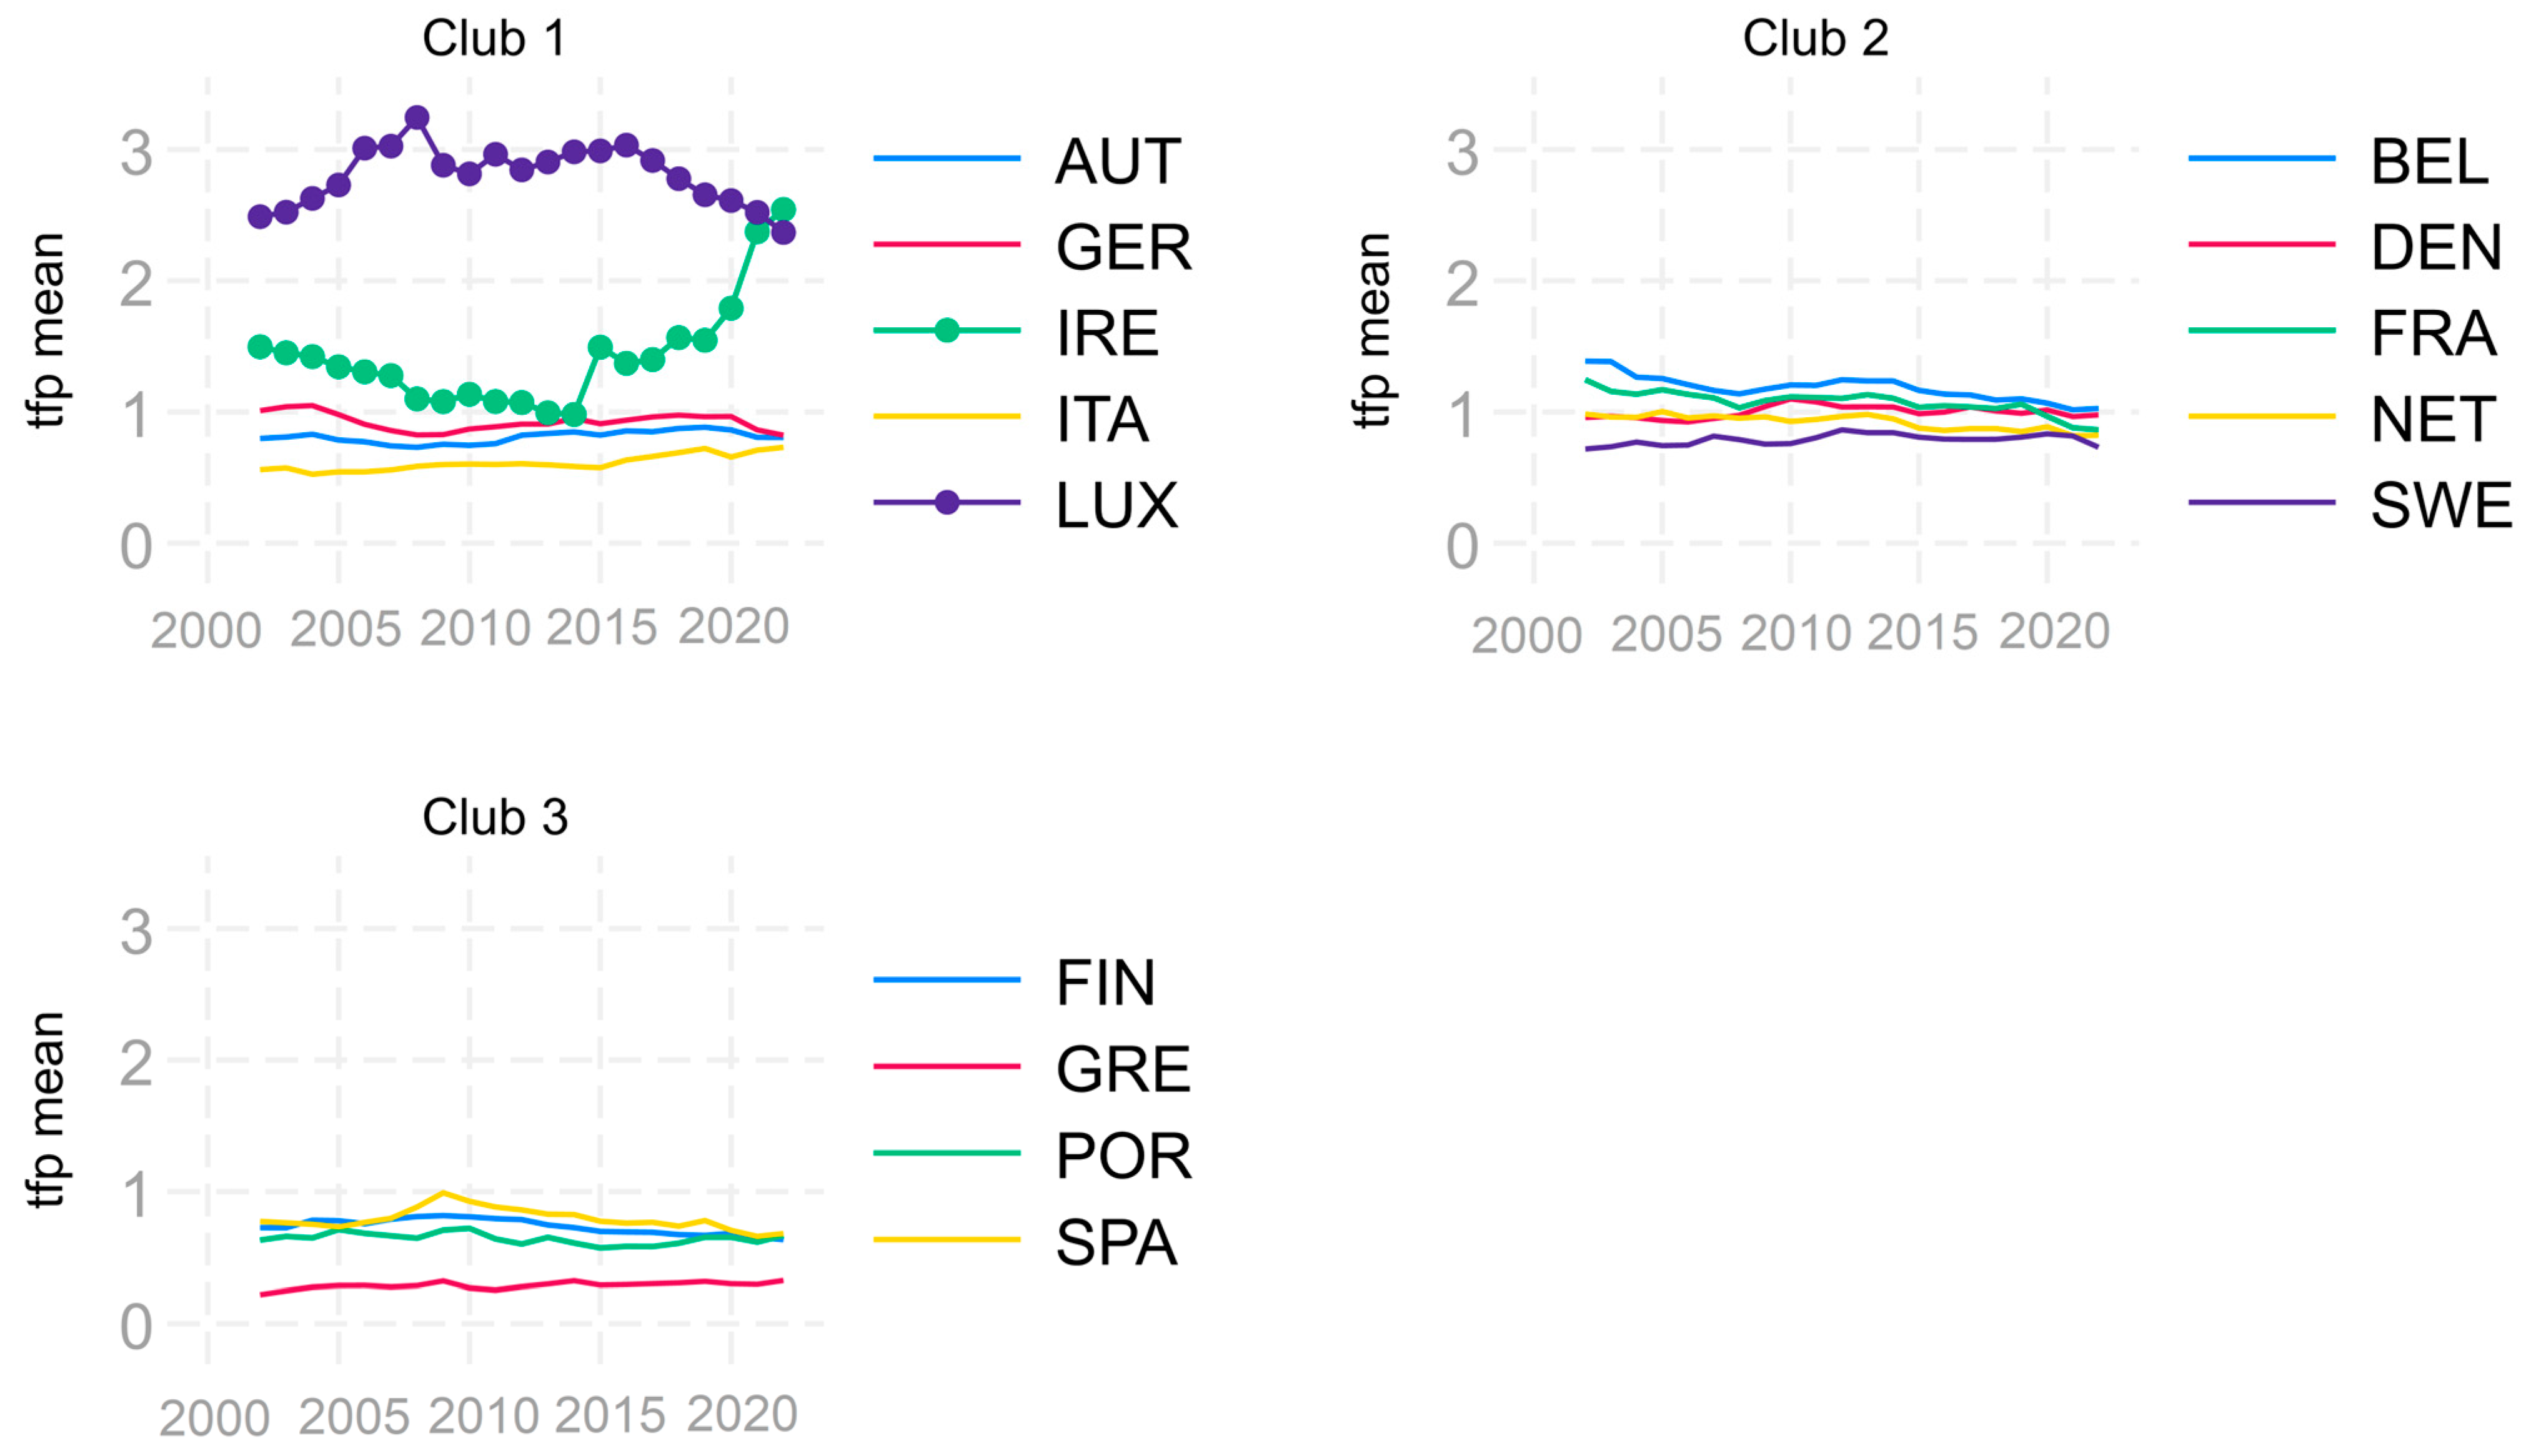
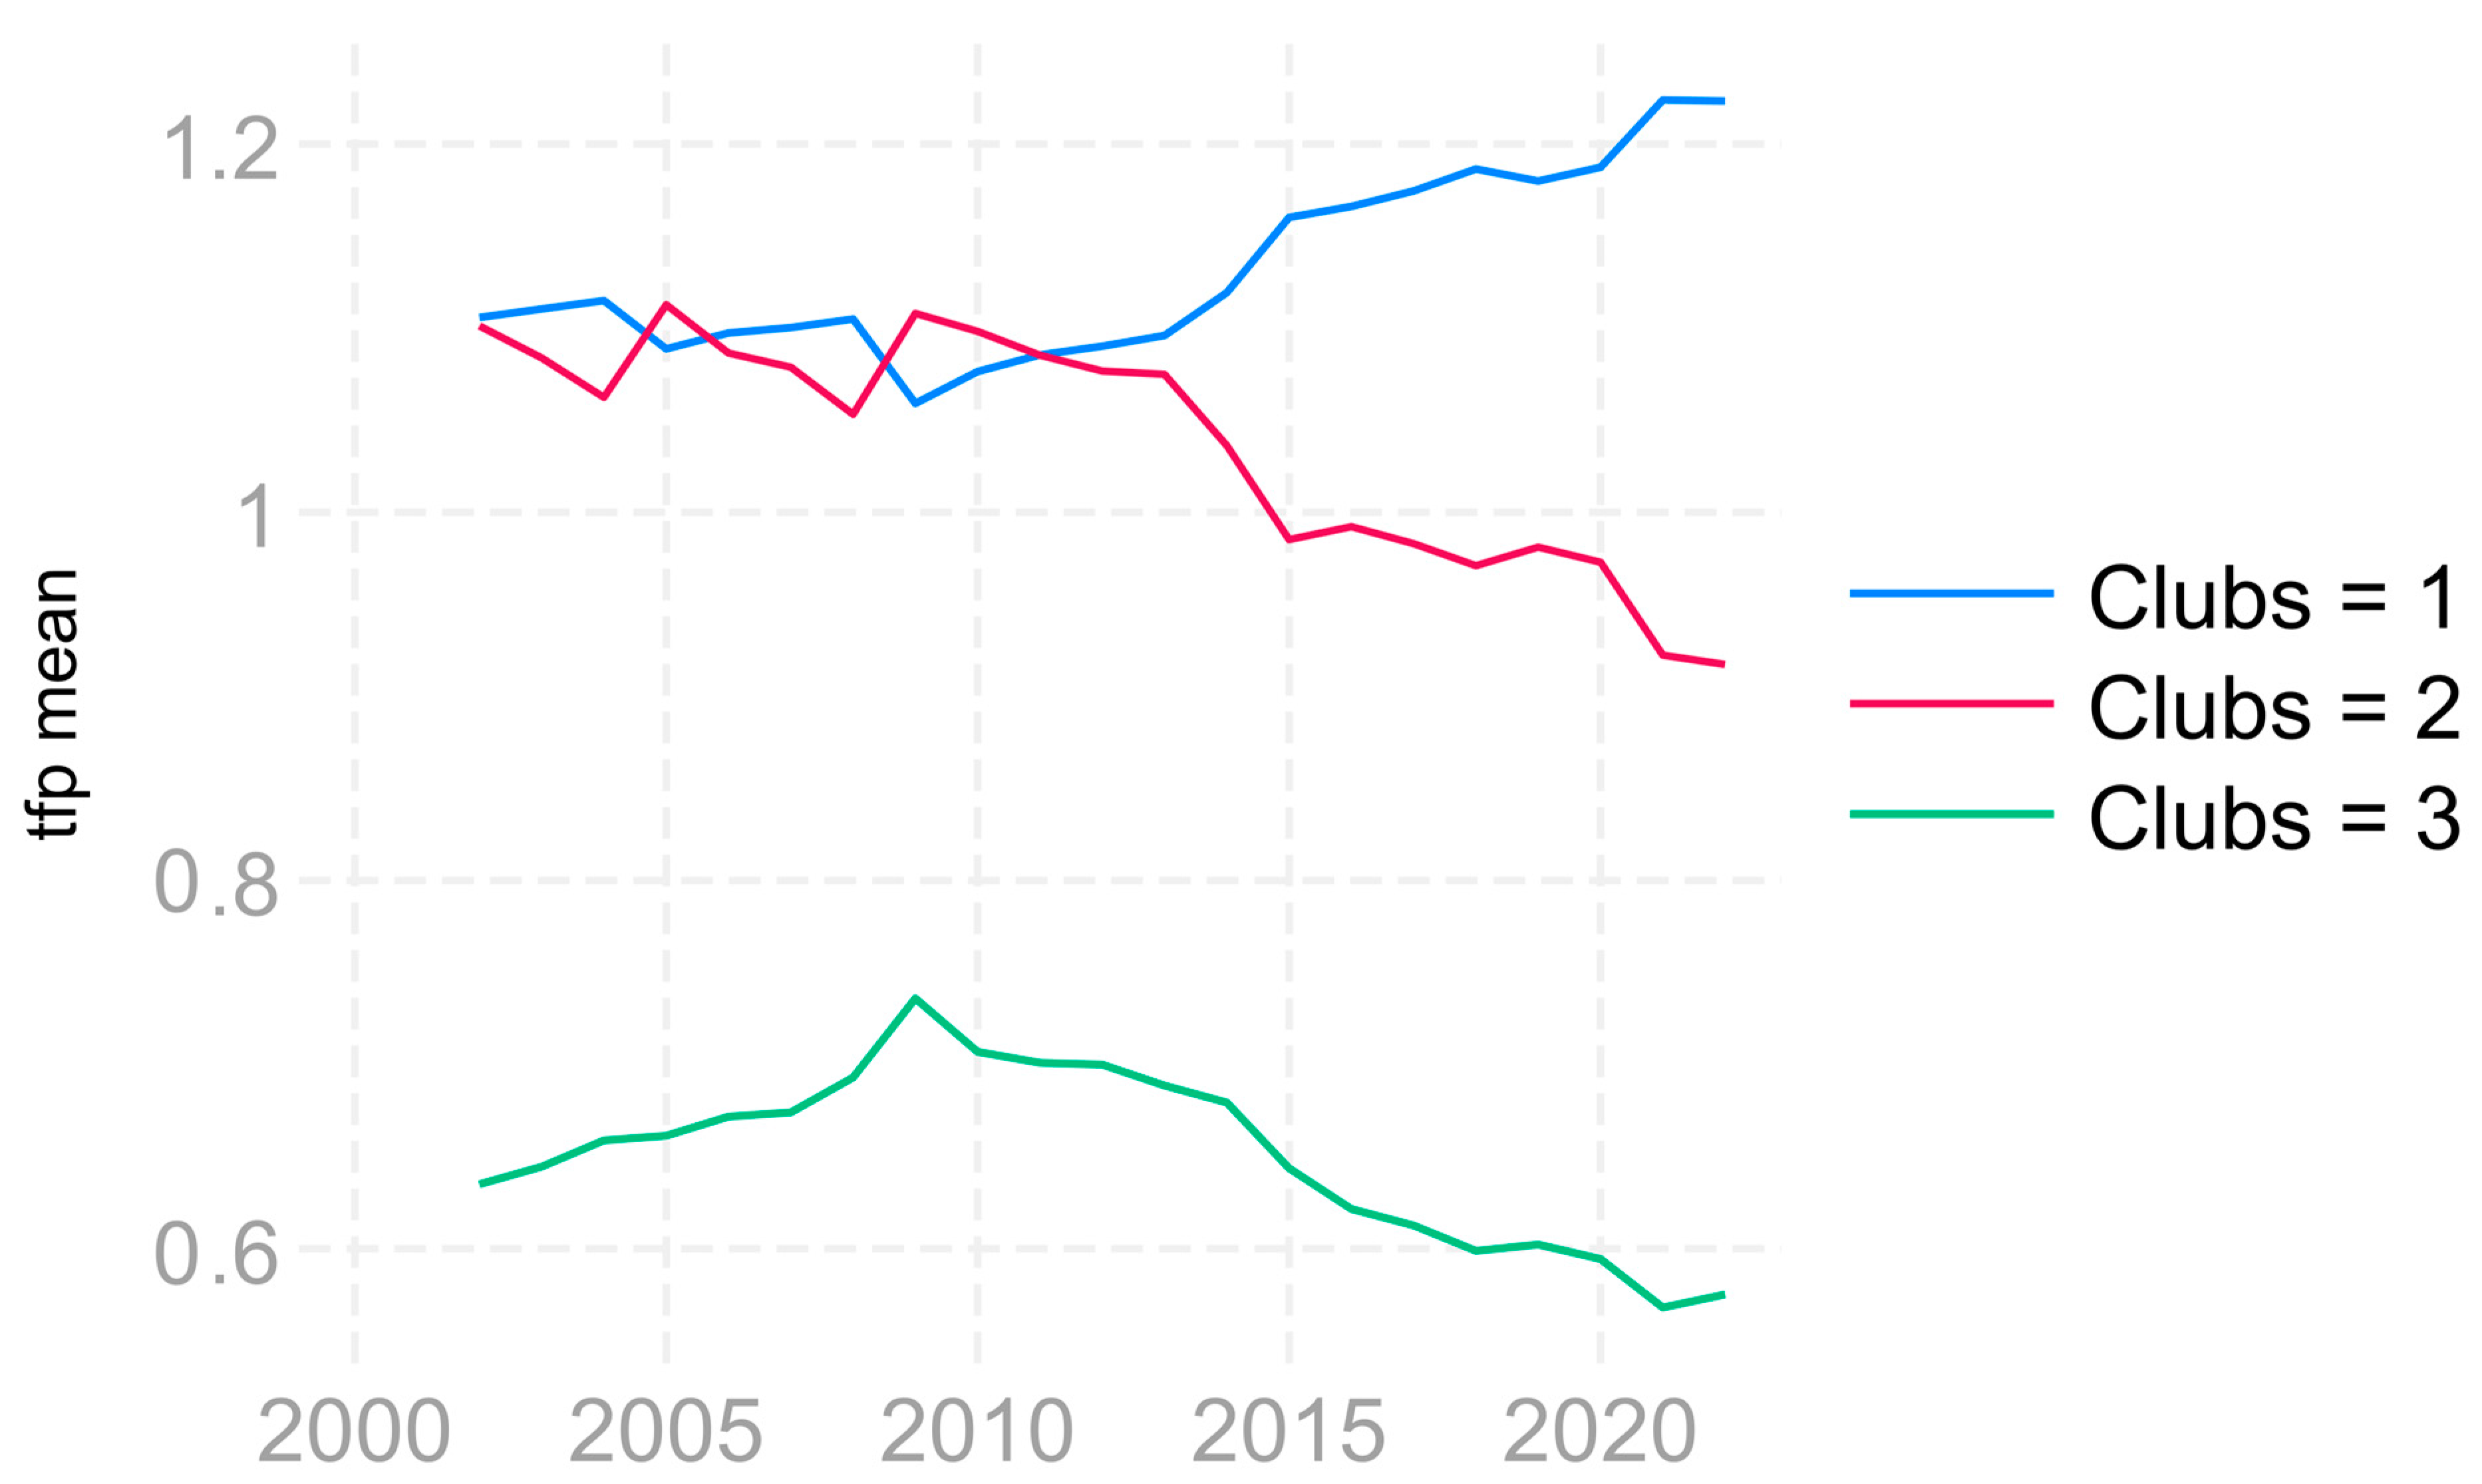
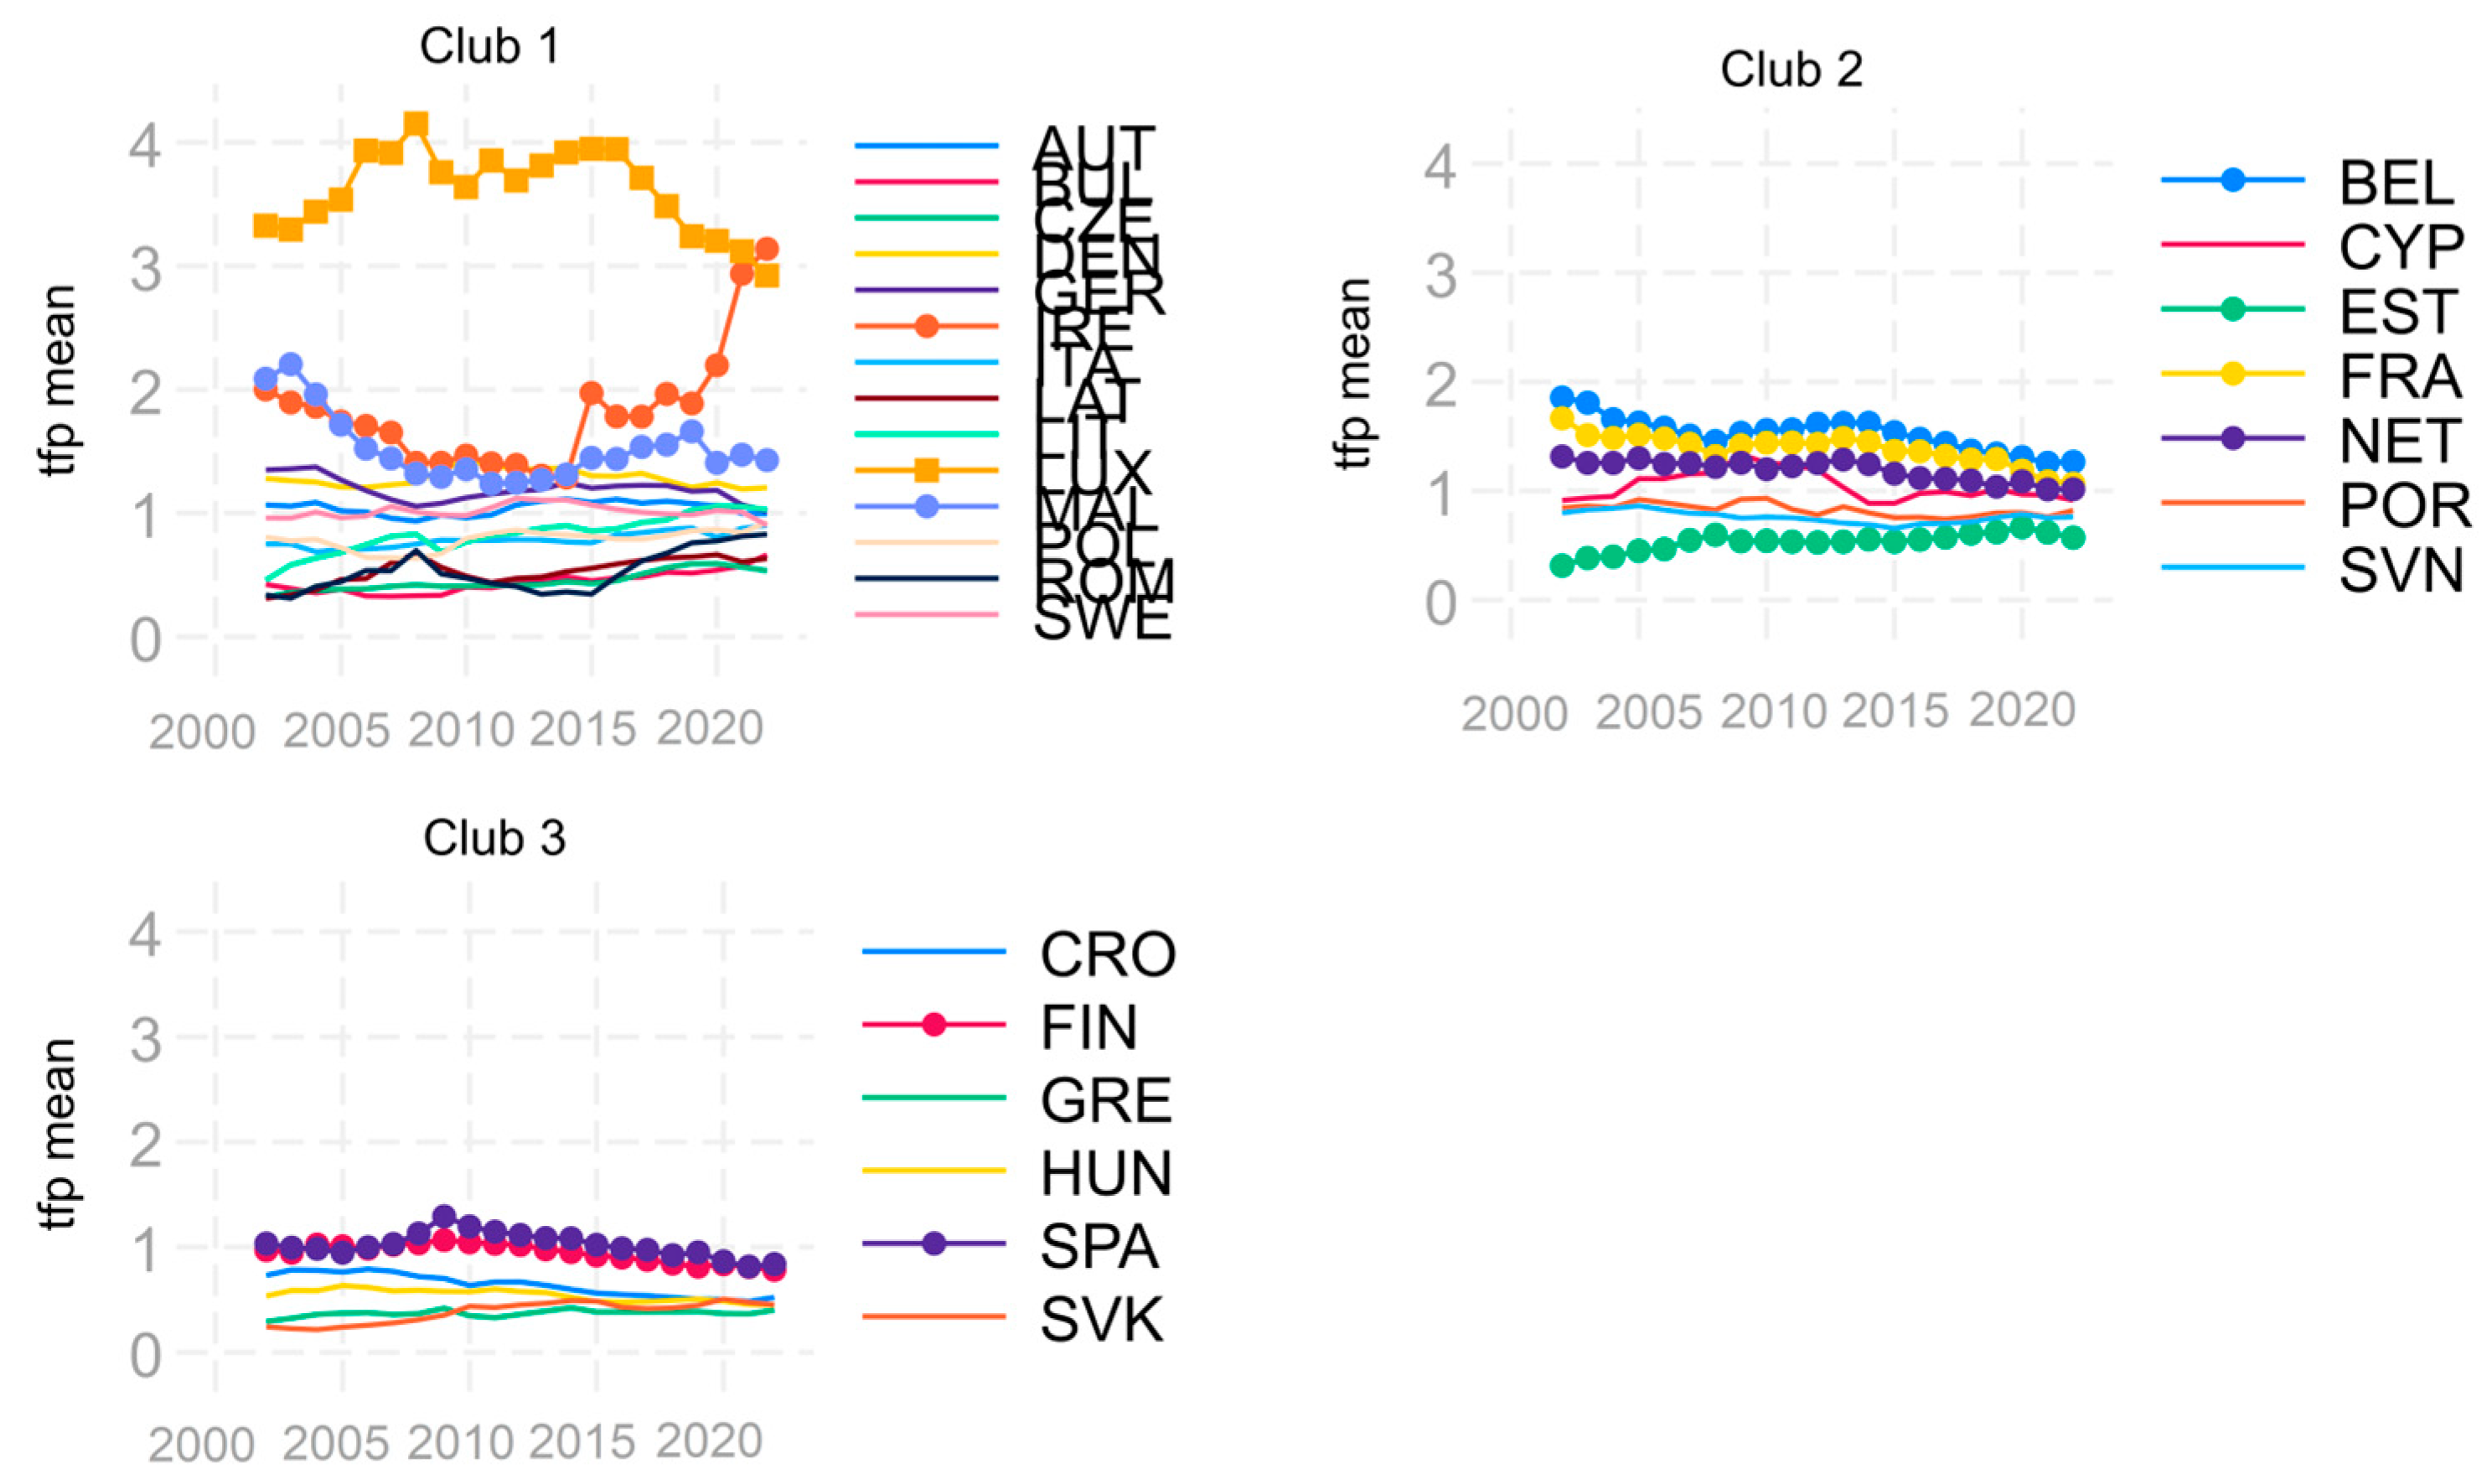
| TFP EU14 | |||
| Clubs | Countries | b | T-stat |
| Club1 (5) | AUT GER IRE ITA LUX | −0.223 | −1.628 |
| Club2 (5) | BEL DEN FRA NET SWE | −0.011 | −0.054 |
| Club3 (4) | FIN GRE POR SPA | −0.070 | −0.775 |
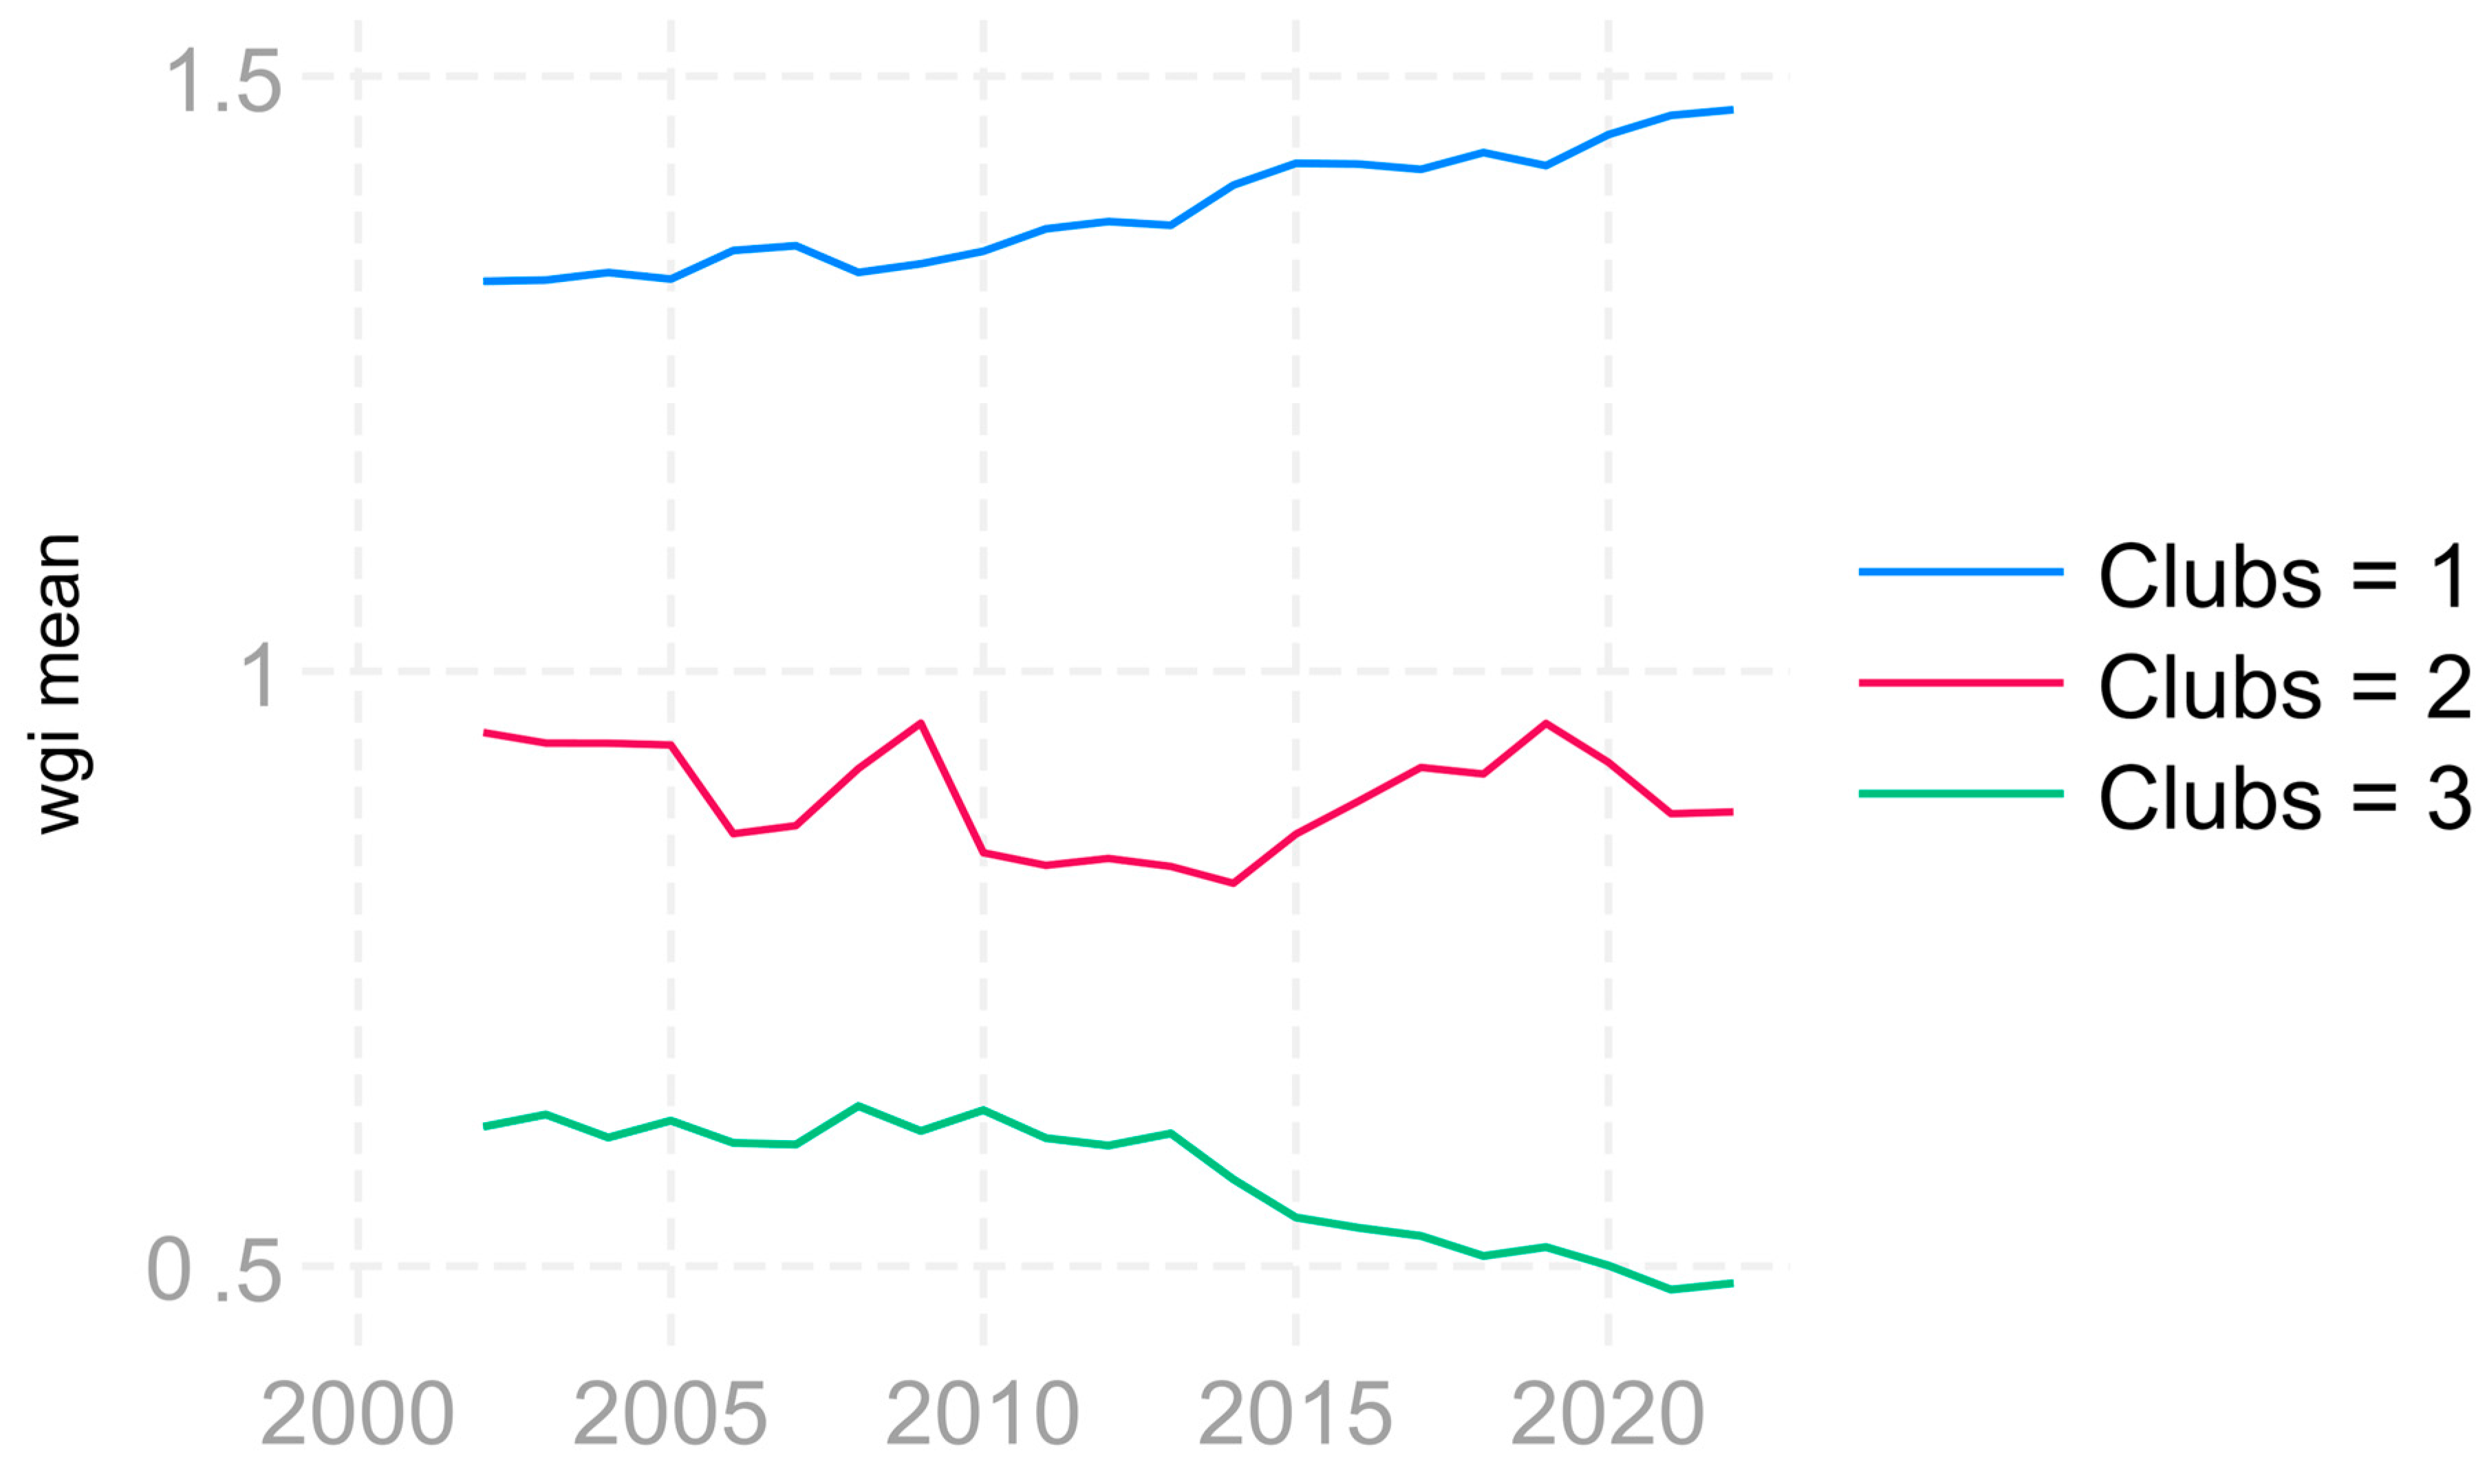
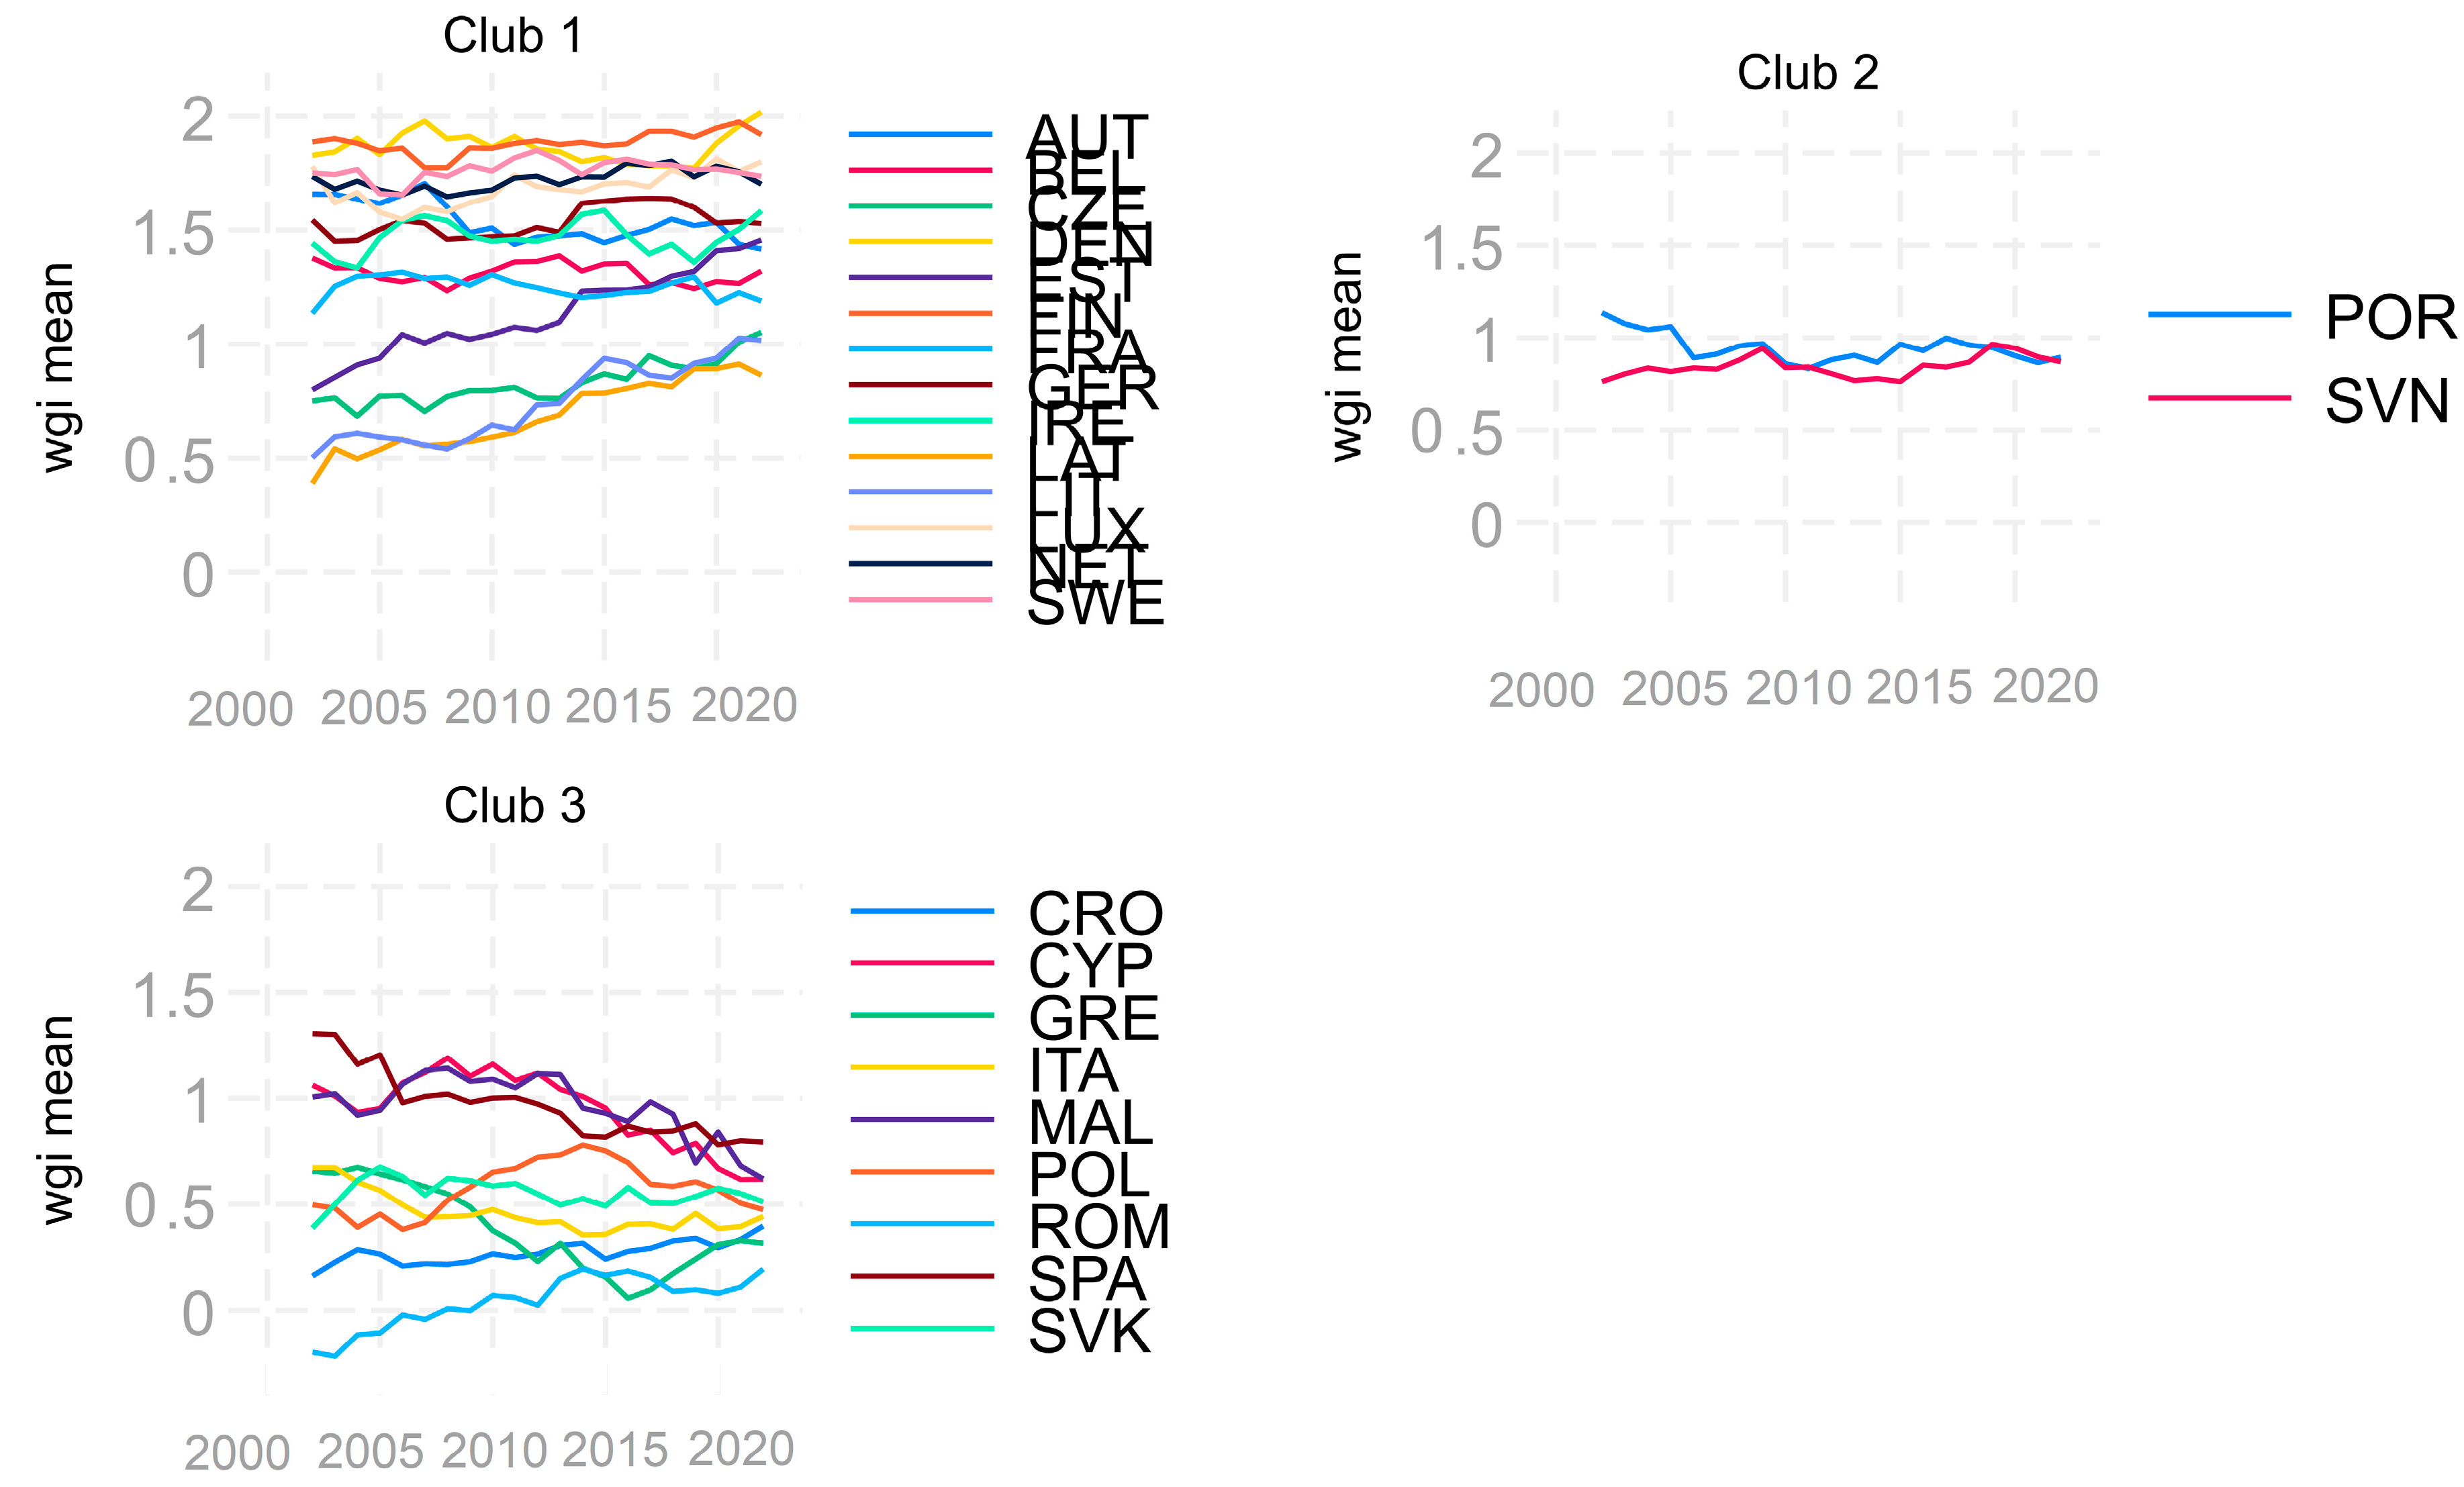
| WGI EU14 | |||
| Clubs | Countries | b | T-stat |
| Club1 (6) | DEN FIN GER LUX NET SWE | −0.282 | −0.682 |
| Club2 (2) | AUT BEL | −1.632 | −1.594 |
| Club3 (2) | FRA IRE | −1.120 | −1.130 |
| Club4 (2) | GRE ITA | −2.492 | −1.365 |
| Not convergent group (2) | POR SPA | −2.596 | −1.992 |
| WGI3 EU14 | |||
| Clubs | Countries | b | T-stat |
| Club1 (8) | AUT DEN FIN GER IRE LUX NET SWE | −0.272 | −0.639 |
| Club2 (2) | BEL FRA POR SPA | 0.951 | 2.516 |
| Club3 (2) | GRE ITA | 1.048 | 0.286 |
| WGI4 EU14 | |||
| Clubs | Countries | b | T-stat |
| Club1 (6) | DEN FIN GER LUX NET SWE | −0.205 | −1.106 |
| Club2 (3) | AUT BEL IRE | −0.123 | −0.165 |
| Club3 (2) | POR SPA | 2.486 | 0.931 |
| Club4 (2) | GRE ITA | −1.585 | −0.291 |
| Not convergent group (1) | FRA | ||
| WGI5 EU14 | |||
| Clubs | Countries | b | T-stat |
| Club1 (5) | AUT DEN LUX NET SWE | −0.899 | −1.466 |
| Club2 (5) | BEL FRA GER IRE POR | 0.295 | 0.987 |
| Club3 (2) | GRE ITA | −2.291 | −1.178 |
| Not convergent group (2) | SPA FIN | −1.801 | −9.006 |
| WGI6 EU14 | |||
| Clubs | Countries | b | T-stat |
| Club1 (6) | DEN FIN GER LUX NET SWE | −0.298 | −0.882 |
| Club2 (5) | AUT BEL FRA IRE ITA | −0.256 | −1.138 |
| Club3 (2) | GRE POR SPA | −0.379 | −0.716 |
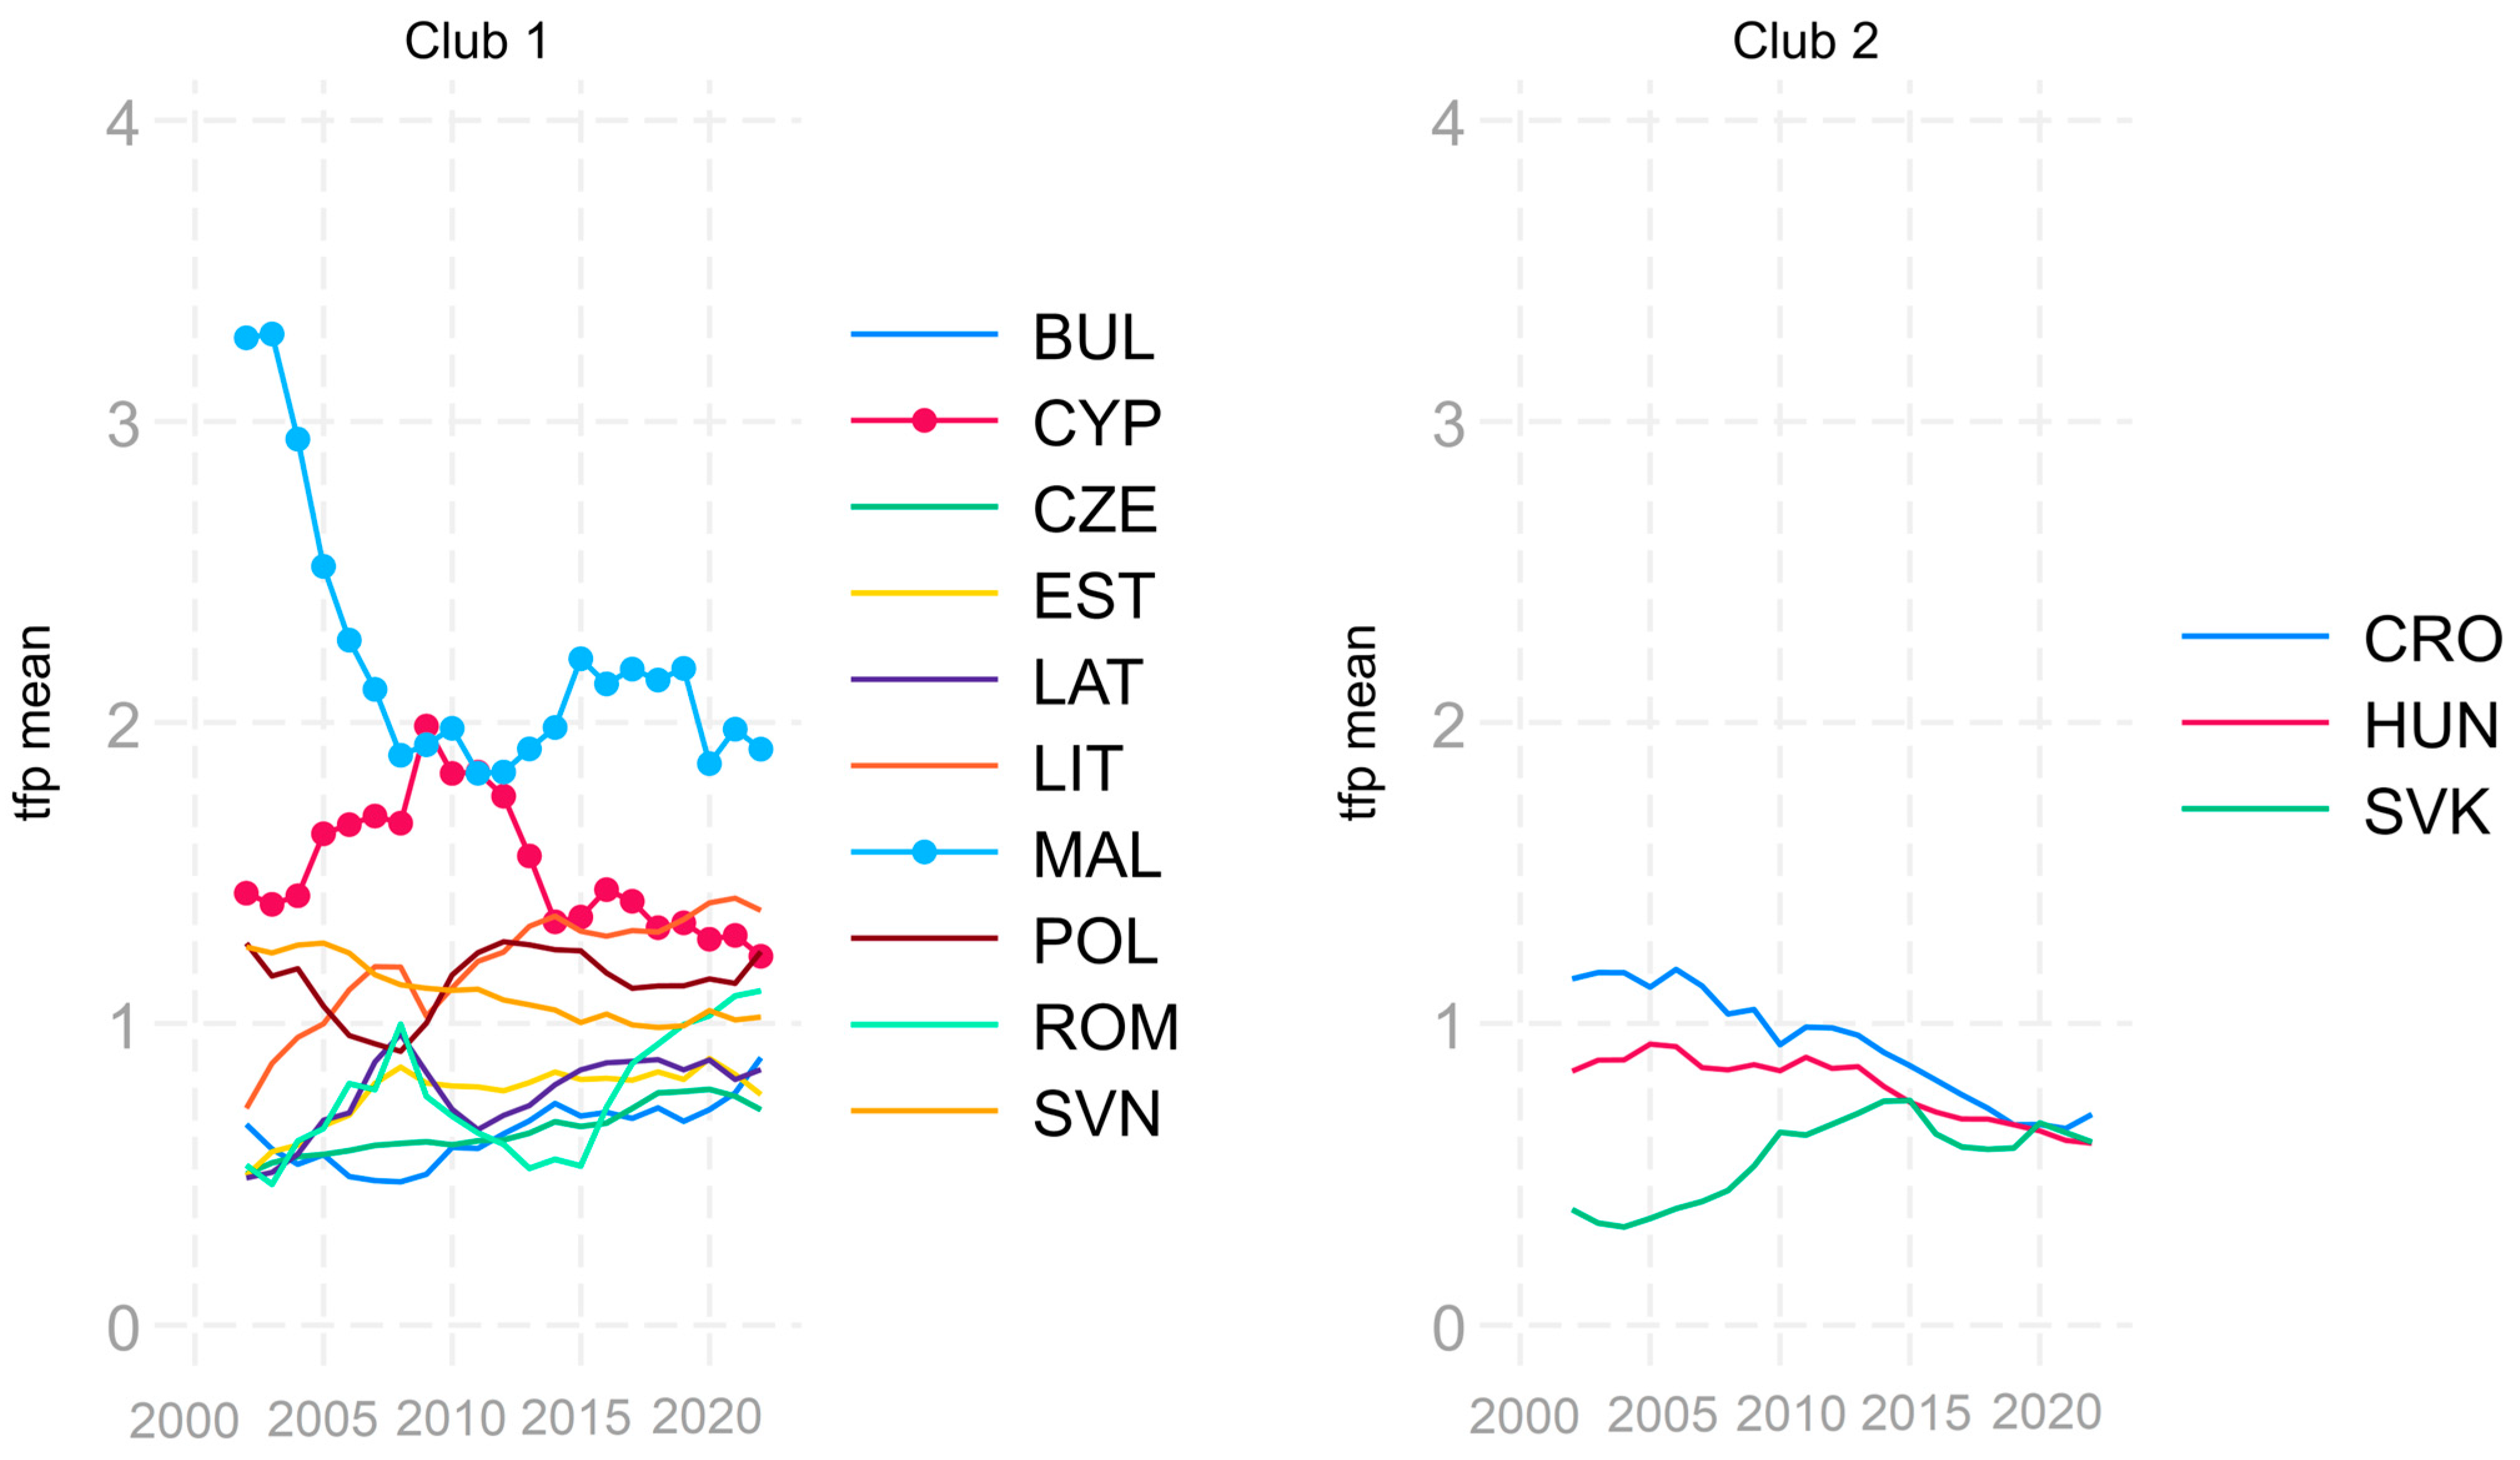
| TFP EU13 | |||
| Clubs | Countries | b | T-stat |
| Club1 (10) | AUT GER IRE ITA LUX | 0.022 | 0.158 |
| Club2 (3) | CRO HUN SVK | 3.171 | 3.456 |
| WGI EU13 | |||
| Clubs | Countries | b | T-stat |
| Club1 (6) | CYP CZE LAT LIT MAL SVN | 0.995 | 0.781 |
| Club2 (5) | CRO HUN POL ROM SVK | 0.141 | 0.694 |
| Not convergent group (2) | BUL EST | −1.034 | −5.092 |
| WGI3 EU13 | |||
| Clubs | Countries | b | T-stat |
| Club1 (7) | CYP CZE EST LAT LIT MAL SVN | 0.604 | 0.478 |
| Club2 (2) | CRO HUN | −0.154 | −0.091 |
| Club3 (2) | POL SVK | −0.811 | −0.289 |
| Club4 (2) | BUL ROM | −0.940 | −0.236 |
| WGI4 EU13 | |||
| Clubs | Countries | b | T-stat |
| Club1 (4) | CZE EST LAT LIT | 0.135 | 0.272 |
| Club2 (6) | CRO CYP MAL POL SVK SVN | 0.356 | 0.562 |
| Club3 (3) | BUL HUN ROM | 0.795 | 1.575 |
| WGI5 EU13 | |||
| Clubs | Countries | b | T-stat |
| Club1 (11) | CRO CYP CZE HUN LAT LIT MAL POL ROM SVK SVN | 0.000 | 0.001 |
| Not convergent group (2) | BUL EST | −0.734 | −5.911 |
| WGI6 EU13 | |||
| Clubs | Countries | b | T-stat |
| Club1 (11) | BUL CRO CYP CZE LAT LIT MAL POL ROM SVK SVN | 0.176 | 0.973 |
| Not convergent group (2) | EST HUN | −2.662 | −16.488 |


| 1 | For more detailed explanation of clustering algorithm steps see Mendez (2020), Glawe and Wagner (2021a), and Phillips and Sul (2007, 2009). |
References
- Acemoglu, Daron, and James A. Robinson. 2012. Why Nations Fail: The Origins of Power, Prosperity, and Poverty. New York: Crown Publishers. [Google Scholar]
- Acemoglu, Daron, Simon Johnson, and James A. Robinson. 2001. The Colonial Origins of Comparative Development: An Empirical Investigation. American Economic Review 91: 1369–401. [Google Scholar] [CrossRef]
- Acemoglu, Daron, Simon Johnson, and James A. Robinson. 2005. Institutions as a Fundamental Cause of Long-Run Growth. In Handbook of Economic Growth. Amsterdam: Elsevier, Volume 1, Chapter 6, Part A. pp. 385–472. ISBN 9780444520418. [Google Scholar] [CrossRef]
- Apergis, Nicholas, Ekaterini Panopoulou, and Chris Tsoumas. 2010. Old Wine in a New Bottle: Growth convergence dynamics in the EU. Atlantic Economic Journal 38: 169–81. [Google Scholar] [CrossRef]
- Badalyan, Gohar, Thomas Herzfeld, and Miroslava Rajcaniova. 2016. Infrastructure, institutions, and economic productivity in transition countries. In International Scientific Days 2016. The Agri-Food Value Chain: Challenges for Natural Resources Management and Society. Conference Proceedings. Edited by Elena Horská, Zuzana Kapsdorferová and Marcela Hallová. Nitra: Slovak University of Agriculture, pp. 894–906. [Google Scholar]
- Barrios, Candelaria, Esther Flores, and M. Ángeles Martínez. 2019. Convergence clubs in Latin America. Applied Economics Letters 26: 16–20. [Google Scholar] [CrossRef]
- Basel, Sayel, K. U. Gopakumar, and R. Prabhakara Rao. 2020. Testing club convergence of economies by using a broad-based development index. GeoJournal 86: 2351–65. [Google Scholar] [CrossRef]
- Bernanke, Ben, and Refet S. Garkaynak. 2001. Is Growth Exogenous? Taking Mankiw, Romer, and Weil Seriously. NBER Macroeconomics Annual 16: 11–72. [Google Scholar] [CrossRef]
- Beyaert, Arielle, José García-Solanes, and Laura Lopez-Gomez. 2019. Do institutions of the euro area converge? Economic Systems 43: 100720. [Google Scholar] [CrossRef]
- Blackburn, Keith, Niloy Bose, and M. Emranul Haque. 2006. The Incidence and Persistence of Corruption in Economic Development. Journal of Economic Dynamics and Control 39: 2447–67. [Google Scholar] [CrossRef]
- Borović, Zoran. 2014a. Da li ekonomska sloboda utiče na privredni rast–primer dve zemlje zapadnog Balkana. Industrija 42: 57–70. [Google Scholar] [CrossRef]
- Borović, Zoran. 2014b. Does Economic Freedom impact Economic growth: Decomposing the Effects for Bosnia and Herzegovina. Acta Economica 12: 9–20. [Google Scholar] [CrossRef]
- Borović, Zoran, and Dragana Radicic. 2023. Productivity Gap between the “New” and “Old” Europe and Role of Institutions. Economies 11: 254. [Google Scholar] [CrossRef]
- Borović, Zoran, Dragan Gligoric, and Jelena Trivić. 2020. Impact of economic freedom on total factor productivity in former socialist countries. Economic Analysis 53: 95–108. [Google Scholar] [CrossRef]
- Bournakis, Ionnis. 2012. Sources of TFP growth in a framework of convergence-evidence from Greece. International Review of Applied Economics 26: 47–72. [Google Scholar] [CrossRef]
- Burda, Michael, and Batista Severgnini. 2008. Solow Residuals without Capital Stocks. (SFB 649 Discussion Paper 2008–040). Berlin: Humboldt-Universität zu Berlin. [Google Scholar]
- Calcagnini, Giorgio, Germana Giombini, and Giuseppe Travaglini. 2021. The Productivity Gap Among Major European Countries, USA and Japan. Società Italiana degli Economisti (Italian Economic Association) 7: 59–78. [Google Scholar] [CrossRef]
- Castrejon-Campos, Omar, Lu Aye, and Felix Kin Peng Hui. 2022. Dataset on effects of learning curve models on onshore wind and solar PV cost developments in the USA. Renewable and Sustainable Energy Reviews 160: 112278. [Google Scholar] [CrossRef]
- Comin, Diego. 2010. Total factor productivity. In Economic Growth. The New Palgrave Economics Collection. London: Palgrave Macmillan. [Google Scholar]
- DiPasquale, Giacomo. 2022. The Effects of International Immigration on Inequality in Host Countries: The Case of Italy. Journal of International Migration and Integration 23: 1793–824. [Google Scholar] [CrossRef]
- Escribá-Pérez, Francisco Javier, and María José Murgui García. 2019. Total Factor Productivity Convergence in European Regions: The Role of Sectors and Geographical Location, Regional and Sectoral Economic Studies. Euro-American Association of Economic Development 19: 29–46. [Google Scholar]
- EUROSTAT. 2024. Available online: https://ec.europa.eu/eurostat/data/database (accessed on 21 April 2024).
- Égert, Balázs. 2017. Regulation, Institutions, and Productivity: New Macroeconomic Evidence from OECD Countries. The American Economic Review 106: 109–13. Available online: http://www.jstor.org/stable/43860997 (accessed on 20 April 2024). [CrossRef]
- Felipe, Jesus, and John McCombie. 2020. The illusions of calculating total factor productivity and testing growth models: From Cobb-Douglas to Solow and Romer. Journal of Post Keynesian Economics 43: 470–513. [Google Scholar] [CrossRef]
- Feenstra, Robert, Robert Inklaar, and Marcel P. Timmer. 2015. The Next Generation of the Penn World Table. American Economic Review 105: 3150–82. Available online: https://www.rug.nl/ggdc/productivity/pwt/ (accessed on 20 April 2024). [CrossRef]
- Gallardo-Albarrán, Daniel, and Robert Inklaar. 2021. The role of capital and productivity in accounting for income differences since 1913. Journal of Economic Surveys 35: 952–74. [Google Scholar] [CrossRef]
- Ganau, Roberto, and Andrés Rodríguez-Pose. 2019. Do high-quality local institutions shape labour productivity in Western European manufacturing firms? Papers in Regional Science 98: 1633–66. [Google Scholar] [CrossRef]
- Giuseppe, Nicoletti, and Stefano Scarpetta. 2003. Regulation, productivity and growth: OECD evidence. Economic Policy 18: 9–72. [Google Scholar] [CrossRef]
- Glawe, Linda, and Helmut Wagner. 2021a. Convergence, divergence, or multiple steady states? New evidence on the institutional development within the European Union. Journal of Comparative Economics 49: 860–84. [Google Scholar] [CrossRef]
- Glawe, Linda, and Helmut Wagner. 2021b. Divergence Tendencies in the European Integration Process: A Danger for the Sustainability of the E(M)U? Journal of Risk and Financial Management 14: 104. [Google Scholar] [CrossRef]
- Gopinath, Gita, Şebnem Kalemli-Özcan, Loukas Karabarbounis, and Carolina Villegas-Sanchez. 2017. Capital allocation and productivity in South Europe. The Quarterly Journal of Economics 132: 1915–67. [Google Scholar] [CrossRef]
- Griliches, Zvi. 1987. Productivity: Measurement Problems. In The New Palgrave Dictionary of Economics. London: Palgrave Macmillan. [Google Scholar] [CrossRef]
- Griliches, Zvi. 1994. Productivity, R&D, and the Data Constraint. American Economic Review 84: 1–23. [Google Scholar]
- Griliches, Zvi. 1996. The Discovery of the Residual. Journal of Economic Literature, American Economic Association 34: 1324–30. [Google Scholar]
- Hall, Robert, and Charles Jones. 1999. Why Do Some Countries Produce so Much More Output per Worker than Others? Quarterly Journal of Economics 114: 83–116. [Google Scholar] [CrossRef]
- Harb, Georges, Charbel Bassil, and Zouheir El Sahli. 2024. Club Convergence in Productivity among European Regions: Recent Evidence and Policy Implications. Journal of Economic Integration 39: 525–56. Available online: https://www.jstor.org/stable/27327172 (accessed on 20 April 2024). [CrossRef]
- Havik, Karel, Kieran McMorrow, Werner Röger, and Alessandro Turrini. 2008. The EU-US Total Factor Productivity Gap: An Industry Perspective, European Economy–Economic Papers. Brussels: European Commission. [Google Scholar] [CrossRef]
- IEA. 2022. Global Energy Review: CO2 Emissions in 2021. Paris: IEA. Available online: https://www.iea.org/reports/global-energy-review-co2-emissions-in-2021-2 (accessed on 20 April 2024).
- Indermit, S. Gill, and Martin Raiser. 2012. Golden Growth: Restoring the Lustre of the European Economic Model (Vol. 2): Main Report (English); Europe and Central Asia Studies. Washington, DC: World Bank Group. Available online: http://documents.worldbank.org/curated/en/539371468036253854/Main-report (accessed on 20 April 2024).
- Inklaar, Robert, Marcel P. Timmer, and Bart van Ark. 2008. Market services productivity across Europe and the US. Economic Policy 23: 139–94. [Google Scholar] [CrossRef]
- Kaufmann, Daniel, Aart Kraay, and Massimo Mastruzzi. 2010. The Worldwide Governance Indicators: Methodology and Analyticalc Issues. Hague Journal on the Rule of Law 3: 220–46. [Google Scholar] [CrossRef]
- Kijek, Tomasz, Arkadiusz Kijek, and Anna Matras-Bolibok. 2023. Innovation and Regional Technological Convergence. In SpringerBriefs in Regional Science. Cham: Springer. [Google Scholar] [CrossRef]
- Klenow, J. Peter, and Andrés Rodríguez-Clare. 1997. The Neoclassical Revival in Growth Economics: Has It Gone Too Far? NBER Macroeconomics Annual 12: 73–103. [Google Scholar] [CrossRef]
- Knack, Stephen, and Philip Keefer. 1995. Institutions and Economic Performance: Cross-Country Tests Using Alternative Institutional Measures. Economics & Politics 7: 207–27. [Google Scholar] [CrossRef]
- Landesmann, A. Michael. 2015. New North–South Divide in Europe: Can the European Convergence Model be Resuscitated? In The Triple Challenge for Europe: Economic Development, Climate Change and Governance. Oxford: Oxford University Press, pp. 60–87. [Google Scholar]
- Männasoo, Kadri, Heili Hein, and Raul Ruubel. 2018. The contributions of human capital, R&D spending and convergence to total factor productivity growth. Regional Studies 52: 598–611. [Google Scholar] [CrossRef]
- McGuinness, Ann. 2007. Institutions and Total Factor Productivity Convergence, Research Technical Paper, Economic Analysis and Research Department Central Bank and Financial Services Authority of Ireland, 9/RT/07. Dublin: Central Bank of Ireland. [Google Scholar]
- Mc Morrow, Kieran, Röger Werner, and Alessandro Turrini. 2010. Determinants of TFP growth: A close look at industries driving the EU–US TFP gap. Structural Change and Economic Dynamics 21: 165–80. [Google Scholar] [CrossRef]
- McQuinn, Kieran, and Karl Whelan. 2007. Conditional convergence and the dynamics of the capital-output ratio. Journal of Economic Growth 12: 159–84. [Google Scholar] [CrossRef]
- Mendez, Carlos. 2020. Convergence clubs in physical and human capital. In Convergence Clubs in Labor Productivity and Its Proximate Sources. Singapore: Springer, pp. 41–51. [Google Scholar] [CrossRef]
- Mincer, Jacob. 1974. Schooling, Experience, and Earnings. New York: Columbia University Press. [Google Scholar]
- Mussida, Chiara, and Maria Laura Parisi. 2017. Ethnic Groups’ Income Inequality Within and Across Italian Regions. Working Paper No. 1/2017. Department of Economics and Management: Padova: pp. 1–25. [Google Scholar]
- Nelson, Richard. 1973. Recent Exercises in Growth Accounting: New Understanding or Dead End? The American Economic Review 63: 462–68. [Google Scholar]
- Nelson, Richard. 1981. Research on Productivity Growth and Productivity Differences: Dead Ends and New Departures. Journal of Economic Literature 19: 1029–64. [Google Scholar]
- Nelson, Richad, and Edmund Phelps. 1966. Investment in Human Capital, Technological Diffusion, and Economic Growth. American Economic Review 56: 69–75. [Google Scholar]
- North, Douglass Cecil. 1981. Structure and Change in Economic History. New York: Norton. [Google Scholar]
- Pérez-Moreno, Salvador, Elena Bárcena-Martín, and Jozef M. Ritzen. 2020. Institutional quality in the Euro area countries: Any evidence of convergence? Journal of Contemporary European Studies 28: 387–402. [Google Scholar] [CrossRef]
- Phillips, Peter, and Donggyu Sul. 2007. Transition Modeling and Econometric Convergence Tests. Econometrica 75: 1771–855. [Google Scholar] [CrossRef]
- Phillips, Peter, and Donggyu Sul. 2009. Economic transition and growth. Journal of Applied Econometrics 24: 1153–85. [Google Scholar] [CrossRef]
- Pietrucha, Jacek, and Rafal Żelazny. 2020. TFP spillover effects via trade and FDI channels. Economic Research-Ekonomska Istraživanja 33: 2509–25. [Google Scholar] [CrossRef]
- Radicic, Dragana, Zoran Borović, and Jelena Trivić. 2023. Total factor productivity gap between the “New” and “Old” Europe: An industry-level perspective. Post-Communist Economies 35: 770–95. [Google Scholar] [CrossRef]
- Rodrik, Dani, Arvind Subramanian, and Francesko Trebbi. 2004. Institutions Rule: The Primacy of Institutions Over Geography and Integration in Economic Development. Journal of Economic Growth 9: 131–65. [Google Scholar] [CrossRef]
- Rodríguez-Pose, Andrés, and Roberto Ganau. 2022. Institutions and the productivity challenge for European regions. Journal of Economic Geography 22: 1–25. [Google Scholar] [CrossRef]
- Schönfelder, Nina, and Helmut Wagner. 2019. Institutional convergence in Europe. Economics 13: 20190003. [Google Scholar] [CrossRef]
- Sickles, C. Robin, and Valentin Zelenyuk. 2019. Frontmatter. In Measurement of Productivity and Efficiency: Theory and Practice. frontmatter. Cambridge: Cambridge University Press, pp. i–iv. [Google Scholar]
- Solow, M. Robert. 1957. Technical Change and the Aggregate Production Function. The Review of Economics and Statistics 39: 312–20. [Google Scholar] [CrossRef]
- Staehr, Karsten. 2015. Economic Growth and Convergence in the Baltic States: Caught in a Middle- Income Trap? Intereconomics 50: 274–80. [Google Scholar] [CrossRef]
- The Conference Board Total Economy Database. 2024. Available online: https://www.conference-board.org/data/economydatabase (accessed on 20 April 2024).
- The World Bank. 2024. Available online: https://data.worldbank.org (accessed on 25 April 2024).
- World Meteorological Organization (WMO). 2019. Greenhouse gas bulletin: The state of greenhouse gases in the atmosphere based on global observations through 2017. Weather Climate Water 15: 191536. [Google Scholar]


| Variable | Description | Source |
|---|---|---|
| Y | GVA, Current prices, million purchasing power standards (PPS, EU27 from 2020) | EUROSTAT (2024) |
| I | Gross Fixed Capital Formation, Current prices, million purchasing power standards (PPS, EU27 from 2020) | EUROSTAT (2024) |
| L | Thousands of persons employed, expressed in 106 | |
| β | Marginal product of labor, expressed as share of the compensation of employees in GVA | EUROSTAT (2024) |
| α | Marginal product of capital, α = 1 − β | Authors calculation |
| h | Human capital index, based on years of schooling and returns to education | PWT 10.01 |
| K | Capital volume | Authors calculation |
| k | Capital output ratio, K/Y | Authors calculation |
| y | GVA per employee Y/L | Authors calculation |
| δ | Depreciation rate | Set at 0.06 |
| g | 10-year output growth rate | Authors calculation |
| β | Marginal product of labor, expressed as share of the compensation of employees in GVA | EUROSTAT (2024) |
| α | Marginal product of capital, α = 1 − β | Authors calculation |
| h | Human capital index, based on years of schooling and returns to education | PWT 10.01 |
| K | Capital volume | Authors calculation |
| k | Capital output ratio, K/Y | Authors calculation |
| y | GVA per employee Y/L | Authors calculation |
| δ | Depreciation rate | Set at 0.06 |
| TFP | Total Factor Productivity | Authors calculation |
| WGI3 | Government Effectiveness | The World Bank (2024) |
| WGI4 | Regulatory Quality | The World Bank (2024) |
| WGI5 | Rule of Law | The World Bank (2024) |
| WGI6 | Control of corruption | The World Bank (2024) |
| WGI | Mean of the WGI3-WGI6 | Authors calculation |
| TFP | Total Factor Productivity | Authors calculation |
| WGI3 | Government Effectiveness | The World Bank (2024) |
| ICT | Growth in capital services provided by ICT assets (change of the natural logarithm) | The Conference Board Total Economy Database (2024) |
| R&D | Research and development as a percentage of GDP | EUROSTAT (2024) |
| OPN | Country openness, calculated as a percentage of sum of imports and exports of goods and services in GDP | The World Bank (2024) Authors calculation |
| EDU | Growth in labor quality (change of the natural logarithm) | The Conference Board Total Economy Database (2024) |
| PTNT | Patent applications, residents | The World Bank (2024) |
| FDI | Foreign direct investment, net inflows (% of GDP) | The World Bank (2024) |
| Variable | Obs | Mean | Std. dev. | Min | Max |
|---|---|---|---|---|---|
| TFP | 567 | 8.653 | 0.646 | 6.893 | 10.642 |
| WGI | 567 | 1.071 | 0.592 | −0.239 | 2.176 |
| WGI3 | 567 | 1.076 | 0.599 | −0.364 | 2.347 |
| WGI4 | 567 | 1.159 | 0.443 | −0.052 | 2.040 |
| WGI5 | 567 | 1.074 | 0.608 | −0.266 | 2.125 |
| WGI6 | 567 | 0.975 | 0.786 | −0.441 | 2.459 |
| h | 567 | 1.162 | 0.099 | 0.802 | 1.369 |
| R&D | 564 | 0.230 | 0.630 | −1.427 | 1.316 |
| ICT | 567 | 14.566 | 7.225 | −5.250 | 59.040 |
| OPN | 568 | 4.701 | 0.464 | 3.816 | 5.974 |
| EDU | 567 | 83.536 | 3.814 | 67.6 | 91.4 |
| PTNT | 506 | 6.336 | 2.078 | 0.000 | 10.804 |
| FDI | 567 | 1.836 | 1.826 | −6.679 | 6.800 |
| TFP | WGI4 | ||||
| b | SE | T-stat | b | SE | T-stat |
| 0.593 | 0.131 | −4.537 | −1.445 | 0.167 | −8.655 |
| TFP EU14 | WGI4 EU14 | ||||
| b | SE | T-stat | b | SE | T-stat |
| −0.847 | 0.107 | −7.932 | −1.361 | 0.247 | −5.511 |
| TFP EU13 | WGI4 EU13 | ||||
| b | SE | T-stat | b | SE | T-stat |
| −0.434 | 0.101 | 4.335 | −1.715 | 0.149 | −11.505 |
| TFP GIIPS | WGI4 GIIPS | ||||
| b | SE | T-stat | b | SE | T-stat |
| −2.272 | 0.304 | −7.471 | −1.588 | 0.428 | −3.704 |
| WGI | WGI5 | ||||
| b | SE | T-stat | b | SE | T-stat |
| −0.912 | 0.022 | −31.578 | −0.857 | 0.052 | −16.386 |
| WGI EU14 | WGI5 EU14 | ||||
| b | SE | T-stat | b | SE | T-stat |
| −1.061 | 0.118 | −8.950 | −1.311 | 0.091 | −14.433 |
| WGI EU13 | WGI5 EU13 | ||||
| b | SE | T-stat | b | SE | T-stat |
| −0.969 | 0.14 | −6.922 | −0.465 | 0.066 | −6.962 |
| WGI GIIPS | WGI GIIPS | ||||
| b | SE | T-stat | b | SE | T-stat |
| −1.172 | 0.265 | −4.419 | −1.471 | 0.1824 | −8.065 |
| WGI3 | WGI6 | ||||
| b | SE | T-stat | b | SE | T-stat |
| −0.848 | 0.144 | −5.881 | −0.698 | 0.041 | −16.758 |
| WGI3 EU14 | WGI6 EU14 | ||||
| b | SE | T-stat | b | SE | T-stat |
| −0.796 | 0.079 | −10.013 | −0.885 | 0.094 | −9.795 |
| WGI3 EU13 | WGI6 EU13 | ||||
| b | SE | T-stat | b | SE | T-stat |
| −1.011 | 0.311 | −3.251 | −0.603 | 0.146 | −4.112 |
| WGI3 GIIPS | WGI6 GIIPS | ||||
| b | SE | T-stat | b | SE | T-stat |
| −1.197 | 0.236 | −5.068 | −0.631 | 0.241 | −2.614 |
| TFP | |||
| Clubs | Countries | b | T-stat |
| Club1 (14) | AUT BUL CZE DEN GER IRE ITA LAT LIT LUX MAL POL ROM SWE | −0.211 | −1.488 |
| Club2 (7) | BEL CYP EST FRA NET POR SVN | 0.025 | 0.122 |
| Club3 (6) | CRO FIN GRE HUN SPA SVK | 0.022 | 0.299 |
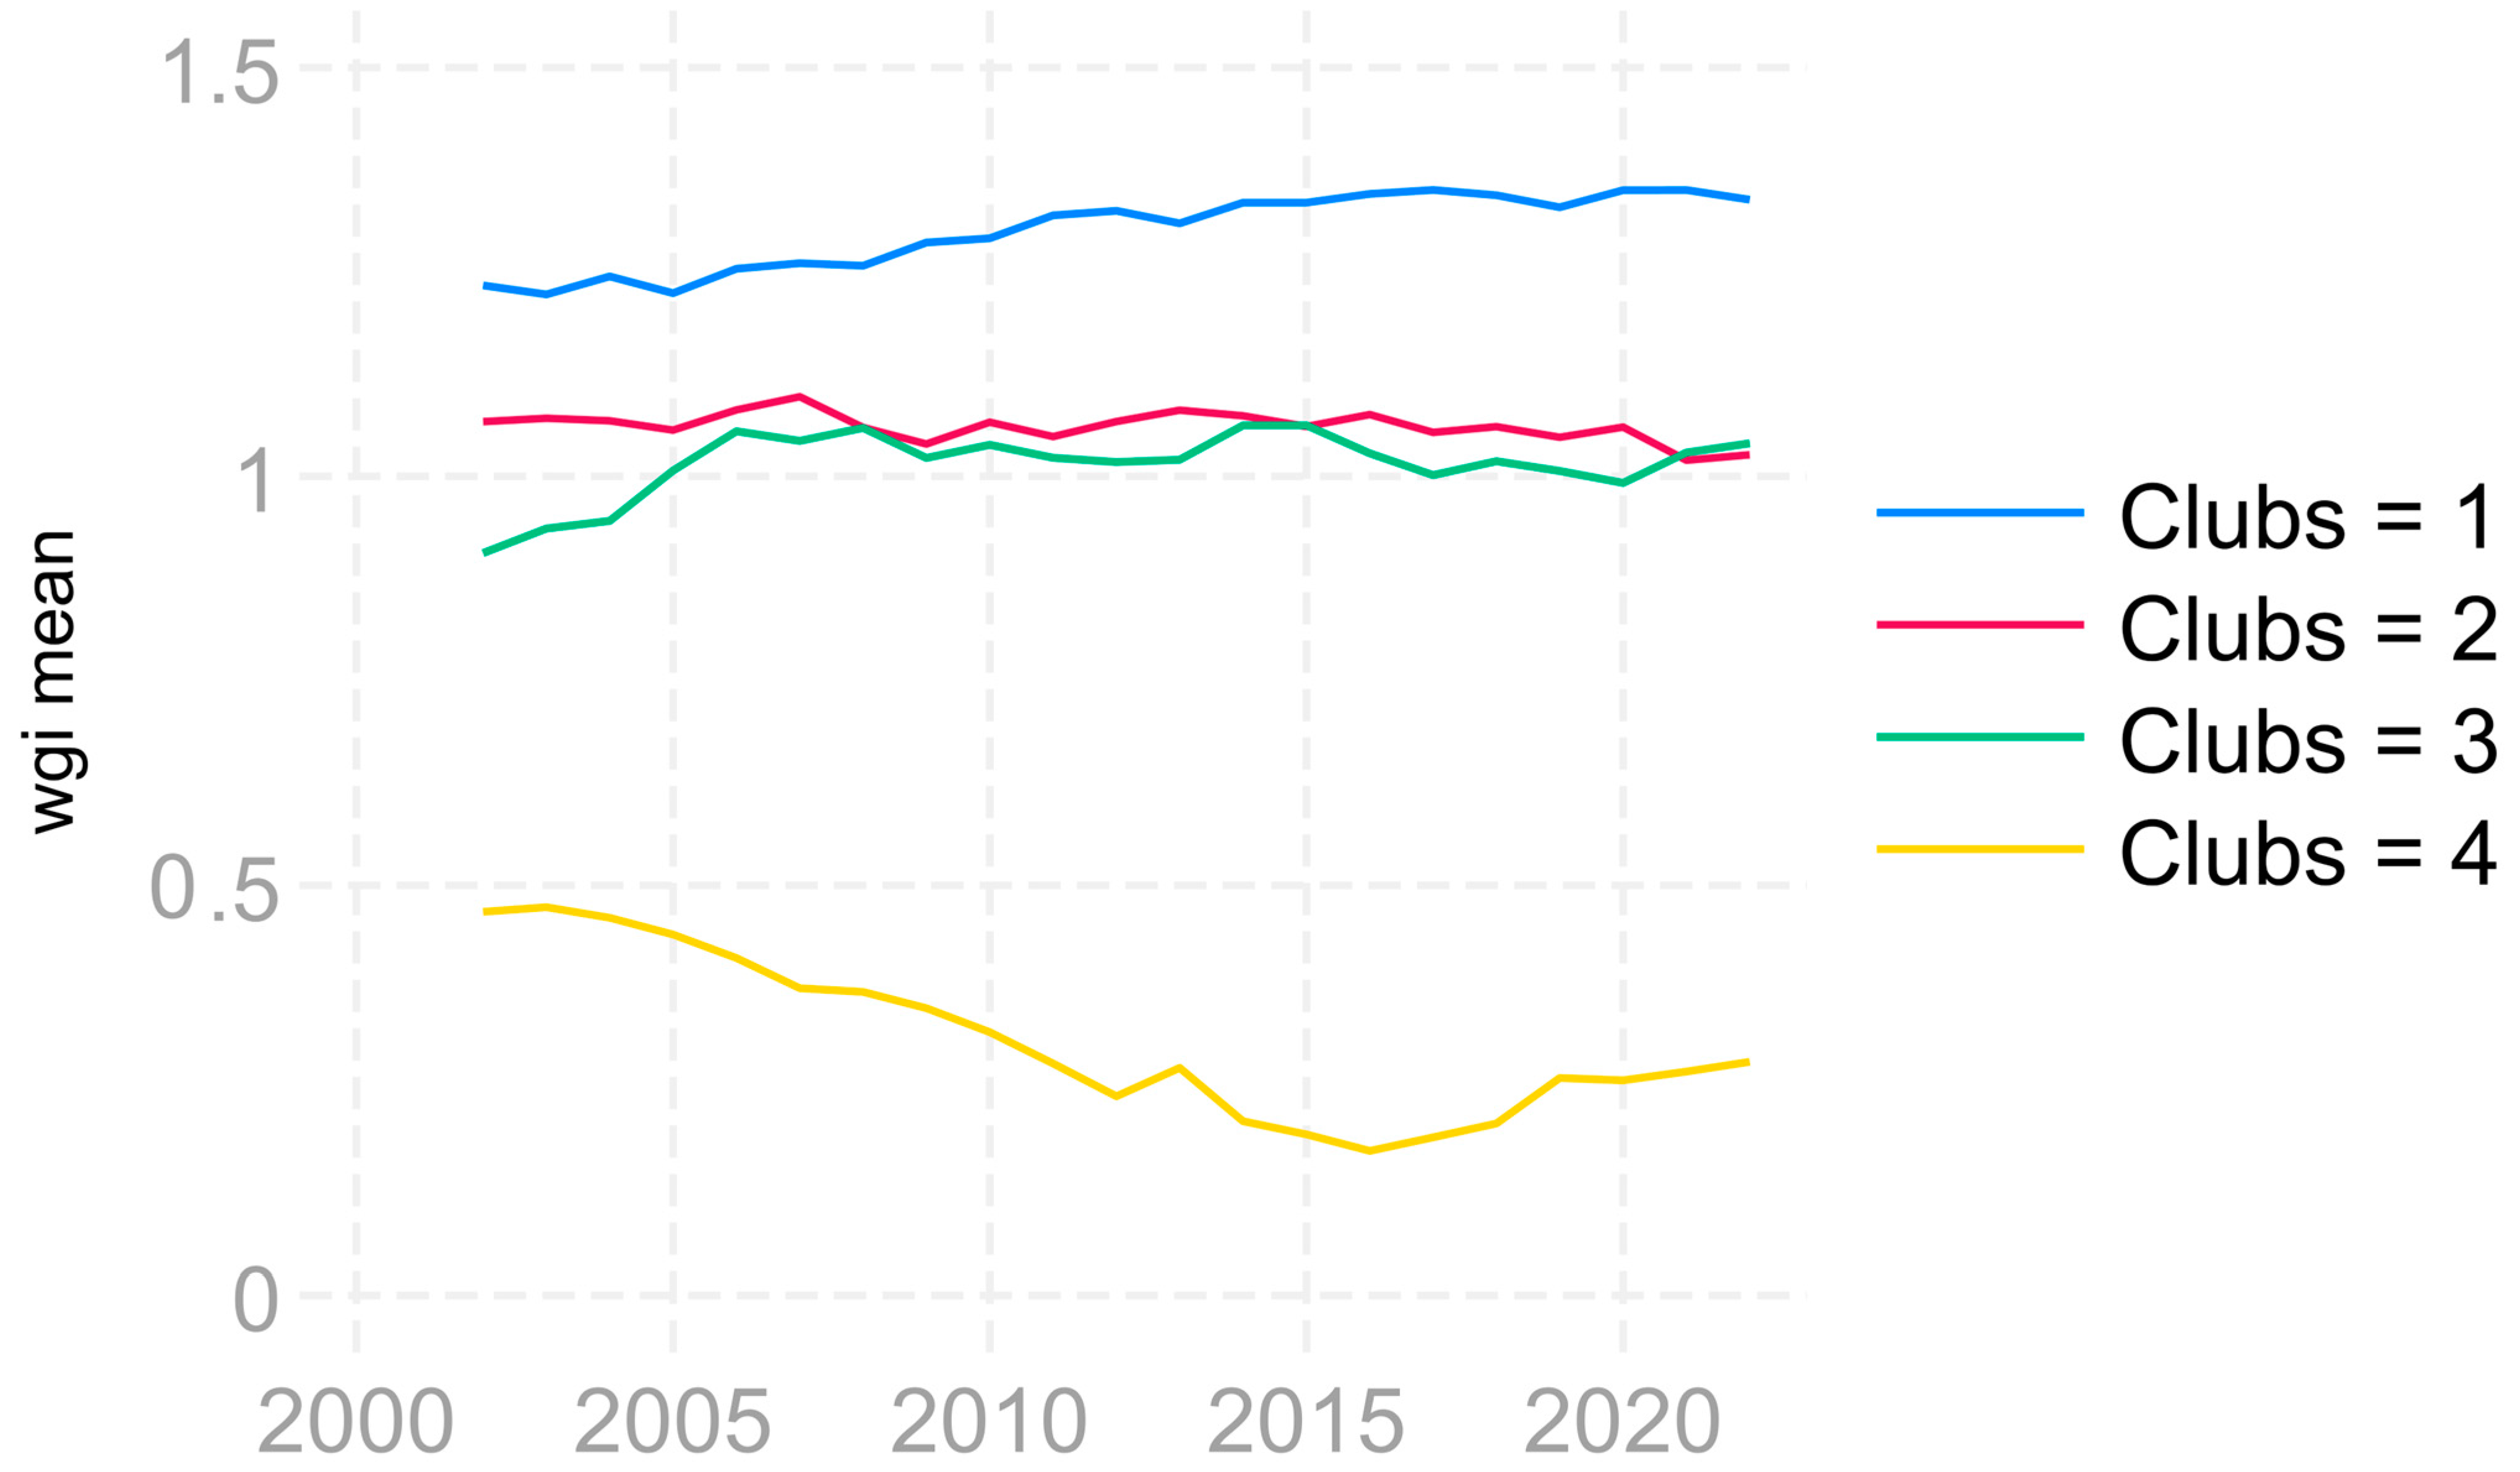
| WGI | |||
| Clubs | Countries | b | T-stat |
| Club1 (14) | AUT BEL CZE DEN EST FIN FRA GER IRE LAT LIT LUX NET SWE | −0.035 | −0.509 |
| Club2 (2) | POR SVN | −1.706 | −0.711 |
| Club3 (9) | CRO CYP GRE ITA MAL POL ROM SPA SVK | −0.001 | −0.002 |
| Not convergent group (2) | BUL HUN | −1.121 | −1.671 |
| WGI3 | |||
| Clubs | Countries | b | T-stat |
| Club1 (15) | AUT CZE DEN EST FIN FRA GER IRE LAT LIT LUX NET POR SVN SWE | 0.107 | 0.7305 |
| Club2 (4) | BEL CYP MAL SPA | 0.046 | 0.109 |
| Club3 (4) | CRO CYP GRE ITA MAL POL ROM SPA SVK | 0.102 | 0.201 |
| Club4 (3) | GRE POL ROM | −1.089 | −1.199 |
| Not convergent group (1) | BUL | - | |
| WGI4 | |||
| Clubs | Countries | b | T-stat |
| Club1 (14) | AUT BEL CZE DEN EST FIN FRA GER IRE LAT LIT LUX NET SWE | −0.205 | −1.106 |
| Club2 (9) | CRO CYP ITA MAL POL POR SPA SVK SVN | 0.113 | 0.263 |
| Club3 (4) | BUL GRE ROM HUN | 0.253 | 0.336 |
| WGI5 | |||
| Clubs | Countries | b | T-stat |
| Club1 (17) | AUT BEL CRO CZE DEN EST FRA GER IRE LAT LIT LUX NET POR ROM SVN SWE | −0.09 | −0.447 |
| Club2 (6) | CYP HUN MAL POL SPA SVK | −0.406 | −1.367 |
| Club3 (2) | GRE ITA | 0.291 | −1.178 |
| Not convergent group (2) | BUL FIN | −0.780 | −10.031 |
| WGI6 | |||
| Clubs | Countries | b | T-stat |
| Club1 (15) | AUT BEL CZE DEN EST FIN FRA GER IRE ITA LAT LIT LUX NET SWE | −0.064 | −0.498 |
| Club2 (10) | CRO CYP GRE MAL POL POR ROM SPA SVK SVN | −0.186 | −1.065 |
| Club3 (2) | BUL HUN | 0.443 | 3.041 |
| Dependent Variable Final Club | Model 1 | ||
|---|---|---|---|
| Coefficient | Margins for the Clubs | ||
| WGI | −0.417 *** (0.137) | 1 | 0.626 *** (0.106) |
| 2 | −0.174 *** | ||
| (0.058) | |||
| 3 | −0.584 *** | ||
| h | −0.926 ** (0.498) | 1 | 0.822 ** (0.374) |
| 2 | −0.374 ** | ||
| (0.224) | |||
| 3 | −1.267 ** | ||
| ICT | −0.018 ** (0.007) | 1 | 0.206 ** (0.089) |
| 2 | −0.103 ** | ||
| (0.047) | |||
| 3 | −0.346 ** (0.157) | ||
| R&D | 0.295 ** (0.132) | 1 | −0.052 ** (0.023) |
| 2 | 0.027 ** (0.013) | ||
| 3 | 0.092 ** (0.042) | ||
| OPN | −0.289 ** (0.125) | 1 | 0.552 ** (0.463) |
| 2 | −0.120 ** (0.230) | ||
| 3 | −0.403 ** (0.793) | ||
| FDI | 0.016 (0.027) | 1 | −0.011 (0.038) |
| 2 | 0.006 (0.021) | ||
| 3 | 0.021 (0.068) | ||
| /cut1 | −4.363 (0.364) | ||
| /cut2 | −3.606 (0.957) | ||
| Log pseudolikelihood | AIC | BIC | |
| −559.288 | 1134.576 | 1169.256 | |
| Dependent Variable Final Club | Model 2 | ||
|---|---|---|---|
| Coefficient | Margins for the Clubs | ||
| WGI3 | −1.526 *** (0.305) | 1 | 0.754 *** (0.269) |
| 2 | −0.854 *** | ||
| (0.181) | |||
| 3 | −1.297 *** (0.494) | ||
| WGI4 | −1.003 *** (0.334) | 1 | 0.935 *** (0.283) |
| 2 | −0.483 *** | ||
| (0.228) | |||
| 3 | −1.680 *** (0.623) | ||
| WGI5 | −0.930 ** (0.376) | 1 | 0.793 ** (0.299) |
| 2 | −0.409 ** | ||
| (0.221) | |||
| 3 | −1.424 ** (0.634) | ||
| WGI6 | −0.029 (0.256) | 1 | 0.023 (0.178) |
| 2 | −0.012 (0.131) | ||
| 3 | −0.041 (0.381) | ||
| EDU | −0.139 *** (0.018) | 1 | 9.332 *** (1.211) |
| 2 | −4.820 *** (1.174) | ||
| 3 | −16.767 (2.601) | ||
| OPN | −0.430 *** (0.182) | 1 | 0.602 *** (0.541) |
| 2 | −0.828 *** (0.455) | ||
| 3 | −2.879 *** (1.209) | ||
| PTNT | −0.119 *** (0.037) | 1 | 0.270 *** (0.041) |
| 2 | −0.199 *** (0.046) | ||
| 3 | −0.579 *** (0.106) | ||
| /cut1 | −14.475 (1.703) | ||
| /cut2 | −13.571 (1.695) | ||
| Log pseudolikelihood | AIC | BIC | |
| −435.9238 | 889.8475 | 927.8863 | |
Disclaimer/Publisher’s Note: The statements, opinions and data contained in all publications are solely those of the individual author(s) and contributor(s) and not of MDPI and/or the editor(s). MDPI and/or the editor(s) disclaim responsibility for any injury to people or property resulting from any ideas, methods, instructions or products referred to in the content. |
© 2024 by the authors. Licensee MDPI, Basel, Switzerland. This article is an open access article distributed under the terms and conditions of the Creative Commons Attribution (CC BY) license (https://creativecommons.org/licenses/by/4.0/).
Share and Cite
Borović, Z.; Radicic, D.; Ritan, V.; Tomaš, D. Convergence and Divergence Tendencies in the European Union: New Evidence on the Productivity/Institutional Puzzle. Economies 2024, 12, 323. https://doi.org/10.3390/economies12120323
Borović Z, Radicic D, Ritan V, Tomaš D. Convergence and Divergence Tendencies in the European Union: New Evidence on the Productivity/Institutional Puzzle. Economies. 2024; 12(12):323. https://doi.org/10.3390/economies12120323
Chicago/Turabian StyleBorović, Zoran, Dragana Radicic, Vladana Ritan, and Dalibor Tomaš. 2024. "Convergence and Divergence Tendencies in the European Union: New Evidence on the Productivity/Institutional Puzzle" Economies 12, no. 12: 323. https://doi.org/10.3390/economies12120323
APA StyleBorović, Z., Radicic, D., Ritan, V., & Tomaš, D. (2024). Convergence and Divergence Tendencies in the European Union: New Evidence on the Productivity/Institutional Puzzle. Economies, 12(12), 323. https://doi.org/10.3390/economies12120323