Article

Shifts in the Boot: Understanding Inequality’s Impact on Interregional Migration Patterns in Italy

Nicolais School of Business, Wagner College, New York, NY 10103, USA
*
Author to whom correspondence should be addressed.
Economies 2024, 12(12), 317; https://doi.org/10.3390/economies12120317
Submission received: 30 May 2024 / Revised: 24 July 2024 / Accepted: 19 November 2024 / Published: 21 November 2024
(This article belongs to the Section International, Regional, and Transportation Economics)

Abstract

:
Italy has long experienced a significant developmental gap between its northern and southern regions, with the latter being less developed. The 2007–2008 financial crisis accentuated this gap, leading to distinct patterns of interregional migration. This paper aims to investigate the effects of past migration flows and income inequality on interregional mobility in Italy, using a gravity model with bidirectional dyads and three different measures of inequality as dependent variables: Gini Index, Relative Poverty, and Income Ratio. Previous research has shown that living in highly unequal regions is associated with increased mistrust and anxiety about social status, contributing to unhappiness among residents. Using bilateral gross migration flows for the period 2007–2018, the study aims to control for the potential endogeneity between interregional mobility and inequality. The results indicate a positive relationship between high levels of inequality and interregional out-mobility, underscoring the need for policies aimed at reducing both horizontal and vertical inequality within and among Italian regions.

1. Introduction

Italy has a long-standing history of regional disparities, with the southern regions being less developed than the northern ones. This gap became more accentuated in recent times during the economic crisis of 2007–2008, resulting in different patterns of interregional migration. Understanding the determinants of interregional mobility in Italy is crucial for policymakers to design effective policies that promote social cohesion and reduce regional inequalities.
The economic crisis of 2007–2008 severely impacted the Italian economy, causing a sharp increase in unemployment and poverty rates, particularly in the southern regions, which were already lagging behind in terms of economic development compared to the northern regions (Vera Zamagni 1993). In fact, the southern region has historically always been poorer than the north, as it has never experienced a comparable process of economic growth; rather than an “active modernization”, the process that interested the south resembled the characteristics of a “passive modernization”, as “something extraneous to the local society” brought from outside and implemented by the extractive elite classes, without benefiting the population as a whole (Felice and Vasta 2015).
Southern regions have always experienced significant out-migration, both abroad and to the northern regions, which intensified in the interwar period and peaked in the 1960s; subsequently, interregional migration declined in the 1970s but revived in the 1990s and the following decades, exacerbating existing regional disparities (Vittorio Zamagni 2008; Mussida and Parisi 2016). The demographic composition of these migrations has varied over time, and scholars have formulated various hypotheses to explain this inconsistency. Indeed, recent migration waves, mostly characterized by high-skilled individuals, generally from higher social classes, differ greatly from the mainstream low-skilled migrants of the 1960s. Despite some hypotheses suggesting demographic change or substitution over the years, Panichella argues that high-skilled migration has always existed, and has continued to persist after the 1990s. Conversely, low-skilled migration surged during the specific historical period of economic boom alongside the already present high-skilled migration flow and accounted for the increase in interregional migration in those years (Sanfilippo 2016; Panichella 2012). The 2007–2009 economic crisis exacerbated this interregional pattern of mobility from the south to the north in search of better economic opportunities and may have had different demographics compared to previous migrations (Simpson 2017) (Figure 1).
Migration is a complex phenomenon that is influenced by a range of factors, including economic, social, cultural, and political (Harris and Todaro 1970). Previous studies have shown that economic factors, such as income inequality, are important determinants of migration (Etzo 2011; Percoco 2018). In fact, in highly unequal regions, people may feel discouraged by the lack of economic opportunities and may be more likely to migrate to other regions. Moreover, high levels of inequality can lead to increased mistrust and anxiety about social status, further motivating the desire to migrate.
This study aims to investigate the effects of past migration flows and income inequality on interregional mobility in Italy. To achieve this goal, the study uses a gravity model with bidirectional dyads and three different measures of inequality, the Gini Index, Relative Poverty, and Income Ratio, for the 2007–2018 period. The use of multiple measures of inequality allows for a more nuanced understanding of the relationship between inequality and interregional mobility in Italy and provides more robustness to the model. In addition, an instrumental variables approach is adopted to control for the potential endogeneity between migration and several of the independent variables used in the model (this aspect will be discussed more in detail in the next sections of the paper).
The remainder of the paper is structured as follows. The next section provides a review of the relevant literature on interregional mobility and income inequality in Italy. The Section 3 outlines the data and methodology used in the analysis, including a detailed explanation of the instrumental variables approach and the gravity model. The Section 4 presents the results of the analysis, while the Section 5 discusses policies implications. The final section concludes the paper.

2. Literature Review

Italy has historically been divided between the more developed and wealthier north, and the less developed and poorer south (Musolino 2018). This divide, which lasted for most of the 20th century, was exacerbated by the 2008 economic crisis, leading to different patterns of interregional migration (Benassi et al. 2019). In this literature review, we explore the effects of past migration flows and income inequality on interregional mobility in Italy, focusing on the years following the 2008 crisis. We will focus on the use of the gravity model with bidirectional dyads and discuss the literature that successfully employed gravity models for regional economics. Additionally, we analyze the consequences of the economic crisis of 2008 as a trigger for interregional immigration.

2.1. Historical Context

Historically, Italy has experienced a significant north–south divide in terms of economic development. The north has been characterized by high levels of industrialization and modernization, while the south has lagged behind in terms of economic growth, infrastructure, and job opportunities (Gagliardi and Percoco 2011). This divide, known as the “Questione Meridionale” [Southern Question], has been a subject of study for many years, and different theories have been advanced to explain it. Felice, Daniele, and Malanima offer contrasting positions in the ongoing debate, providing different answers to the question “Why did the south lag behind?” Felice, maintaining an “institutionalist” approach, argued that the extractive elites in the south have delayed the modernization process for private gain, a condition typical and unique to those regions. Moreover, according to him, southern regions lacked social capital, they were in an unfavorable geographic location, and they had a pronounced economic inequality, all factors that contributed to its underdevelopment.
Felice (2018) discusses how one of the critical causes of this divide has been the uneven spread of industry. The industrialization of the northern regions facilitated economic growth and development, while the southern regions remained predominantly agricultural. This industrial concentration in the north led to a more robust economic infrastructure, higher productivity, and better employment opportunities, further widening the economic gap. Transportation costs have also played a significant role in perpetuating the north–south divide. The northern regions benefit from better transportation infrastructure, which reduces costs and facilitates trade and mobility. In contrast, the southern regions face higher transportation costs due to less developed infrastructure, hindering economic activities and increasing the cost of doing business. Market integration has been another crucial factor. The northern regions are more integrated into European markets, benefiting from greater access to consumers and suppliers. This market integration has allowed for quicker economic growth and recovery from economic downturns. On the other hand, the southern regions, with lower levels of market integration, struggle to attract investments and expand economic activities.
Conversely, Daniele and Malanima’s main argument rests primarily on geographical factors. Indeed, in post-unitary Italy, the north benefited from more investment due to its proximity to the other European industrial hubs, which attracted more investors, consolidating an “industrial triangle” ideally connecting Genoa, Turin, and Milan. They argue that economic forces, instead of spreading industrialization across the Italian peninsula, created a thriving economy in the north to the detriment of the south (Ciccarelli et al. 2021). The geographical proximity of the northern regions to major European markets provides a competitive advantage in terms of export opportunities and foreign investments. This proximity has made it easier for northern regions to establish and maintain economic ties with European partners, contributing to their economic success. The southern regions, being farther from these markets, face disadvantages in attracting investments and expanding economic activities.
The north’s advantageous location, with better access to European markets, has historically facilitated trade and economic integration, contributing to its economic prosperity. In contrast, the south’s geographical challenges, including rugged terrain and less accessible locations, have impeded similar levels of economic integration and development.
The recent literature also stresses the importance of innovation in promoting regional economic development (Di Quirico 2010). Manioudis and Angelakis (2023) emphasize that the creative economy is tightly associated with sustainable development and Sustainable Economic Goals (SDGs). Their study focuses on the region of Attica, illustrating how smart specialization strategies and the Entrepreneurial Discovery Process (EDP) methodology can foster sustainable regional growth. The deployment of a robust innovation ecosystem requires engaging and mobilizing regional actors, identifying their needs and priorities, and fostering long-term institutional learning and policy co-design. These findings underscore the critical role of both education and innovation in regional development and the need for policies that support creative and knowledge-based industries to drive economic growth and sustainability (Manioudis and Angelakis 2023).
The existing literature reveals that education, innovation, and physical geography are fundamental in understanding and addressing regional economic disparities. Policies aimed at enhancing educational opportunities, fostering innovation, and addressing geographical challenges are essential for promoting balanced regional development and transitioning to sustainable economic growth. The integration of these elements can help create a more cohesive economic landscape across regions, reducing disparities and promoting overall national prosperity. However, it is also important to mention the impact of exogenous events on long-term disparities.
In fact, more recently, the 2007–2009 economic crisis had a profound impact on Italy, exacerbating regional disparities and influencing interregional mobility patterns. The crisis led to a sharp contraction in economic activity, with significant declines in industrial production, exports, and employment. The northern regions, being more industrialized and integrated into the European market, experienced severe but relatively shorter economic contractions. In contrast, the southern regions faced prolonged economic difficulties due to their reliance on less dynamic sectors, such as agriculture and public sector employment.
The effects of this regional economic disparity have been significant and long-lasting. For instance, poverty rates in the south have consistently been higher than in the north, and the region has experienced higher levels of emigration as a result (Boschini et al. 2007). Additionally, the south has suffered from high levels of unemployment, particularly among young people, and a lack of investment in key sectors such as education and infrastructure (Lisciandra et al. 2022). Figure 2, Figure 3 and Figure 4 illustrate levels of inequality, measured by the Gini Index, Relative Poverty, and Income Ratio, across 20 Italian regions during the observed years.
The economic crisis of 2007–2008 exacerbated these regional disparities, particularly in terms of employment and income. During this period, the north fared better than the south in terms of job creation and economic growth, which led to a significant increase in interregional migration from the south to the north (Odoardi and Muratore 2019). This crisis highlighted the urgency of addressing the underlying economic disparities between the two regions, as the consequences of this inequality continue to impact the country’s economic and social development.

2.2. Gravity Models in Regional Economics

As mentioned earlier in the paper, this study is conducted at the regional level. Gravity models have been widely used in regional economics to explain patterns of migration and trade flows among regions. In the context of migration, gravity models have been used to understand the determinants of interregional migration flows. The basic intuition behind gravity models is that the magnitude of flows between two regions is proportional to the size of their respective populations and inversely proportional to the distance between them. This is similar to the law of gravitation, which posits that the force between two objects is proportional to their masses and inversely proportional to the distance between them (Ashby 2007).
Gravity models have been applied in a wide range of contexts, from international migration to interregional migration within countries. In the context of Italy, gravity models have been used to study interregional migration flows. For example, Bonifazi et al. (2017) used a gravity model to analyze interregional migration flows in Italy during the period of 2000–2005. They found that economic factors such as per capita GDP and unemployment rates, as well as demographic factors such as population size and the age structure, were significant determinants of interregional migration flows. In recent years, researchers have also used gravity models to study the impact of inequality on migration flows. In the context of Italy, for instance, Piras (2020) used a gravity model to study the impact of income inequality on interregional migration flows. He found that higher levels of income inequality correlated with higher levels of out-migration from the more unequal regions to the more equal ones. The choice of variables and the dyadic model used in this study is informed by the previous literature on interregional migration flows in Italy. The use of bilateral gross migration flows as the dependent variable captures the interdependence between regions in terms of migration flows. Moreover, the use of three different measures of inequality, namely the Gini Index, Relative Poverty, and Income Ratio, allows for a more comprehensive understanding of the impact of inequality on migration flows. The specific measure of income inequality, “Relative Poverty”, deserves particular attention to explain what it describes and why it is relevant in our paper.
In our study, Relative Poverty is defined as the condition in which individuals or groups within a society experience a standard of living that is significantly lower than the average or median standard of living in that society. This measure captures the extent to which individuals are deprived of the resources and opportunities that are available to the majority of the population. Relative Poverty is typically assessed by comparing household incomes to a specific threshold, usually set at a certain percentage of the median income. For instance, a common threshold is 50% or 60% of the median household income. Households with incomes below this threshold are considered to be in Relative Poverty, as they have significantly fewer financial resources compared to the average household. This measure is crucial in understanding economic inequality and social exclusion, as it highlights the disparities in living standards and the extent to which certain populations are marginalized within a society. Unlike absolute poverty, which is concerned with the minimum level of resources necessary for physical survival, Relative Poverty emphasizes social participation and the ability to maintain a decent standard of living relative to the broader community.
By incorporating the measure of Relative Poverty, our study aims to provide a nuanced understanding of economic disparities and their impact on interregional mobility in Italy. As mentioned above, this measure complements the Gini Index and Income Ratio, offering a comprehensive view of how income inequality influences migration patterns and regional development (Table 1).

2.3. Effects of Income Inequality on Interregional Mobility

The relationship between income inequality and interregional mobility has been a topic of interest for many scholars in recent years. A number of studies have found that high levels of income inequality can lead to lower levels of interregional mobility, as individuals may be more hesitant to leave their current region if they feel they have fewer opportunities to succeed in a new location (Jargowsky 2015; Bailey et al. 2017). In addition, regions with high levels of inequality may also experience higher levels of social tension, complicating individuals’ adjustment to a new environment (Glaeser et al. 2009).
On the other hand, some research suggests that high levels of inequality may actually increase interregional mobility, as individuals may be more motivated to leave their current region in search of better opportunities elsewhere (Borjas 1995). Monras (2018) investigates how economic shocks, such as changes in local labor market conditions, influence internal migration within the United States. The paper finds that regions experiencing negative economic shocks see out-migration, while regions with positive economic shocks attract migrants. According to the author, this migration helps to equilibrate regional economic disparities. Similarly, Molloy et al. (2017), examine the decline in long-distance migration in the U.S. and its relationship to job changes. While the focus is on the overall decline, the authors also discuss how regional economic differences continue to drive migration. They argue that economic inequality across regions remains a significant factor in individuals’ decisions to relocate for better job opportunities. With a focus on Europe, Coulter and Scott (2015) analyze self-reported reasons for residential mobility in the UK, finding that economic reasons, such as seeking better employment opportunities, are among the primary drivers. This supports the idea that economic disparities between regions motivate people to move. However, we would like to point out that these findings are not consistent across all studies and may depend on the specific context and measures used to capture inequality (Bailey et al. 2017).
One way in which income inequality can affect interregional mobility is through its impact on educational opportunities. For example, regions with high levels of inequality may have fewer resources available for public education, leading to lower educational attainment among the population (Reardon and Bischoff 2011). This, in turn, can limit the job prospects available to individuals in that region, making it more difficult for them to move to a new area with better economic opportunities (Bailey et al. 2017). On the other hand, limited educational opportunities at origin can stimulate out-migration of the lower-skilled segments in the society, where migration to countries or regions with higher uneducated wages is often considered as a substitute for education (Azarnert 2012).
Furthermore, high levels of inequality may also reduce social capital, hindering an individual’s ability to make social connections and find job opportunities in new regions (Putnam 2000). This lack of social capital can be particularly problematic for individuals who are already facing social and economic barriers, such as those living in poverty or belonging to marginalized groups (Bailey et al. 2017).
In summary, the relationship between income inequality and interregional mobility is complex and multifaceted, and is influenced by a variety of economic, social, and cultural factors. While some studies have found a negative relationship between the two variables, others suggest that the relationship may be more nuanced and context-dependent. Regardless, it is clear that addressing issues of income inequality is crucial for promoting greater interregional mobility and reducing economic disparities across regions.

2.4. The Economic Crisis of 2008 as a Trigger for Interregional Immigration

The economic crisis of 2008 had a profound impact on the Italian economy and society, significantly influencing interregional migration patterns. The crisis triggered a sharp increase in unemployment rates and a decrease in GDP, which in turn led to a reduction in the standard of living for many households. As a result, the crisis had a profound effect on the migration behavior of individuals and families across Italy.
Research shows that the economic crisis had disparate impacts on different regions of Italy, with the south of the country suffering more severely than the north. For example, a study by Accetturo et al. (2014) found that the crisis led to a decline in employment rates in the south that was twice as severe as that experienced in the north. This disparity in economic outcomes between regions may have contributed to the patterns of interregional migration that emerged in the aftermath of the crisis.
In particular, research suggests that the crisis led to an increase in migration from the south to the north of Italy. For example, Gagliardi and Percoco (2011) found that the Great Recession led to a significant increase in migration flows from southern regions to the northern regions of the country. Similarly, a study by Bonifazi et al. (2017) found that the crisis led to an increase in migration from the south to the north, as individuals sought to find work in regions with better employment prospects.
The economic crisis may have also led to changes in the characteristics of migrants, with a greater proportion of highly skilled individuals migrating in search of better job opportunities (Cannari et al. 2000). A study by Ceriani and Verme (2012) found that during the crisis period, the probability of highly educated individuals migrating from the south to the north of Italy increased significantly.
Overall, the 2008 economic crisis significantly influenced patterns of interregional migration in Italy, with a marked increase in migration from the south to the north of the country. These changes in migration behavior may have been influenced by the differential impact of the crisis on different regions and the changing demographic of migrants.

3. Methodology

To investigate the effects of past migration flows and income inequality on interregional mobility in Italy, we applied a gravity model with bidirectional dyads and three different measures of inequality: Gini Index, Relative Poverty, and Income Ratio. The gravity model is a widely used method for studying bilateral migration flows between regions or countries. It is based on the analogy of gravitational attraction between two objects, with the attractiveness of one region for migrants being proportional to its size and inversely proportional to the distance from the origin (Greenwood 1975; Borjas 1989; Ashby 2007). The basic equation of the gravity model is
M i j = G P i β 1 P j β 2 D i j α
In the equation, Mij describes gross migration from State i to State j. G is a constant, while Pi and Pj represent populations in State i and State j. Dij represents the distance between two states. β1, β2, and α are corresponding coefficients.
By taking logs on both sides of the equation, a reduced-form model is created to analyze migratory behavior empirically:
m i j = α 0 + α 1 p i + α 2 p j + α 3 y i + α 4 y j + α 5 d i j + z + ε i j
The lower-case variables in Equation (2) represent the log form of the coinciding upper-case variables in Equation (1); yi and yj represent income for both states; and dij denotes the travel costs between states. Since this is difficult to measure, we use the distance between regions’ capitals as a proxy variable (Borjas 1987). The variable z(·) includes the attributes of the origin and destination states, and eij serves as the conventional error term. Some of these attributes may include economic conditions (Borjas 1989) or measurements of political and/or civil freedoms (Gastil 1990).
To satisfy the purpose of the study, the gravity model used in this paper is an extended form of the one reported above. Specifically, to incorporate measures of inequality into the gravity model, we estimate three different regression models, one for each measure of inequality as the main independent variable. The independent variables in each model are as follows:
Migration flows in previous periods: This variable captures the effect of past migration flows on current migration patterns. We use bilateral gross migration flows between the 20 Italian regions for the 2007–2018 period, obtained from the Italian National Institute of Statistics (ISTAT).
Income inequality: We include three different measures of income inequality as independent variables: the Gini Index, Relative Poverty, and Income Ratio. The Gini Index measures the distribution of income across households, with higher values indicating greater inequality. Relative Poverty measures the proportion of individuals living below the poverty threshold, defined as 60% of the median household income. The Income Ratio measures the ratio of the average income of the top 20% of households to the bottom 20% of households.
Control variables: To control for other factors that may affect migration patterns, we include several control variables in the regression models, including distance between regions, population size of the origin and destination regions, education, income levels, and unemployment rate in the origin and destination regions. An additional, important control we are using is represented by levels of crime at the origin and at the destination. This is a particularly relevant control, as it has been mentioned several times in the literature how high levels of crime affect people’s decision to leave their homes or neighborhood, in search of better living conditions, while low levels of crime increase property values and make neighborhoods more attractive (Cullen and Levitt 1999; Freedman and Owens 2011; Sharkey and Sampson 2010; Schwartz et al. 2003).
Furthermore, we estimate the gravity models using a fixed-effects panel data approach, treating each of the 20 Italian regions as a separate entity. The fixed-effects approach allows us to control for time-invariant regional characteristics that may affect migration patterns, such as geographic location or cultural factors. We also apply an instrumental variables approach using bilateral gross migration flows to capture the effects of income inequality on interregional mobility in Italy while controlling for potential endogeneity between interregional mobility and inequality. An instrumental approach is used when there is a risk of potential endogeneity between dependent and independent variables. This means that, for instance, changes in the measures of inequality would cause changes in the dependent variable (migration flows) and in the error term.
An instrumental approach uses instruments that directly influence the endogenous regressor but affect the dependent variable only indirectly through the endogenous regressor. The chosen instruments for analyzing inequality are the rate of online purchases relative to internet access and the rate of theater attendance relative to cinema attendance. These indicators capture economic inequality without directly influencing migration. To understand the choice of using theater attendance relative to cinema attendance as a proxy for income inequality, it is important to consider both the conceptual and empirical support for this choice. Conceptually, the distinction between theater and cinema attendance can reflect significant economic disparities within a population. Attending the theater often involves higher costs, including tickets, travel, and associated expenditures like dining out, compared to attending the cinema. This difference in affordability highlights variations in disposable income and access to cultural capital, which are closely tied to broader measures of economic inequality.
Empirically, research has shown that cultural consumption patterns, such as attendance at performing arts events, are strongly correlated with income levels. Higher-income individuals are more likely to engage in such activities, as they have both the financial means and the cultural capital to do so. This relationship is supported by studies that link higher participation in costly cultural activities to greater economic resources and social stratification (Corrigall-Brown and Ho 2015). In line with positional competition theories, rising income inequality intensifies competition for access to high-status cultural events, further differentiating individuals based on their economic capabilities. The disparity in theater versus cinema attendance serves as a proxy for this competitive dynamic, reflecting not merely preferences but deeper structural inequalities in access to cultural and economic opportunities.
Cultural participation, including attending the theater, is often considered a “highbrow” activity associated with higher socioeconomic status. In contrast, going to the cinema is viewed as more accessible and less expensive (especially in a country like Italy), appealing to a broader audience, across different income levels. Katz-Gerro (2002, 2006), has demonstrated that highbrow cultural activities are more prevalent among higher income groups due to the costs and cultural capital required for participation. While preferences undoubtedly play a role in cultural consumption, we believe that they are heavily influenced by economic constraints. Higher-income individuals are more likely to have the means to choose theater over cinema, reflecting their greater disposable income and access to leisure activities. We consider this distinction important, because it underscores how economic disparities manifest in lifestyle choices and opportunities, rather than purely personal preferences.
The same reasoning can be applied to the other instrument used in this paper (rate of online purchases over internet access): this measure serves as a proxy for regional economic activity and digital engagement, which can vary significantly across regions and reflect underlying economic disparities. Previous research has demonstrated that internet access and online purchasing behaviors are influenced by regional economic conditions, such as income levels, infrastructure development, and consumer preferences (Forman et al. 2005; Kolko 2012). By capturing these variations, the rate of online purchases relative to internet access provides a relevant and exogenous instrument for regional economic disparities. This approach aligns with the existing literature that uses similar digital engagement metrics to study economic phenomena (Bai et al. 2019). As mentioned before, our instrumental variable approach, including both the rate of online purchases relative to internet access and theater attendance relative to cinema attendance, aims to mitigate endogeneity concerns and provide robust estimates of the impact of inequality on interregional mobility.
In this respect, the statistical validity of our instruments is supported by the numerous tests that we performed; the statistical validity is also supported by the existing literature, showing that expenditure patterns on cultural activities can effectively indicate income levels. For instance, the work by Perez-Villadoniga and Suarez-Fernandez (2019) highlights the correlation between education, income, and cultural participation across Europe. These studies support the use of cultural consumption as a proxy for income inequality by illustrating consistent patterns where higher income correlates with more frequent engagement in costlier cultural activities (Henry 2014). Our statistical tests also support the assumption that the inability to purchase goods online, or to go to the theater, due to the price of tickets, does not represent reasons good enough to nudge people towards migration (Table 2).
The instrumental model used in the paper is expressed by the following econometric form:
MFijt = β0 + β1MFijt−1 + β2ODInequalityt−1 + β3ODDemogr.t−1 + β4ODDistanceij + εit
Inequality = γ0 + γ1Cinema + γ2Theater + ηit
  • MFijt: Bilateral Gross Migration Flows, from region I to j, at time t;
  • MFijt−1: Bilateral Gross Migration Flows from region I to j, at time t − 1;
  • Inequalityt−1: The three different indexes of inequality used in the paper, at time t − 1;
  • Demogr.t−1: The one-year lagged demographic explanatory variables listed above, at time t − 1;
  • Distanceij: Distance between origin and destination region;
  • Cinema: Inequality instrument encompassing people who can afford an inexpensive cinema ticket;
  • Theater: Inequality instrument encompassing people who can afford an expensive theater ticket.
As mentioned before, the instruments used in this model have proven to be poorly correlated with the dependent variable (Bilateral Gross Migration Flows) and satisfyingly correlated with the three indexes of inequality. The following table provides a list of the used instruments for inequality and descriptive statistics, as well their correlation with the dependent variables and the three different inequality measures used in the model.
We anticipated earlier in the paper that both models are dynamic to verify the presence of existing migration networks and due to the medium-to-long term effect on migrations expected in variables like inequality and unemployment. To provide more robustness to the models and to verify long-term effects, the analysis has been carried with models containing two- and five-time lags (Table A1 and Table A2 in the Appendix A at the end of the paper). In both models, an important trigger for migration is represented by unemployment rate. We expect very high levels of unemployment to disincentivize mobility from the origin, as the lack of liquidity and means to leave (resulting from long periods without a job and a salary) would make mobility rather complicated, given the very high cost of living and housing in the wealthiest regions. The unemployment rate, in this case, also represents a good measure of different employment opportunities in different regions (Biagi et al. 2011).
Following the same logic, another one of the explanatory variables used in this model (education) has a double purpose. First, it is important as it represents a proxy of human capital in the population, but it is also a variable that describes the perception that people have of inequality, assuming that the higher the level of education, the more people should be aware of inequality patterns around them. This variable is important, as it is arguable that people would not migrate due to inequality if they were not aware of it (Biagi et al. 2011).
Distance in the model is intended as the linear distance in kilometers among the capitals of the regions (Etzo 2011). The previous literature on migration widely recognizes the important role of distance in migration decision-making (Greenwood 1997; Cushing and Poot 2004; LeSage and Pace 2008). In this paper, following Juarez (2000), distance is also used as a proxy for the general cost of moving. It is important to notice that even for a relatively small country like Italy, distances are important, as they connect regions with very different costs of living, thus representing an obstacle for those individuals or families who do not have enough liquidity to afford to move.
An important demographic variable included in this model (and in gravity models in general) is represented by the total population in each region. In line with the previous literature, and, in particular, the equilibrium approach (Graves 1976; Roback 1982; Blomquist et al. 1988) mentioned earlier in the paper, the model includes one amenity-related (or disamenity, in this case) individual variable, represented by the perception of crime in each region. Such data are provided by annual surveys on the quality of life, realized by the Italian Institute of Statistics, and aim to make the model more robust and complete, not limiting the analysis to the mere study of economic drivers of interregional mobility.
All the explanatory variables contain a one-year lag. The reason behind this choice is that it is not easy to see the immediate effects of some of the controls of this model on migration (such as inequality itself, unemployment, and education level), as they produce medium-term effects rather than short-term ones. Thanks to this technique, the model analyzes the effects of time-variable explanatory controls at time t − 1 on gross bilateral migration flows at time t.
The analysis takes into consideration the years 2007–2018. While acknowledging the importance of analyzing longer periods, the choice was driven by the lack of data available for one of the instruments used in the instrumental model (Internet Index), for which data are only available from 2007.
With the purpose of increasing the robustness of the model and verifying the validity and reliability of the instrumental approach, we use four additional different Instrumental Variable Estimators. These estimators can be used in case of an instrumental approach where the chosen instruments (which need to be exogenous and weakly correlated with the dependent variable) are not considered to be strongly correlated enough with the endogenous regressor (Bartolucci et al. 2018). Table 3 below provides a brief description of the four IV estimators used in the paper.

4. Results

As mentioned in the previous section, the empirical analysis in the paper utilizes two models: the gravity model (OLS) and the instrumental model (2SLS). The latter was performed given the risk of endogeneity between the dependent variable and the regressor in the OLS model, which could have provided biased results. The outcome of the OLS analysis seems to confirm the initial hypothesis and provides some biased estimates that can be observed in the table at the beginning of the Appendix A. The bias is due to the potential reverse causality between interregional mobility and inequality. On the contrary, the 2SLS model provides consistent results across the three measures of inequality taken into consideration.
The results of the model described in Equation (2) above offer interesting insights. As expected, all three measures of inequality (Gini Index, Relative Poverty Index, and Income Ratio) indicate that high levels of inequality at the origin represent a significant push factor for interregional out-migration whereas low levels of inequality at the origin disincentivize out-migration. Conversely, inequality levels at the destination do not represent a significant pull factor for in-migration). In both OLS and 2SLS, pre-existing migrations (therefore the existence of migration networks) proved to have a significant positive effect on migrations at time t, as posited by Piras (2020). The following sections will provide detailed summaries of the results for the 2SLS model, for each of the three indexes of inequality.

4.1. Gini Index

In the case of the Gini Index, high levels of inequality at the origin are associated with higher bilateral migration flows. As in the previous model, long distances disincentivize migrations (with the estimated threshold at about 825 km). The model establishes higher levels of education at the origin as a significant push factor for interregional migration in Italy; this result suggests that migration tends to be high-skilled, and that the perception of existing inequality plays a role in people’s migration decision-making. The results corroborate the hypothesis that people (provided the presence of enough liquidity) migrate to regions where they believe unemployment is low and wages are higher. In accordance with the literature and the previous models, high perception of crime (indicating low quality of life) at the origin represents an important push factor in people’s migration decision-making, while high education levels at the destination are a significant pull factor.

4.2. Relative Poverty
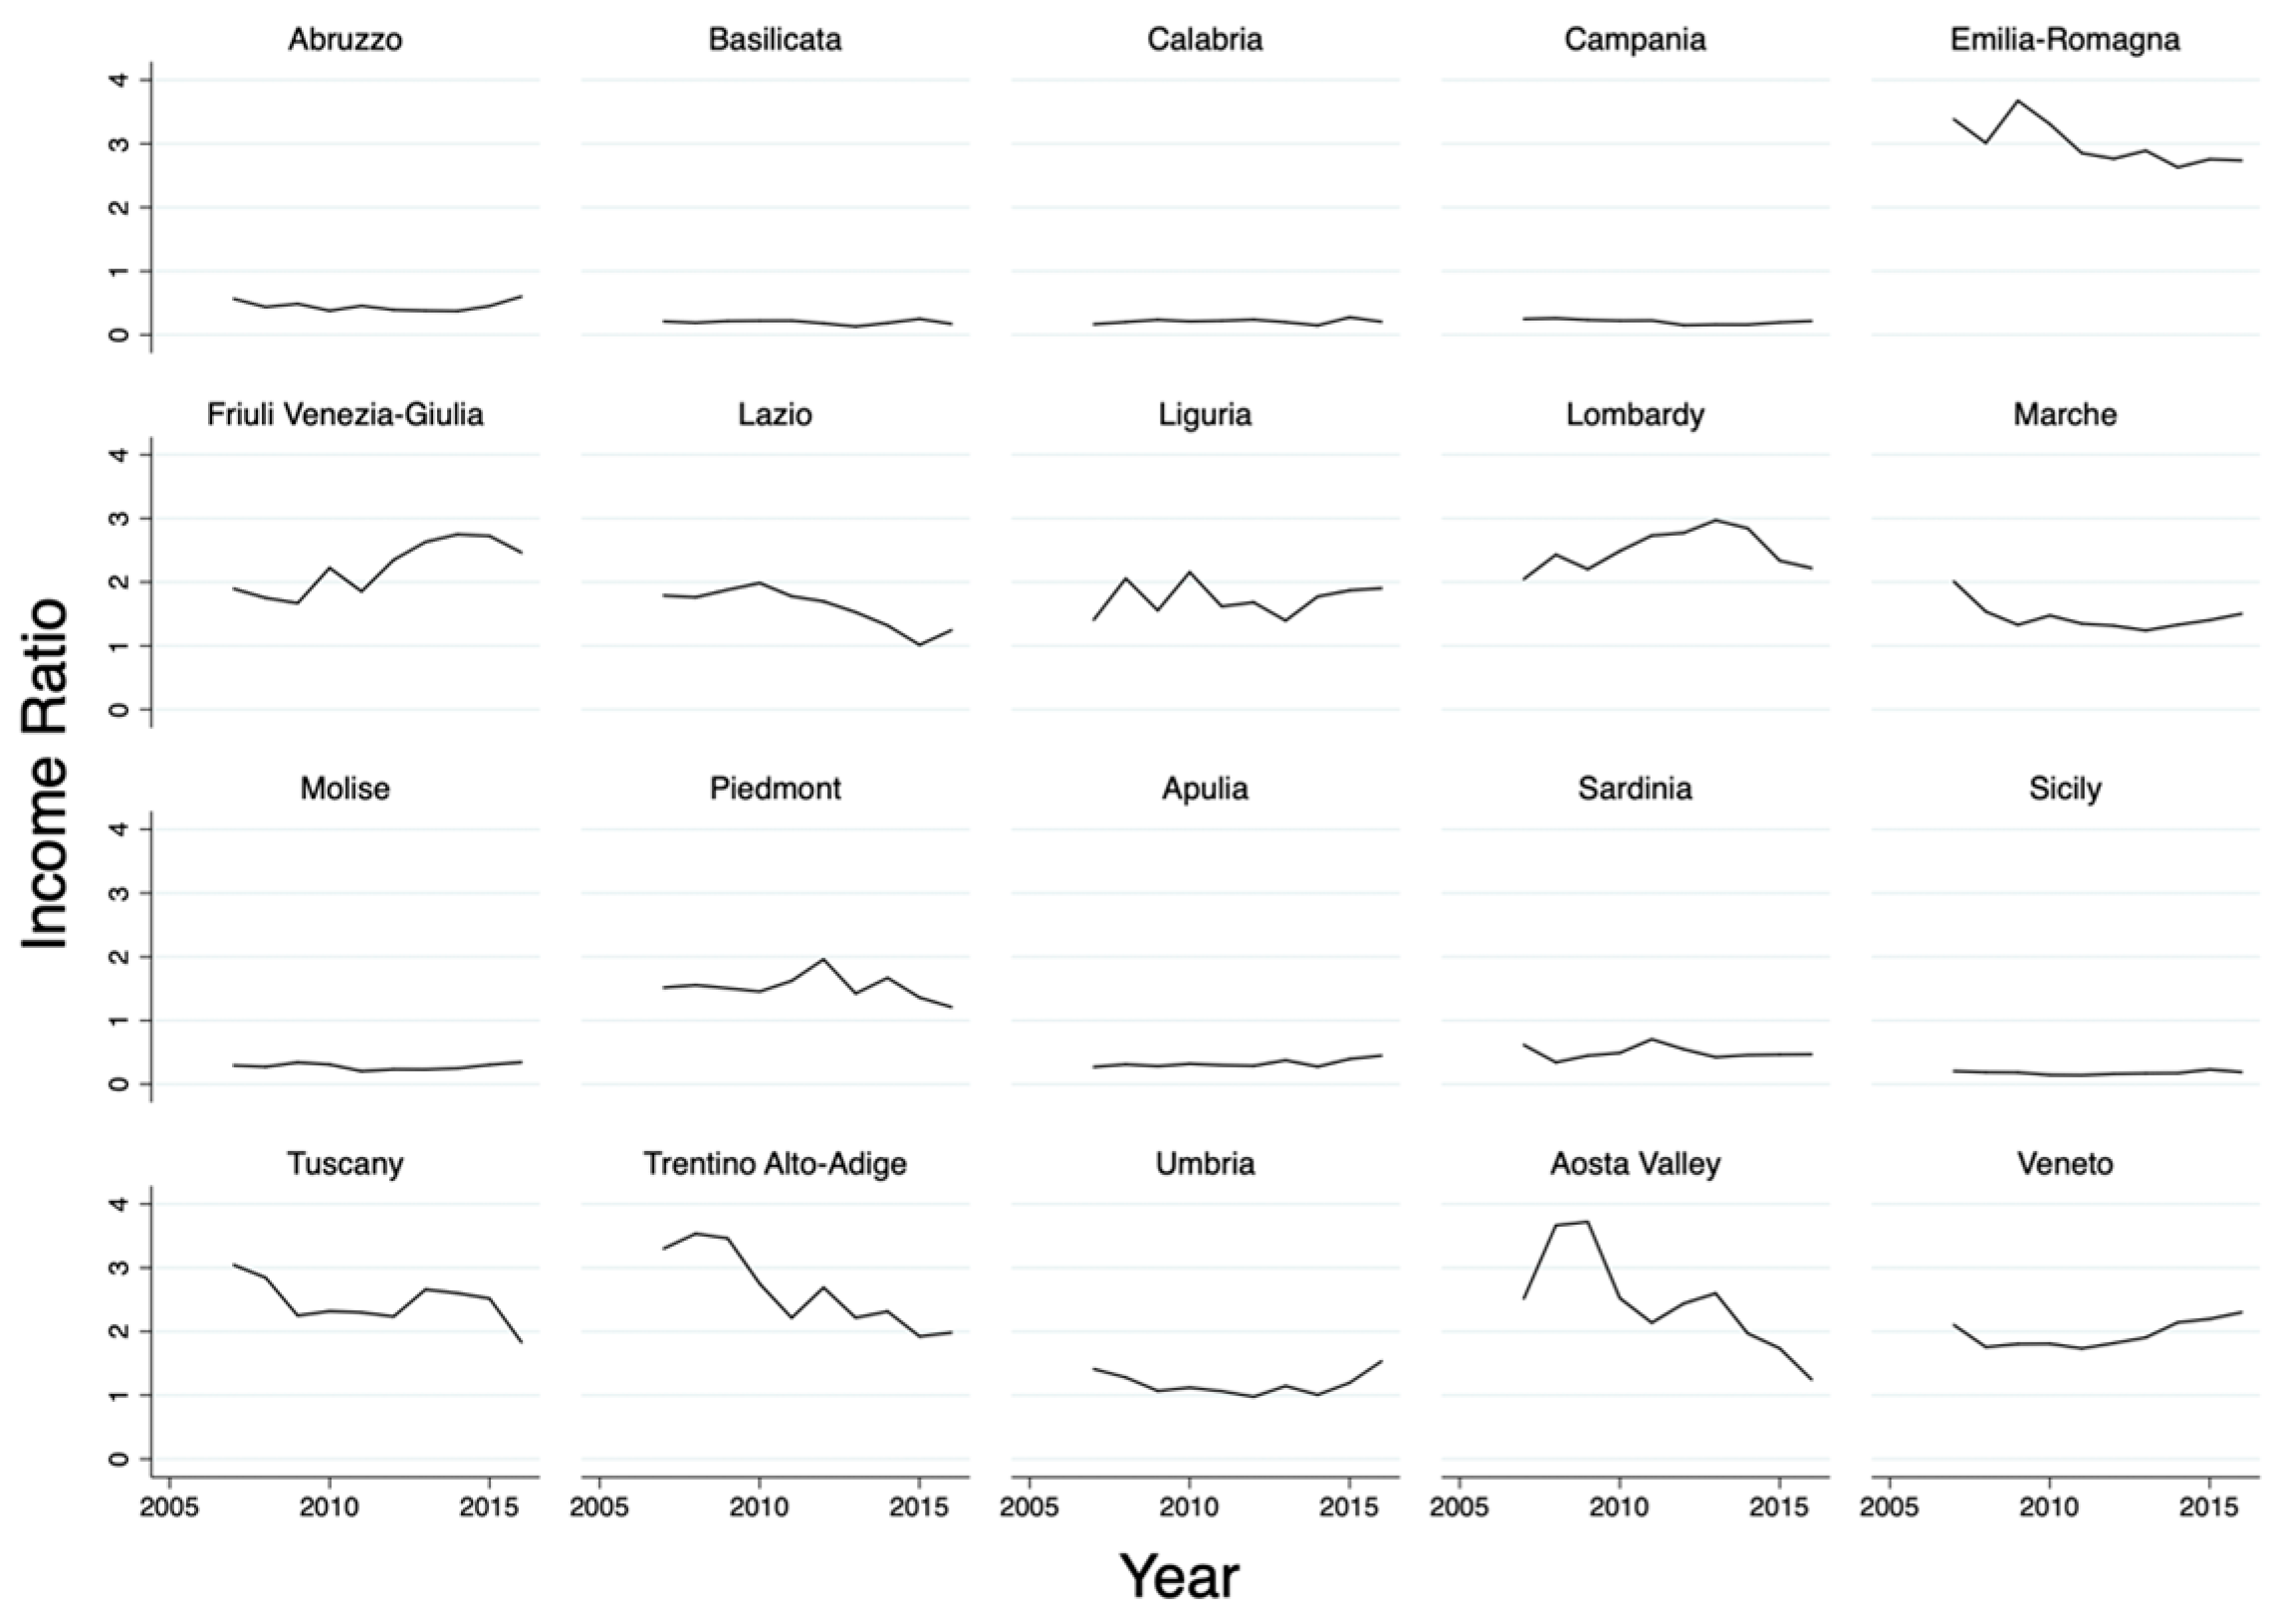
The analysis reveals that, as mentioned above, inequality at the origin constitutes an important push factor for interregional mobility. As expected, the distance between regions represents an obstacle to migration, suggesting that people tend to migrate to regions in proximity to their homes (with the estimated threshold at around 770 km). Financial constraints and the absence of sufficient liquidity to move far from home might play a role, given the different cost of living and housing between the north and the south; high unemployment rates at the origin seem to disincentivize migration, consistent with the findings by Biagi et al. (2011). The higher the perception of crime at the origin, the more people tend to migrate, highlighting how the quality of life and the perception of safety play an important role in people’s migration decision-making. High levels of education in migrant-receiving regions constitute an important pull factor for interregional mobility.

4.3. Income Ratio

The Income Ratio, consistent with the previous two models, suggests that lower levels of inequality at the origin are associated with lower bilateral migration flows, suggesting that a fair redistribution of wealth disincentivizes interregional mobility. As in the previous cases, people are more inclined towards short-distance moves and regions with high levels of education. People are attracted by regions with low unemployment and better educational opportunities, anticipating higher wages and better living conditions. The perceived presence of a disamenity like high crime rates (associated with low quality of life) represents a significant push factor for out-migration at the regional level.
Table 4 and Table 5 below present the detailed results of both OLS and 2SLS models used in this paper.
In general, the three different models analyzed in this paper suggest that the economic variables employed (inequality and unemployment rate) have an important weight in migration decision-making at the regional level in Italy, together with the presence of disamenities like high crime rates. In accordance with the existing literature (Etzo 2011; Biagi et al. 2011), migration in Italy is associated with short distances and higher levels of education, highlighting how migration has evolved throughout the years, from low-skilled (during the 1950s–1970s) to today’s high-skilled labor.
As anticipated earlier in this paper, an instrumental approach has been used to control for the possible endogeneity of the three indexes of inequality. The performed endogeneity tests (results at the bottom of each table) fail to reject the null hypothesis that the instrumented regressors may be treated as exogenous. In other words, endogeneity does not seem to be a major problem in this model.
This paper used four additional estimators for instrumental variables (LIML, FULL, HLIM, and HFUL), to provide robustness and corroborate the results obtained by the instrumental approach, performed through the 2SLS model. The analysis of these additional estimators confirms the reliability of an instrumental approach, highlighting a better fit for this analysis, compared to the standard OLS approach, whose results suffer from endogeneity issues. For more detailed information on these additional tests, the results of the analysis can be found in the Open Science Framework public repository. Looking at the tables, the reader can confirm that the estimates from 2SLS, LIML, FULL, HLIM, and HFUL produce similar results; this is a good indication that our instruments are indeed strong and reliable.
As the reader can notice, there is a strong difference in Gini Coefficients between the two specifications (OLS and 2SLS). We believe that this difference can be attributed to the different modeling approaches used. As mentioned before, Table 4 presents results from the OLS model, while Table 5 uses the 2SLS model to account for potential endogeneity of the GINI coefficient. The use of instrumental variables in the 2SLS model corrects for bias and provides a more reliable estimate of the effect of inequality on interregional mobility. Additionally, differences in the sets of control variables and sample handling between the two specifications may also contribute to the variation in the GINI coefficient estimates.

5. Conclusions

This study analyzes the effect of regional inequality, together with economic, social, and demographic factors, on mobility at the regional level in Italy. The primary hypothesis is that high levels of inequality increase bilateral migration flows within the country. This analysis constitutes a first and explorative attempt to consider inequality as a significant driver of interregional mobility in Italy. Below, we focus on discussing in depth theoretical and policy implications.

5.1. Theoretical Implications

Our findings reveal that income inequality at the origin significantly influences interregional mobility. The positive effect of income inequality suggests that the perception of the existing gap between the rich and poor drives mobility at the regional level. This indicates that wealth redistribution policies can shape the social and economic landscape of different regions, potentially exacerbating or reducing existing levels of inequality (Zhang et al. 2019). Future research could benefit from analyzing inequality from a different perspective, such as examining the income levels of the first and ninth deciles of the population to understand their impact on regional migration patterns.
Unemployment levels also provide valuable insights into migration trends. High unemployment at the origin correlates with reduced migration, aligning with the literature that emphasizes the role of conditional cash transfers (Angelucci 2012), social networks (Epstein and Gang 2006), and remittances (García 2018) in mobility decisions. Additionally, distance plays a crucial role in migration decisions, with individuals preferring to migrate to nearby regions, influenced by personal, climatic, and environmental factors (Etzo 2011; Biagi et al. 2011).
The presence of personal networks is another significant factor influencing migration, as they assist migrants in adjusting to new environments and provide essential information on jobs and housing (Piras 2020). This paper focuses on the period following the 2007–2009 financial crisis, a unique context that may have influenced our results. To isolate the crisis’s effects, we included time and region-to-region fixed effects in our model. We have used standard errors clustered at the regional level to account for potential intraregional correlation and to provide robust inference. Future research could compare data from before and after the crisis to better understand its impact on interregional migration trends.

5.2. Policy Implications

The study highlights important social and political implications of migration from poorer to wealthier regions. The results suggest the need for significant investments in regions with high inequality and out-migration to enhance wealth redistribution, reduce the gap between the rich and the poor, and improve living conditions in areas still affected by the Great Recession. Reducing vertical inequality within regions could indirectly reduce horizontal inequality among regions by fostering brain retention, thus promoting more uniform development across the country.
Based on our findings, we recommend the following policy measures:
  • Economic Development Programs
Implement economic development initiatives focused on southern regions to create job opportunities and stimulate local economies. This includes supporting local businesses, promoting entrepreneurship, and attracting investment to underdeveloped areas.
2.
Investment in Education and Infrastructure
Increase investment in education and infrastructure in less developed regions to improve human capital and connectivity. Enhancing educational facilities and access, particularly in the south, can reduce regional disparities and foster inclusive growth. Improved infrastructure can facilitate better integration with national and European markets.
3.
Social Cohesion Programs
Develop programs that foster social cohesion and reduce mistrust and anxiety caused by high inequality. Social cohesion initiatives can include community-building activities, support for local cultural projects, and policies aimed at reducing social exclusion.
4.
Incentives for High-Skilled Workers
Provide incentives for high-skilled workers to remain in or move to southern regions, thereby reducing the skill drain to the north. This can be achieved through tax incentives, grants, and support for innovation and research activities in the south.
5.
Combating Organized Crime
Strengthen legal and institutional frameworks to combat organized crime in the south. A stable and secure environment is essential for attracting investment and fostering economic development.
6.
Supporting Innovation and Creative Economies
Encourage innovation and support creative industries to drive sustainable regional development. Implementing smart specialization strategies and the Entrepreneurial Discovery Process can help regions identify and leverage their unique strengths, promoting long-term growth and resilience (Manioudis and Angelakis 2023).
7.
Universal Basic Income (UBI)
Introduce a Universal Basic Income (UBI) to provide financial stability to all citizens, particularly benefiting the medium and lower classes given their higher proportional propensity to consume. This policy would help retain talent in disadvantaged regions by ensuring a basic level of economic security, reducing both vertical and horizontal inequalities. UBI can stimulate local economies through increased consumer spending and reduce the economic disparities that drive migration. Evidence suggests that UBI can improve social cohesion, reduce poverty, and foster a more inclusive economy (Widerquist 2018; Standing 2017).
By addressing these areas, policymakers can mitigate the disparities that drive interregional migration and promote balanced economic development across Italy. To our knowledge, this paper represents a pioneering effort to analyze the impact of inequality on mobility at the subnational level in Italy, using both gravity and instrumental variable approaches.

Author Contributions

Conceptualization, G.D.P.; methodology, G.D.P.; software, G.D.P.; validation, G.D.P. and E.P.; formal analysis, G.D.P.; investigation, G.D.P.; resources, E.P.; data curation, E.P.; writing—original draft preparation, G.D.P.; writing—review and editing, G.D.P. and E.P.; visualization, G.D.P.; supervision, G.D.P.; project administration, G.D.P. All authors have read and agreed to the published version of the manuscript.

Funding

This research received no external funding.

Informed Consent Statement

Not applicable.

Data Availability Statement

The raw data supporting the conclusions of this article will be made available by the authors on request.

Conflicts of Interest

The authors declare no conflict of interest.

Appendix A

Table A1. Effect of Inequality on Internal Mobility (2SLS Model, with two time-lags).
Independent VariablesMigration FlowsMigration FlowsMigration Flows
Two Lags Migration Flows0.967 ***
(254.7)
0.967 ***
(257.1)
0.968 ***
(257.8)
Two Lags Gini Origin6108.8 **
(2.16)
Two Lags Gini Destination819.1
(0.86)
Two Lags Relative Poverty Origin 16.29 ***
(3.12)
Two Lags Relative Poverty Destination −8.123 **
(−2.18)
Two Lags Income Ratio Origin −160.2 ***
(−4.09)
Two Lags Income Ratio Destination 116.0 ***
(4.54)
Distance−2.048 ***−2.112 ***−2.114 ***
(−13.16)(−13.73)(−13.53)
Distance20.001 ***0.001 ***0.001 ***
(12.97)(13.73)(13.63)
Two Lags Unemployed Origin7.9412.809−8.021
(0.87)(0.37)(−0.99)
Two Lags Unemployed Destination−31.28 ***−18.63 ***−6.100
(−6.01)(−3.01)(−0.97)
Two Lags Population Origin0.000 ***0.000 ***0.000 ***
(19.85)(28.71)(28.30)
Two Lags Population Destination0.000 ***0.000 ***0.000 ***
(35.26)(35.15)(33.81)
Two Lags Education Level Origin12,982.719,825.5 *−121.9
(1.24)(2.48)(−0.02)
Two Lags Education Level Destination52,869.4 ***46,846.7 ***62,232.9 ***
(5.05)(4.43)(5.86)
Two Lags Crime Origin16.71 ***19.41 ***19.71 ***
(5.05)(6.40)(6.46)
Two Lags Crime Destination−5.948 *−6.703 **−6.952 **
(−1.87)(−1.62)(−1.82)
Constant−2137.4 ***−471.0 ***−308.7 **
(−3.26)(−4.43)(−2.14)
Region Fixed EffectsYesYesYes
Period Fixed EffectsYesYesYes
R-squared0.7210.7270.724
Observations303830383038
Underidentification test230.5521450.9321201.297
Chi-sq(2) p-value0.0000.0000.000
Weak identification test124.1831385.212990.623
Sargan statistics0.0140.8210.063
Chi-sq(1) p-value0.9070.3650.805
Number of regions202020
t statistics in parentheses; * p < 0.1, ** p < 0.05, *** p < 0.01.
Table A2. Effect of Inequality on Internal Mobility (2SLS Model, with five time-lags).
Independent VariablesMigration FlowsMigration FlowsMigration Flows
Five Lags Migration Flows0.967 ***
(254.7)
0.967 ***
(257.1)
0.968 ***
(257.8)
Five Lags Gini Origin20,469.2 **
(2.13)
Five Lags Gini Destination2103.4
(1.37)
Five Lags Relative Poverty Origin 18.85 **
(2.30)
Five Lags Relative Poverty Destination −1.850
(−0.39)
Five Lags Income Ratio Origin −234.2 ***
(−2.64)
Five Lags Income Ratio Destination 87.80 **
(2.56)
Distance−1.872 ***−2.134 ***−2.168 ***
(−7.72)(−10.73)(−10.76)
Distance20.001 ***0.001 ***0.001 ***
(7.71)(10.81)(10.87)
Five Lags Unemployed Origin−61.35−6.199−38.01
(−1.52)(−0.44)(−1.61)
Five Lags Unemployed Destination−52.57 ***−39.13 ***−17.71 *
(−6.08)(−4.16)(−1.66)
Five Lags Population Origin0.000 ***0.000 ***0.000 ***
(7.99)(19.33)(18.97)
Five Lags Population Destination0.000 ***0.000 ***0.000 ***
(25.12)(26.03)(26.31)
Five Lags Education Level Origin18,517.824,914.3 *−3868.6
(1.39)(1.92)(−0.25)
Five Lags Education Level Destination47,312.3 ***44,995.7 ***56,598.1 ***
(3.57)(3.56)(4.36)
Five Lags Crime Origin16.13 ***22.38 ***26.77 ***
(2.83)(5.69)(6.76)
Five Lags Crime Destination1.4371.336−0.471
(0.34)(0.34)(−0.12)
Constant5790.1 **−481.7 ***65.72
(−2.43)(−3.71)(0.19)
Region Fixed EffectsYesYesYes
Period Fixed EffectsYesYesYes
R-squared0.6920.7290.723
Observations303830383038
Underidentification test35.332649.978292.874
Chi-sq(2) p-value0.0000.0000.000
Weak identification test17.868491.133171.958
Sargan statistics0.0010.4500.383
Chi-sq(1) p-value0.9760.5020.536
Number of regions202020
t statistics in parentheses; * p < 0.1, ** p < 0.05, *** p < 0.01.

References

  1. Accetturo, Antonio, Francesco Manaresi, Sauro Mocetti, and Elisabetta Olivieri. 2014. Don’t Stand so close to me: The urban impact of immigration. Regional Science and Urban Economics 45: 45–56. [Google Scholar] [CrossRef]
  2. Angelucci, Manuela. 2012. Conditional cash transfer programs, credit constraints, and migration. Labour 26: 124–36. [Google Scholar] [CrossRef]
  3. Ashby, Nathan J. 2007. Economic freedom and migration flows between US states. Southern Economic Journal 73: 677–97. [Google Scholar] [CrossRef]
  4. Azarnert, Leonid V. 2012. Guest-worker migration, human capital and fertility. Review of Development Economics 16: 318–30. [Google Scholar] [CrossRef]
  5. Bai, Janjun, Wenjin Jin, and Xiaoxiao Shi. 2019. Technology, e-commerce, and labor market institutions. Review of Economic Dynamics 33: 251–73. [Google Scholar]
  6. Bailey, Zinzi D., Nancy Krieger, Madina Agénor, Jasmine Graves, Natalia Linos, and Mary T. Bassett. 2017. Structural racism and health inequities in the USA: Evidence and interventions. Lancet 389: 1453–63. [Google Scholar] [CrossRef]
  7. Bartolucci, Cristian, Claudia Villosio, and Mathis Wagner. 2018. Who migrates and why? Evidence from Italian administrative data. Journal of Labor Economics 36: 551–88. [Google Scholar] [CrossRef]
  8. Benassi, Federico, Corrado Bonifazi, Frank Heins, Francesca Licari, and Enrico Tucci. 2019. Population Change and International and Internal Migration in Italy, 2002–2017: Ravenstein Revisited. Comparative Population Studies 44: 497–532. [Google Scholar] [CrossRef]
  9. Biagi, Bianca, Alessandra Faggian, and Philip McCann. 2011. Long and short distance migration in Italy: The role of economic, social and environmental characteristics. Spatial Economic Analysis 6: 111–31. [Google Scholar] [CrossRef]
  10. Blomquist, Glenn C., Mark C. Berger, and John P. Hoehn. 1988. New estimates of quality of life in urban areas. The American Economic Review 78: 89–107. [Google Scholar]
  11. Bonifazi, Corrado, Frank Heins, and Enrico Tucci. 2017. Italy: Internal migration in a low-mobility country. In Internal Migration in the Developed World. London: Routledge, pp. 242–62. [Google Scholar]
  12. Borjas, George J. 1987. Self-Selection and the Earnings of Immigrants. American Economic Review 77: 531–53. [Google Scholar]
  13. Borjas, George J. 1989. Immigrant and Emigrant Earnings: A Longitudinal Study. Economic Inquiry 27: 21–37. [Google Scholar] [CrossRef]
  14. Borjas, George J. 1995. The Economic Benefits from Immigration. Journal of Economic Perspectives 9: 3–22. [Google Scholar] [CrossRef]
  15. Boschini, Anne D., Jan Pettersson, and Jesper Roine. 2007. Resource curse or not: A question of appropriability. Scandinavian Journal of Economics 109: 593–617. [Google Scholar] [CrossRef]
  16. Cannari, Luigi, Francesco Nucci, and Paolo Sestito. 2000. Geographic labour mobility and the cost of housing: Evidence from Italy. Applied Economics 32: 1899–906. [Google Scholar] [CrossRef]
  17. Ceriani, Lidia, and Paolo Verme. 2012. The origins of the Gini index: Extracts from Variabilità e Mutabilità (1912) by Corrado Gini. The Journal of Economic Inequality 10: 421–43. [Google Scholar] [CrossRef]
  18. Ciccarelli, Carlo, Cosimo Magazzino, and Edoardo Marcucci. 2021. Early development of Italian railways and industrial growth: A regional analysis. Research in Transportation Economics 88: 100916. [Google Scholar] [CrossRef]
  19. Corrigall-Brown, Caroline, and Mabel Ho. 2015. How the state shapes social movements. Protest and Politics: The Promise of Social Movement Societies, 101–17. Available online: https://books.google.com.sg/books?hl=en&lr=&id=dKJeCAAAQBAJ&oi=fnd&pg=PA101&dq=How+the+state+shapes+social+movements&ots=LDPxb_xwzV&sig=DK7JwA95ZyBGAo_e3YdEdmd4OmI&redir_esc=y#v=onepage&q=How%20the%20state%20shapes%20social%20movements&f=false (accessed on 17 November 2024).
  20. Coulter, Rory, and Jacqueline Scott. 2015. What motivates residential mobility? Re-examining self-reported reasons for desiring and making residential moves. Population, Space and Place 21: 354–71. [Google Scholar] [CrossRef]
  21. Cullen, Julie Berry, and Steven D. Levitt. 1999. Crime, Urban Flight, and the Consequences for Cities. The Review of Economics and Statistics 81: 159–69. [Google Scholar] [CrossRef]
  22. Cushing, Brian, and Jacques Poot. 2004. Crossing boundaries and borders: Regional science advances in migration modelling. Papers in Regional Science 83: 317–38. [Google Scholar] [CrossRef]
  23. Di Quirico, Roberto. 2010. Italy and the global economic crisis. Bulletin of Italian Politics 2: 3–19. [Google Scholar]
  24. Epstein, Gil S., and Ira N. Gang. 2006. Ethnic networks and international trade. In Labor Mobility and the World Economy. Berlin and Heidelberg: Springer, pp. 85–103. [Google Scholar]
  25. Etzo, Ivan. 2011. The determinants of the recent interregional migration flows in Italy: A panel data analysis. Journal of Regional Science 51: 948–66. [Google Scholar] [CrossRef]
  26. Felice, Emanuele. 2018. The socio-institutional divide: Explaining Italy’s long-term regional differences. Journal of Interdisciplinary History 49: 43–70. [Google Scholar] [CrossRef]
  27. Felice, Emanuele, and Michelangelo Vasta. 2015. Passive modernization? The new human development index and its components in Italy’s regions (1871–2007). European Review of Economic History 19: 44–66. [Google Scholar] [CrossRef]
  28. Forman, Chris, Avi Goldfarb, and Shane Greenstein. 2005. How did location affect adoption of the commercial internet? Global village vs. urban leadership. Journal of Urban Economics 58: 389–420. [Google Scholar] [CrossRef]
  29. Freedman, Matthew, and Emily G. Owens. 2011. Low-income housing development and crime. Journal of Urban Economics 70: 115–31. [Google Scholar] [CrossRef]
  30. Gagliardi, Luisa, and Marco Percoco. 2011. Regional disparities in Italy over the long run: The role of human capital and trade policy. Région et Développement 33: 81–105. [Google Scholar]
  31. García, Ana Isabel López. 2018. Economic remittances, temporary migration and voter turnout in Mexico. Migration Studies 6: 20–52. [Google Scholar] [CrossRef]
  32. Gastil, Raymond Duncan. 1990. The comparative survey of freedom: Experiences and suggestions. Studies in Comparative International Development 25: 25–50. [Google Scholar] [CrossRef]
  33. Glaeser, Edward L., Matt Resseger, and Kristina Tobio. 2009. Inequality in cities. Journal of Regional Science 49: 617–46. [Google Scholar] [CrossRef]
  34. Graves, Philip E. 1976. A reexamination of migration, economic opportunity, and the quality of life. Journal of Regional Science 16: 107–12. [Google Scholar] [CrossRef]
  35. Greenwood, Michael J. 1975. Research on internal migration in the United States: A survey. Journal of Economic Literature 13: 397–433. [Google Scholar]
  36. Greenwood, Michael J. 1997. Internal Migration in Developed Countries. In Handbook of Population and Family Economics. Amsterdam: Elsevier, vol. 1, pp. 647–720. [Google Scholar]
  37. Harris, John R., and Michael P. Todaro. 1970. Migration, unemployment and development: A two-sector analysis. The American Economic Review 60: 126–42. [Google Scholar]
  38. Hausman, Jerry A., Whitney K. Newey, Tiemen Woutersen, John C. Chao, and Norman R. Swanson. 2012. Instrumental variable estimation with heteroskedasticity and many instruments. Quantitative Economics 3: 211–55. [Google Scholar] [CrossRef]
  39. Henry, LaVaughn M. 2014. Income Inequality and Income-Class Consumption Patterns. In Economic Commentary. Cleveland: Federal Reserve Bank of Cleveland. [Google Scholar]
  40. Jargowsky, Paul A. 2015. The Architecture of Segregation: Civil Unrest, the Concentration of Poverty, and Public Policy. The Century Foundation, August 7. [Google Scholar]
  41. Juarez, Juan Pablo. 2000. Analysis of interregional labor migration in Spain using gross flows. Journal of Regional Science 40: 377–99. [Google Scholar] [CrossRef]
  42. Katz-Gerro, Tally. 2002. Highbrow Cultural Consumption and Class Distinction in Italy, Israel, West Germany, Sweden, and the United States. Social Forces 81: 207–29. [Google Scholar] [CrossRef]
  43. Katz-Gerro, Tally. 2006. Comparative evidence of inequality in cultural preferences: Gender, class, and family status. Sociological Spectrum 26: 63–83. [Google Scholar] [CrossRef]
  44. Kolko, Jed. 2012. Broadband and local growth. Journal of Urban Economics 71: 100–13. [Google Scholar] [CrossRef]
  45. LeSage, James P., and R. Kelley Pace. 2008. Spatial econometric modeling of origin-destination flows. Journal of Regional Science 48: 941–67. [Google Scholar] [CrossRef]
  46. Lisciandra, Maurizio, Riccardo Milani, and Emanuele Millemaci. 2022. A corruption risk indicator for public procurement. European Journal of Political Economy 73: 102141. [Google Scholar] [CrossRef]
  47. Manioudis, Manolis, and Antonios Angelakis. 2023. Creative economy and sustainable regional growth: Lessons from the implementation of entrepreneurial discovery process at the regional level. Sustainability 15: 7681. [Google Scholar] [CrossRef]
  48. Molloy, Raven, Christopher L. Smith, and Abigail Wozniak. 2017. Job Changing and the Decline in Long-Distance Migration in the United States. Demography 54: 631–53. [Google Scholar] [CrossRef] [PubMed]
  49. Monras, Joan. 2018. Economic Shocks and Internal Migration. CEPR Discussion Paper No. DP12977. London: Centre for Economic Policy Research (CEPR). [Google Scholar]
  50. Musolino, Dario. 2018. The north-south divide in Italy: Reality or perception? European Spatial Research and Policy 25: 29–53. [Google Scholar] [CrossRef]
  51. Mussida, Chiara, and Maria Laura Parisi. 2016. The Effect of Economic Crisis on Regional Income Inequality in Italy. Regional Studies 50: 1869–89. [Google Scholar]
  52. Odoardi, Iacopo, and Fabrizio Muratore. 2019. The north–south divergence in Italy during the great recession. The Manchester School 87: 1–23. [Google Scholar] [CrossRef]
  53. Panichella, Nazareno. 2012. Le migrazioni interne nel secolo scorso: Vecchie e nuove forme a confronto. Stato e Mercato 32: 255–82. [Google Scholar]
  54. Percoco, Marco. 2018. Wealth inequality, redistribution and local development: The case of land reform in Italy. Environment and Planning C: Politics and Space 36: 181–200. [Google Scholar] [CrossRef]
  55. Perez-Villadoniga, Maria J., and Sara Suarez-Fernandez. 2019. Education, income and cultural participation across Europe. Cuadernos Económicos de ICE 98: 89–103. [Google Scholar] [CrossRef]
  56. Piras, Romano. 2020. Internal Migration in Italy: The Role of Migration Networks. Italian Economic Journal 6: 157–95. [Google Scholar] [CrossRef]
  57. Putnam, Robert D. 2000. Bowling Alone: The Collapse and Revival of American Community. New York: Simon and Schuster. [Google Scholar]
  58. Reardon, Sean F., and Kendra Bischoff. 2011. Income inequality and income segregation. American Journal of Sociology 116: 1092–153. [Google Scholar] [CrossRef]
  59. Roback, Jennifer. 1982. Wages, rents, and the quality of life. Journal of Political Economy 90: 1257–78. [Google Scholar] [CrossRef]
  60. Sanfilippo, Matteo. 2016. The Debate on Personal Sources for the History of Italian Emigration. In From the Records of My Deepest Memory: Personal Sources and the Study of European Migration, 18th–20th Centuries. Bilbao: Universidad del País Vasco, Euskal Herriko Unibertsitatea, pp. 123–36. [Google Scholar]
  61. Schwartz, Amy Ellen, Scott Susin, and Ioan Voicu. 2003. Has falling crime driven New York City’s real estate boom? Journal of Housing Research 14: 101–35. [Google Scholar]
  62. Sharkey, Patrick, and Robert J. Sampson. 2010. Destination effects: Residential mobility and trajectories of adolescent violence in a stratified metropolis. Criminology 48: 639–81. [Google Scholar] [CrossRef] [PubMed]
  63. Simpson, Nicole B. 2017. Demographic and economic determinants of migration. IZA World of Labor 2022: 373. [Google Scholar] [CrossRef]
  64. Standing, Guy. 2017. Basic Income: And How We Can Make It Happen. London: Pelican. [Google Scholar]
  65. Widerquist, Karl. 2018. A Critical Analysis of Basic Income Experiments for Researchers, Policymakers, and Citizens. Cham: Springer. [Google Scholar]
  66. Zamagni, Vera. 1993. The Economic History of Italy 1860–1990. Oxford: Clarendon Press. [Google Scholar]
  67. Zamagni, Vittorio. 2008. Introduzione Alla Storia Economica. Italy: Il Mulino. [Google Scholar]
  68. Zhang, Qi, Richard E. Bilsborrow, Conghe Song, Shiqi Tao, and Qingfeng Huang. 2019. Rural household income distribution and inequality in China: Effects of payments for ecosystem services policies and other factors. Ecological Economics 160: 114–27. [Google Scholar] [CrossRef]
Figure 1. Migration flows—Italian regions.
Economies 12 00317 g001
Figure 2. Inequality (Gini Index)—Italian regions.
Economies 12 00317 g002
Figure 3. Inequality (Relative Poverty)—Italian regions.
Economies 12 00317 g003
Figure 4. Inequality (Income Ratio)—Italian regions.
Economies 12 00317 g004
Table 1. List of inequality measures.
VariableDescription
Gini IndexStatistical measure of income distribution. The
coefficient ranges from 0 (or 0%) to 1 (or 100%),
with 0 representing perfect equality and 1
representing perfect inequality.
Relative Poverty IndexStatistical measure describing economic struggle to
use goods and services in specific geographic areas,
in relation to the average economic level of the same
geographic areas.
Top 20% Income/Bottom 20% IncomeIndex describing the amount of people in the top
20% of the income level scale in a specific
geographic area, compared to the amount of people
in the bottom 20% of the income level scale, in the
same geographic area.
Table 2. Instruments for income inequality.
InstrumentDescriptionCorrelation with GiniCorrelation with Rel. Pov.Correlation with Income RatioMeanStd. DeviationMin.Max.
Theater/CinemaPeople who can afford theater/people who can afford cinema.0.3220.5680.6050.7660.0560.6030.946
Internet Purchase/Internet AccessPeople who make online purchases/people with just internet access.0.4440.6660.6460.7440.0640.5460.882
Table 3. IV estimators.
EstimatorDescription
LIMLLinear combination of the OLS and 2SLS estimate (with the weights depending on the data). Absence of the 2SLS bias. Very precise under homoskedasticity. Inconsistent under heteroskedasticity and many instruments.
FULLIV estimator with lower bias than LIML, due to the smaller number of outliers. Very precise under homoskedasticity. Inconsistent with heteroskedasticity and many instruments.
HLIMUpdated version of LIML, developed by Hausman et al. (2012). Consistent under heteroskedasticity and has many instrument-robust versions.
HFULUpdated version of FULL, developed by Hausman et al. (2012). Consistent under heteroskedasticity and has many instrument-robust versions.
Table 4. Effect of inequality on interregional mobility (OLS model).
Independent VariablesMigration FlowsMigration FlowsMigration Flows
Lagged Migration Flows0.967 ***
(254.69)
0.967 ***
(257.09)
0.968 ***
(257.80)
Lagged Gini Origin380.27 **
(2.08)
Lagged Gini Destination705.3 ***
(2.09)
Lagged Relative Poverty Origin 0.752
(0.56)
Lagged Relative Poverty Destination −0.81
(−0.53)
Lagged Income Ratio Origin −37.62 ***
(−3.76)
Lagged Income Ratio Destination −3.921
(−0.41)
Distance−9.934 *−10.33 *−11.97 **
(−1.48)(−1.59)(−2.21)
Distance20.02 *0.02 *0.021 **
(1.64)(1.71)(1.85)
Lagged Unemployed Origin−8.04 ***−8.732 ***−8.176 ***
(−3.08)(−3.51)(−3.15)
Lagged Unemployed Destination2.5312.9021.145
(116)(1.20)(0.52)
Lagged Population Origin−0.000 ***−0.001 ***−0.001 ***
(−3.69)(−5.07)(−5.30)
Lagged Population Destination−0.000 ***−0.001 ***−0.001 ***
(−2.76)(−2.92)(−2.95)
Lagged Education Level Origin−14,398.25 **−17,141.7 **−20,908.52 ***
(−1.99)(−2.29)(−1.32)
Lagged Education Level Destination34,315.0 ***32,680.12 ***33,299.1 ***
(3.55)(3.26)(3.33)
Lagged Crime Origin0.159−0.0380.256
(0.15)(−0.04)(0.25)
Lagged Crime Destination1.0441.4340.323
(0.88)(1.26)(0.29)
Constant−1336.939−905.01−276.63
(−0.73)(−0.49)(−0.16)
Region Fixed EffectsYesYesYes
Period Fixed EffectsYesYesYes
R-squared0.0230.0210.021
Observations303830383038
Number of Regions202020
t statistics in parentheses; * p < 0.1, ** p < 0.05, *** p < 0.01.
Table 5. Effect of inequality on interregional mobility (2SLS model).
Independent VariablesMigration FlowsMigration FlowsMigration Flows
Lagged Migration Flows0.967 ***
(254.69)
0.967 ***
(257.09)
0.968 ***
(257.80)
Lagged Gini Origin10,805.9 ***
(2.94)
Lagged Gini Destination166.5
(0.17)
Lagged Relative Poverty Origin 19.93 ***
(3.48)
Lagged Relative Poverty Destination −5.501
(−1.45)
Lagged Income Ratio Origin −190.9 ***
(−4.50)
Lagged Income Ratio Destination 107.6 ***
(4.08)
Distance−1.995 ***−2.099 ***−2.132 ***
(−12.41)(−13.60)(−13.59)
Distance20.001 ***0.001 ***0.001 ***
(12.29)(13.74)(13.77)
Lagged Unemployed Origin−8.5380.105−12.76
(−0.74)(0.01)(−1.68)
Lagged Unemployed Destination−26.98 ***−21.46 ***−8.056
(−5.15)(−3.52)(−1.33)
Lagged Population Origin0.000 ***0.000 ***0.000 ***
(15.08)(29.76)(29.08)
Lagged Population Destination0.000 ***0.000 ***0.000 ***
(34.31)(35.40)(33.53)
Lagged Education Level Origin21,016.128,922.1 **−1478.939
(1.84)(2.48)(−0.14)
Lagged Education Level Destination61,253.3 ***56,741.5 ***70,417.2 ***
(5.44)(5.05)(6.29)
Lagged Crime Origin14.47 ***19.92 ***20.30 ***
(4.25)(5.99)(6.48)
Lagged Crime Destination−4.000−5.005−5.656 *
(−1.24)(−1.62)(−1.82)
Constant−3181.9 ***−571.0 ***−277.4 *
(−3.73)(−5.13)(−1.92)
Region Fixed EffectsYesYesYes
Period Fixed EffectsYesYesYes
R-squared0.7090.7260.722
Observations303830383038
Underidentification Test140.2581284.9831097.769
KP-F Statistics18.50017.35314.228
Weak Identification Test72.8501108.580808.171
Sargan Statistics0.5170.8170.162
Chi-sq(1) p-value0.4190.3660.687
Number of Regions202020
t statistics in parentheses; * p < 0.1, ** p < 0.05, *** p < 0.01.
Disclaimer/Publisher’s Note: The statements, opinions and data contained in all publications are solely those of the individual author(s) and contributor(s) and not of MDPI and/or the editor(s). MDPI and/or the editor(s) disclaim responsibility for any injury to people or property resulting from any ideas, methods, instructions or products referred to in the content.

