1. Introduction
Economic crises do not affect all members of a given society equally but embody redistributive mechanisms: those that have a limited capacity to respond are more vulnerable and, therefore, suffer greater losses. From this idea has sprung a long line of empirical works investigating the effects of economic crises on income distribution and the risk of poverty. Their conclusion, albeit not unanimous, is that income inequality, poverty, and the risk of social exclusion tend to increase during periods of crisis (
Melidis and Tzagkarakis 2022;
Bodea et al. 2021). This result mainly materializes through the negative impact on income distribution of the austerity measures undertaken to confront economic slowdowns (
De Beer 2012).
Since the great recession fueled by the financial crisis of 2007–2009, Greece has become a synonym for economic crisis and the Greek economy has been in a recession for over half of the last fifteen years. This less-than-ideal situation has been the result of two major crises that took place in the country. The first one followed the great recession and took place between 2011 and 2016. It is known in the literature as the great economic slump. During those years, Greece faced the devastating consequences of its macroeconomic and structural imbalances: unprecedentedly high unemployment rates (in 2013 the unemployment rate amounted to 27.5% of the labour force) combined with generally negative economic growth rates (in 2011 the growth rate of the real Gross Domestic Product (GDP) was −10.1%). Throughout the entirety of the great economic slump, it was only in 2014 that the real GDP growth rate turned marginally positive (0.5%)
1.
This crisis was followed by a three-year period (2017–2019) of significant de-escalation of unemployment (from 21.5% to 17.3%) and, at the same time, the GDP growth rate started to increase from an annual rate of 1.1% to 1.8%. Then, in 2020 and 2021, the Greek economy was hit by its second recent crisis, this time due to the COVID-19 pandemic. In 2020, economic growth was down by an astonishing 9.0%, while in 2021 the GDP growth rate was up to 8.3%, signaling a significant recovery of the economy boosted largely by the support measures undertaken both at a national and at a European level.
The main objective of this paper is to investigate the redistributive effects of these two almost consecutive crises of 2011–2016 and 2020–2021 and to measure their impact on the income distribution and the risk of poverty. To this end, we also investigate the main macroeconomic variables that affect the distribution of personal income and the risk of poverty in Greece.
When considering the issue of income distribution, what matters is personal income distribution, which refers to the way income is distributed among members of society regardless of its origin. The most widely used index is the “Gini coefficient of equivalized disposable income”. Its value ranges from 0% (absolute equality) to 100% (absolute inequality). Another common criterion is the “income quintile share ratio S80/S20”, which measures the ratio of the disposable income of the richest 20% of a given population to that of the poorest 20%. Notice that the S80/S20 is affected by the extreme values of the income distribution, whereas the Gini coefficient is not affected by extreme values and, thus, arguably reflects inequalities in a more satisfactory manner.
When we consider the effect of crises on poverty, we investigate the effect of crises on relative poverty and, more specifically, on the “at-risk-of-poverty rate”
2. This index, being defined as the share of people with an equivalized disposable income below the at-risk-of-poverty threshold, set at 60% of the national median equivalized disposable income after social transfers, is a measure of low incomes in comparison to that of other residents in the country. As a result, this indicator operates as another measure of income inequality.
Our paper also contributes to the ongoing discussion around the key macroeconomic factors that could potentially influence income distribution and the risk of poverty
3. More specifically, we investigate the effect of the unemployment rate, the real GDP growth rate, and the share of labour income (in its narrow sense, that is, wages and salaries) in the GDP. We go on to summarize the main findings on the relationship of these three variables with income inequality, as reported in a number of relevant empirical articles.
Firstly, the extent of unemployment and income inequality have been found to be positively correlated, meaning that higher unemployment rates tend to be associated with greater inequality (e.g.,
Petrakos et al. 2022). Secondly, there is an opaque link between income distribution and economic growth dependent on a number of factors, such as market conditions and the extent of the state’s redistributive role. The critical factor is the effectiveness of redistributive measures, mainly social transfers, used by the state (
Vavoura and Vavouras 2022). In the case of the EU member states, income inequality has been found to be positively correlated with economic growth in the cases of the economically developed member states and negatively correlated in the cases of the developing ones (
Jianu et al. 2021).
Finally, a third factor considered is the share of wages and salaries in total income. Intuition suggests that as the share of wages and salaries in total income increases, income distribution should improve. However, this relationship also depends on the form and the progressiveness of the tax system in place, as well as on the effectiveness of the social welfare system. Hence, the correlation between labour income shares, imperfectly measured by the share of wages and salaries (
Krueger 1999) and income inequality, is not clear (
Erauskin 2020). Greece is particularly interesting in terms of its labour income because it presents the lowest share of wages and salaries in the total GDP compared to all EU member states during the period 1995–2021, for which data are available.
The remainder of the paper is structured as follows:
Section 2 introduces the methodology,
Section 3 presents the results, which are discussed in
Section 4, and
Section 5 concludes.
2. Methodology
In our analysis, we study the longitudinal evolution of personal income distribution and risk of poverty in the case of Greece during the period 1995–2021. We focus on 1995–2021 because it is for those years only that reliable data on income distribution and poverty exist. The data are derived from the Statistics on Income and Living Conditions of Households (SILC), which are based on the Eurostat methodology (EU-SILC). Before 1995 there are no official data available regarding the distribution of income in Greece, neither from the Hellenic Statistical Authority (ELSTAT), nor from any other public body, with the exception of individual estimates of researchers on the subject.
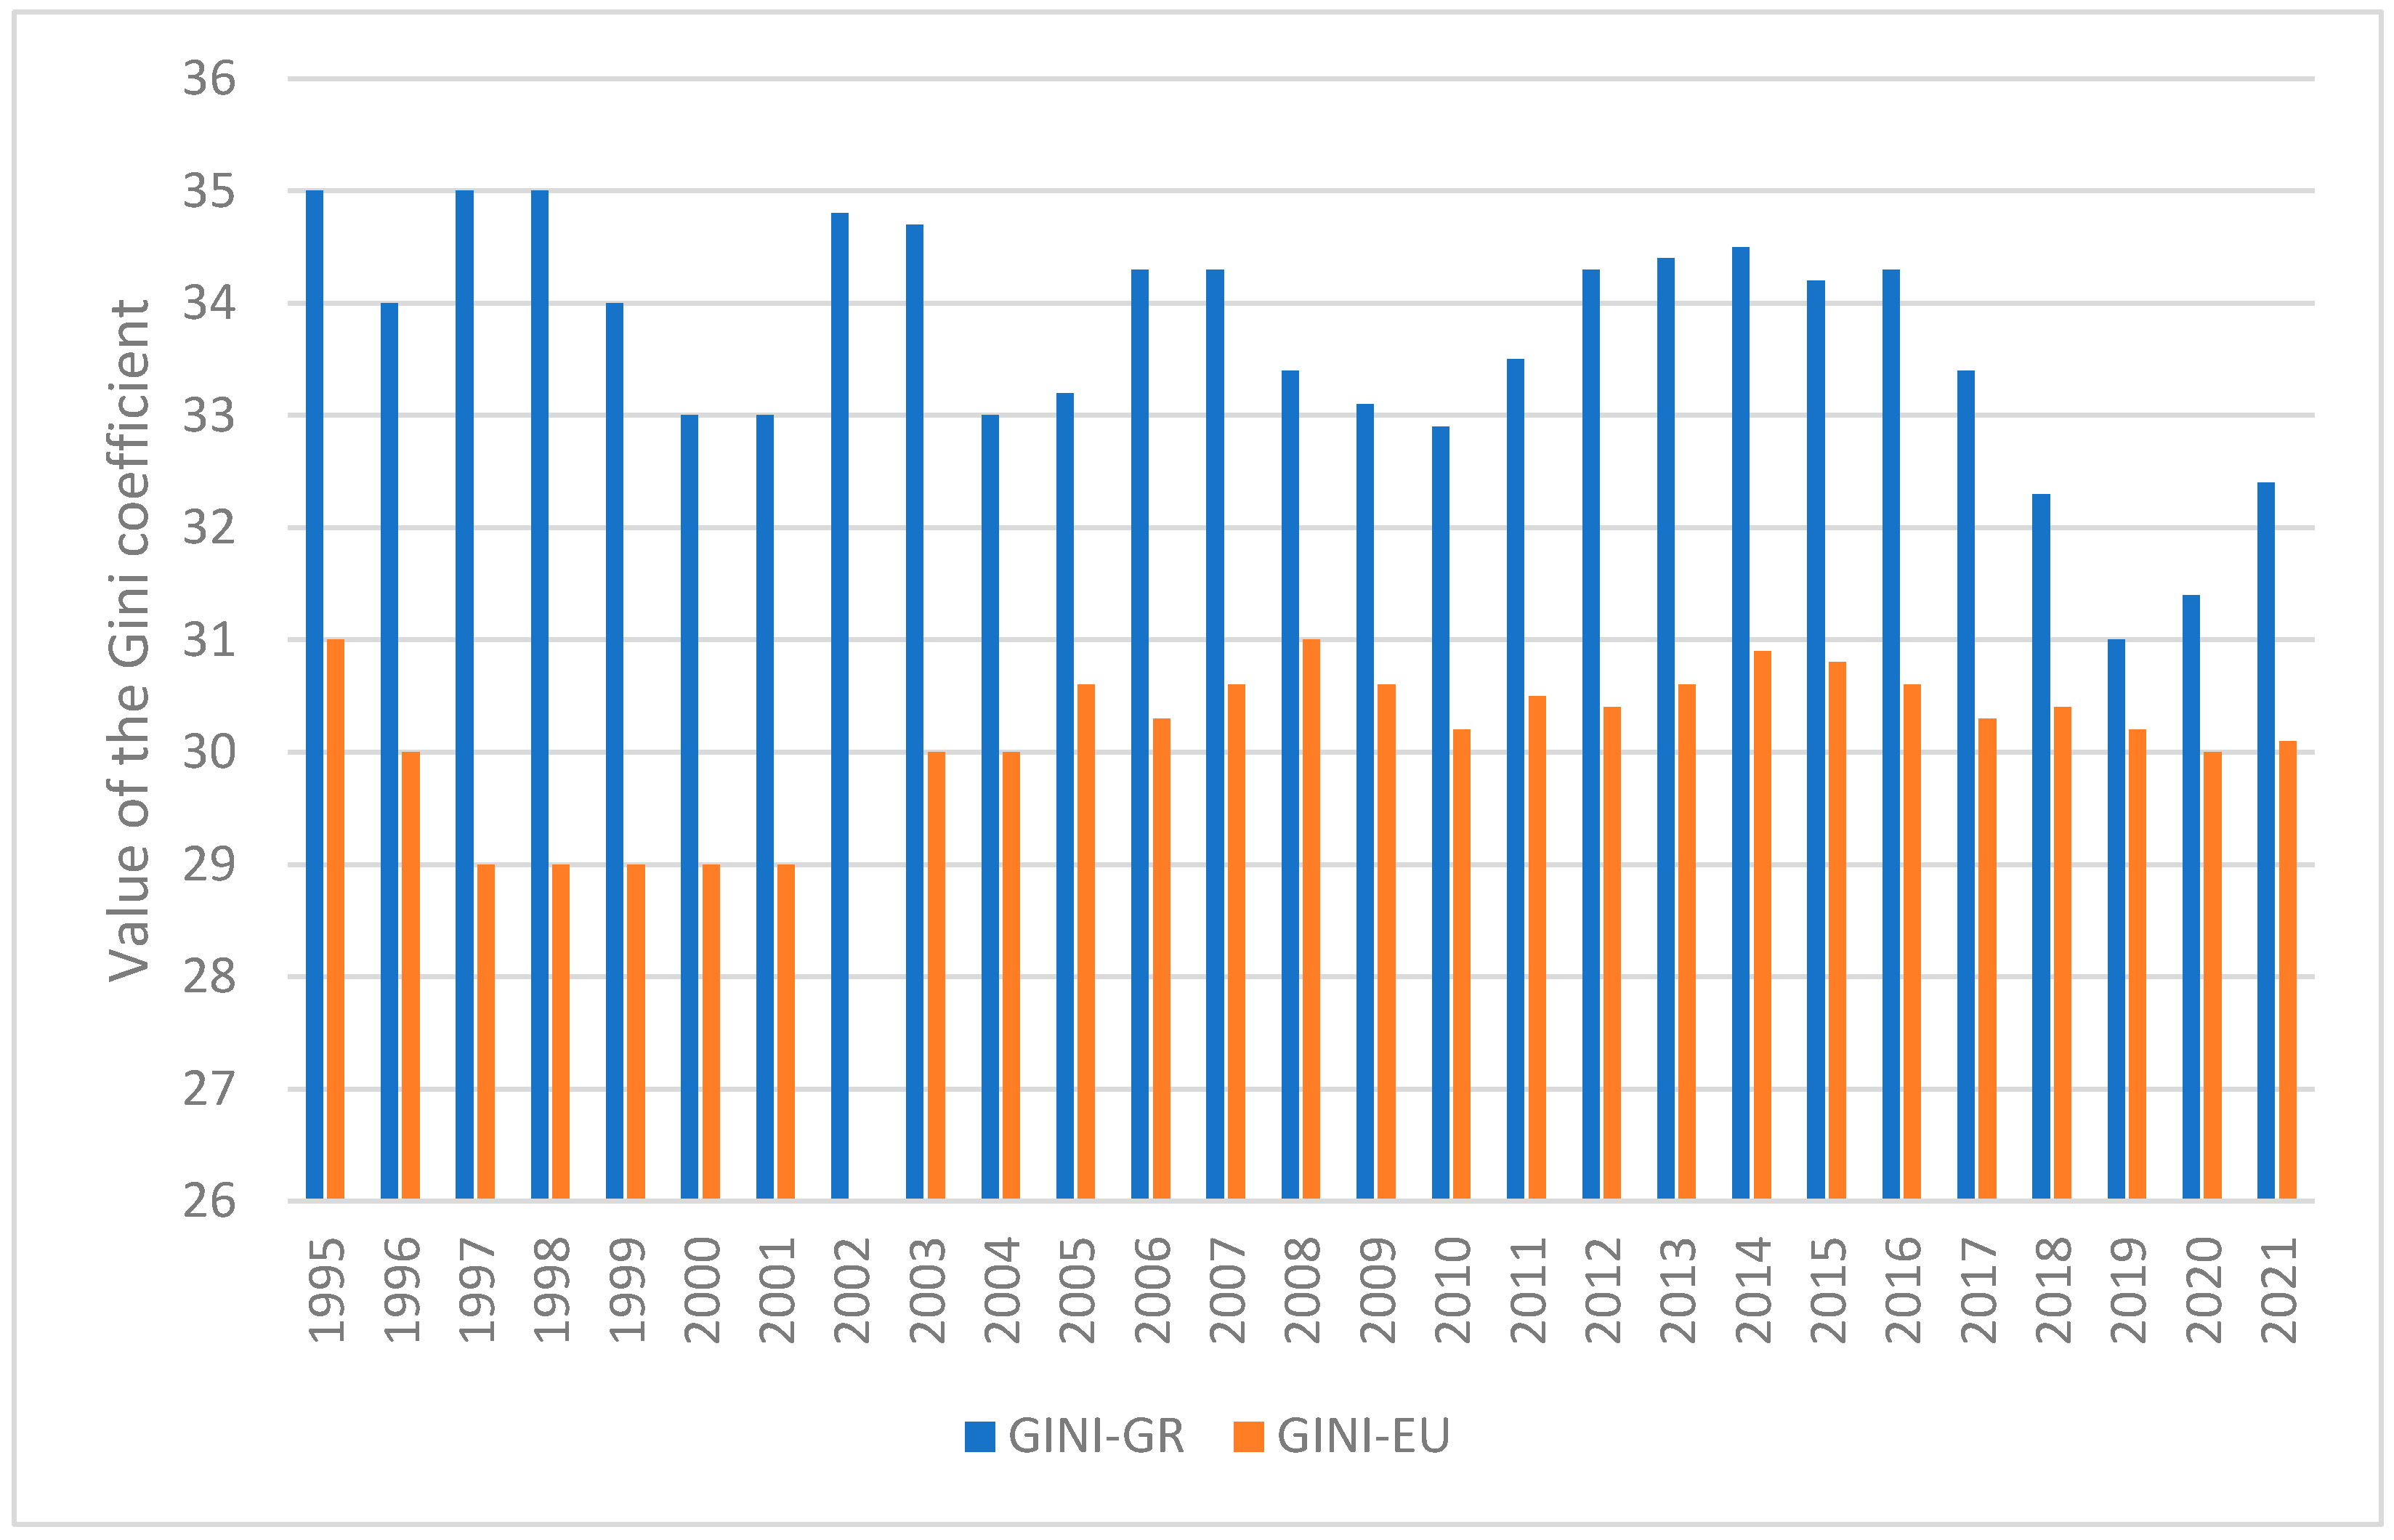
A simple overview of the evolution of the Gini coefficient in Greece and the European Union (EU) during the years 1995–2021 is presented in
Figure 1. We observe, first, that income inequality in Greece is consistently above the EU average throughout the 1995–2021 period and, second, that during the years of the two crises (2011–2016 and 2020–2021) the Greek income distribution shows signs of deterioration. The current paper aims to establish that the second observation holds: that crises have indeed increased income inequality and the risk of poverty in the case of Greece.
It is important to mention that the pattern presented in
Figure 1 is anything but universal. Focusing only on the EU, in the aftermath of the global crisis of 2007–2009, we observe that between 2006 and 2009 the Gini coefficient of 12 member states increased, in 12 it decreased, and in 1 it remained unchanged, while for 2 there are no data available. Regarding the 2020–2021 COVID-19 pandemic, we observe that between 2019 and 2021 the income distribution, as measured by the value of the Gini coefficient, worsened in 9 EU member states, improved in 14, and in 3 it remained unchanged, while for 1 there are no data available. We argue that the effects of crises on income inequality vary with the policy mix that governments use to deal with them. In the case of the EU, the majority of the member states witnessed a betterment of their income distribution as a result of the two major recent crises
4. To this rule, Greece, at first sight, appears to be an exception.
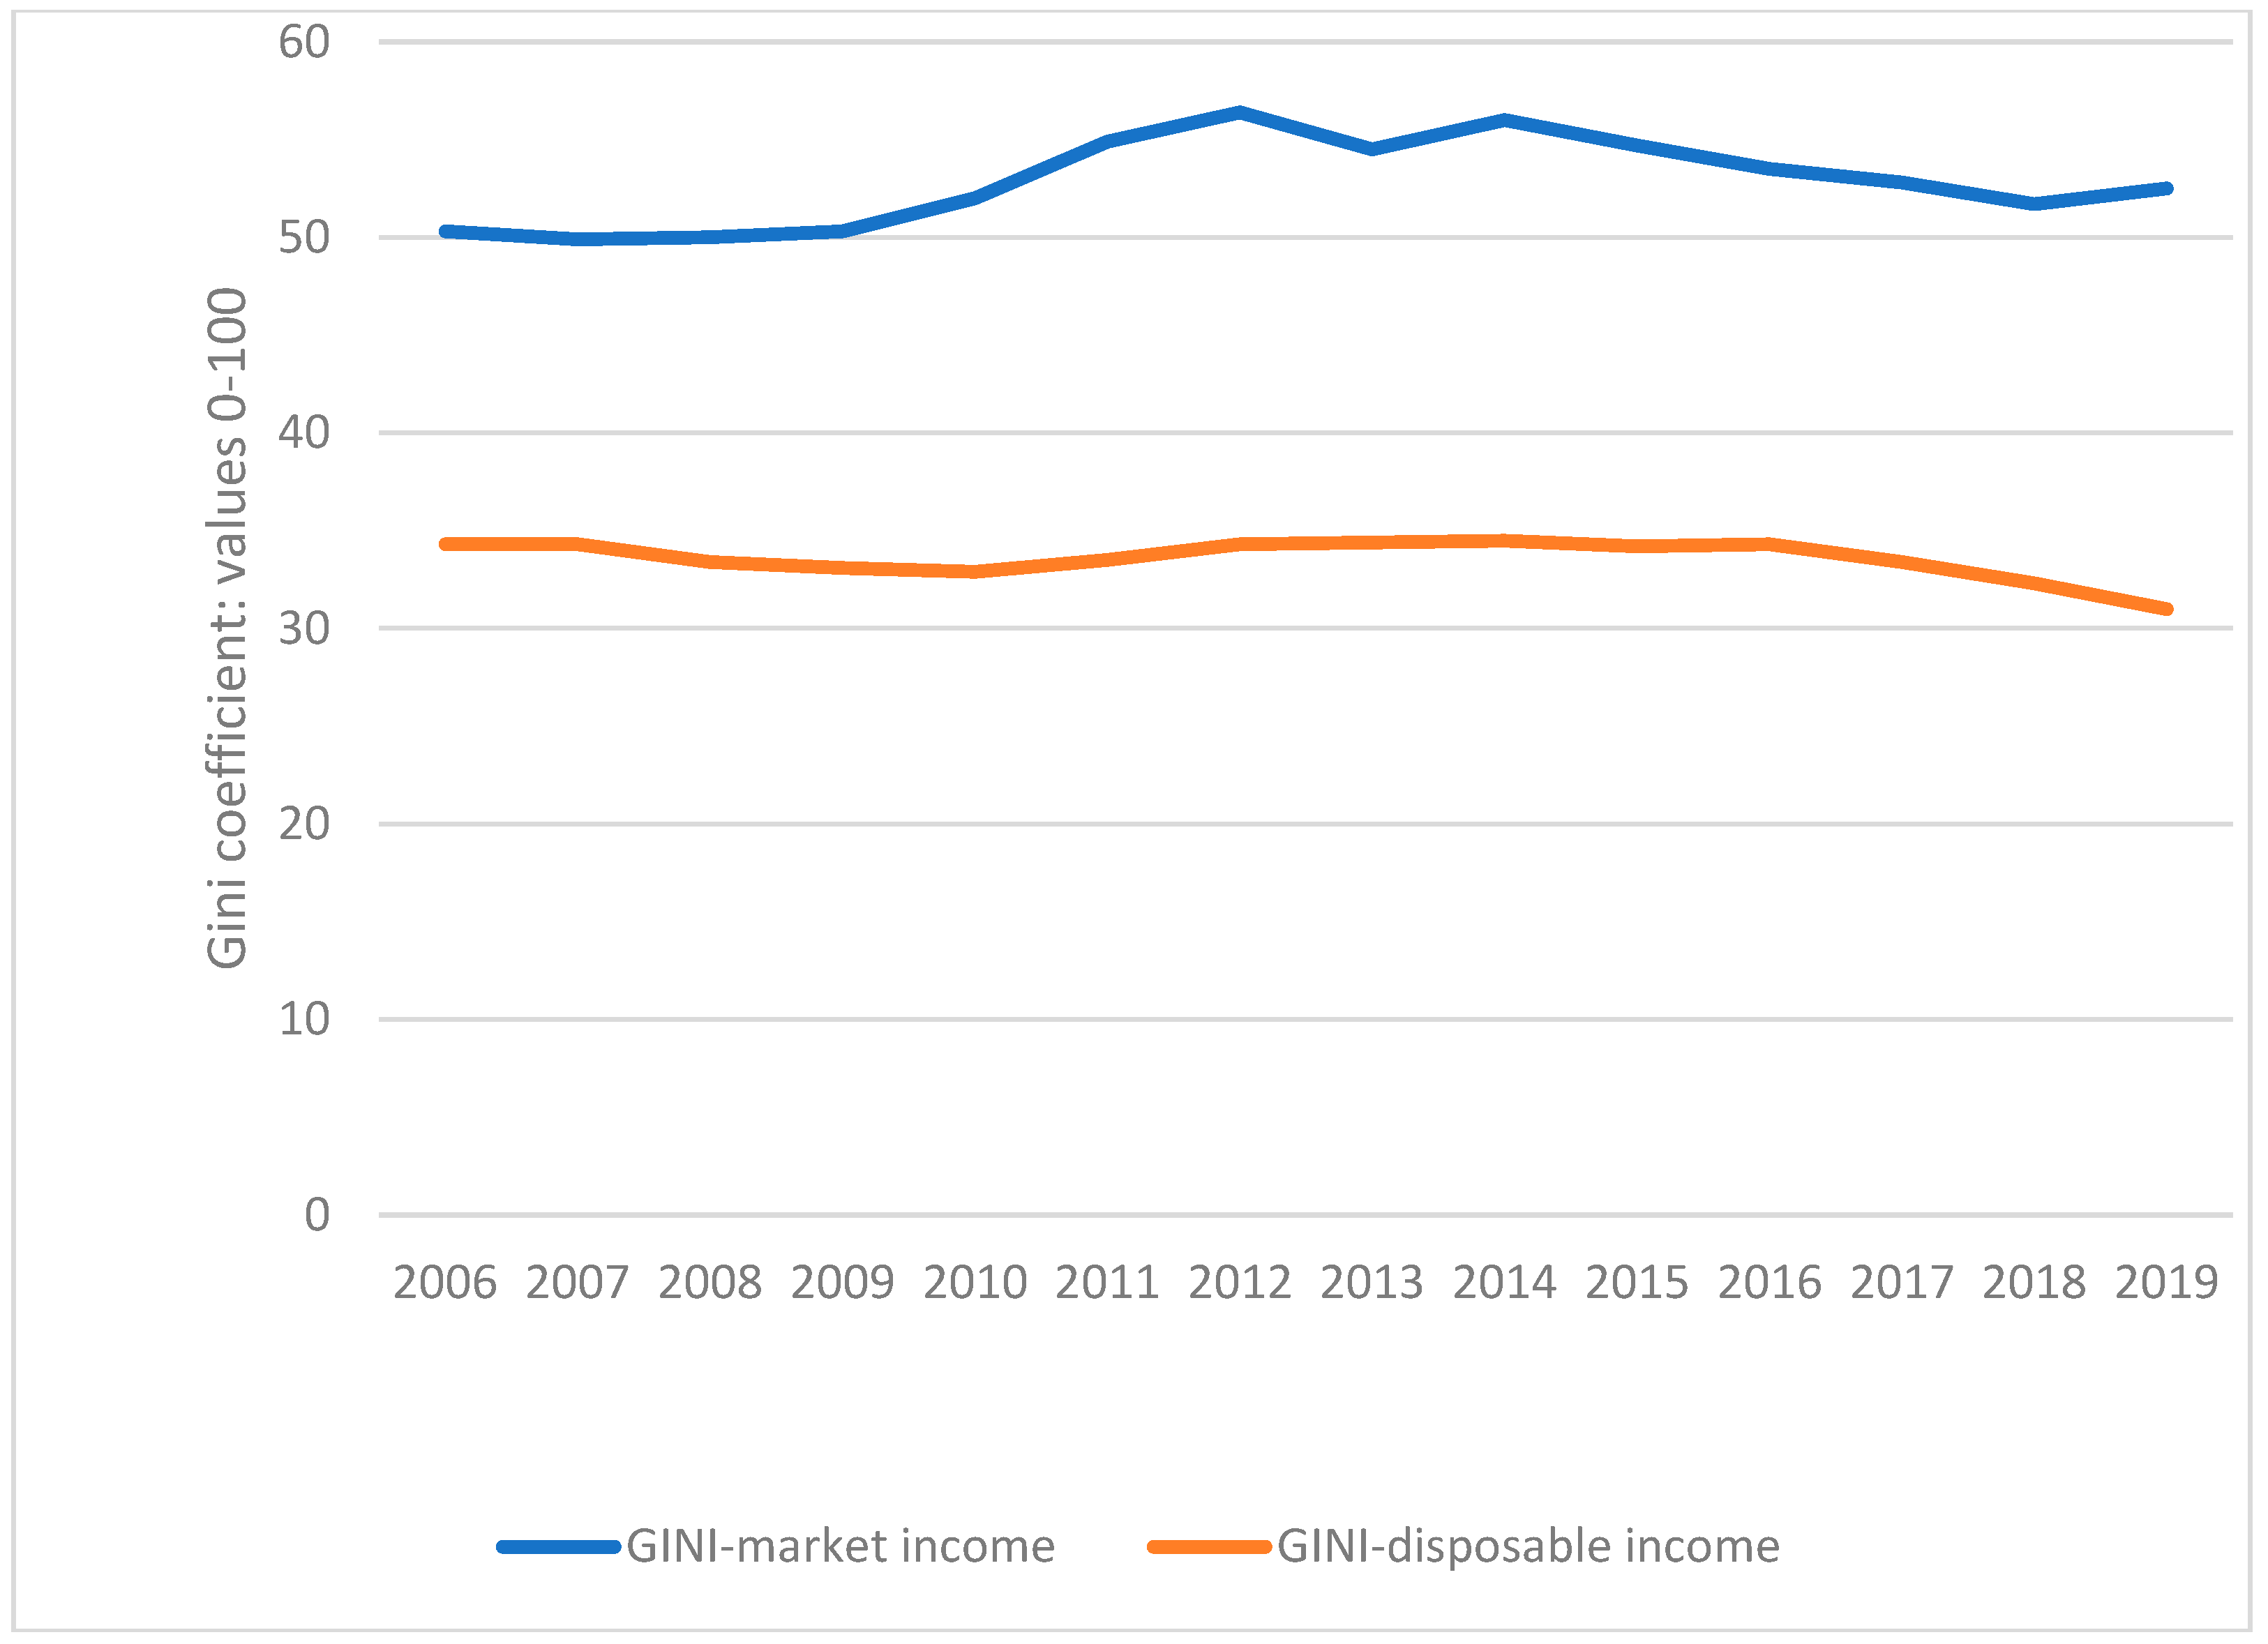
At this point, it is useful to explain why we have chosen to measure inequality via the Gini coefficient of disposable income, as opposed to the Gini coefficient of market income. In addition to data availability, since data for the Gini coefficient of market income is only available for the years 2006–2019
5, there is an additional methodological issue. By definition, disposable income is market income, that is, income from work and capital, after the deduction of direct taxes and payment of social security contributions. A comparison of market income and disposable income could be useful to evaluate the distributive role of the state. However, we argue that, when referring to income distribution and risk of poverty, what matters is the actual distribution of disposable income and not the income before the exercise of any redistributive role by the state. For this reason, the great bulk of the relevant empirical work relies on disposable income. Of course, the Gini coefficient of market income is always higher (depicting higher inequality) than the corresponding coefficient of disposable income, as the available data reveal. In the case of Greece for the period 2006–2019, for which data are available for market income, we can see this in
Figure A4 of
Appendix C.
To assess the robustness of our observations from
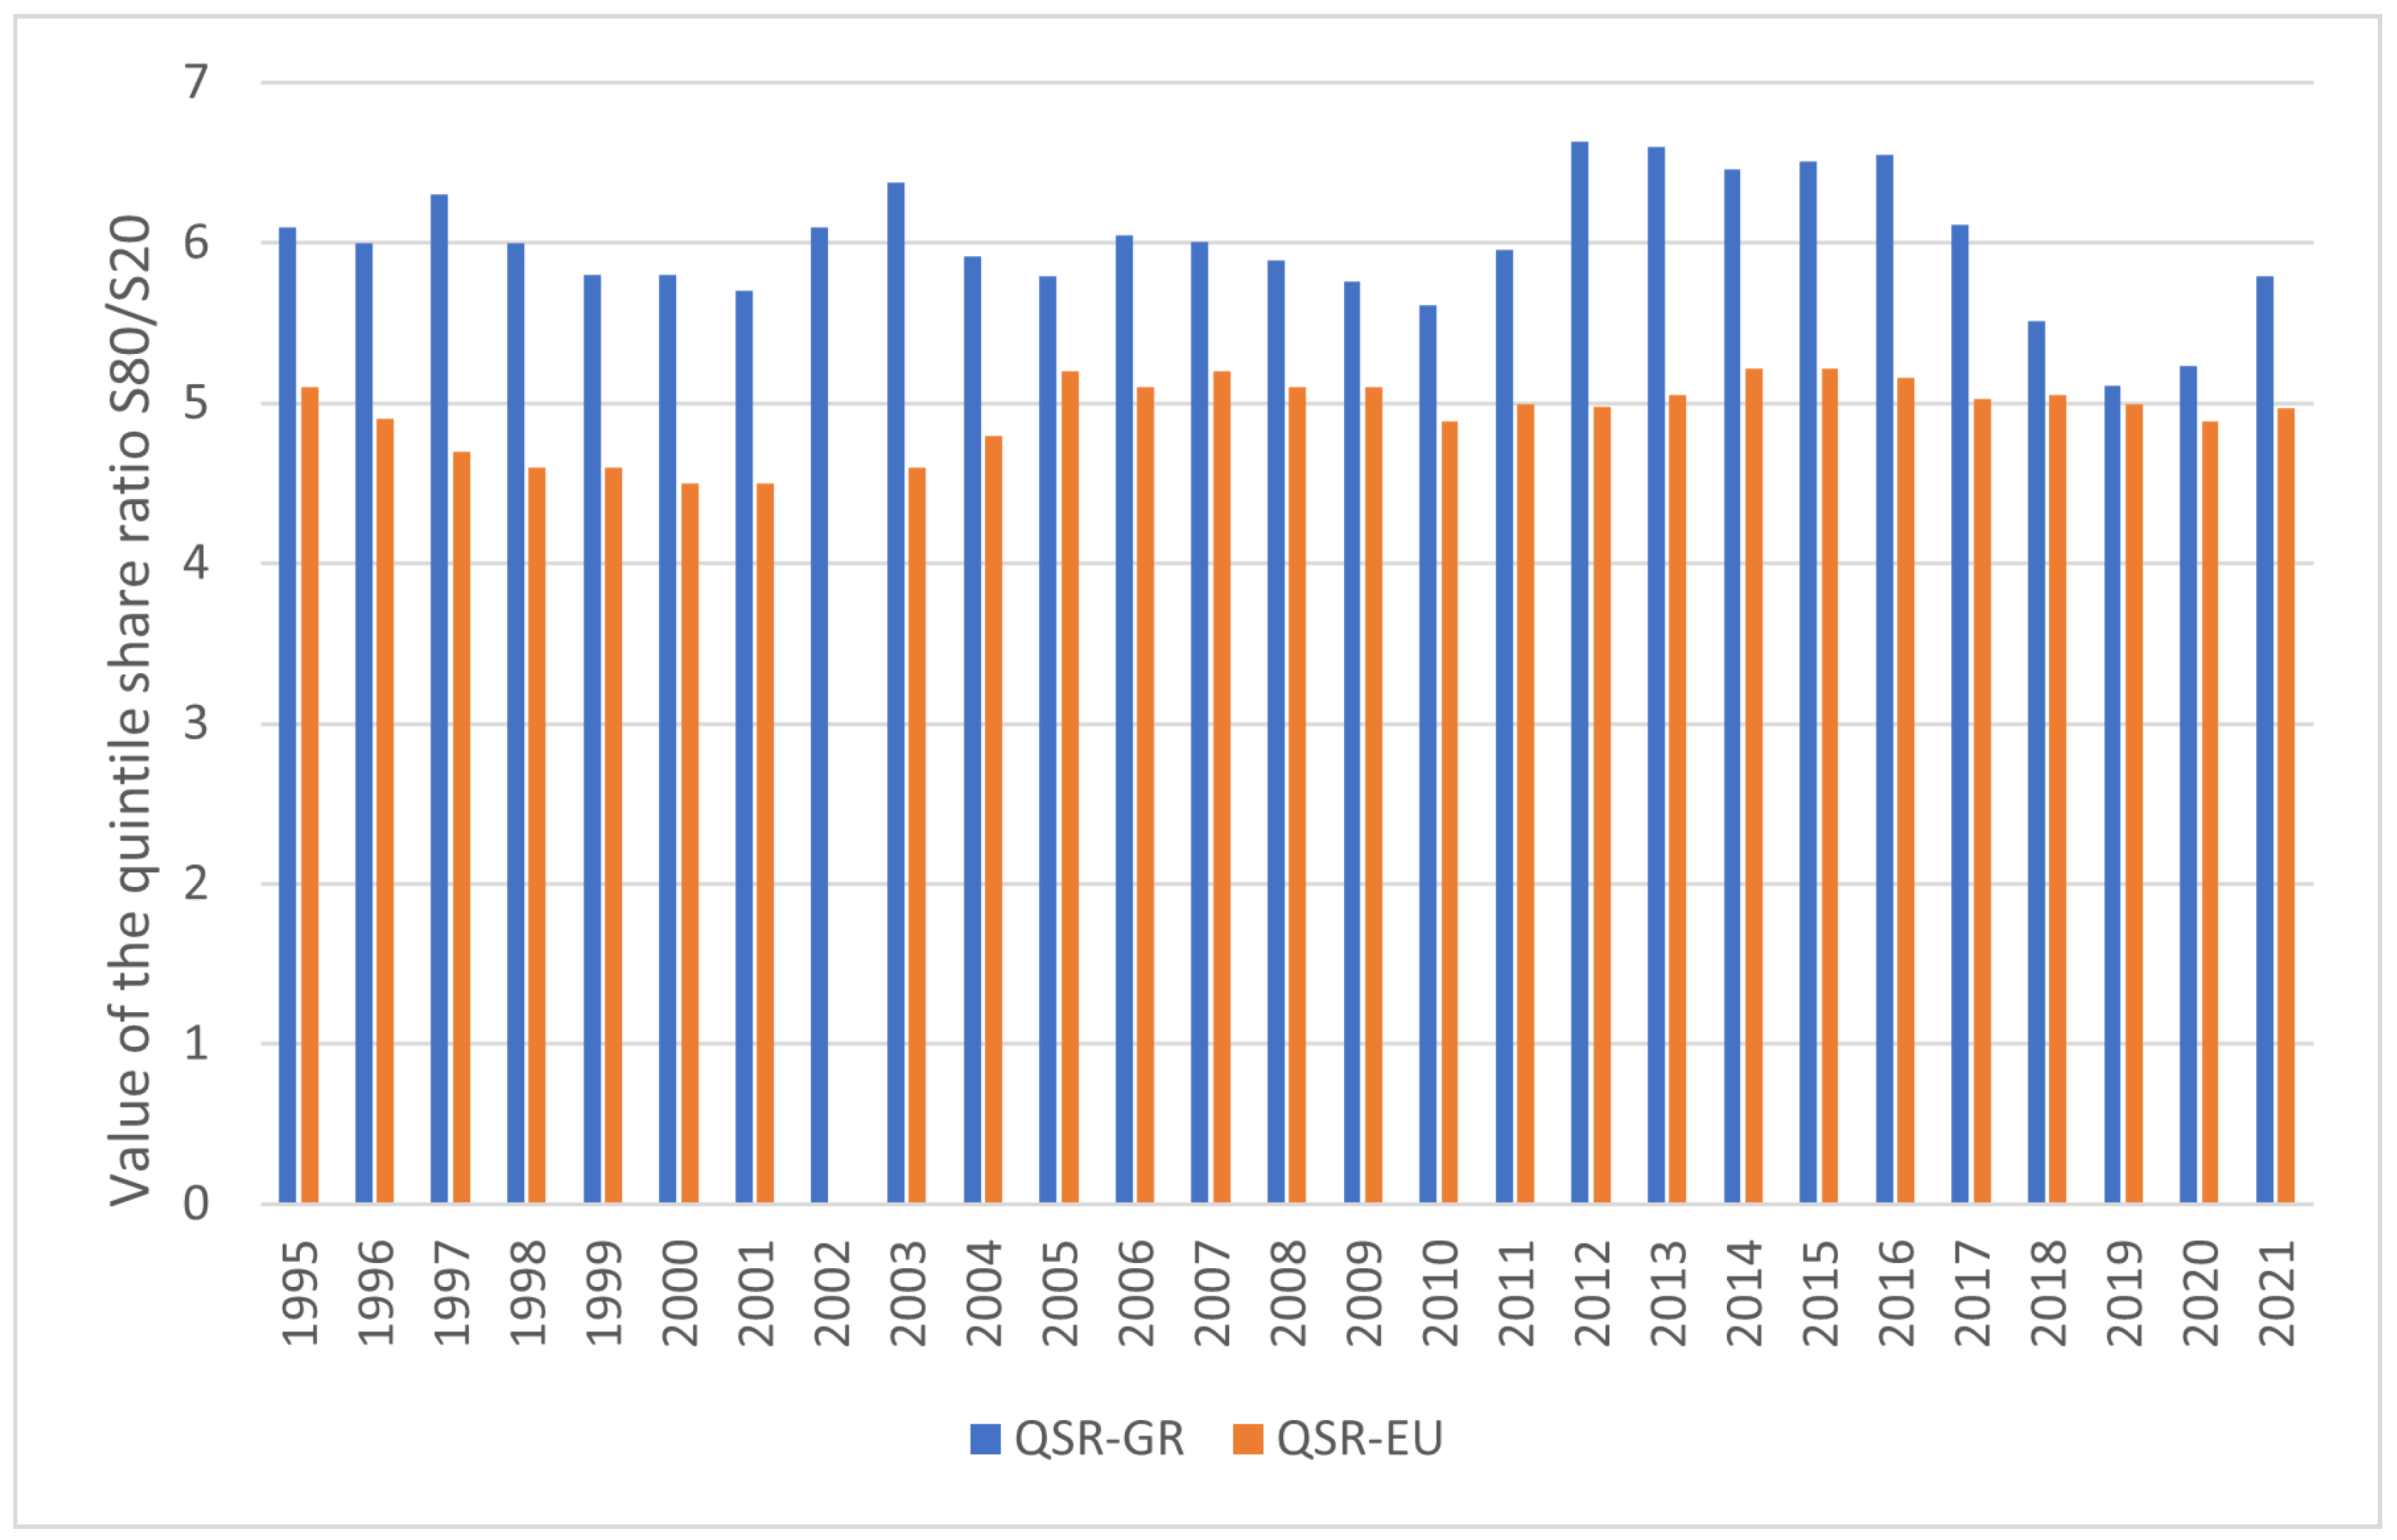
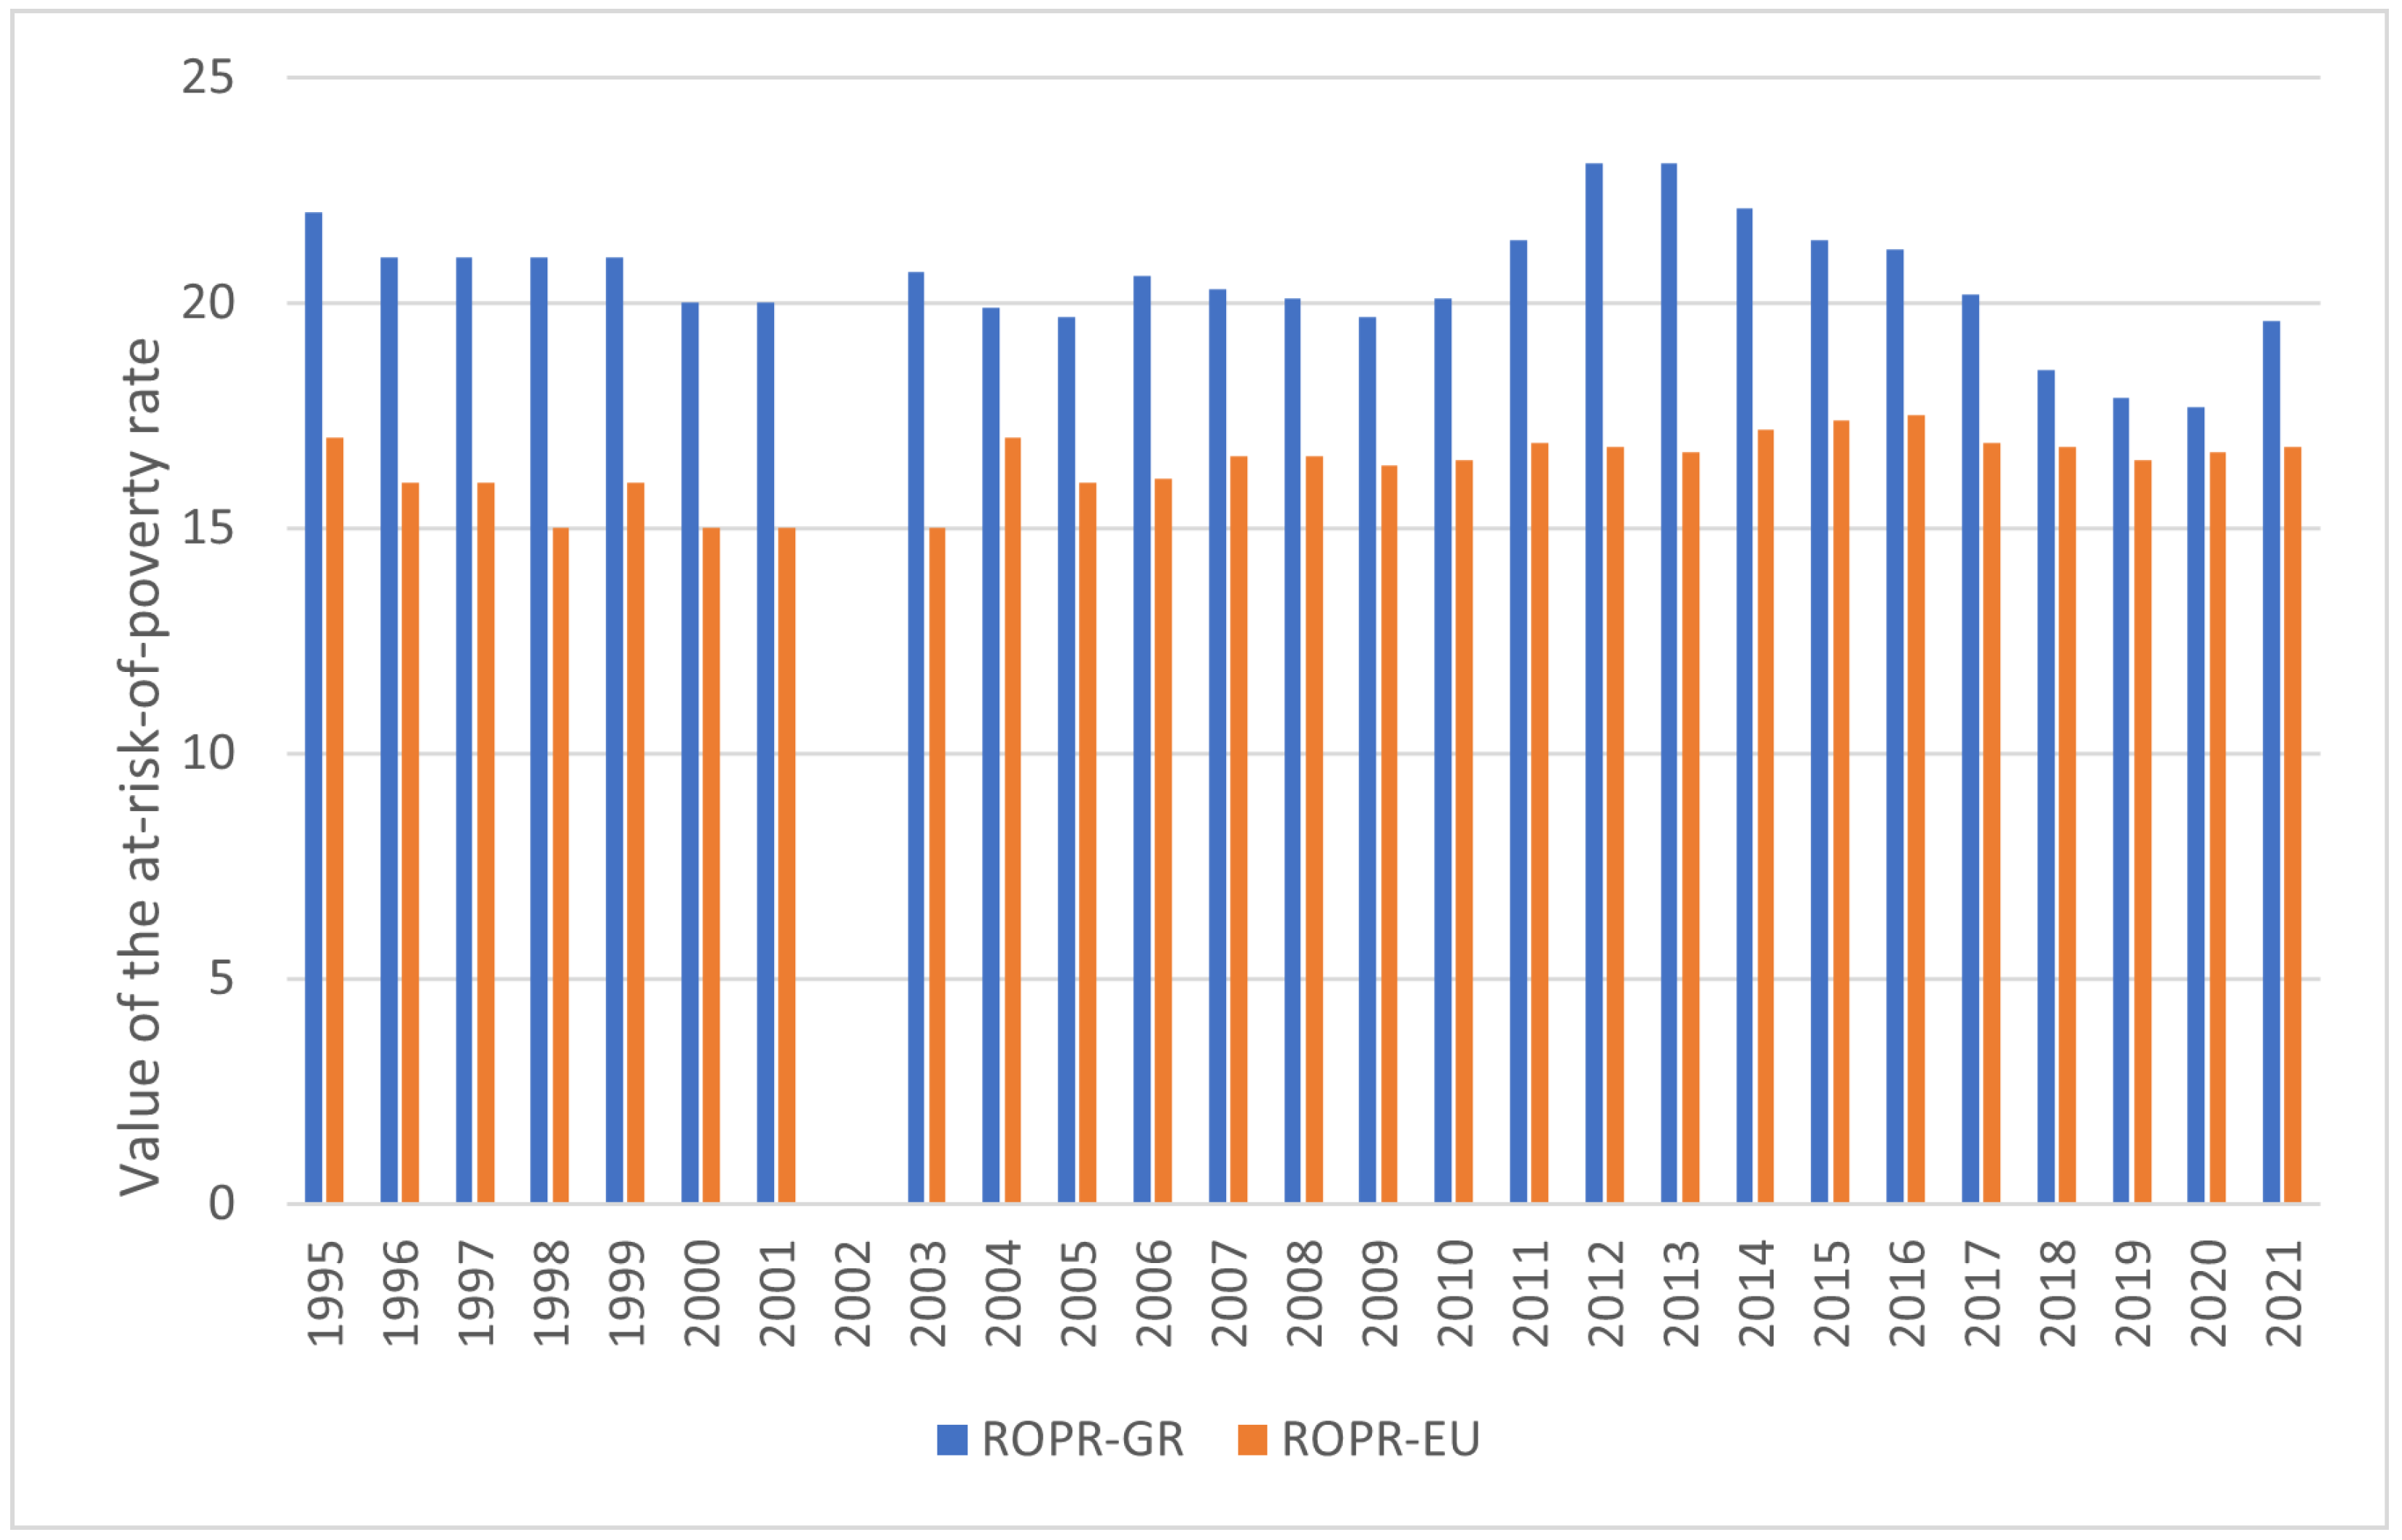
Figure 1, we check our second measure of income inequality, which is the income quintile share ratio index S80/S20, and our measure of relative poverty, that is, the at-risk-of-poverty rate. A pattern similar to the pattern in
Figure 1 is revealed: throughout the period under consideration, the values of the income quintile share ratio index S80/S20, presented in
Figure 2, and the at-risk-of-poverty rate, shown in
Figure 3, are systematically higher in Greece compared to the EU average. This implies that disparities between poor and rich incomes, as well as the percentages of the at-risk-of-poverty and social exclusion categories, have been consistently more severe in the Greek economy. More importantly, in the crises years under consideration (2011–2016 and 2020–2021), both indicators appear to deteriorate (see
Figure 2 and
Figure 3). We proceed to formally test whether this second pattern can be verified. This takes us to the formal statement of our research hypothesis:
Hypothesis 1. During the years of the two recent crises, income inequality and poverty have increased in Greece.
To test this, we also investigate the most important macroeconomic variables that affect the intertemporal distribution of income in the country.
Our approach is an empirical one and it is based on the formulation and estimation of linear econometric models related to its subjects, which combine quantitative and dichotomous or dummy variables as independent variables. We construct three empirical models, each with one of the following three dependent variables:
(1) The Gini coefficient of equivalized disposable income (GINI), as defined and measured by the Eurostat Statistics on Income and Living Conditions (SILC) and the Hellenic Statistical Authority (ELSTAT).
(2) The income quintile share ratio index S80/S20 (QSR), as defined and measured by the Eurostat Statistics on Income and Living Conditions (SILC) and the Hellenic Statistical Authority (ELSTAT).
(3) The at-risk-of-poverty rate (ROPR), as defined and measured by the Eurostat Statistics on Income and Living Condition (SILC) and the Hellenic Statistical Authority (ELSTAT).
Based on the overview of the relevant theory and the purposes of our empirical analysis, we specify the following explanatory variables in the above three linear models. First, we use as explanatory variables the one-year lagged dependent variables to account for the fact that income inequality and poverty can have an autocorrelated AR(1) component and, hence, may be determined by past levels
6.
(4) The one-year lagged Gini coefficient (GINI-1) since the value of the current Gini coefficient can be influenced by its value in the previous year.
(5) The S80/S20 index with one year lag (QSR-1) since the value of the current S80/S20 coefficient may be affected by its value in the previous year.
(6) The at-risk-of-poverty rate with one year lag (ROPR-1) since the value of the current ROPR also has the potential to be shaped by its past value.
The second group of explanatory variables is related to the share of labour income, or rather dependent labour income, in total income. We include:
(7) The share of wages and salaries in GDP (WGDP), as measured by ELSTAT and the Eurostat methodology. This variable is particularly interesting in the case of Greece because the country is characterised by the lowest share of wages and salaries in the total GDP compared to all EU member states, during the period 1995–2021 for which data are available. Only three EU member states, and only for a short, specific time period, presented a lower share of wages and salaries in the GDP. Namely, Bulgaria during the period 1995–1997, Romania during the period 2009–2012, and Ireland during the period 2015–2021
7.
Our third group of explanatory variables is chosen so as to better capture the macroeconomic impact of an economic crisis. After the global financial crisis of 2007–2009, which developed into what is widely known as the great recession of 2007–2009, Greece entered a prolonged period of economic and fiscal crisis. Exit from this crisis became possible only in 2017. During that period, extensive literature (see, for example,
Petrakos et al. 2022) has documented the following. Between 2008 and 2013 the unemployment rate jumped from 7.8% to an unprecedented 27.5% and, from there, it started to decrease gradually. Furthermore, during the years between 2008 and 2016, the country’s total real GDP shrunk from €247.8 billion to €182 billion, a decrease corresponding to more than a quarter of its real value (26.6%). The most critical years of the 2008–2016 period were the years 2011–2016, which were characterised by unemployment rates higher than 20% and were, at the same time, associated with negative economic growth rates. Hence, we include in our models:
(8) The total real GDP in chainlinked volumes (2010) in millions of euros (RGDP) as measured by ELSTAT and the Eurostat methodology.
(9) The overall (total) annual unemployment rate (UNR) as measured by ELSTAT and the Eurostat methodology.
To address our research hypothesis on the impact of economic crises we are forced to include:
(10) A dummy variable for economic crises (GESCOV), which takes the value 1 during the years of crises in Greece (2011–2016 and 2020–2021) and 0 otherwise.
Finally, our last explanatory variable represents the impact of political factors. In particular, it captures the opportunistic behavior of governments during pre-election periods in order to win the upcoming general elections. This is the well-known phenomenon of “political electoral cycles” or “political budget cycles”. The central hypothesis of this phenomenon is that incumbent politicians, faced with a “myopic” electorate with a decaying memory of past events (
Bonfiglioli and Gancia 2013) or taking advantage of informational asymmetries that exist between them and rational constituents (
Rogoff and Sibert 1988), choose to maximize their voting function instead of their social welfare function (
Nordhaus 1975). Consequently, governments may pursue opportunistic expansionary fiscal policies before elections to appear competent and offer voters an illusion of economic prosperity (
Petrakos et al. 2021b). This behavior may affect the distribution of income in the short run due to the economic benefits provided to the electorate to soften their impressions about the current governance of the country. The limited empirical research that exists on this issue concludes that income inequality actually improves during pre-election periods (
Sever and Yucel 2021). To allow for the well-documented presence of political budget cycles (e.g.,
Petrakos et al. 2021b) in the Greek economy, we include:
(11) A dummy variable for elections (ELE), which takes the value 1 during the years of parliamentary elections in Greece during the period 1995–2021 and 0 otherwise.
Having specified our dependent and explanatory variables, we proceed to the specification of our empirical models. Let denote, for m = 1, 2, 3, respectively, the annual values of indices GINI, QSR, and ROPR, considered as dependent variables in the ith year, i = 1, 2, …, 27. Let , j = 1, 2, …, 6, denote the values of Xj corresponding to the 6 quantitative explanatory variables GINI-1, QSR-1, ROPR-1, WGDP, RGDP, and UNR, respectively. Let, in addition, , k = 1, 2 denote, respectively, the values of the two dummy variables GESCOV and ELE.
We assume that the mean value of the dependent variable of each sample can be expressed as a linear combination of the quantitative variables and the dummy variables in the following way:
We derive the following three models, which were tested against the usual assumptions of the OLS models:
Model 1 (m = 1): dependent variable GINI.
Model 2 (m = 2): dependent variable QSR.
Model 3 (m = 3): dependent variable ROPR.
In order to access and compare the predictive accuracy of the three models, we use the Mean Absolute Percentage Error (
MAPE) for
m = 1, 2, 3:
3. Results
This section contains the results of our analysis. We present our results for Model 1, with GINI as the dependent variable, Model 2, with QSR as the dependent variable, and Model 3, with ROPR as the dependent variable.
3.1. Model 1 (m = 1): Dependent Variable GINI
In Model 1, the statistically significant independent variables are GINI-1, WGDP, RGDP, and the dummies GESCOV and ELE. The coefficient estimates and the significance tests are presented in
Table 1 and the analysis of variance in
Table A1 of
Appendix A. Model 1 shows a coefficient of determination R
2 = 71.12 (R
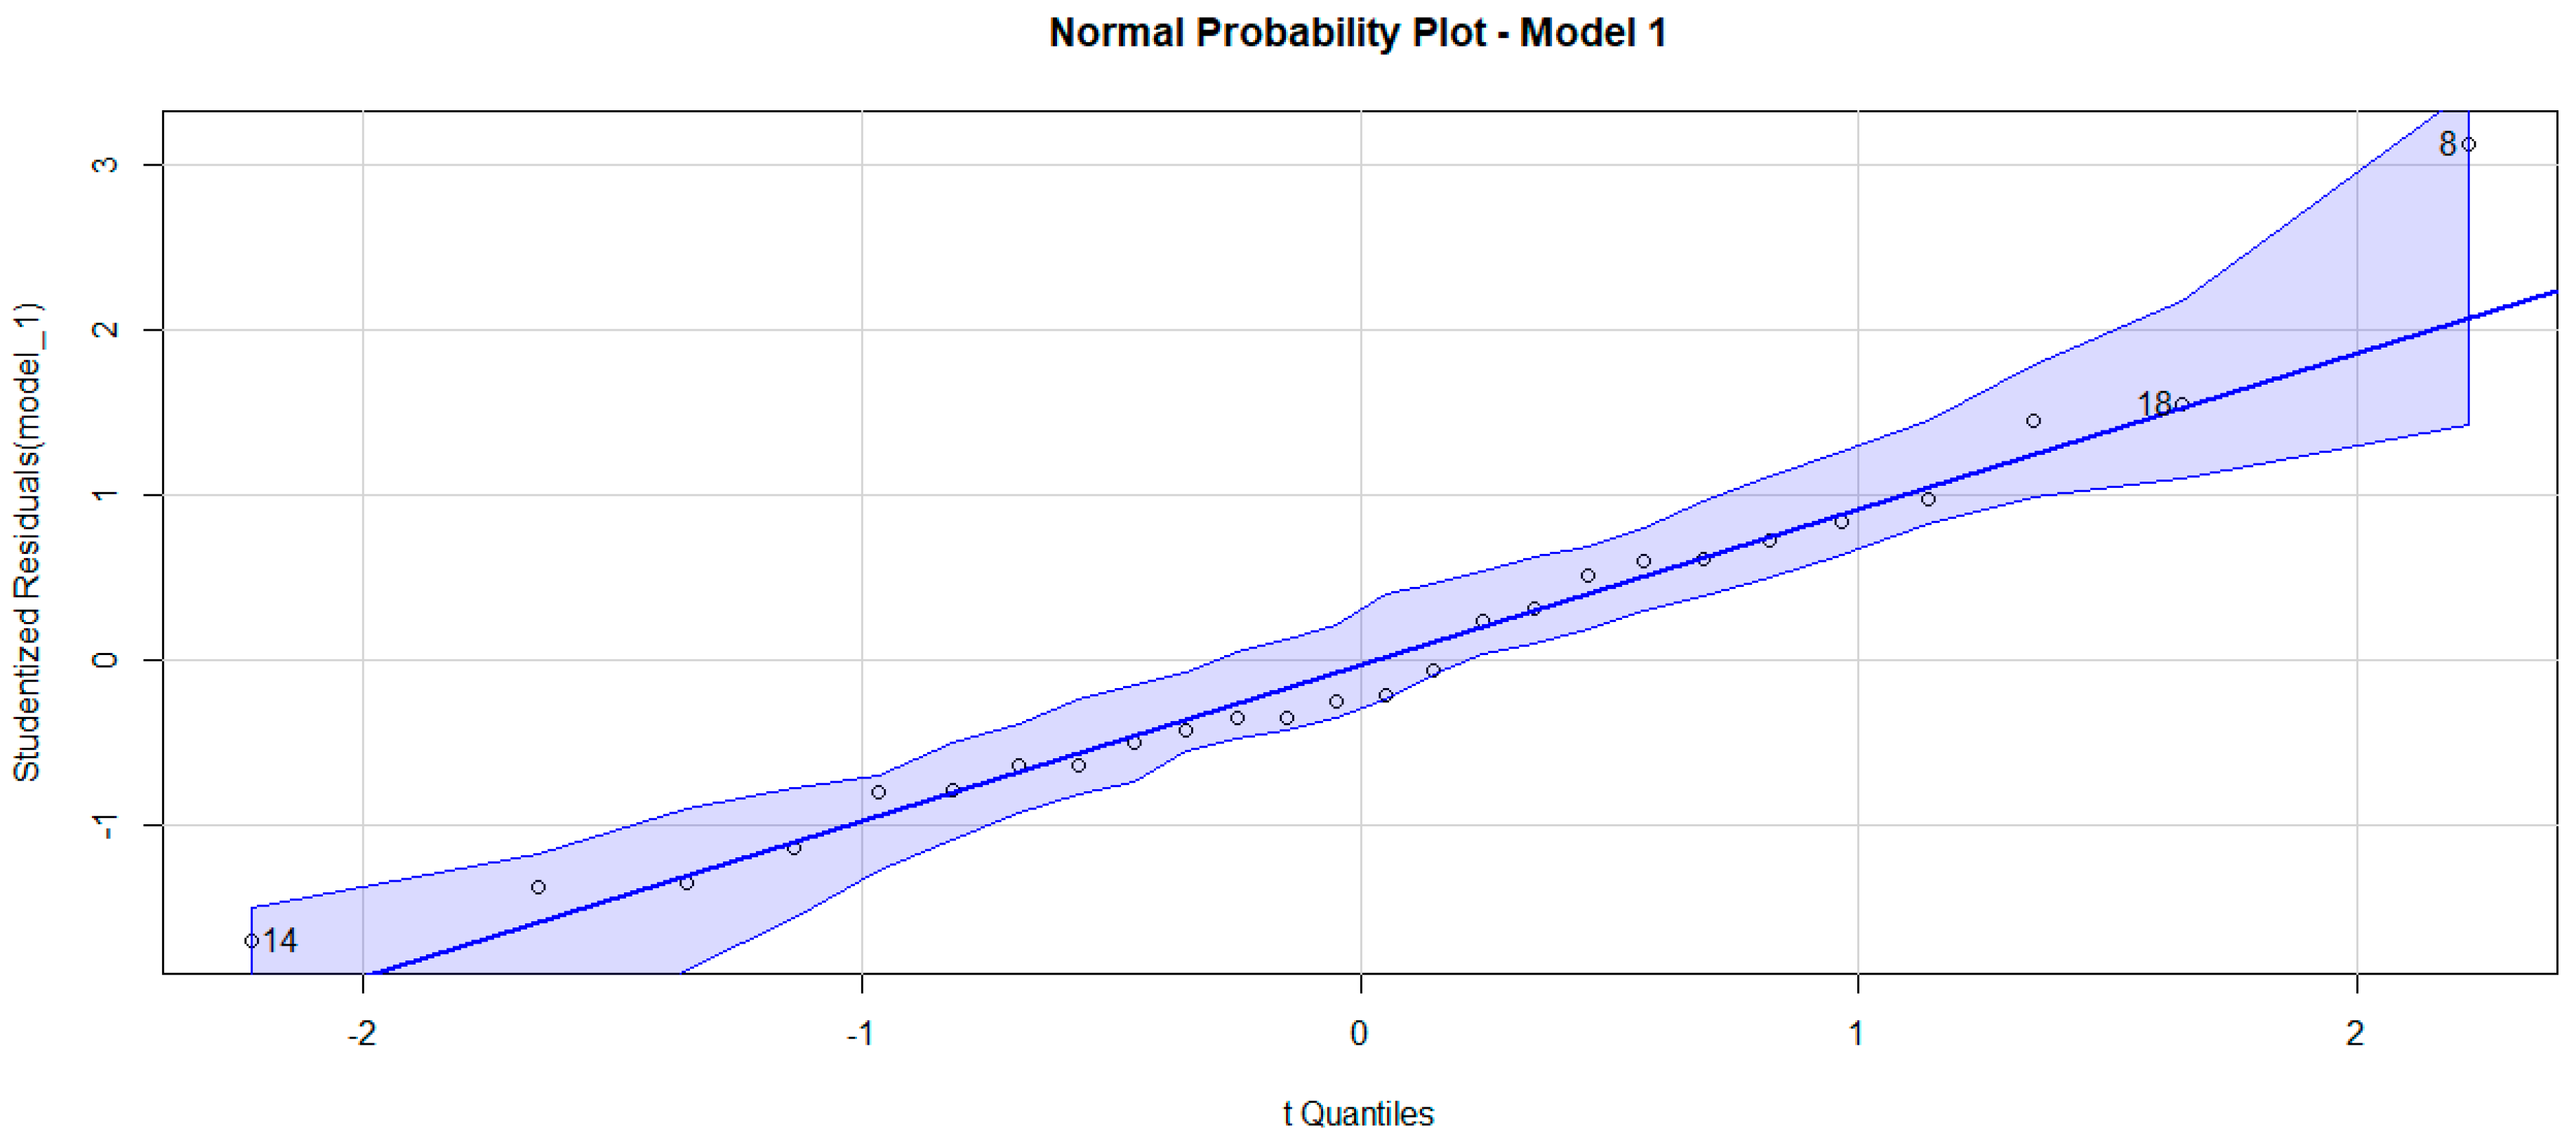
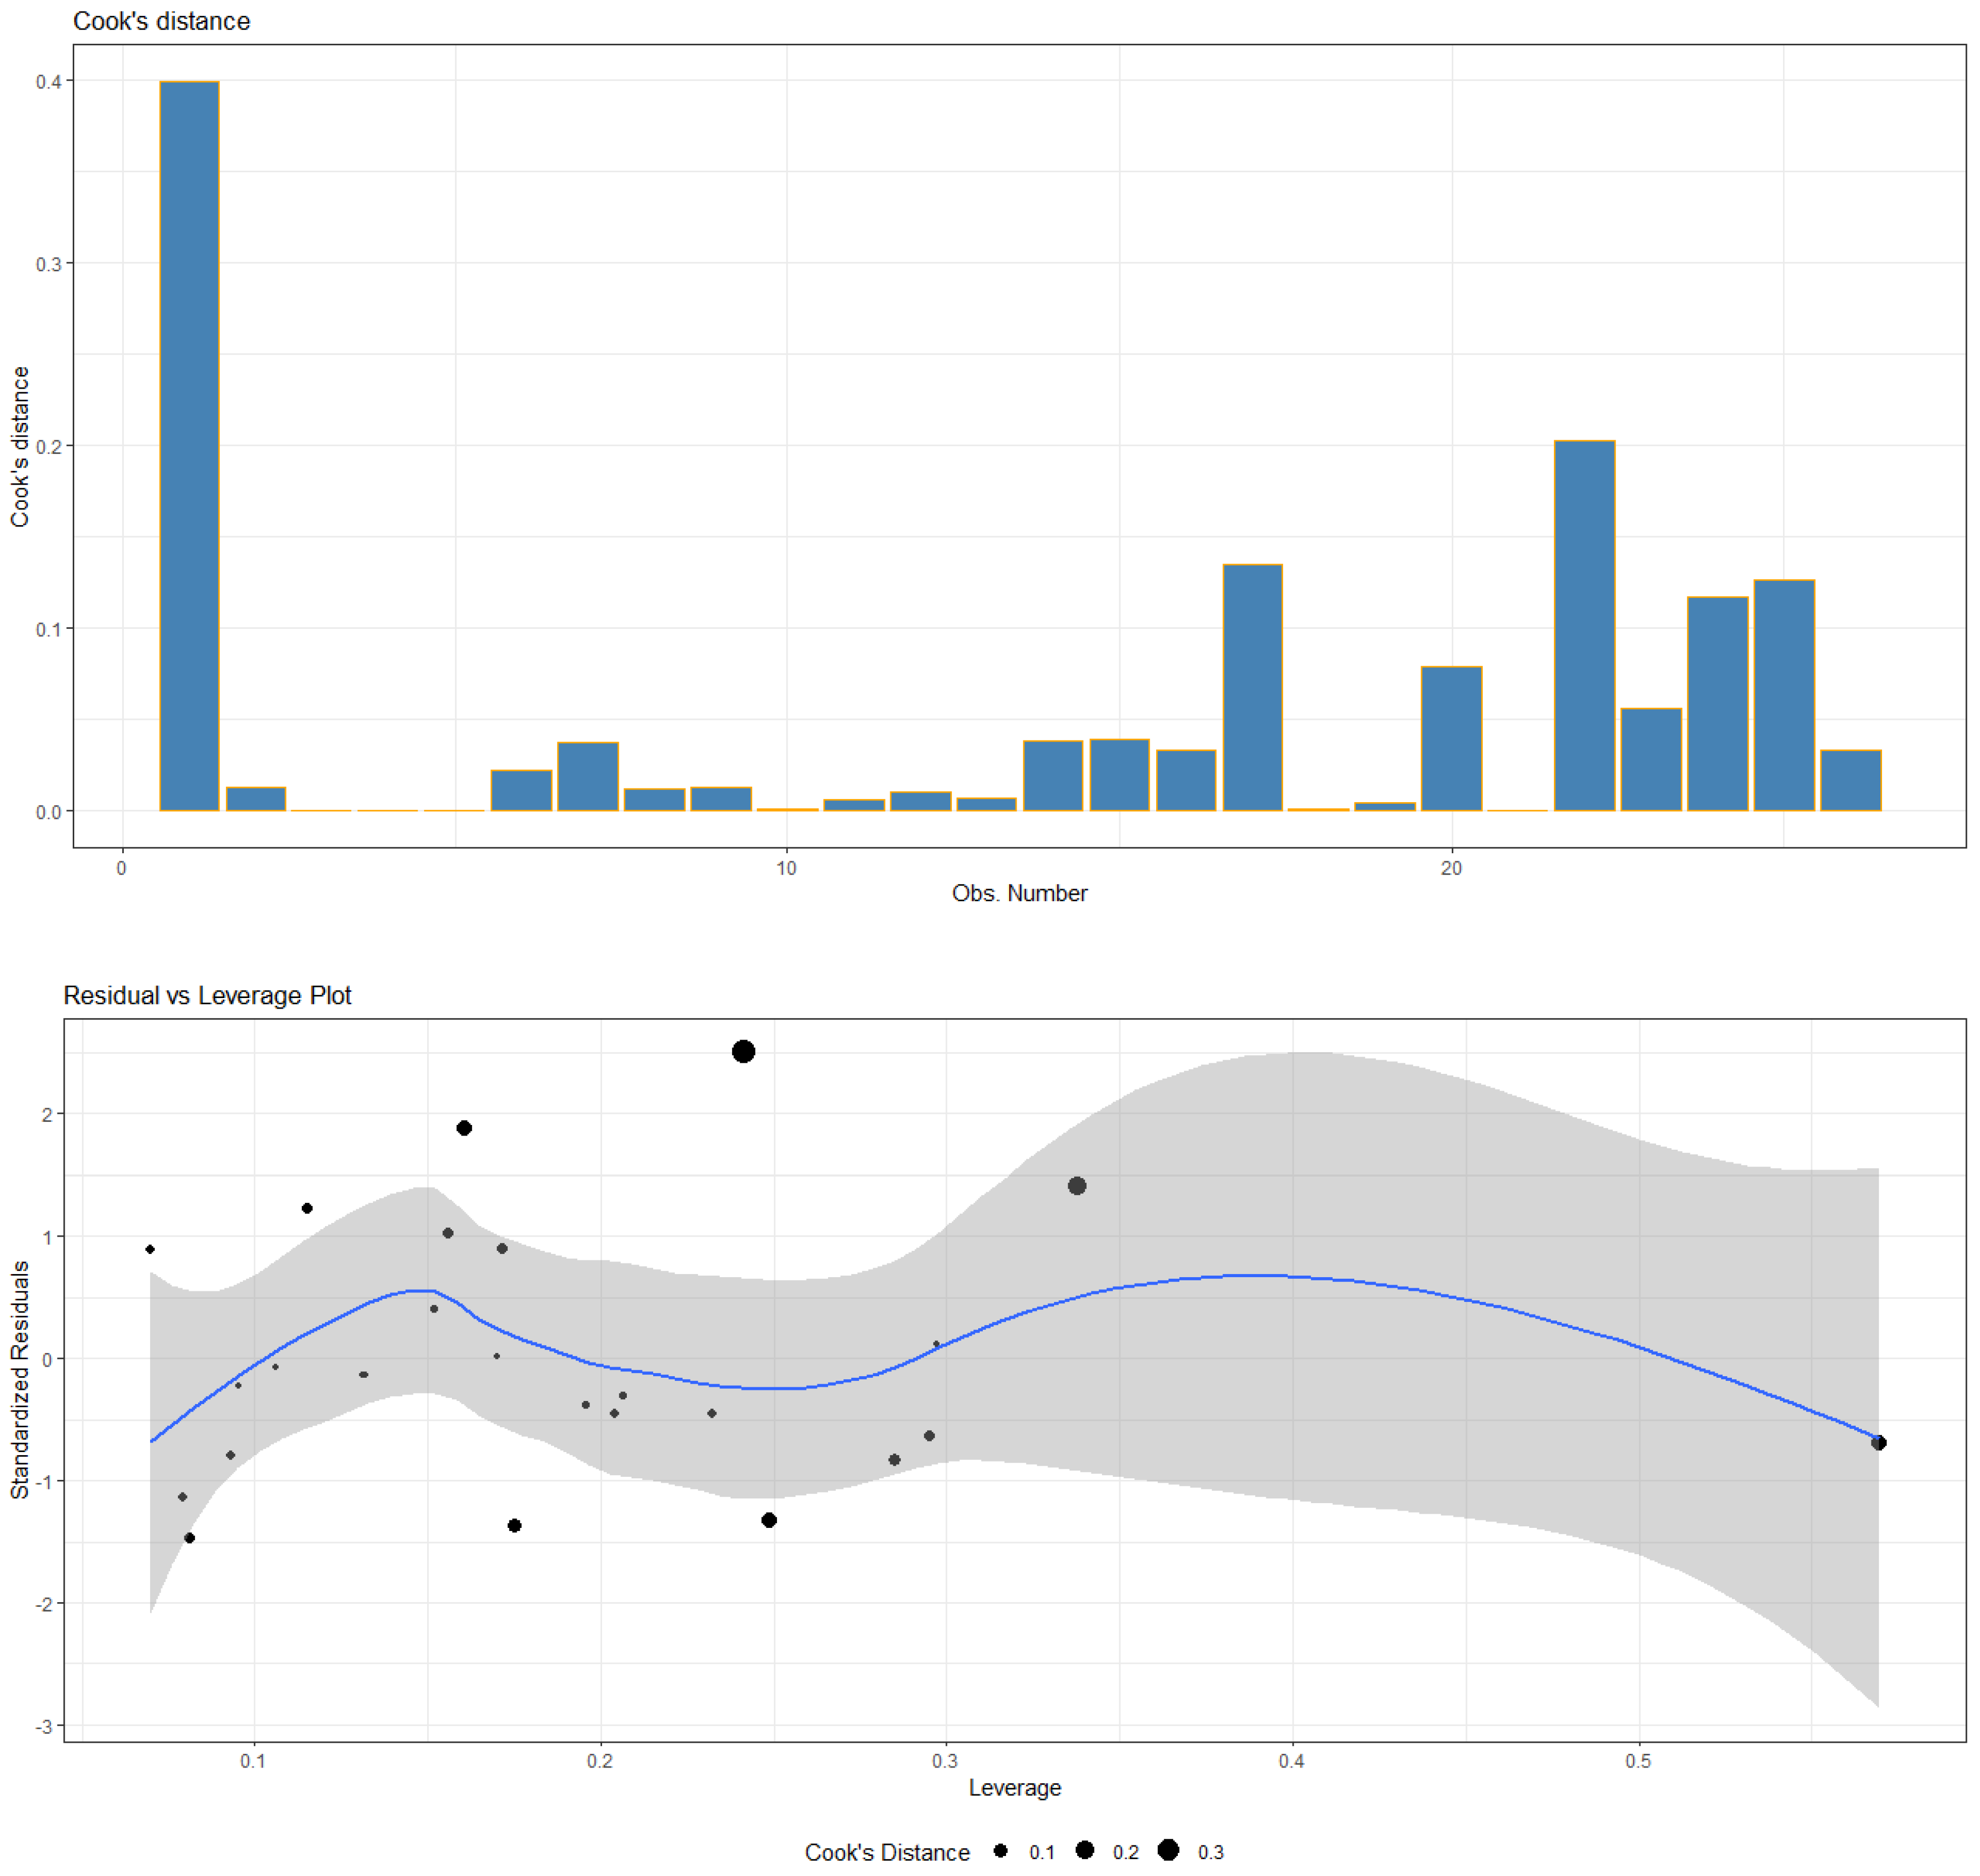
2adj = 63.9). The Model 1 residuals are symmetrically distributed around zero with a standard deviation of 0.6281 and the largest one, corresponding to the eighth observation, is valued at 1.548. Nevertheless, there are not studentized residuals with Bonferroni
p < 0.05 to be considered as outliers.
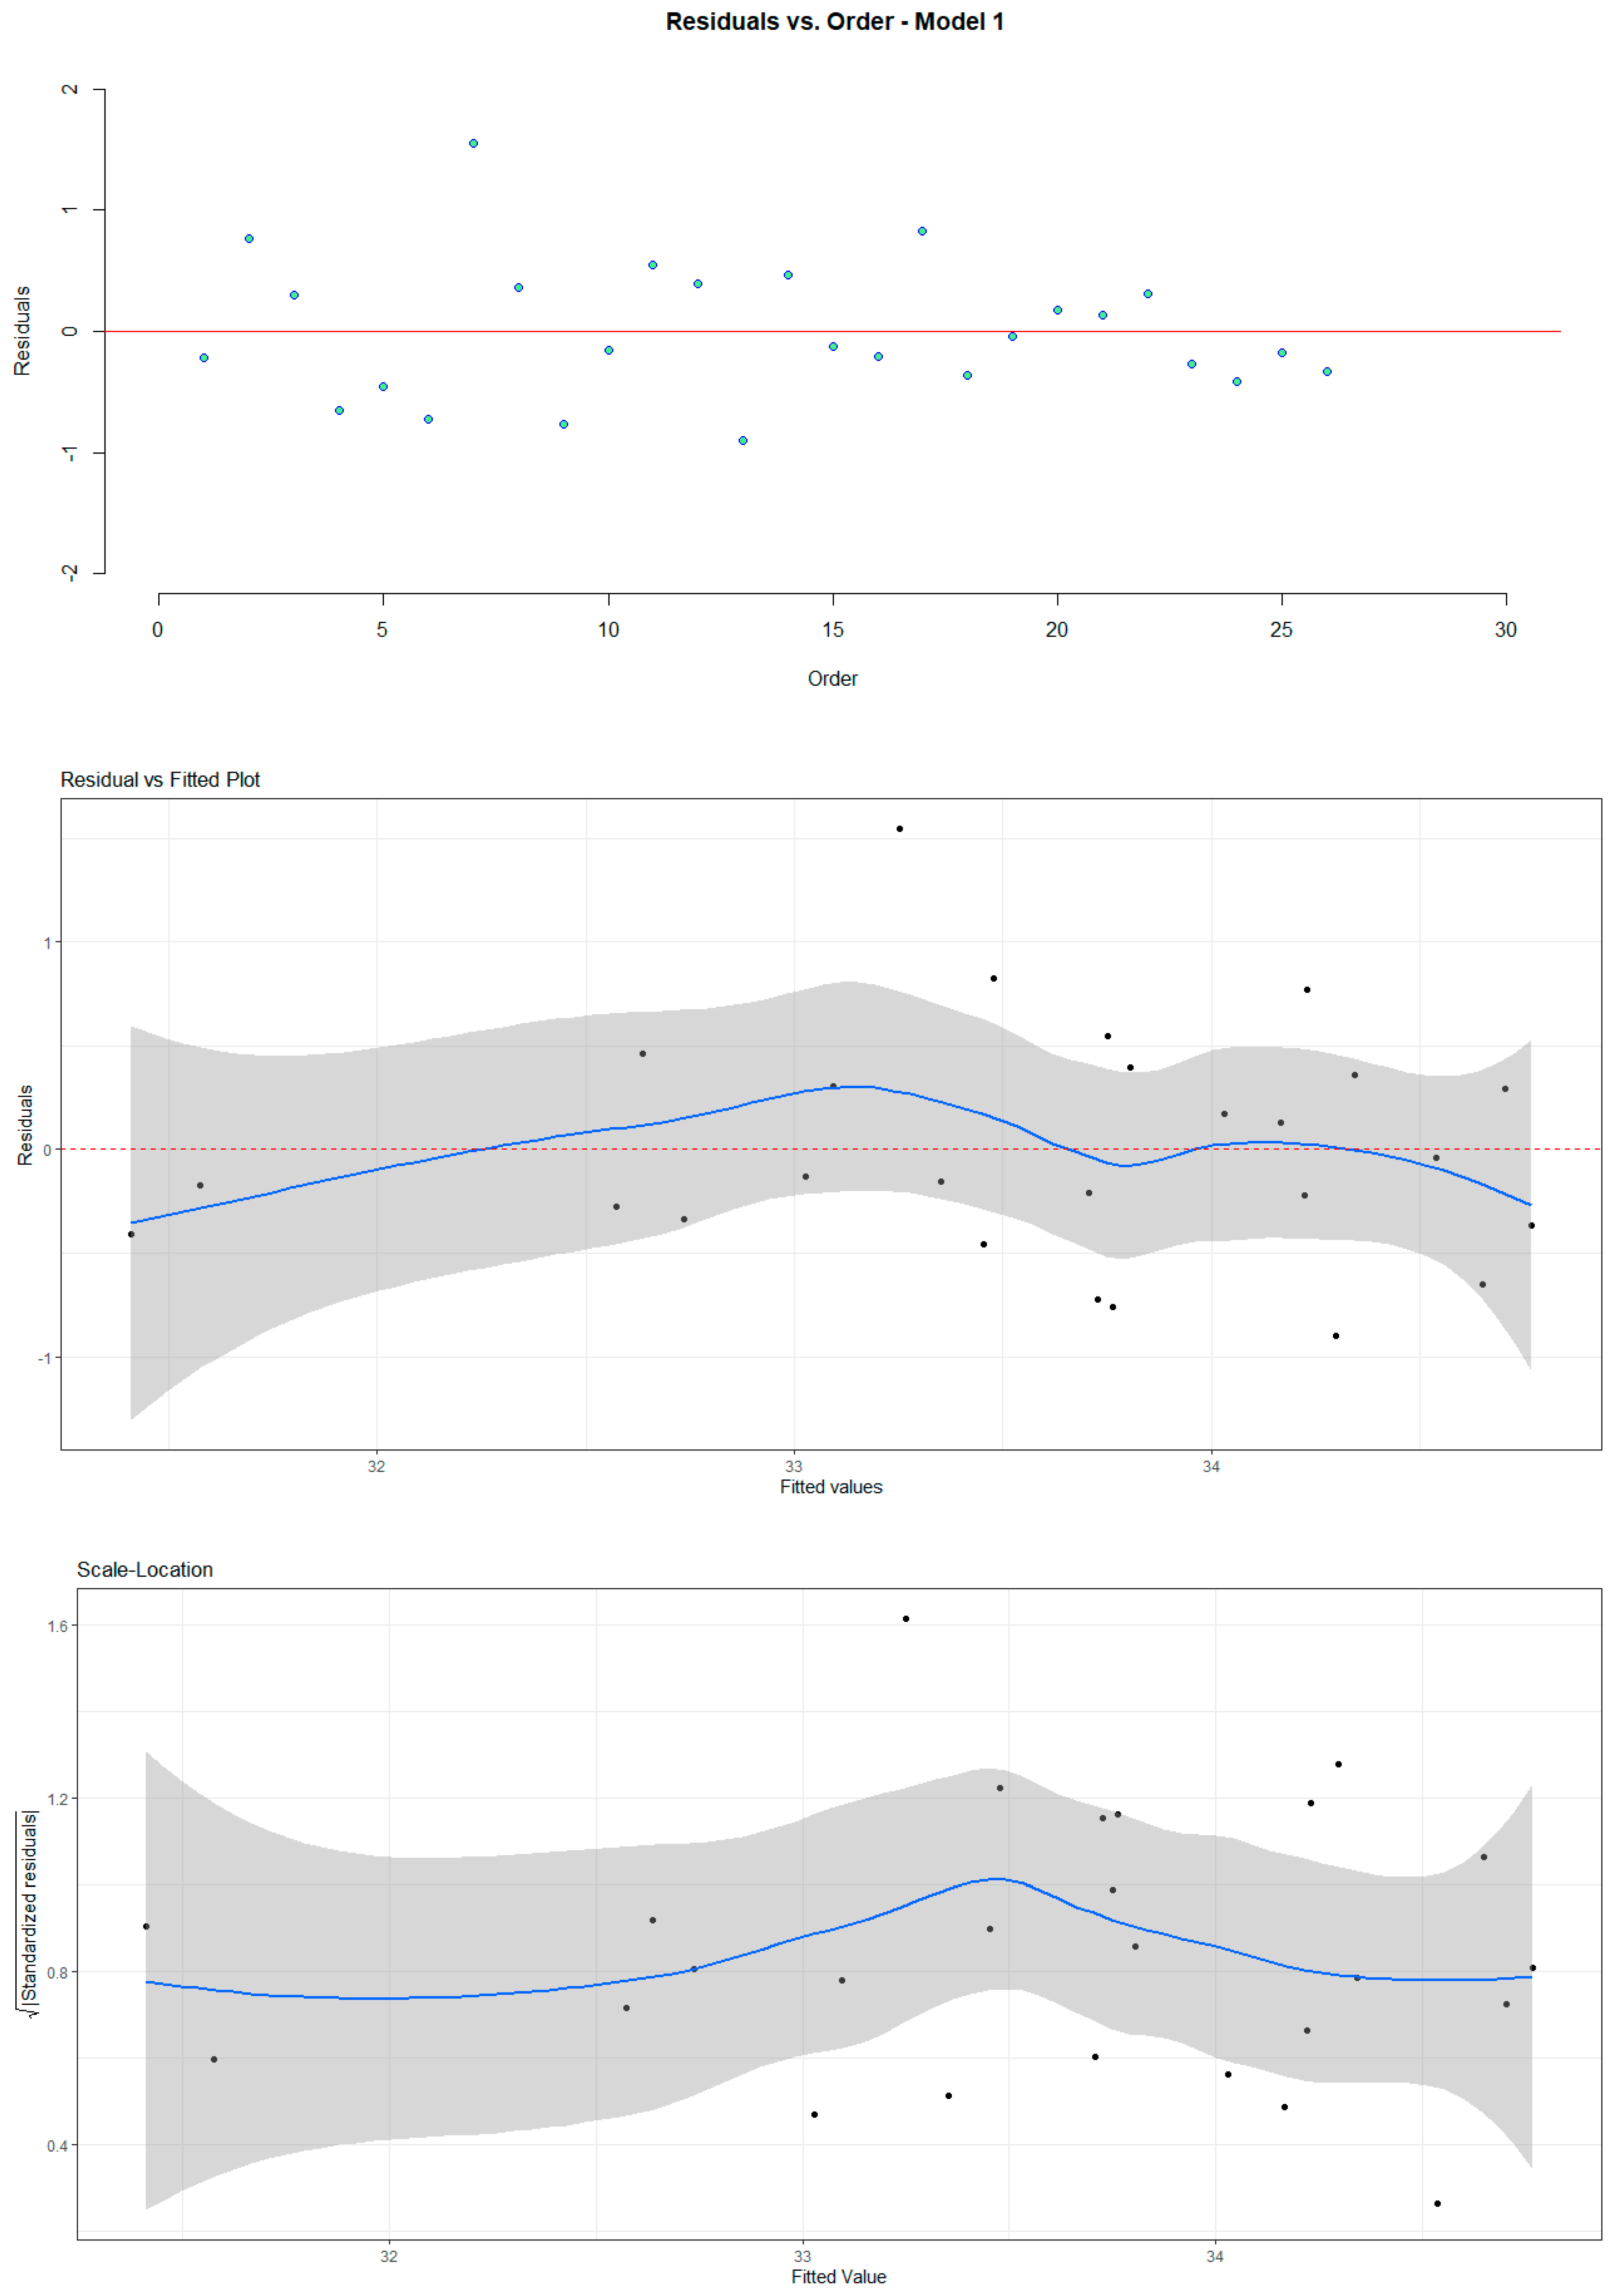
From the Durbin–Watson test, the D-W Statistic is 2.27 with
p-value at 0.966, larger than any significance level, concluding no autocorrelation at lag 1 in the model. Applying the studentized Breusch–Pagan test, we end up with BP statistics at 3.6664 on 5 df with
p-value = 0.5984 and, hence, we cannot reject homoscedasticity of the model residuals. Finally, the Shapiro–Wilk test for normality with W statistic at 0.96019 and
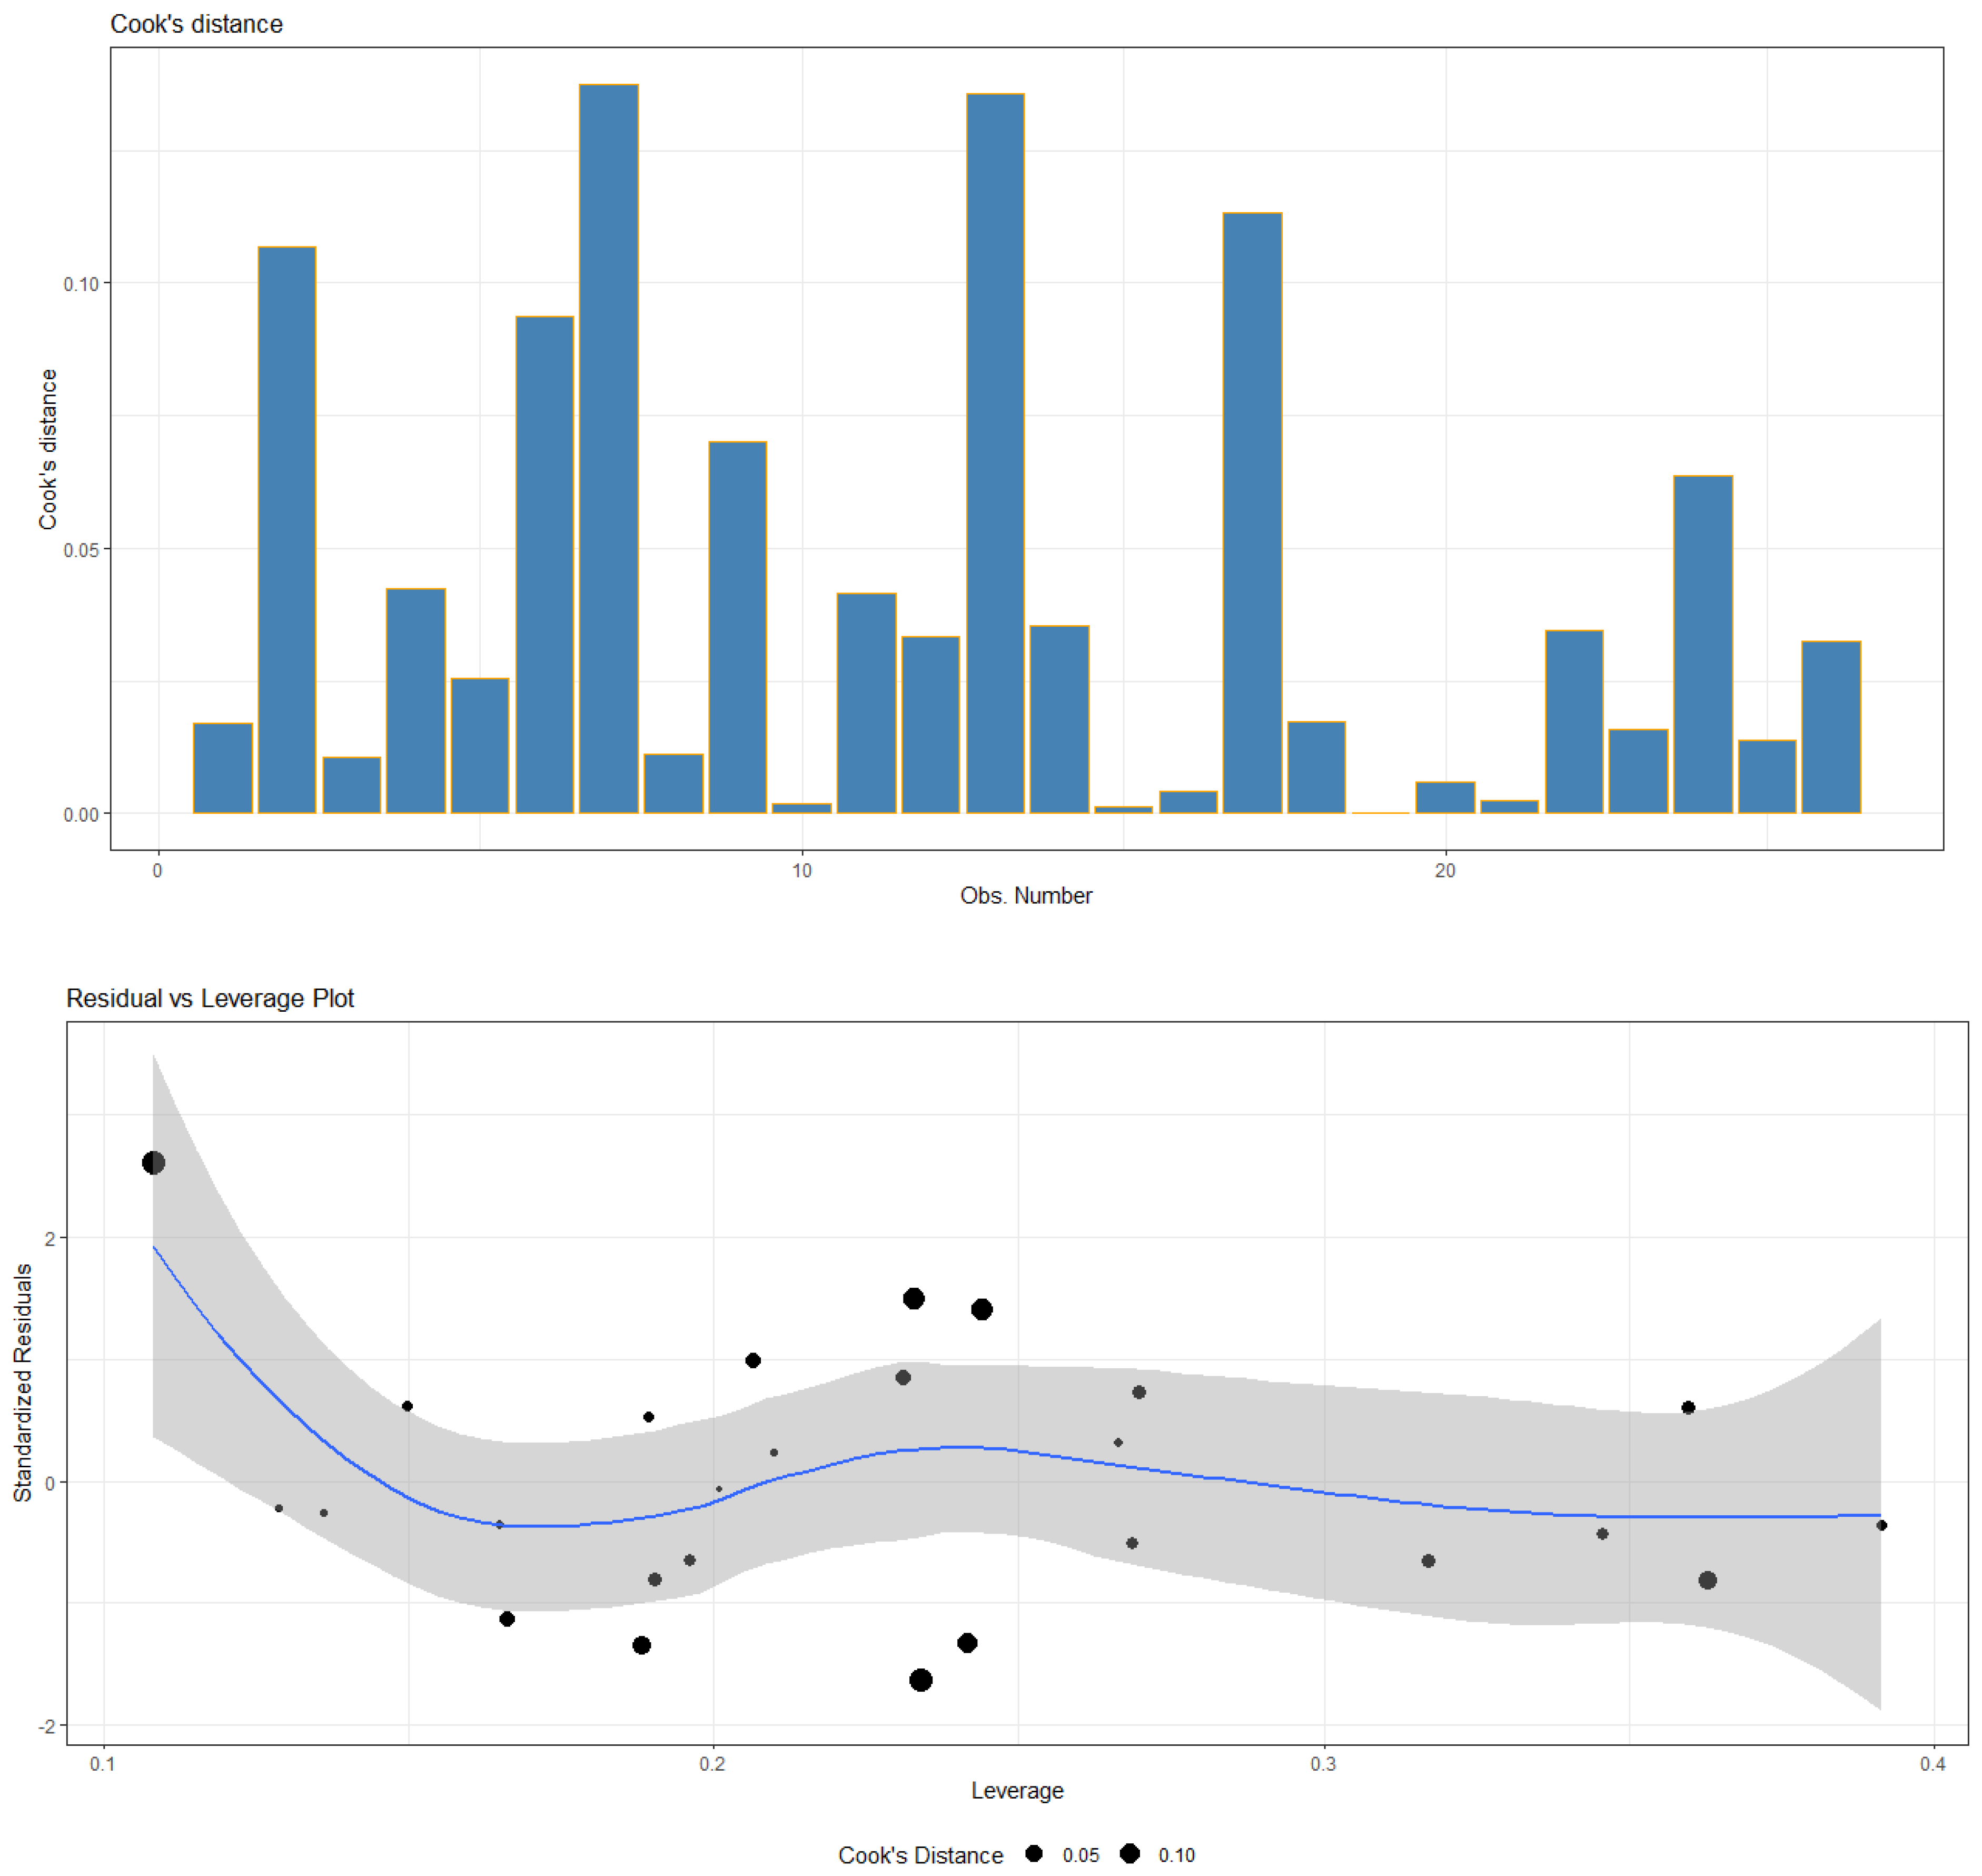
p-value = 0.3953 fails to reject the normality of the residuals. The above-mentioned test of the assumptions and relative conclusions is also illustrated in the diagnostics plots in
Figure A1 of
Appendix B. Searching for multicollinearity, the values of the VIF in
Table 1, being less than three, indicate that there is no multicollinearity effect among the predictors.
In Model 1, the coefficient corresponding to WGDP has a negative sign, which indicates that increases in WGDP, i.e., increases in the share of wages and salaries in GDP, are associated with decreases in the value of the GINI, implying a decrease in income inequality. In contrast, the GESCOV dummy variable comes in with a positive sign, which suggests that crises years are associated with increases in income inequality. At the same time, the dummy variable ELE has a negative coefficient, which suggests that during parliamentary election years, income inequality is reduced in the short term. This result is related to the phenomenon of political budget cycles. Furthermore, since RGDP enters with a positive sign, Model 1 confirms the hypothesis that income inequality is positively related to economic growth in the cases of developed countries. Finally, in the context of the present model, the unemployment rate (UNR) is not a statistically significant explanatory variable.
3.2. Model 2 (m = 2): Dependent Variable QSR
In Model 2, the statistically significant independent variables are QSR-1, WGDP, RGDP, and the dummy variable GESCOV. The coefficient estimates and significance tests of the model are presented in
Table 2 and the analysis of variance in
Table A2 of
Appendix A. Model 2 shows a coefficient of determination R
2 = 75.79 (R
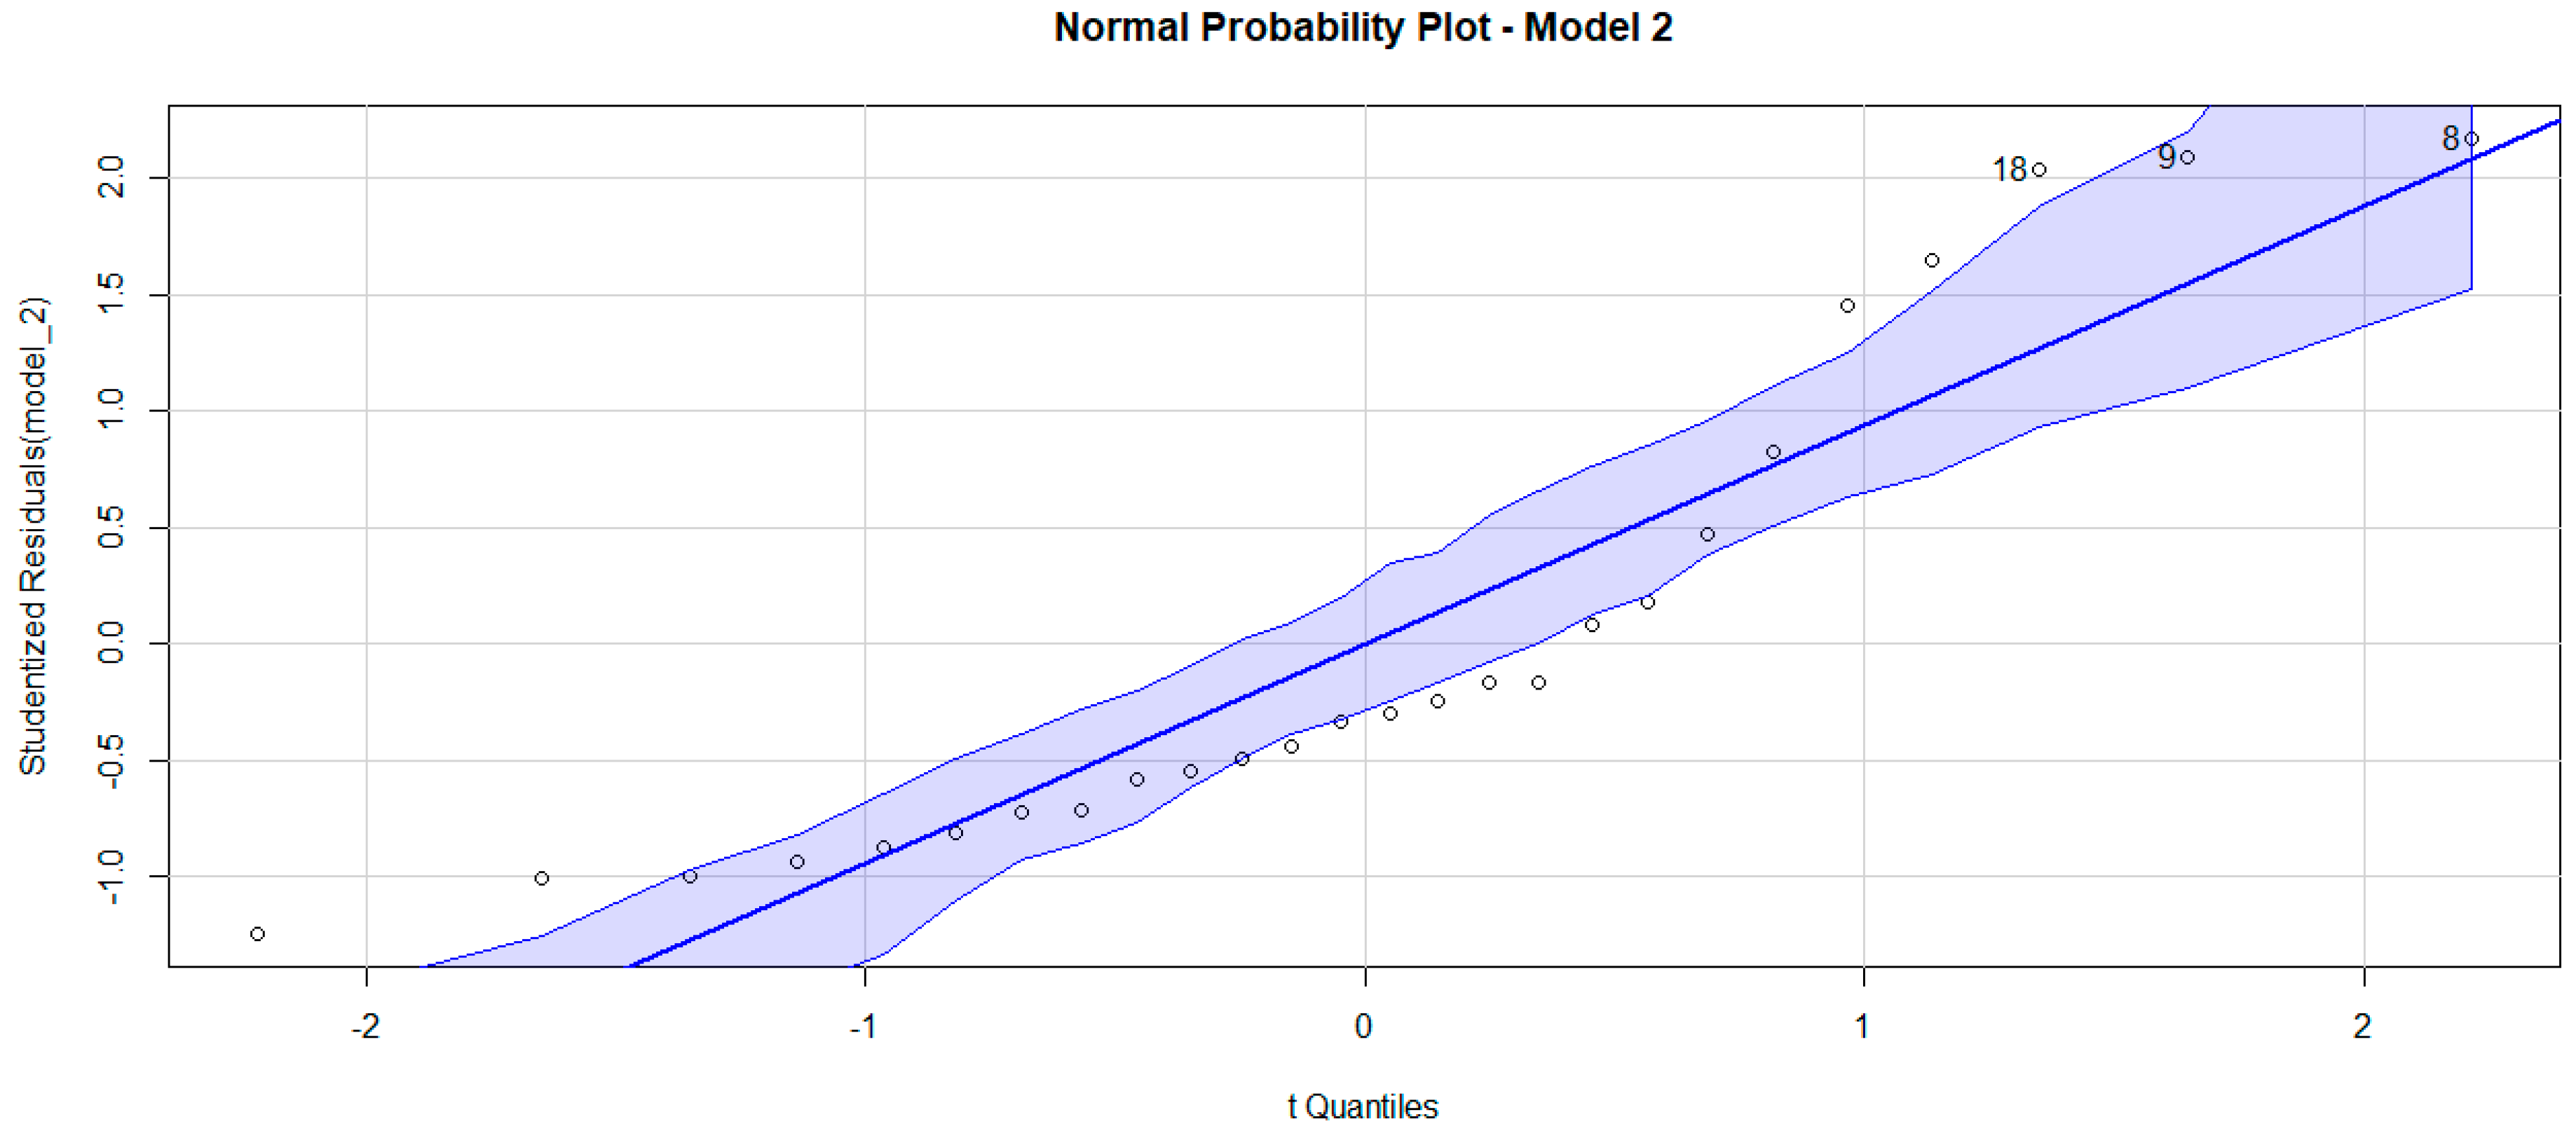
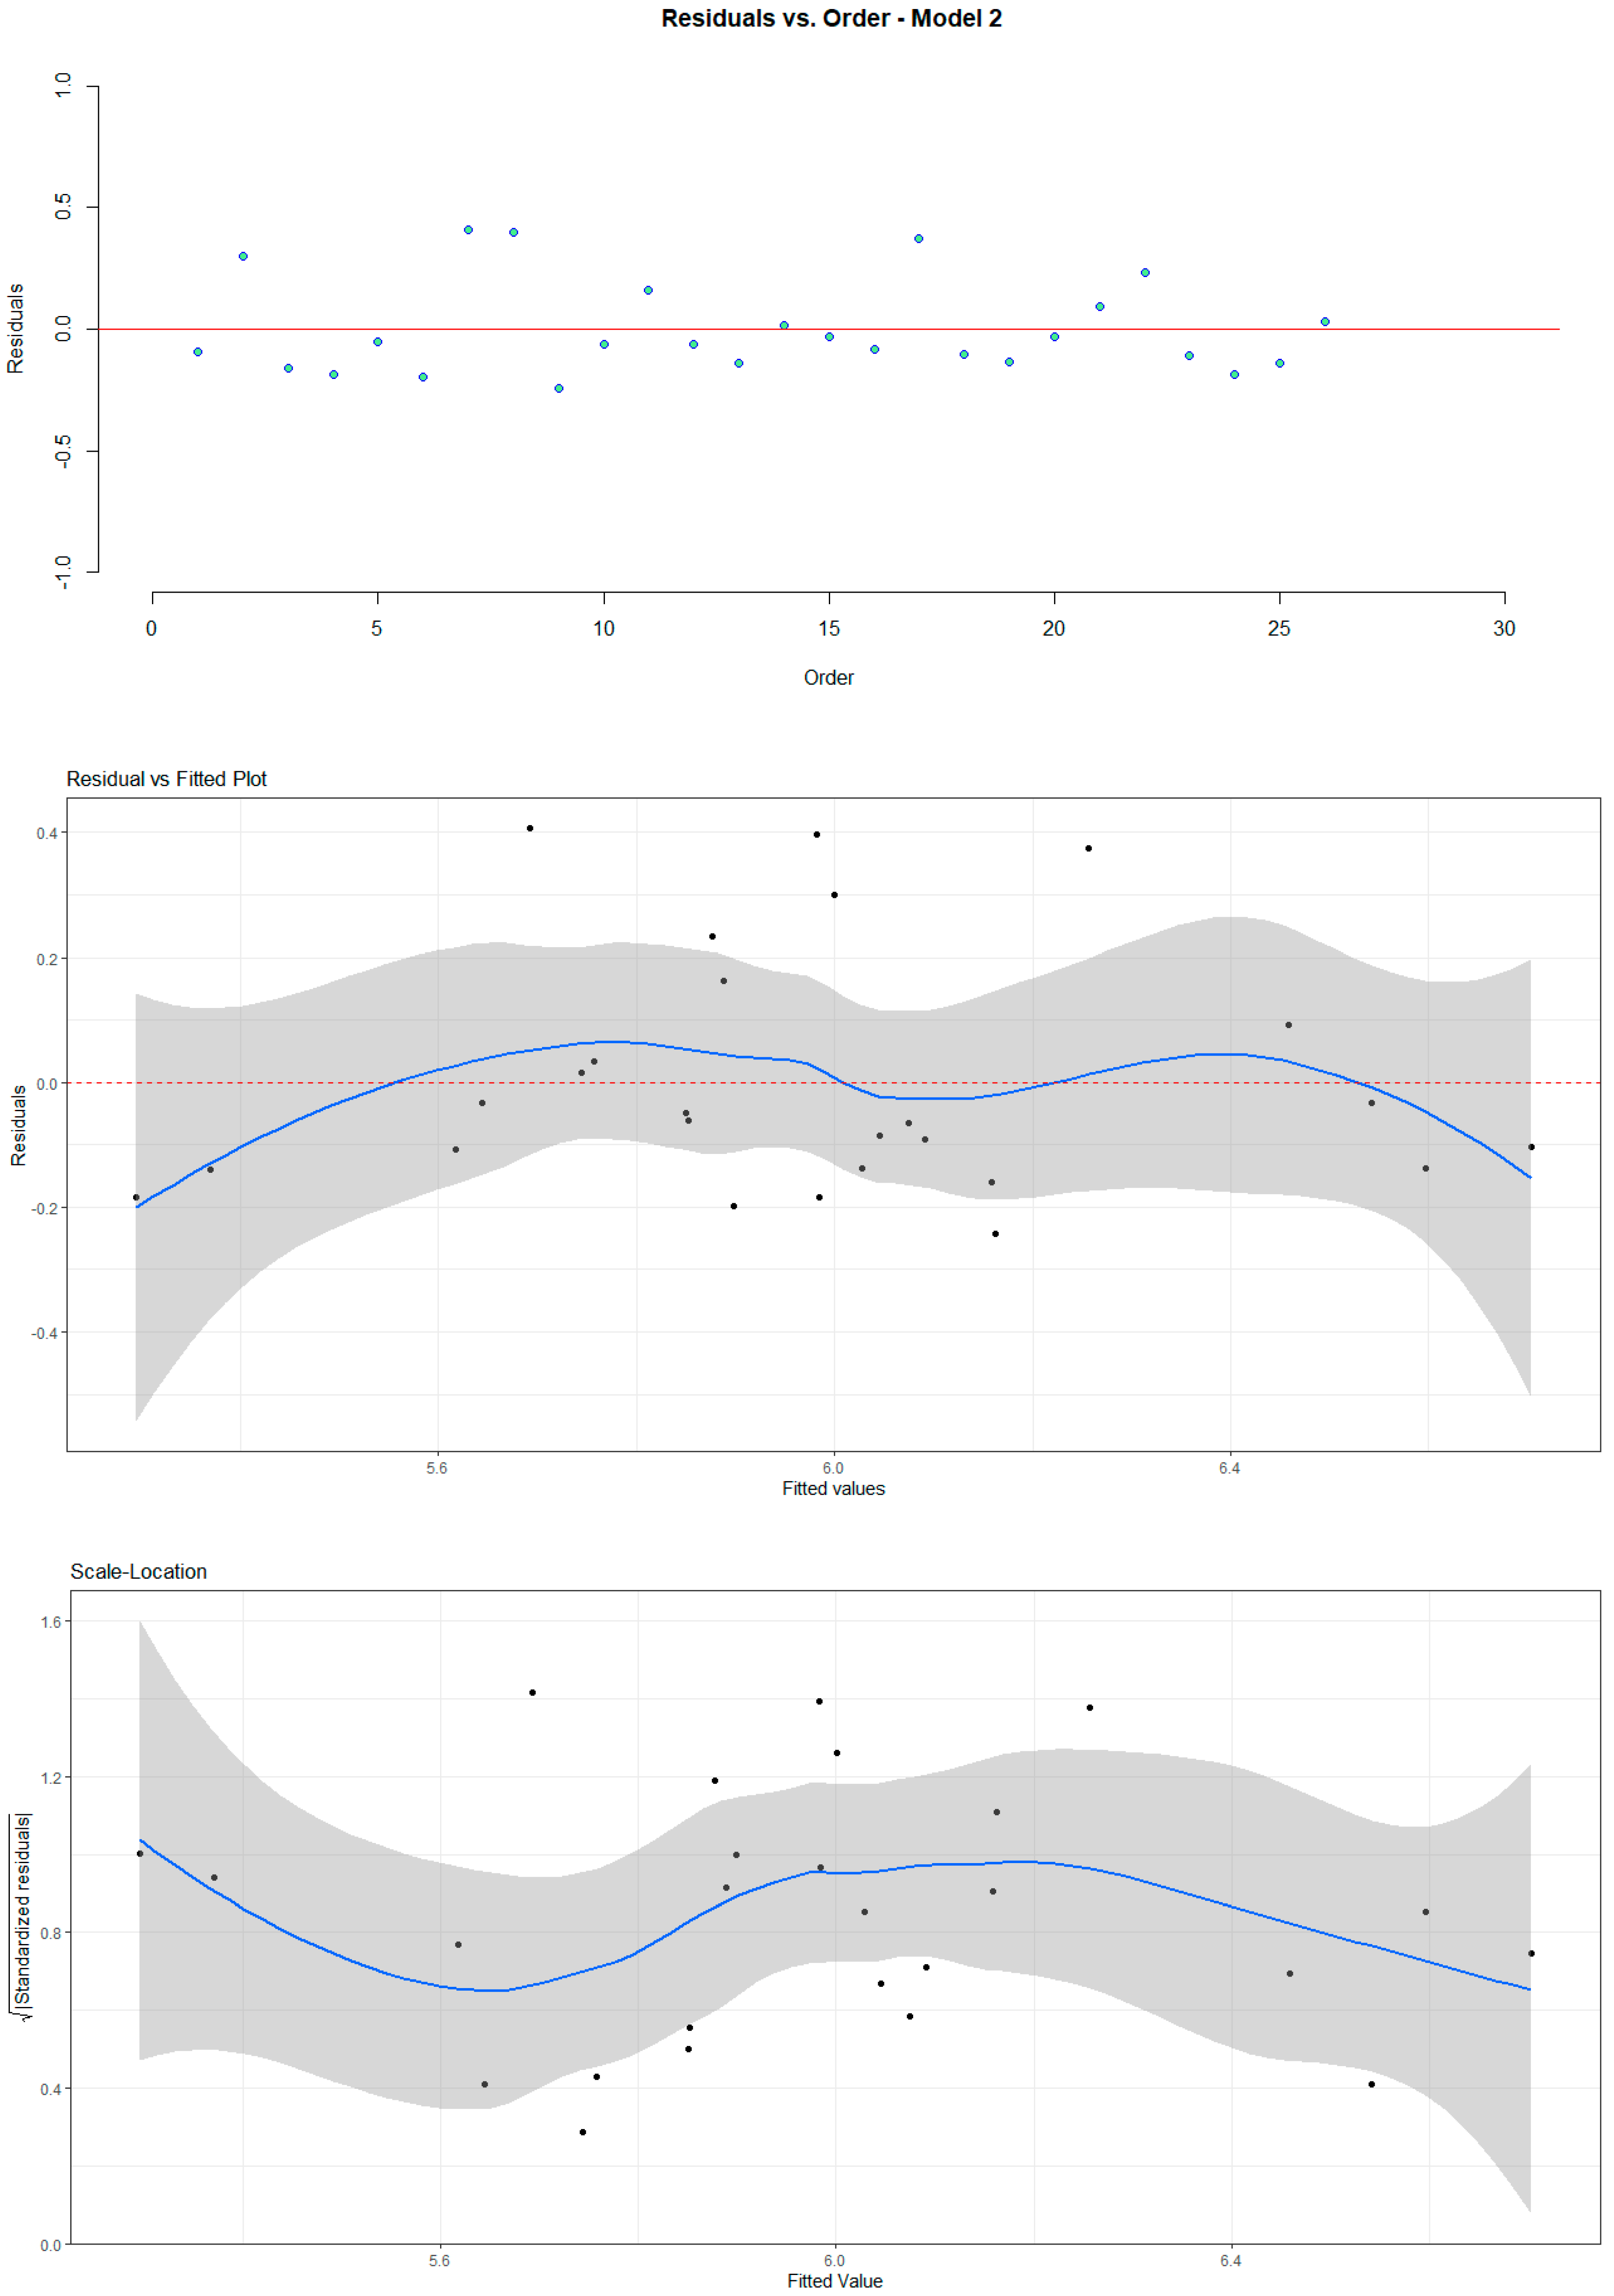
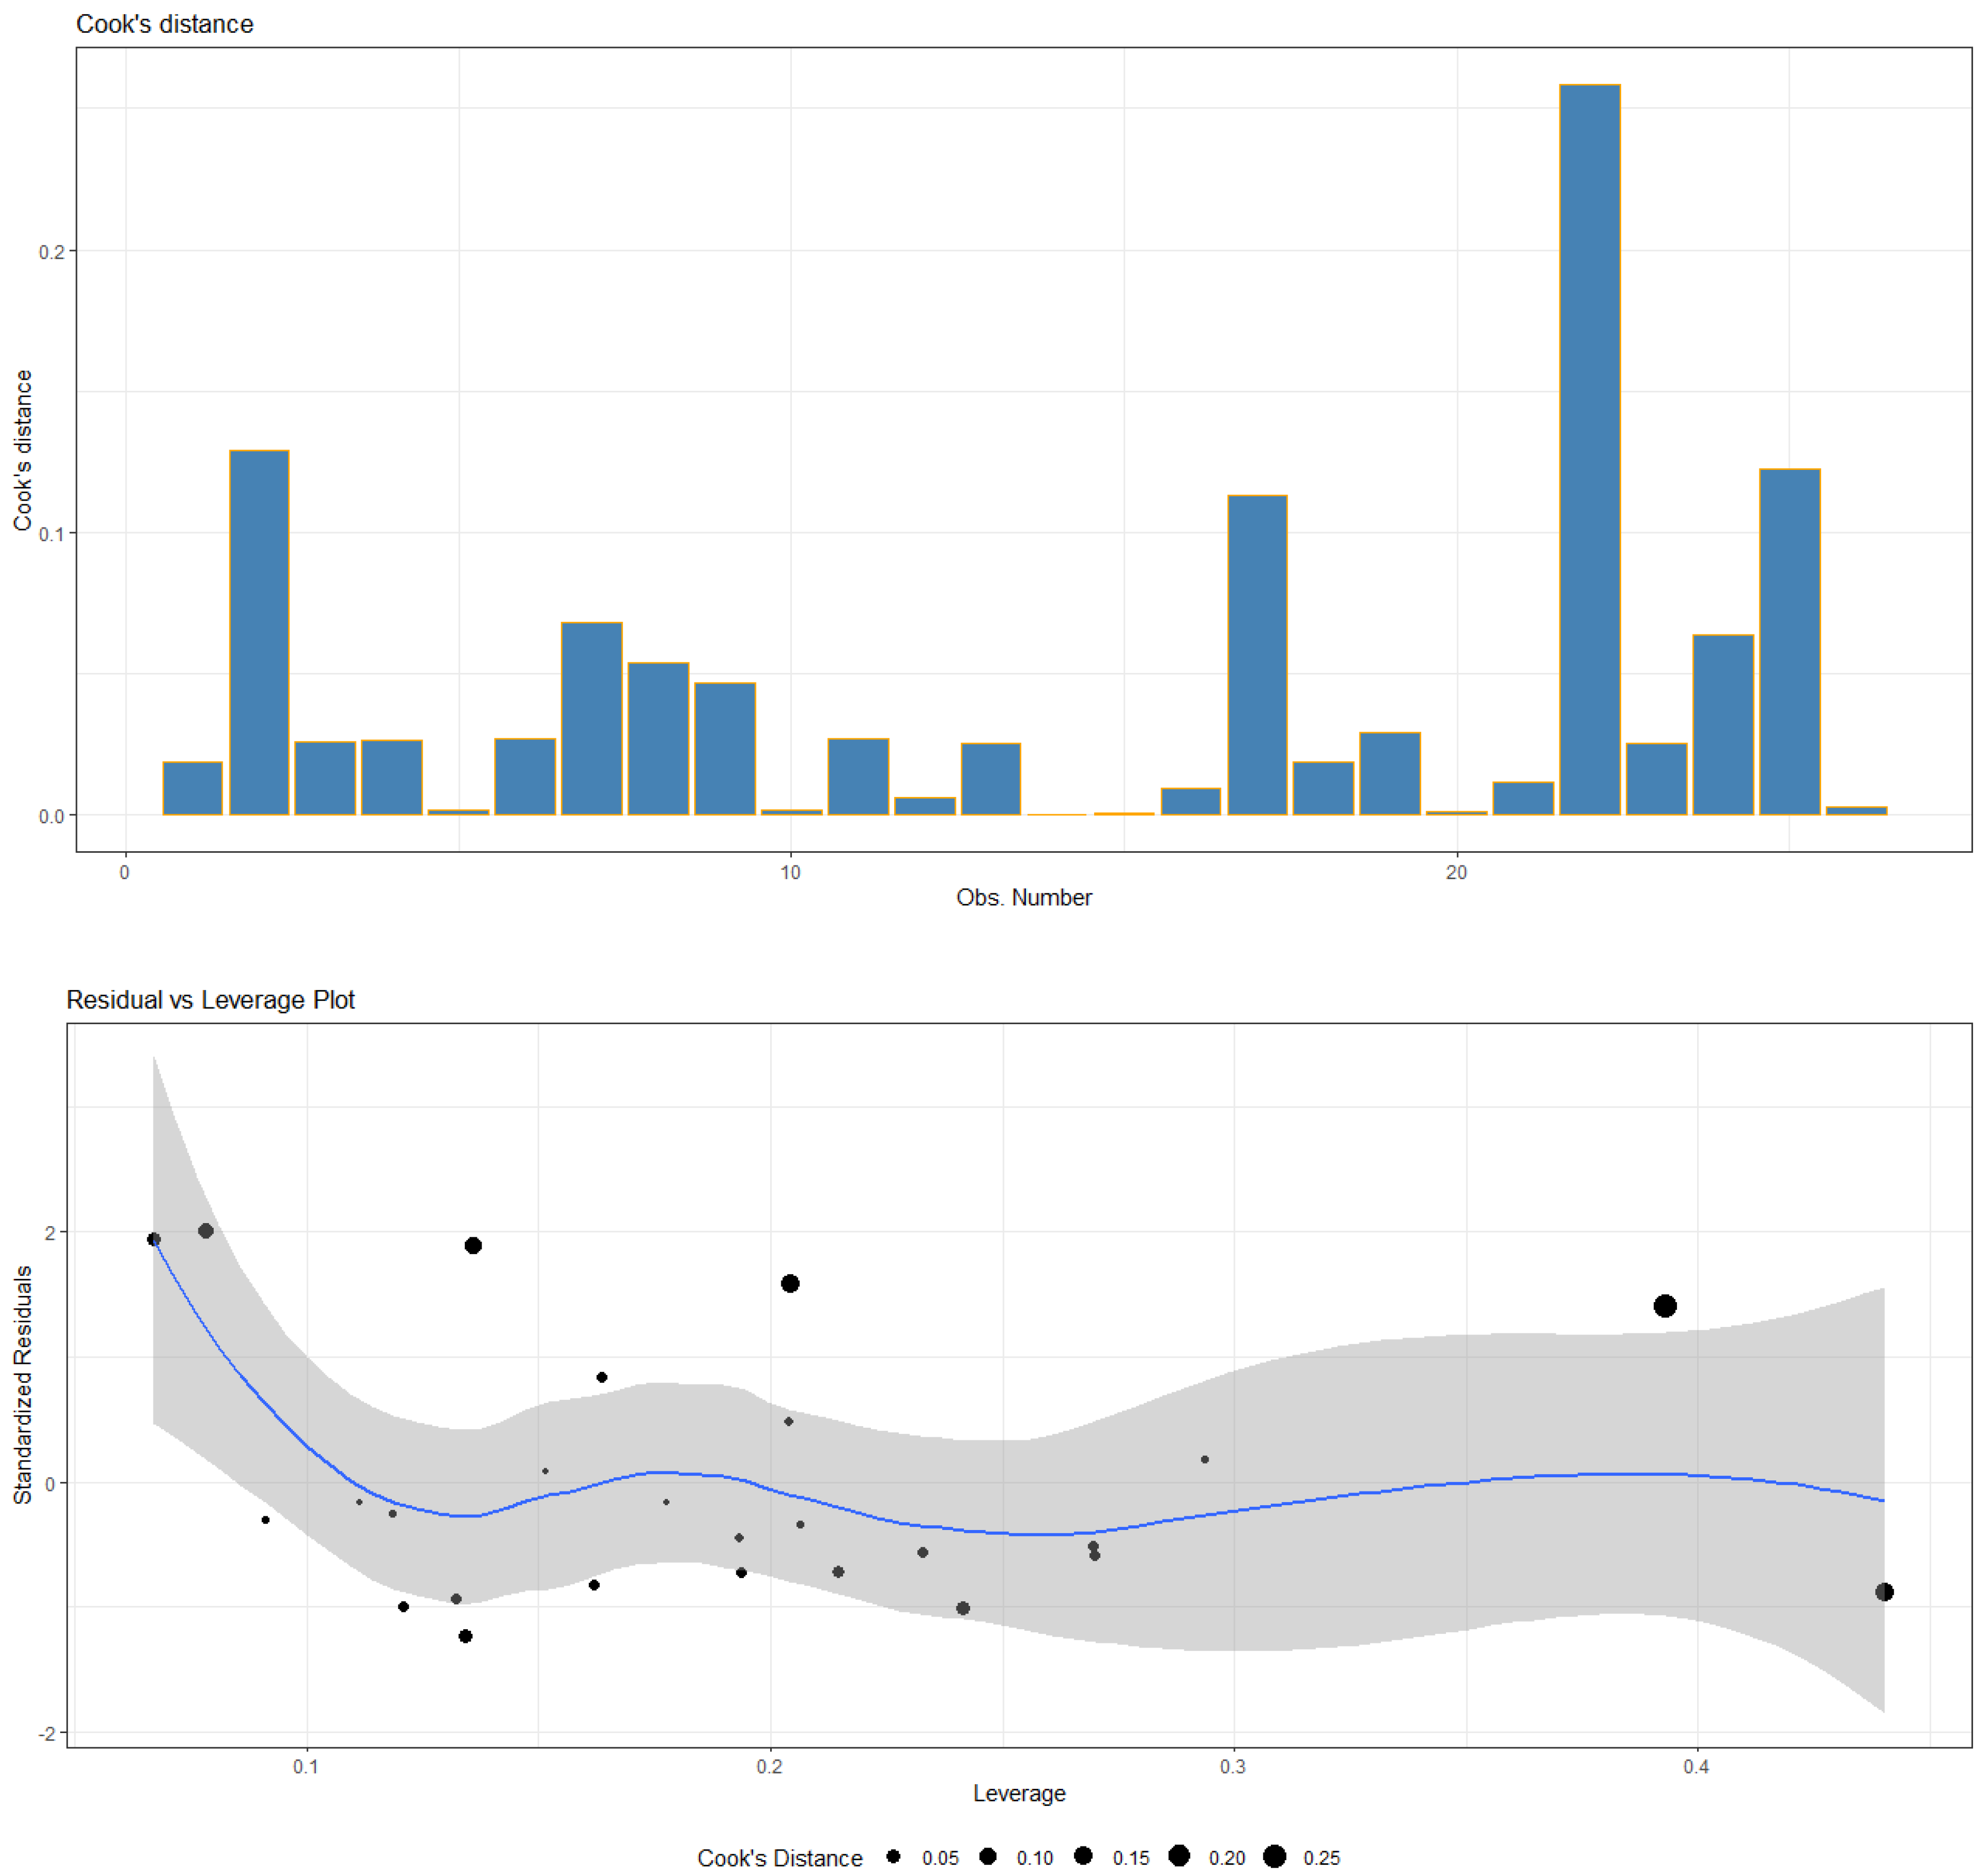
2adj = 71.17). The Model 2 residuals are positively skewed, with a standard deviation of 0.21 and the largest one, corresponding to the eighth observation, is valued at 2.17. Nevertheless, there are not studentized residuals with Bonferroni
p < 0.05 to be considered as outliers.
From the Durbin–Watson test, the D-W Statistic is 2.11 with
p-value at 0.572, larger than any significance level, concluding no autocorrelation at lag 1 in the model. Applying the studentized Breusch–Pagan test, we end up with BP statistics at 1.005 on 4 df with
p-value = 0.909. Thus, we cannot reject the homoscedasticity of the model residuals. Finally, the Shapiro–Wilk test for normality, with W statistic at 0.8617 and
p-value = 0.0024, rejects the normality of the residuals. The above-mentioned test of the assumptions and relative conclusions is also illustrated in the diagnostics plots in
Figure A2 of
Appendix B. Searching for multicollinearity, the values of the VIF in
Table 2, being less than two, indicate that there is no multicollinearity effect among the predictors.
In Model 2, as in Model 1, the variable WGDP has a negative coefficient, which implies that increases in the share of wages and salaries in GDP are associated with decreases in income inequality, as measured by QSR. Furthermore, as in Model 1, the GESCOV dummy variable has a positive sign, which suggests that crises years are associated with increases in income inequality. As in Model 1, RGDP has a positive sign, meaning that income inequality is positively related to economic growth. In Model 2, the dummy variable ELE is not statistically significant, which suggests that the economic policy followed during the pre-election periods in the country, while limiting the overall inequality of income distribution as measured by the Gini coefficient, does not seem to affect the quintile share ratio index S80/S20 in a statistically significant way. That is, the ratio of the disposable income of the richest 20% of the population to that of the poorest 20% is not significantly affected. As in Model 1, the unemployment rate (UNR) is not a statistically significant explanatory variable.
3.3. Model 3 (m = 3): Dependent Variable ROPR
In Model 3, the statistically significant independent variables are WGDP, RGDP, UNR, and the dummy variable GESCOV. The coefficient estimates and significance tests of the model are presented in
Table 3 and the analysis of variance in
Table A3 of
Appendix A. Model 3 shows a coefficient of determination R
2 = 79.46 (R
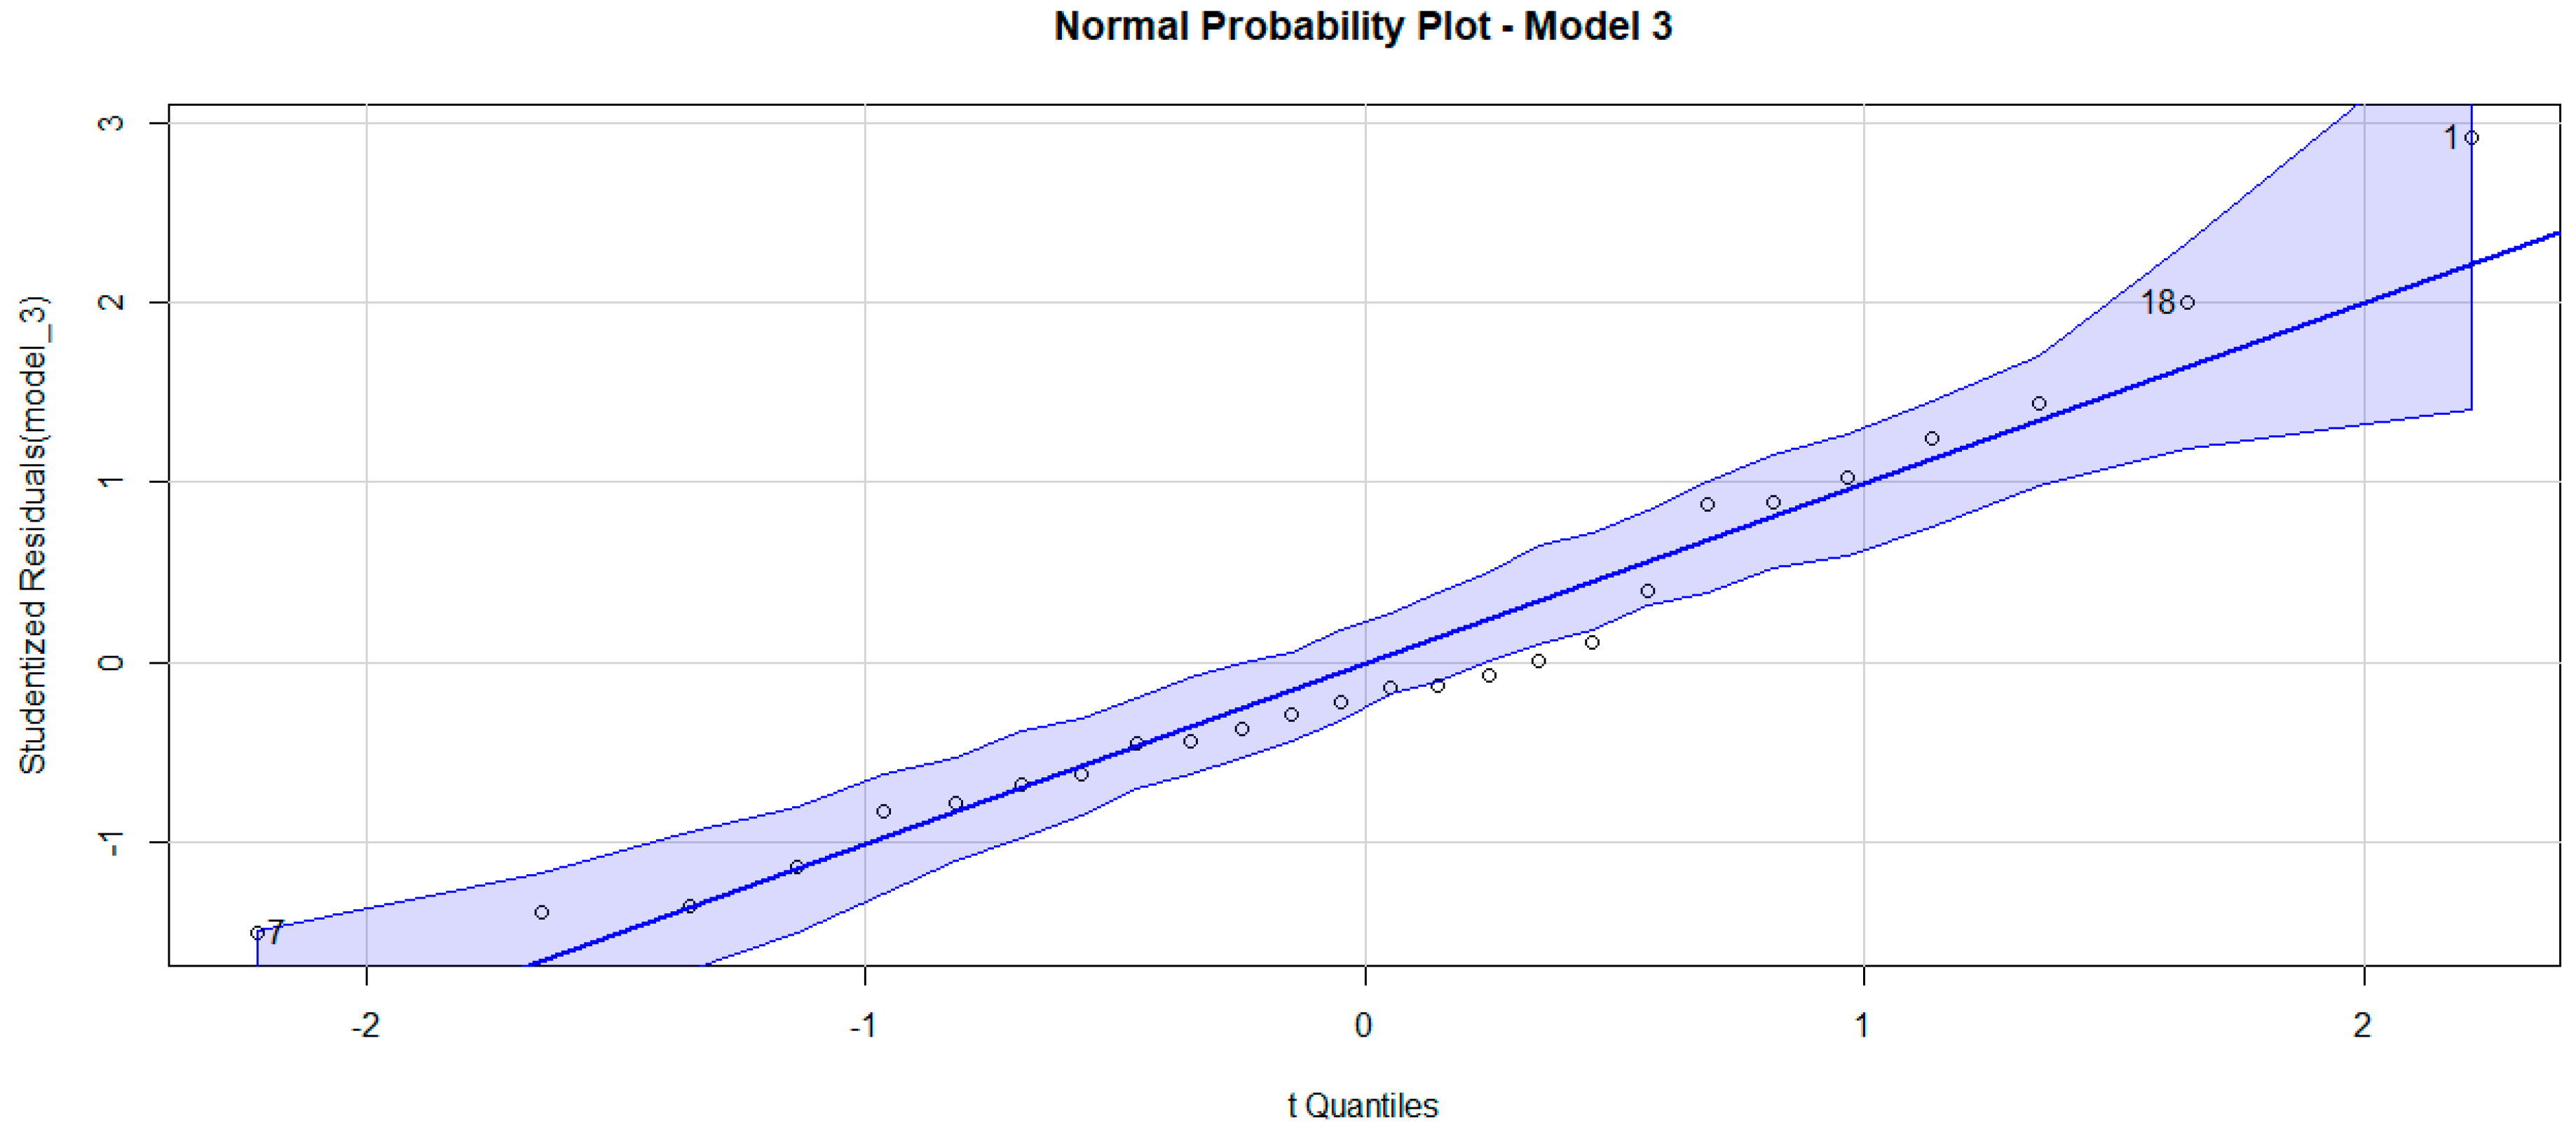
2adj = 75.55). Model 3 residuals are symmetrically distributed around zero with a standard deviation of 0.65 and the largest one, corresponding to the eighth observation, is valued at 3.13. Nevertheless, there are not studentized residuals with Bonferroni
p < 0.05 to be considered as outliers.
From the Durbin–Watson test, the D-W Statistic is 1.44 with
p-value at 0.02, concluding positive autocorrelation at lag 1 estimated at 0.15. Applying the studentized Breusch–Pagan test, we end up with BP statistics at 2.2322 on 4 df with
p-value = 0.6931, meaning that we cannot reject the homoscedasticity of the model residuals. Finally, the Shapiro–Wilk test for normality, with W statistic at 0.949 and
p-value = 0.22, fails to reject the normality of the residuals. The above-mentioned test of the assumptions and relative conclusions is also illustrated in the diagnostics plots in
Figure A3 of
Appendix B. Searching for multicollinearity, the values of the VIF in
Table 3, being less than three, indicate that there is no multicollinearity effect among the predictors.
In order to cope with the autocorrelation detected with the D-W test, we introduce ROPR lag 1 (ROPR-1) and RORP lag 2 (ROPR-2) variables as predictors but get no significant improvement, since the lag variables are not significant, and autocorrelation remains at the same level.
In Model 3, as in Models 1 and 2, the variable WGDP has a negative coefficient, which implies that increases in the share of wages and salaries in GDP are associated with decreases in the at-risk-of-poverty rates. Crucially, as in Models 1 and 2, the GESCOV dummy variable has a positive coefficient, which suggests that crises years are associated with increases in the risk of poverty. As in Models 1 and 2, RGDP comes in with a positive sign, which confirms the hypothesis that the risk of poverty is positively related to economic growth in the cases of developed countries. Moreover, in Model 3 the unemployment rate (UNR) is a statistically significant explanatory variable, and its coefficient has a positive sign, which implies that increases in unemployment are associated with increases in the risk of poverty. Reducing unemployment can, therefore, be regarded as a significant means for reducing the at-risk-of-poverty rate. In Model 3, the dummy variable ELE is not statistically significant, which suggests that the economic policy followed during the pre-election periods in the country, while limiting the overall inequality of income distribution, does not seem to affect the risk of poverty in a statistically significant way.
3.4. Predictive Accuracy
In order to assess and compare the predictive accuracy of the three models, we use the Mean Absolute Percentage Error (MAPE(m)) with m = 1, 2, 3 for Models 1, 2, and 3, respectively. The results are: . Therefore, we conclude that Model 1 has better predictive accuracy when compared to the other two models.
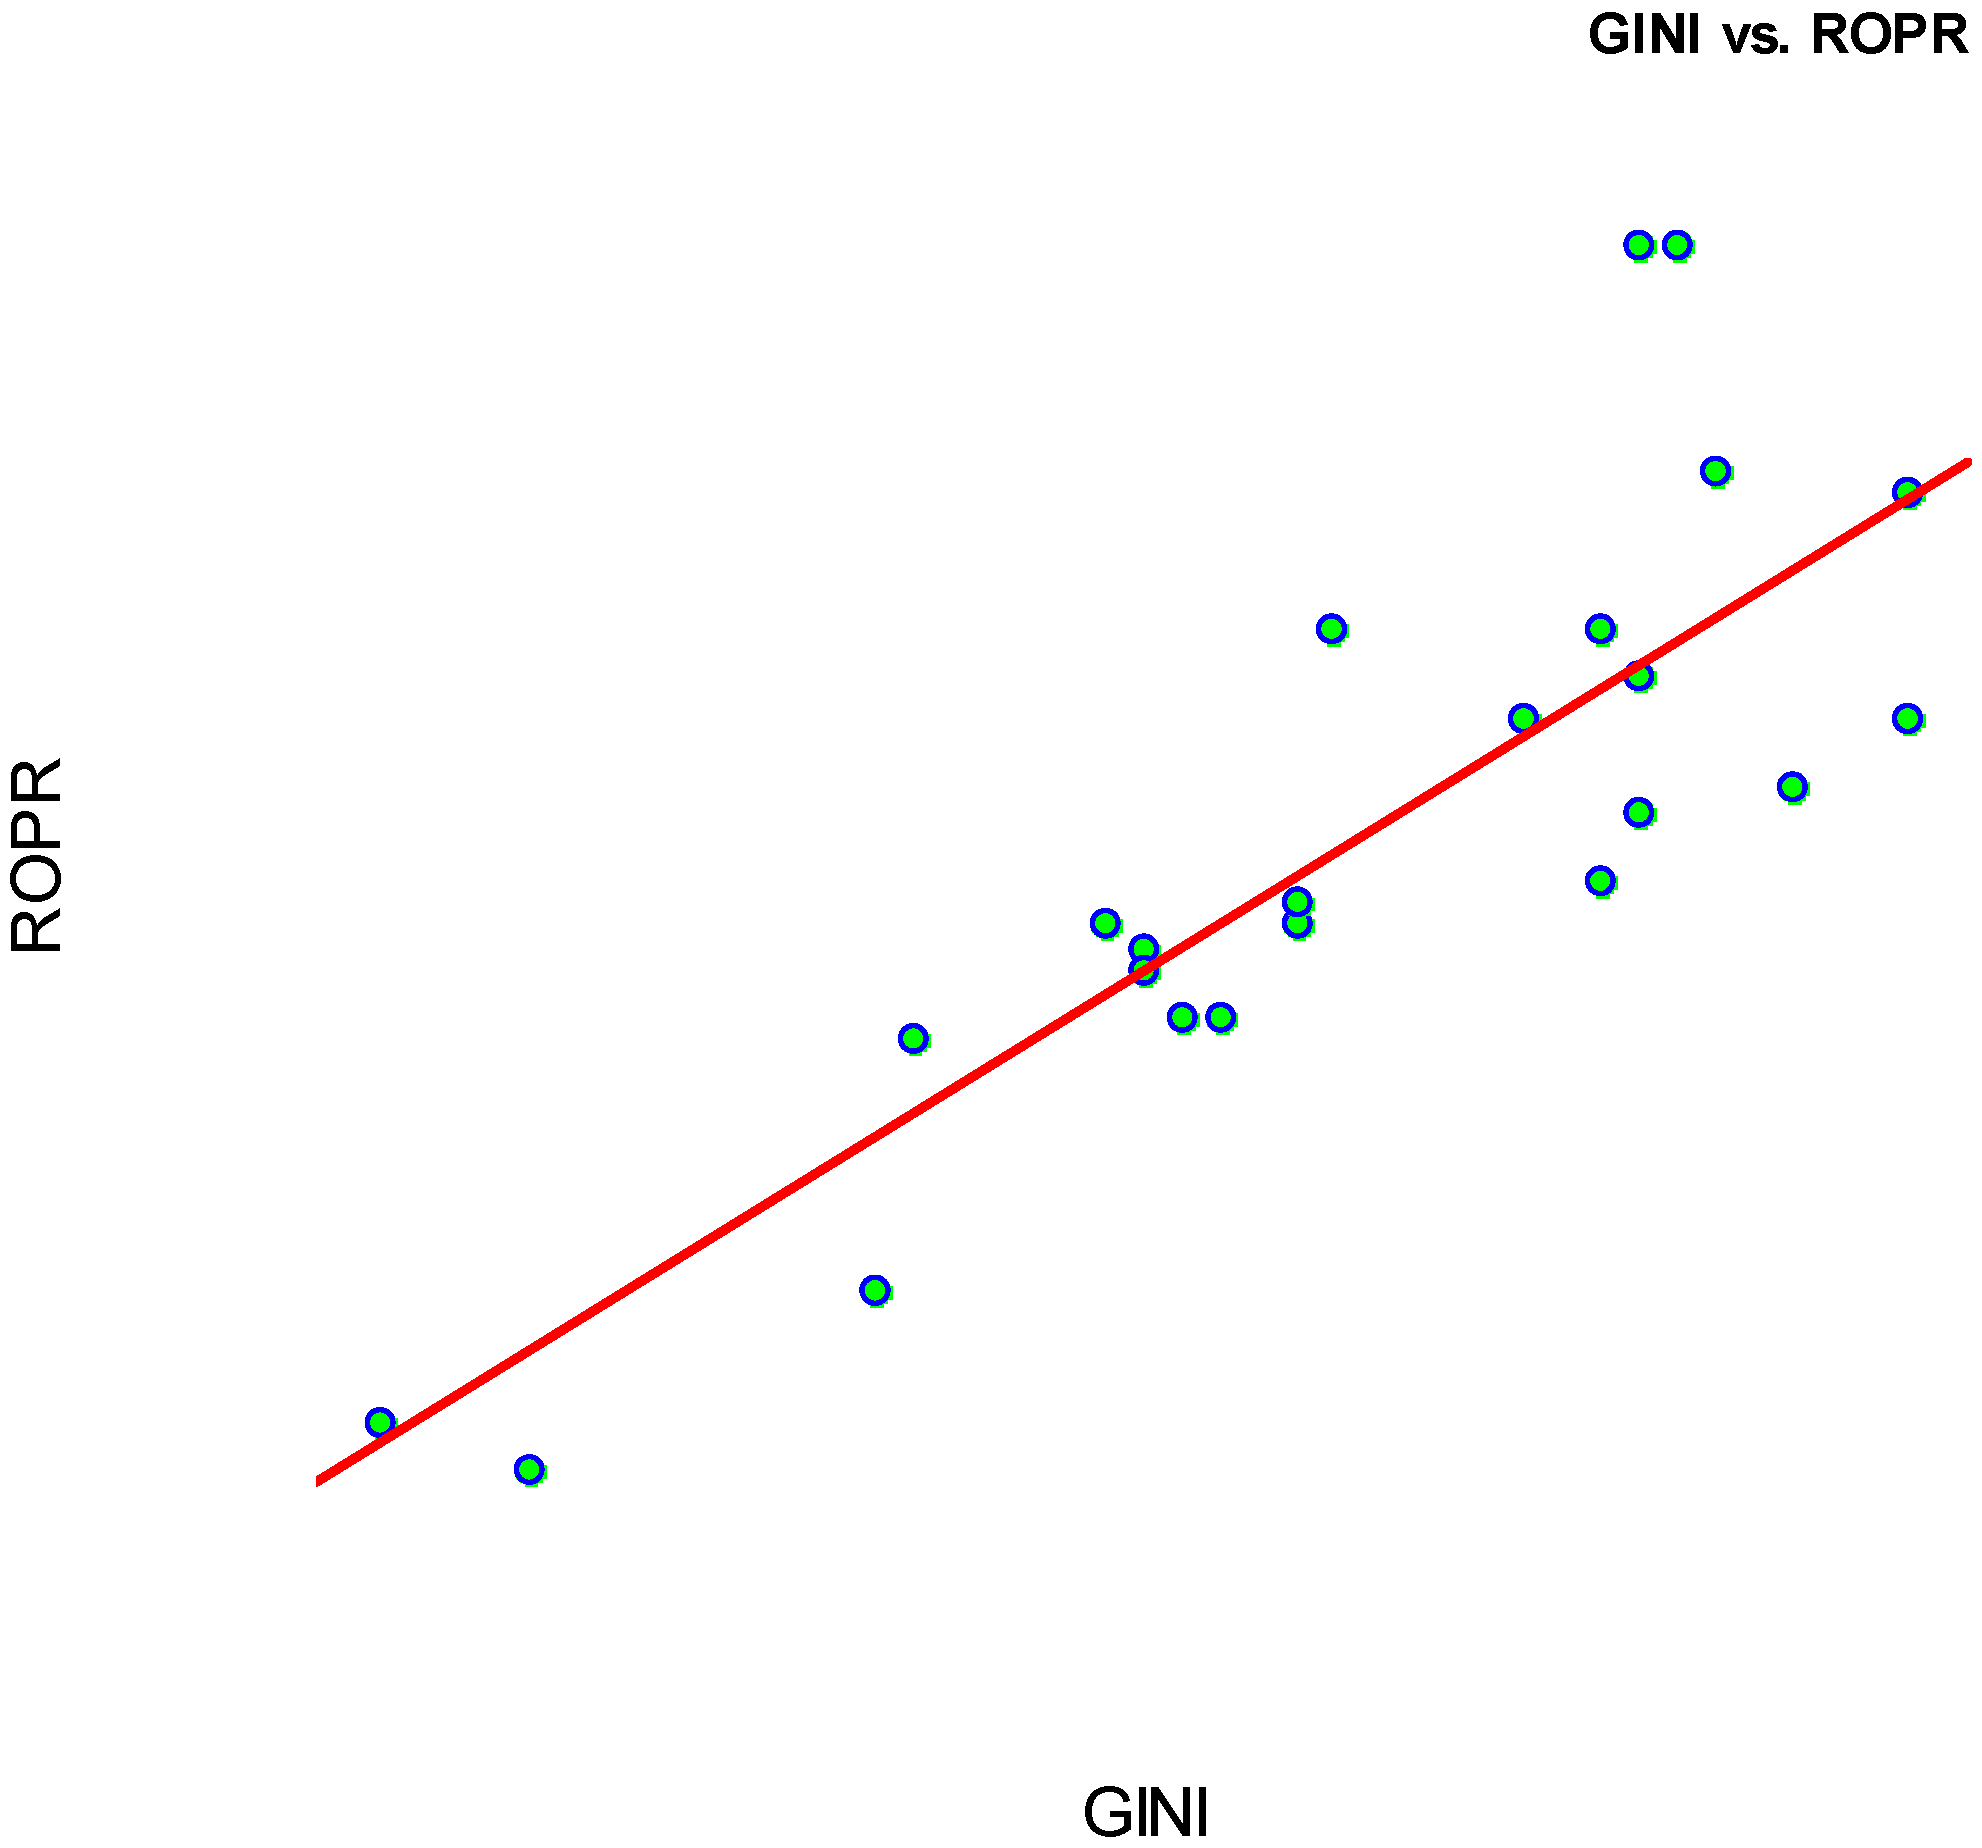
3.5. Correlation between Inequality and Risk of Poverty
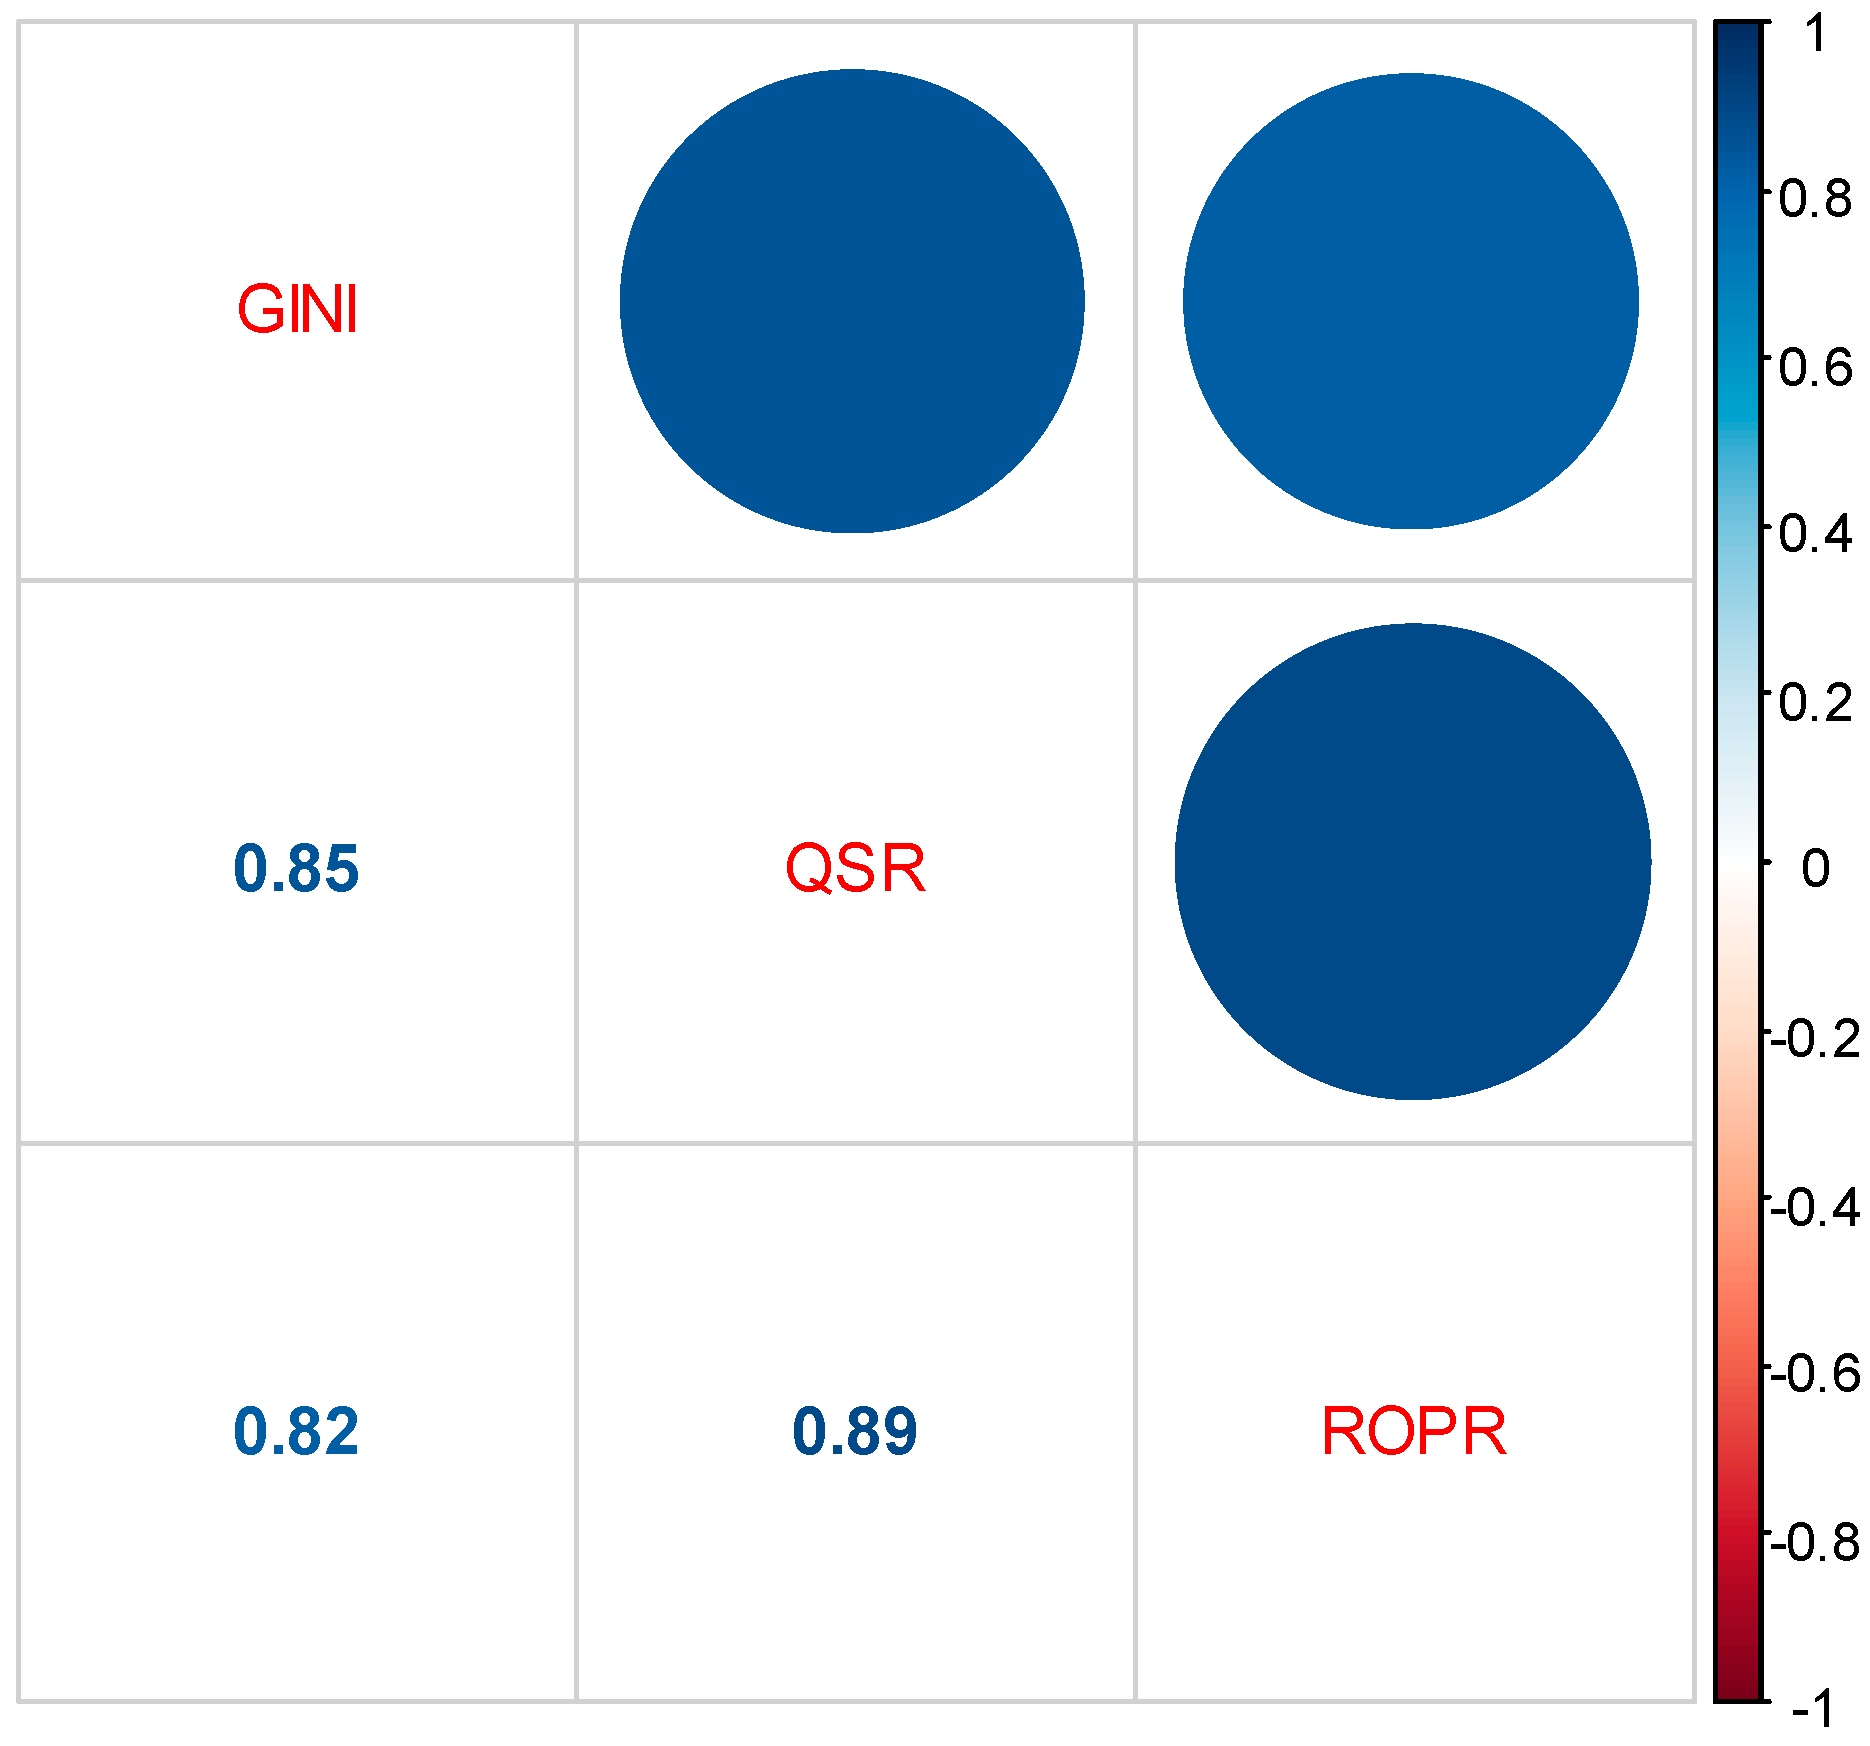
There is a significant positive correlation among all three dependent variables in the proposed regression models of the previous sections. The correlations were measured with the Pearson coefficient and are illustrated in
Figure 4.
By further investigating the correlation between income inequality as it is measured by the Gini coefficient and the risk of poverty in the case of Greece, we can conclude that:
We can conclude that, in order to control the risk of poverty (ROPR), income inequality (GINI) has to be reduced.
4. Discussion
The aim of this paper is twofold. Firstly, we uncover the most important determinants of income inequality in Greece for the years 1995–2021. Secondly, we determine whether the economic crises that affected the Greek economy during 2011–2016, as a result of the global financial crisis, and during 2020–2021, as a result of the COVID-19 pandemic, improved or deteriorated income inequality and relative poverty in the country.
Table 4 summarizes the results from our three empirical models presented in the previous section.
The first take-home point from our empirical analysis is that income inequality is autocorrelated. Regardless of the measure we use, income inequality depends heavily on past values like GINI-1 or QSR-1, and it appears that its adjustment process is slow: the one-year lagged inequality measure has a significant positive effect on the current measure, meaning that a history of inequality creates further inequality. This result is supported by a number of different studies for different times and places. In fact, the persistence of high and, in many countries, rising income inequality over recent decades has become a growing concern at a global level (
OECD 2008;
Dabla-Norris et al. 2015).
The second factor of interest is the positive correlation between growth (RGDP) and inequality and poverty measures. This idea is not new in the literature, and it is actually common in the case of developed economies (
Jianu et al. 2021). For Greece in particular, the relationship between income distribution and economic growth has been found to depend heavily on the effectiveness of the redistributive measures, mainly social transfers, used by the state (
Vavoura and Vavouras 2022). We should not, however, dismiss the fact that the redistributive role of social transfers in Greece is limited to pensions, since all other forms of social transfers have been found to exert insignificant effects on income distribution (
Papatheodorou and Petmesidou 2006). Consequently, the positive coefficient of the RGDP variable can be viewed as evidence of the limited redistributive role that Greek governments have played overtime, resulting in an unequal sharing of the benefits of economic growth (or an unequal sharing of the burdens of economic recession) among the members of Greek society.
This last point, regarding the role of the state, takes us to our next determinant of income inequality that appears to be instrumental in the case of Greece. We refer to the effect of the election (ELE) dummy, which is negatively correlated with inequality when we measure it via the Gini coefficient, but its effect becomes insignificant when we measure it via the quintile share ratio index S80/S20 or the at-risk-of-poverty rate. This result can be interpreted as follows. We know that the Greek economy is characterised by severe political budget cycles and that these cycles materialize mainly through an increase in government expenditure and, more specifically, via pre-election transfer payments (
Petrakos et al. 2021a). These transfers decrease average income inequality, at least in the short term, but do not go as far as to affect extreme inequality (i.e., the share of the top and bottom 20%) and poverty. In other words, the pre-election transfers are mainly targeted towards the “average” voter in terms of personal income, possibly because it is precisely this type of citizen whose voting intentions are more volatile and, hence, more susceptible to opportunistic behavior on the side of the incumbent government. This idea, that governments distribute funding so as to influence the vote of swing voters, is, in fact, one that has been occasionally observed in European countries, for example, by
Dahlberg and Johansson (
2002) in Sweden and by
Case (
2001) in Albania.
Another important aspect of income inequality and poverty is their close ties to the labour market conditions. To begin with, a vast collection of literature documents the influence of unemployment on inequality and poverty (e.g.,
Mocan 1999;
Cysne 2009;
Zandi et al. 2022). In our study, unemployment has a significant positive correlation with the risk of poverty, although we do not find evidence that it significantly affects either of our other inequality measures. In any case, this result could help guide policy makers to increase their focus on unemployment when battling poverty and inequality. For Greece in particular, where the unemployment rate has not fallen below 15% during the period 2011–2021 according to Eurostat, we argue that any regulations aimed at the improvement of income distribution are destined to fail unless they tackle the catastrophic economic and social consequences of prolonged unemployment.
However, the mechanism through which the labour market affects income inequality and poverty is not limited to unemployment. There is a second core factor: the labour income share. In our model, we follow the standard approach of measuring the labour income share via the share of wages and salaries in GDP (WGDP)
8. This measure is known to have problems (
Krueger 1999), mainly because it mismeasures the labour share of self-employment which, in Greece, is the highest among EU members
9. Nonetheless, its strong negative correlation with all three measures of relative inequality and poverty (see
Table 4), emphasizes the importance of workers’ welfare and labour income protection as forces towards income equalization.
Related to the topic of income inequality, we should point out that there is a rapidly growing literature, following the works by
Karabarbounis and Neiman (
2014),
Piketty and Zucman (
2014), and
Dao et al. (
2017), on labour income share, documenting its worldwide decline. However, EU countries on aggregate have been found to follow no such trend.
Cette et al. (
2020) and
Gutiérrez and Piton (
2020) document the stability of the labour income share in Europe, with certain countries, Greece being one of them, witnessing an increase
10. We argue that this trend has mitigated the effects of economic crises, which we are about to discuss, on Greek income distribution.
Finally, our most interesting result and our most notable contribution to the literature is summed up by the positive correlation between the crises (GESCOV) dummy and all three of our measures of inequality (GINI, QSR) and poverty (ROPR). This finding verifies our research hypothesis: the two recent economic crises were associated with a sharp increase in income inequality and relative poverty in Greece. The austerity measures adopted by EU institutions and the Greek government as a reaction to the country’s debt crisis, fueled by the global financial crisis, as well as the policies that followed in response to the COVID-19 pandemic, operated as redistributive mechanisms, essentially “taking from the poor and giving to the rich”. The redistributive role of the crises is stronger in the case of the lowest of incomes, given that the effect of the crises dummy is found to be higher in the at-risk-of-poverty rate. In other words, the crises in Greece have hit the economically weakest the hardest. Our results are in line with
Nolan et al. (
2019) who investigated the impact of the great recession of 2007–2009 and reported that Greece constitutes “the most dramatic case” of crisis-induced increased inequality.
To conclude, our study serves as a reminder that the central pilar of the Greek government’s economic and social policy, especially during periods of crisis, should be to dampen their redistributive effects by increasing the role of the benefit and tax system in cushioning a declining aggregate income and in protecting households against income losses. However, to date, the policy mix adopted in order to deal with economic slowdowns does not appear to have contributed effectively to this direction.
Lastly, it should not go without mentioning that policy recommendations involving the Greek benefit and tax system can hardly be viewed as complete without mentioning the need to improve its effectiveness, to control hidden economy activity, and to restrict corruption (
Manolas et al. 2013). Unless tax evasion, mainly among the incomes from entrepreneurial activities, is reduced, taxes and social security contributions will have but a weak impact on the reduction of inequality (
Papatheodorou 1998).
5. Conclusions
The main objective of our analysis was to investigate whether the distribution of income and the risk of poverty in Greece in the post-1995 period were affected by the economic crises of the 2010s onward. We found that both income inequality and poverty worsened as a result of the crises and that this result is robust to different measures of inequality and poverty, namely the Gini coefficient, the quintile share ratio index S80/S20, and the at-risk-of poverty rate. All of these measures exhibit a significantly positive correlation with the economic crises’ dichotomous variable, implying that the country’s response to economic shocks was particularly harmful for the economically disadvantaged members of the Greek society. We argue that this matter of extreme importance has received limited attention both from Greek economists and in public debate, and we hope that our study could help to shed light on the issue.
A second purpose of our work was to examine the most important macroeconomic variables affecting the distribution of income in Greece. Our findings can be summed up as follows. Firstly, increases in the share of wages and salaries in the GDP are associated with reductions in income inequality and the risk of poverty. Secondly, reductions of unemployment rates are associated with reductions of the risk of poverty. These two results suggest that labour market conditions are crucial for income inequality and that shielding workers’ welfare is bound to increase equality, at least in the case of Greece. Thirdly, income inequality is positively related to economic growth. This result suggests that the benefits of growth and the burdens of recession are not distributed equally among the members of the Greek society. Finally, during pre-election periods, income inequality, as measured by the Gini coefficient, is reduced but extreme inequality, as measured by the quintile share ratio index S80/S20 and the at-risk-of poverty rate, is unaffected. This result implies that the political budget cycles that are characteristic of the Greek economy create gains in terms of equality, but these gains are short-lived and mainly benefit the middle bracket of the income distribution.
We conclude that the recent economic crises did not affect the Greek society in a balanced way, but rather had a strongly redistributive character. This does not, however, appear to have been the case for the majority of the rest of the EU member states. Consequently, we argue that there is a lesson to be learned for Greek policy makers who, in the future, should try to dampen these redistributive effects.
Future research, should such data become available, could consider how the effects of crises have varied for different regions of Greece and how they have depended on specific geographical and economic characteristics, possibly also taking into consideration tourism seasonality, as in
Tsiotas et al. (
2020), in order to propose useful regional policies.
Moreover, following works like
Zeqiraj et al. (
2022),
Khan et al. (
2014), and
Kaasa (
2003), principal component analysis could be applied to construct indicators of health and education, population and environmental conditions, sectoral growth and balance of payment factors, private investment, and public and social expenditures. Researching the link between such indicators and the income distribution could provide a spherical view of the evolution of income inequality in Greece and serve as the basis for the design of appropriate poverty combating policies.
Finally, from a cross-country study similar to
Petrakos et al. (
2023) of the four EU member states that were hit hardest by the global crisis of 2007–2009, namely Portugal, Italy, Greece, and Spain, it could be possible to draw interesting inferences regarding the impact of different austerity measures on the income distribution and to propose fewer equality-distorting alternatives for the future.


