1. Introduction
The COVID-19 pandemic has had an impact on the weakening of the economy and public welfare, following the implementation of health policies around the world. The World Bank in their
Global Economic Prospects report stated that the international crisis caused by the COVID-19 pandemic was the worst that had occurred since 1870 (
VOA 2020). The World Bank predicted that the world would experience an economic contraction of −5.2 percent in 2021, with a further 4.1 percent in 2022 and 3.2 percent in 2023 (
VOA 2020;
World Bank 2022). Predictions indicate the continuation of turmoil caused by COVID-19, and with low fiscal support, supply chain bottlenecks, and declining demand, global inflation including food and energy prices will increase.
The impact of the pandemic was felt in Indonesia, including in Central Java Province. Indonesia’s GDP decreased by 2.07% in 2020 (
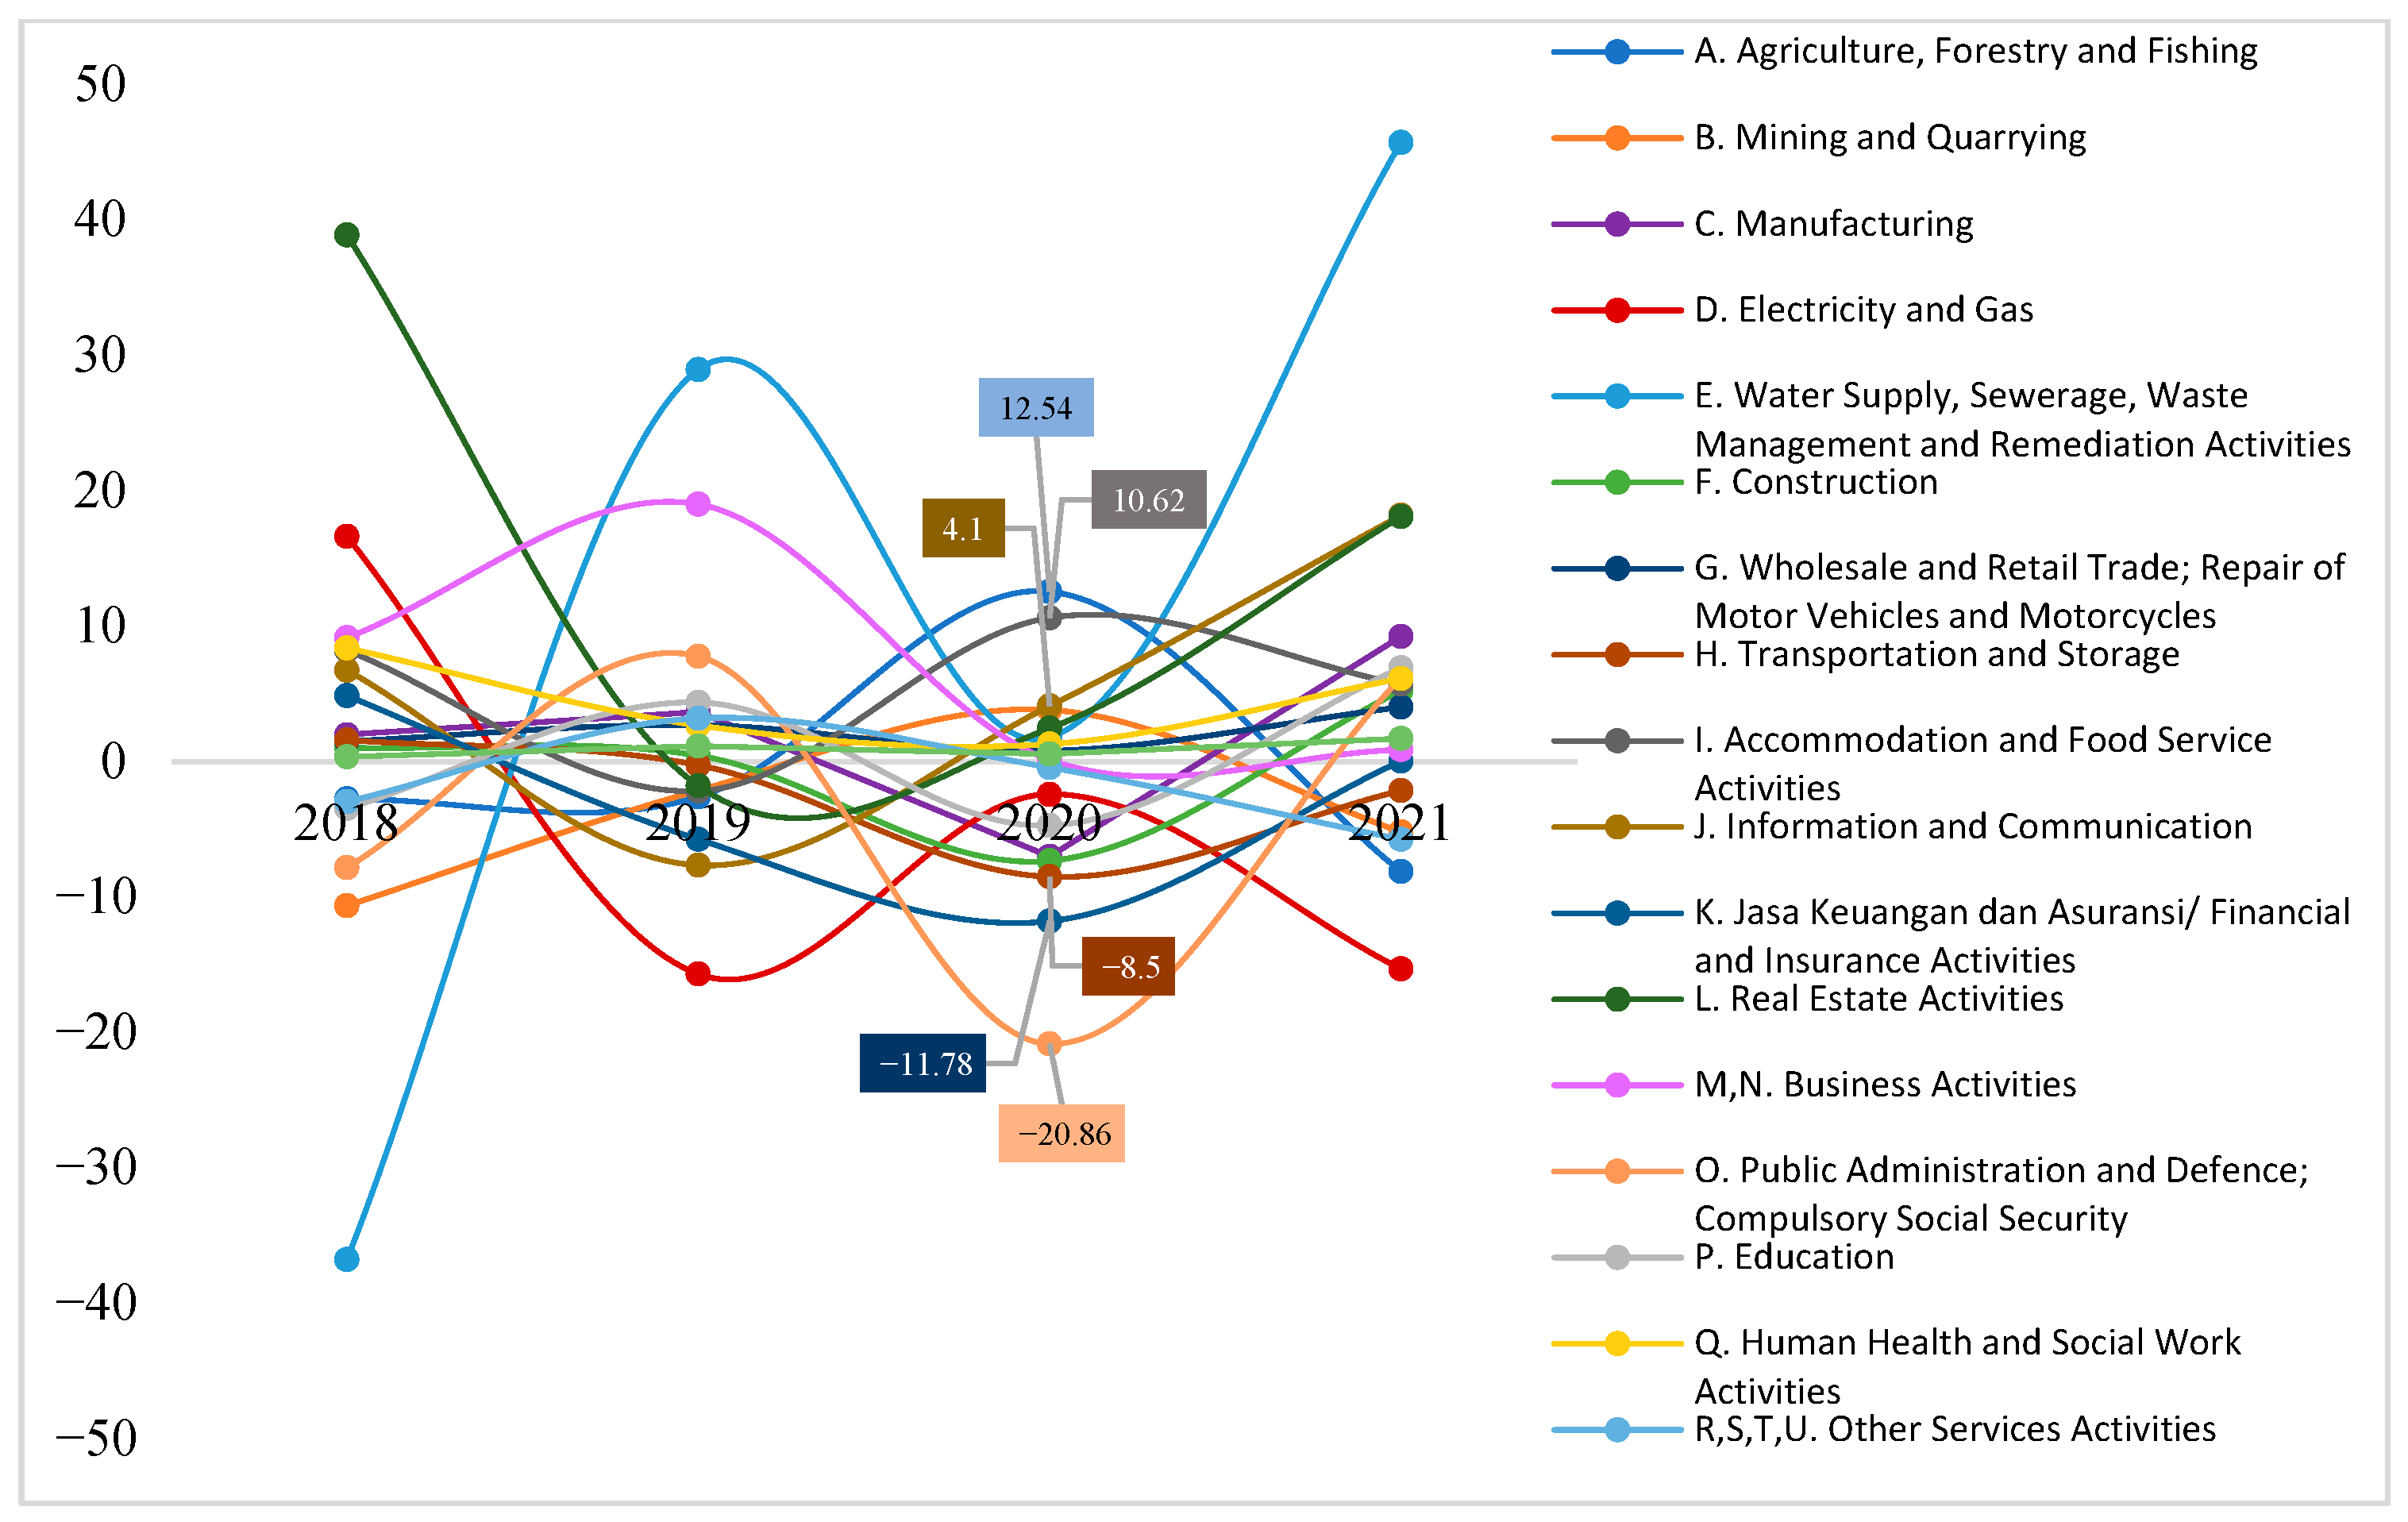
Statistics Indonesia 2022a). Central Java Province is the province with the fourth largest economy in Indonesia, and has experienced a greater decline in GRDP compared with the reduction in Indonesia’s GDP. In 2020, Central Java’s economic activity declined in several industries, accompanied by a reduction in employment (
Figure 1 and
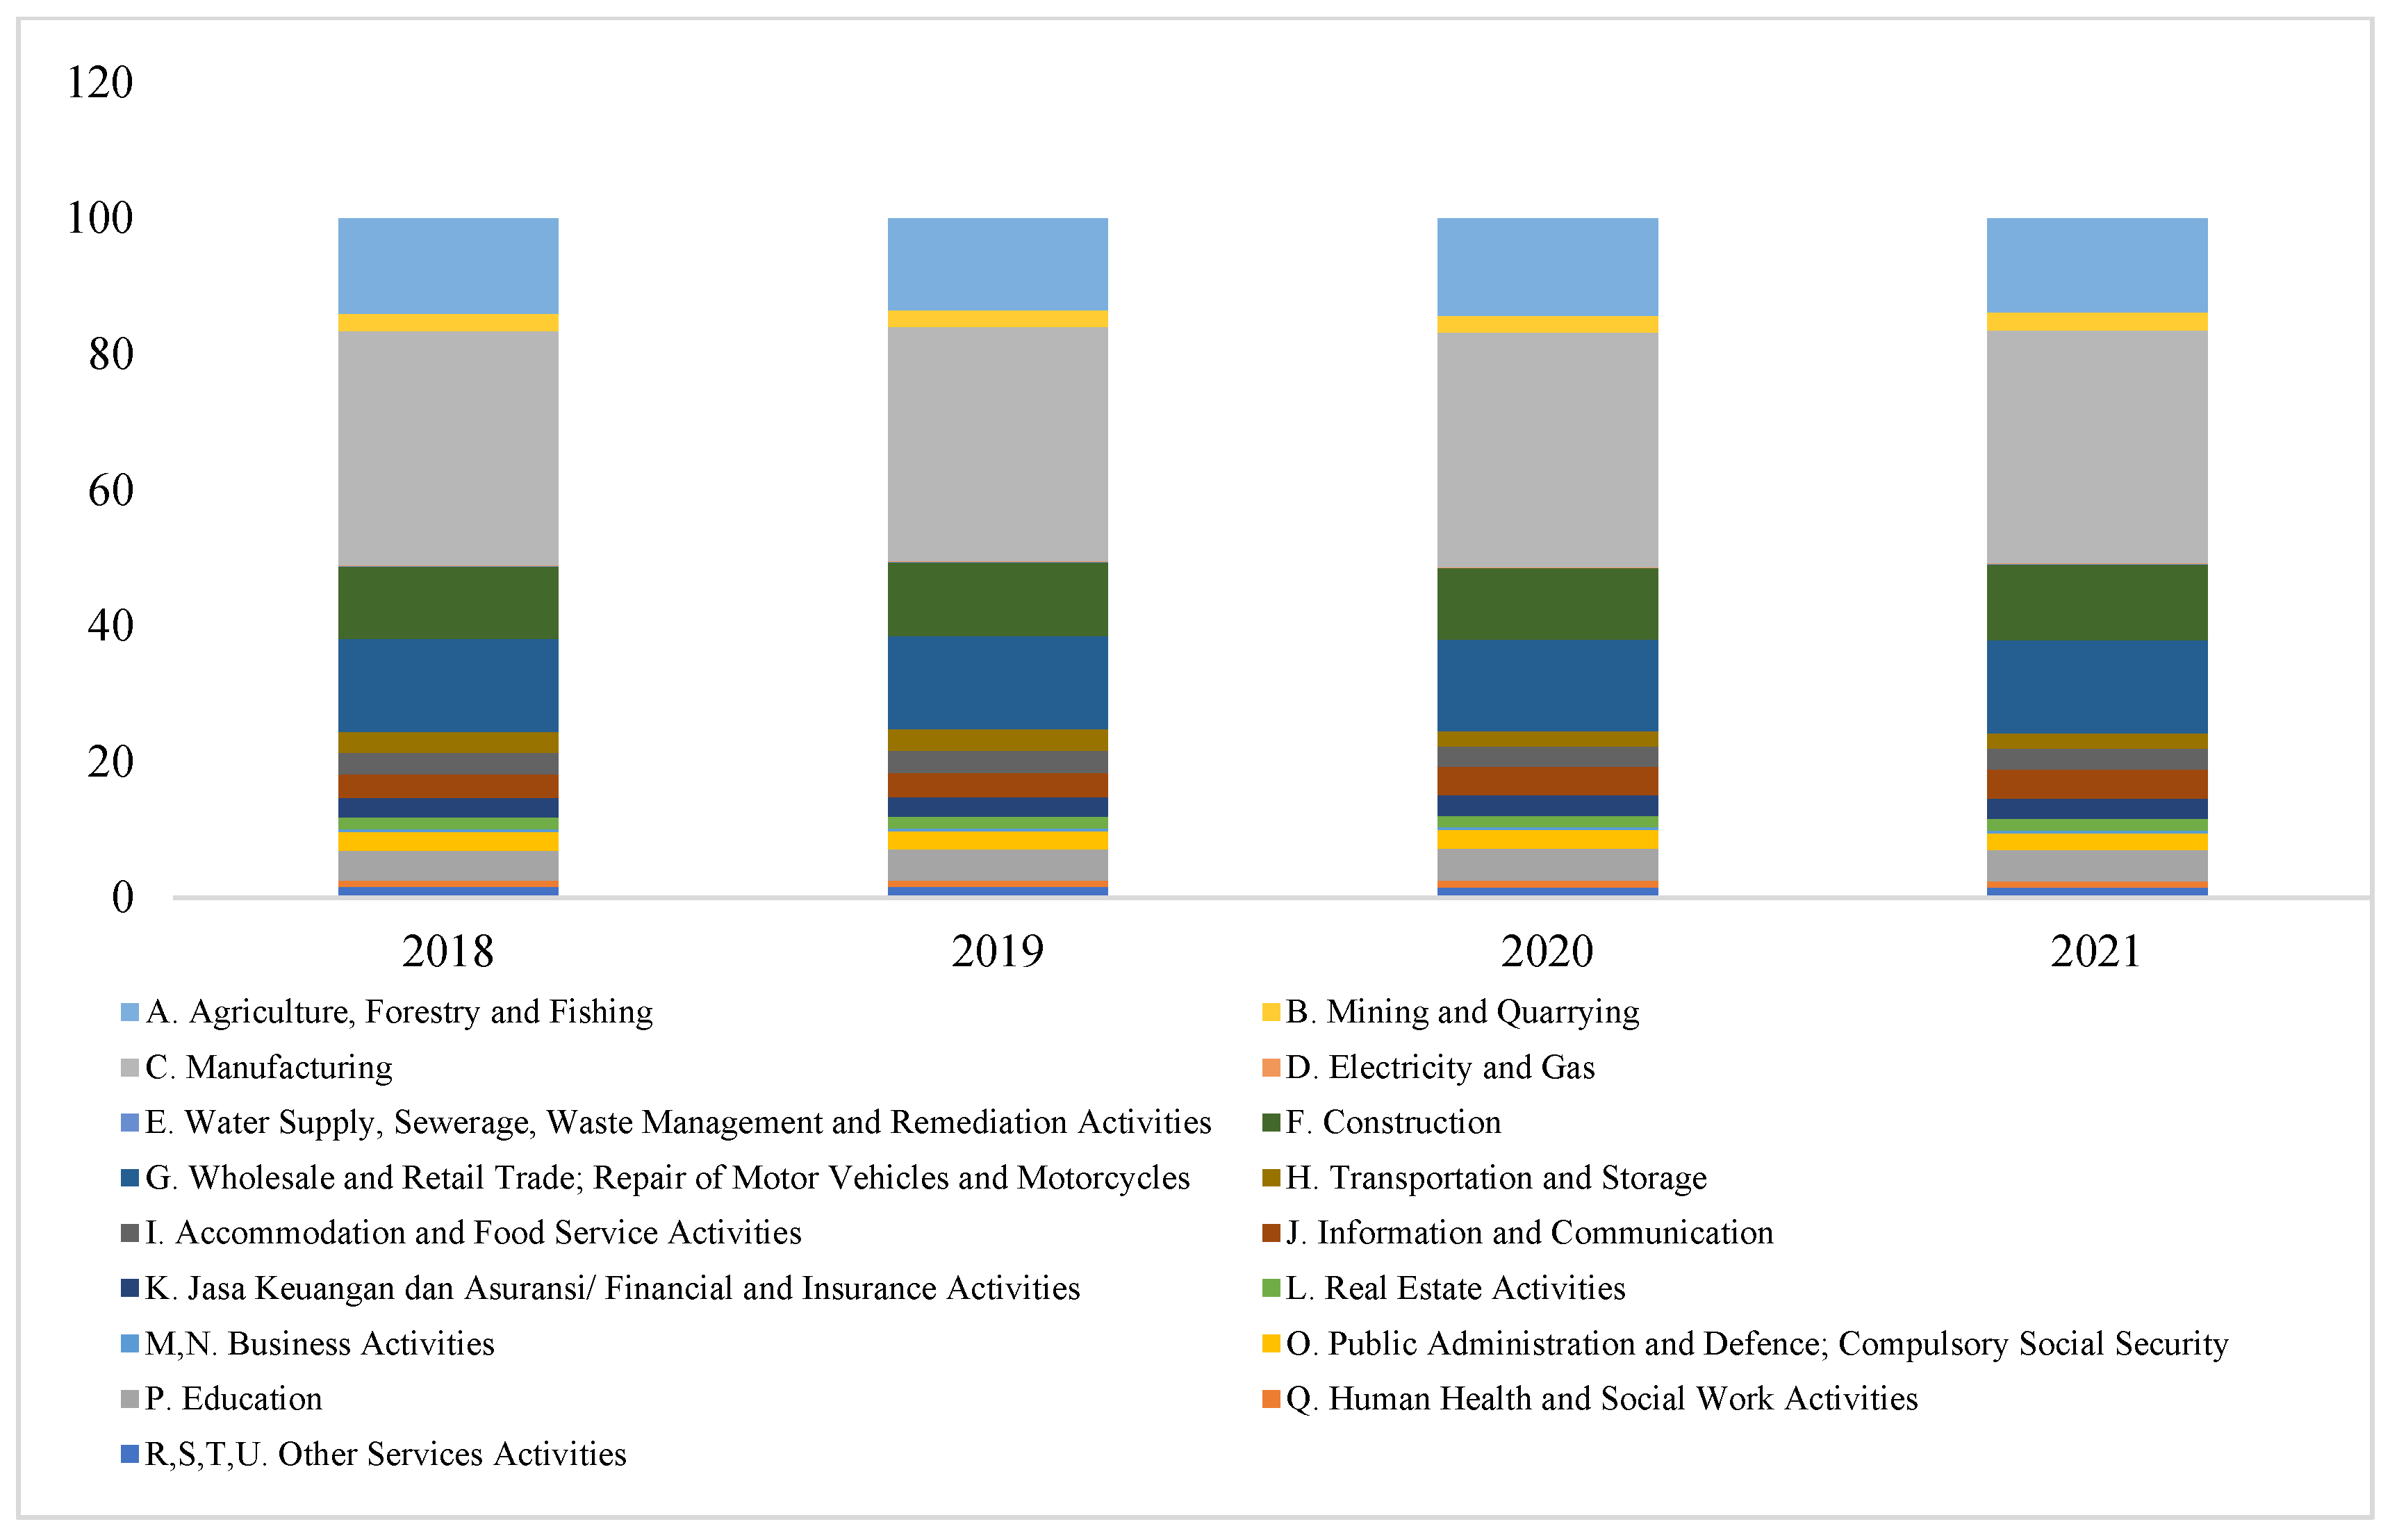
Figure 2). The information and communications industry and the human health and social work activities industry grew positively by 15.65 and 8.19 percent, respectively, in 2020. However, the relative distribution of industrial sector activity did not shift throughout 2018–2021 (
Figure 3).
Sonobe et al. (
2021) found that micro, small, and medium enterprises (MSMEs) and their workers were more vulnerable to negative shocks to supply chains, labor supply, and final demand for the goods and services they produced during the outbreak of the COVID-19 pandemic (
Wahyuni and Huda 2021;
Deehani 2020). The micro and small industry survey in 2020 recorded that the number of micro and small industries in Indonesia reached 4.21 million businesses, and Central Java was the province with the highest number of MSMEs in Indonesia, with 898,162 businesses (
Statistics Indonesia 2022b).
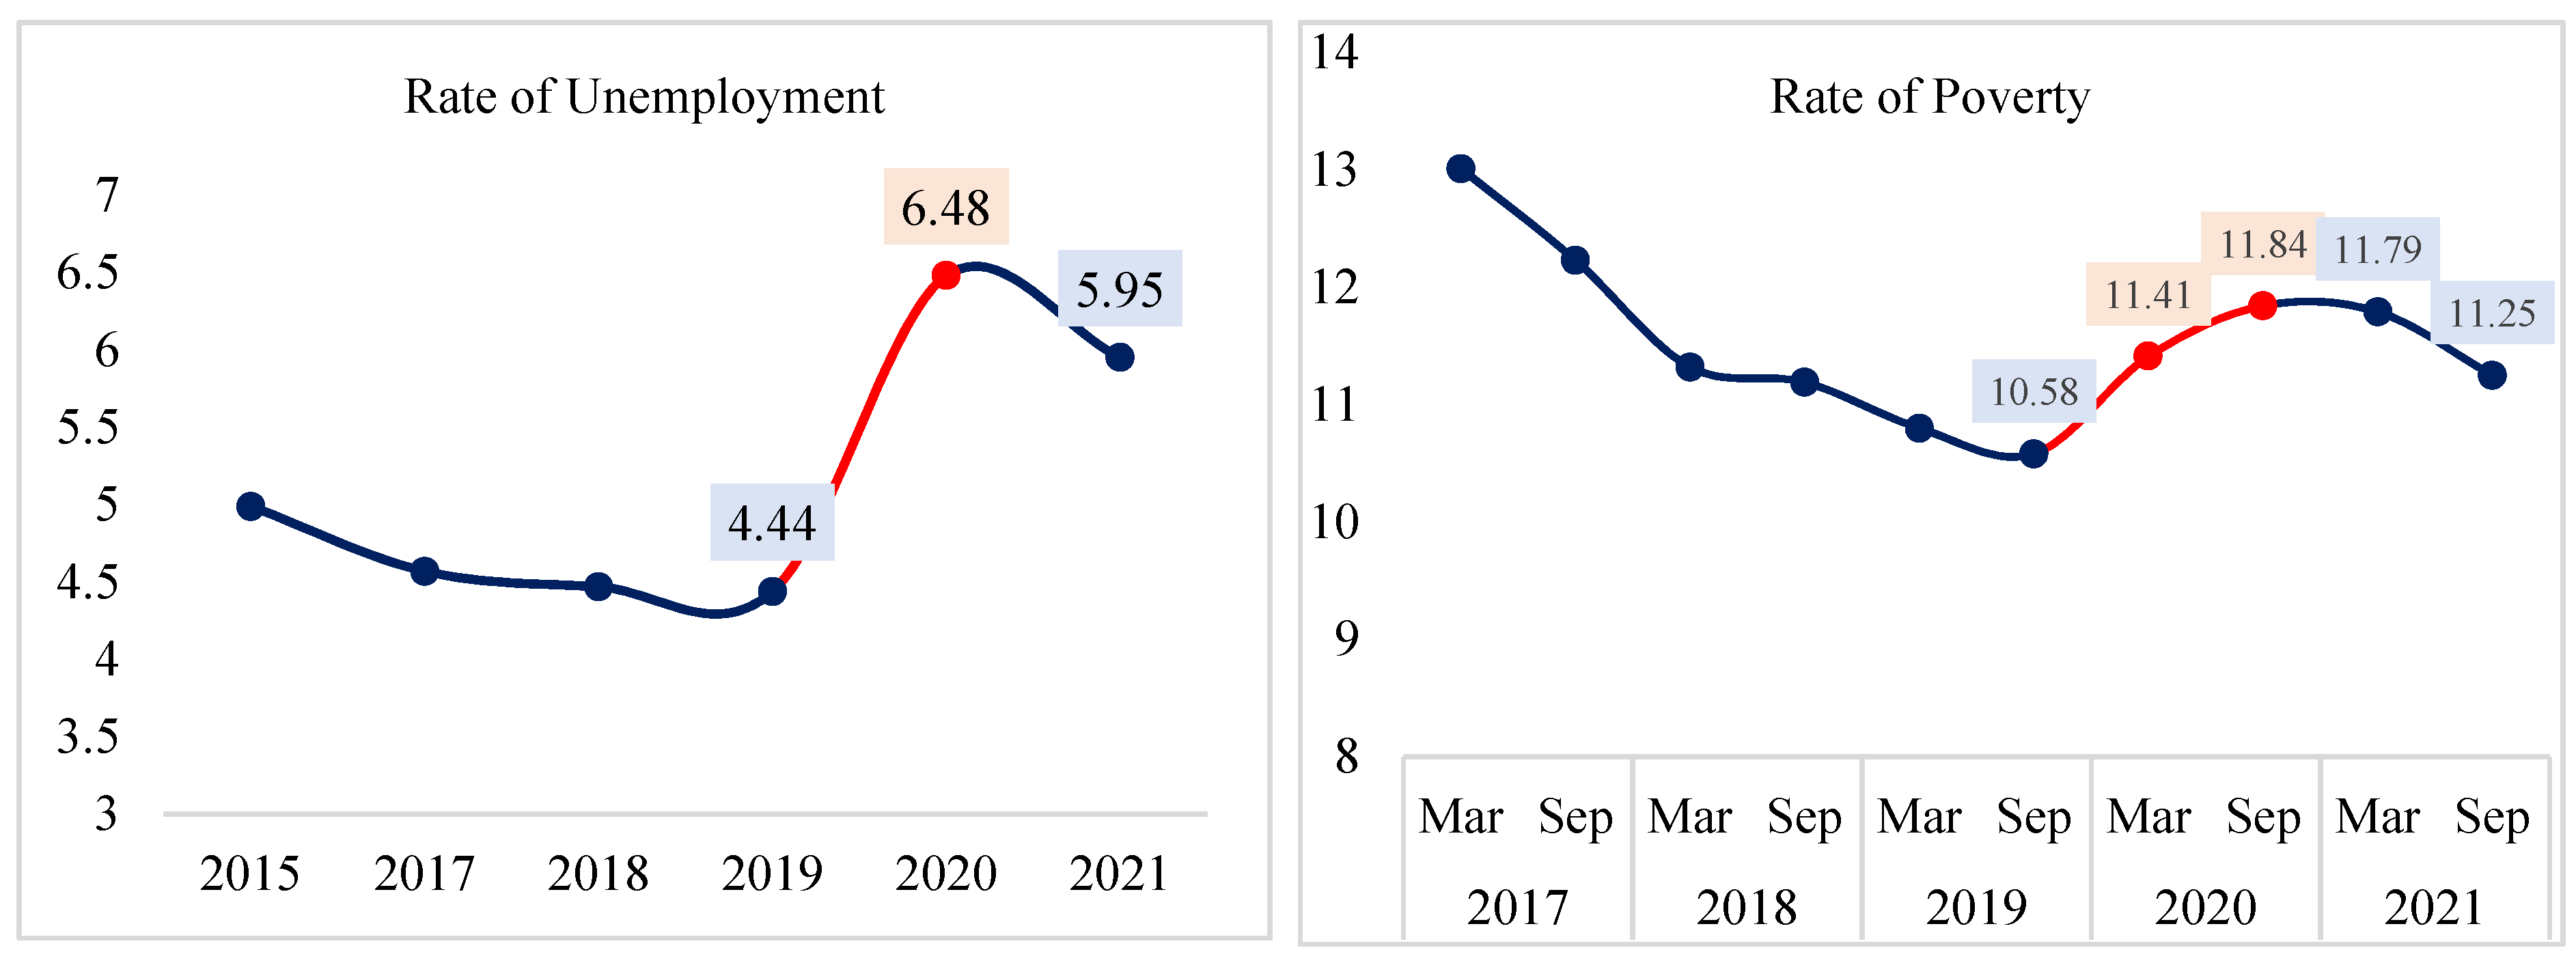
The economy is measured by the value of Gross Regional Domestic Product (GRDP) which grew negatively in 2020, followed by a decline in the quality of people’s welfare. Unemployment rate (percentage of unemployment in the labor force) and poverty rate (percentage of poverty in the population) increased in 2020 compared to 2019, although it fell in 2021, but not to the level of 2019 (
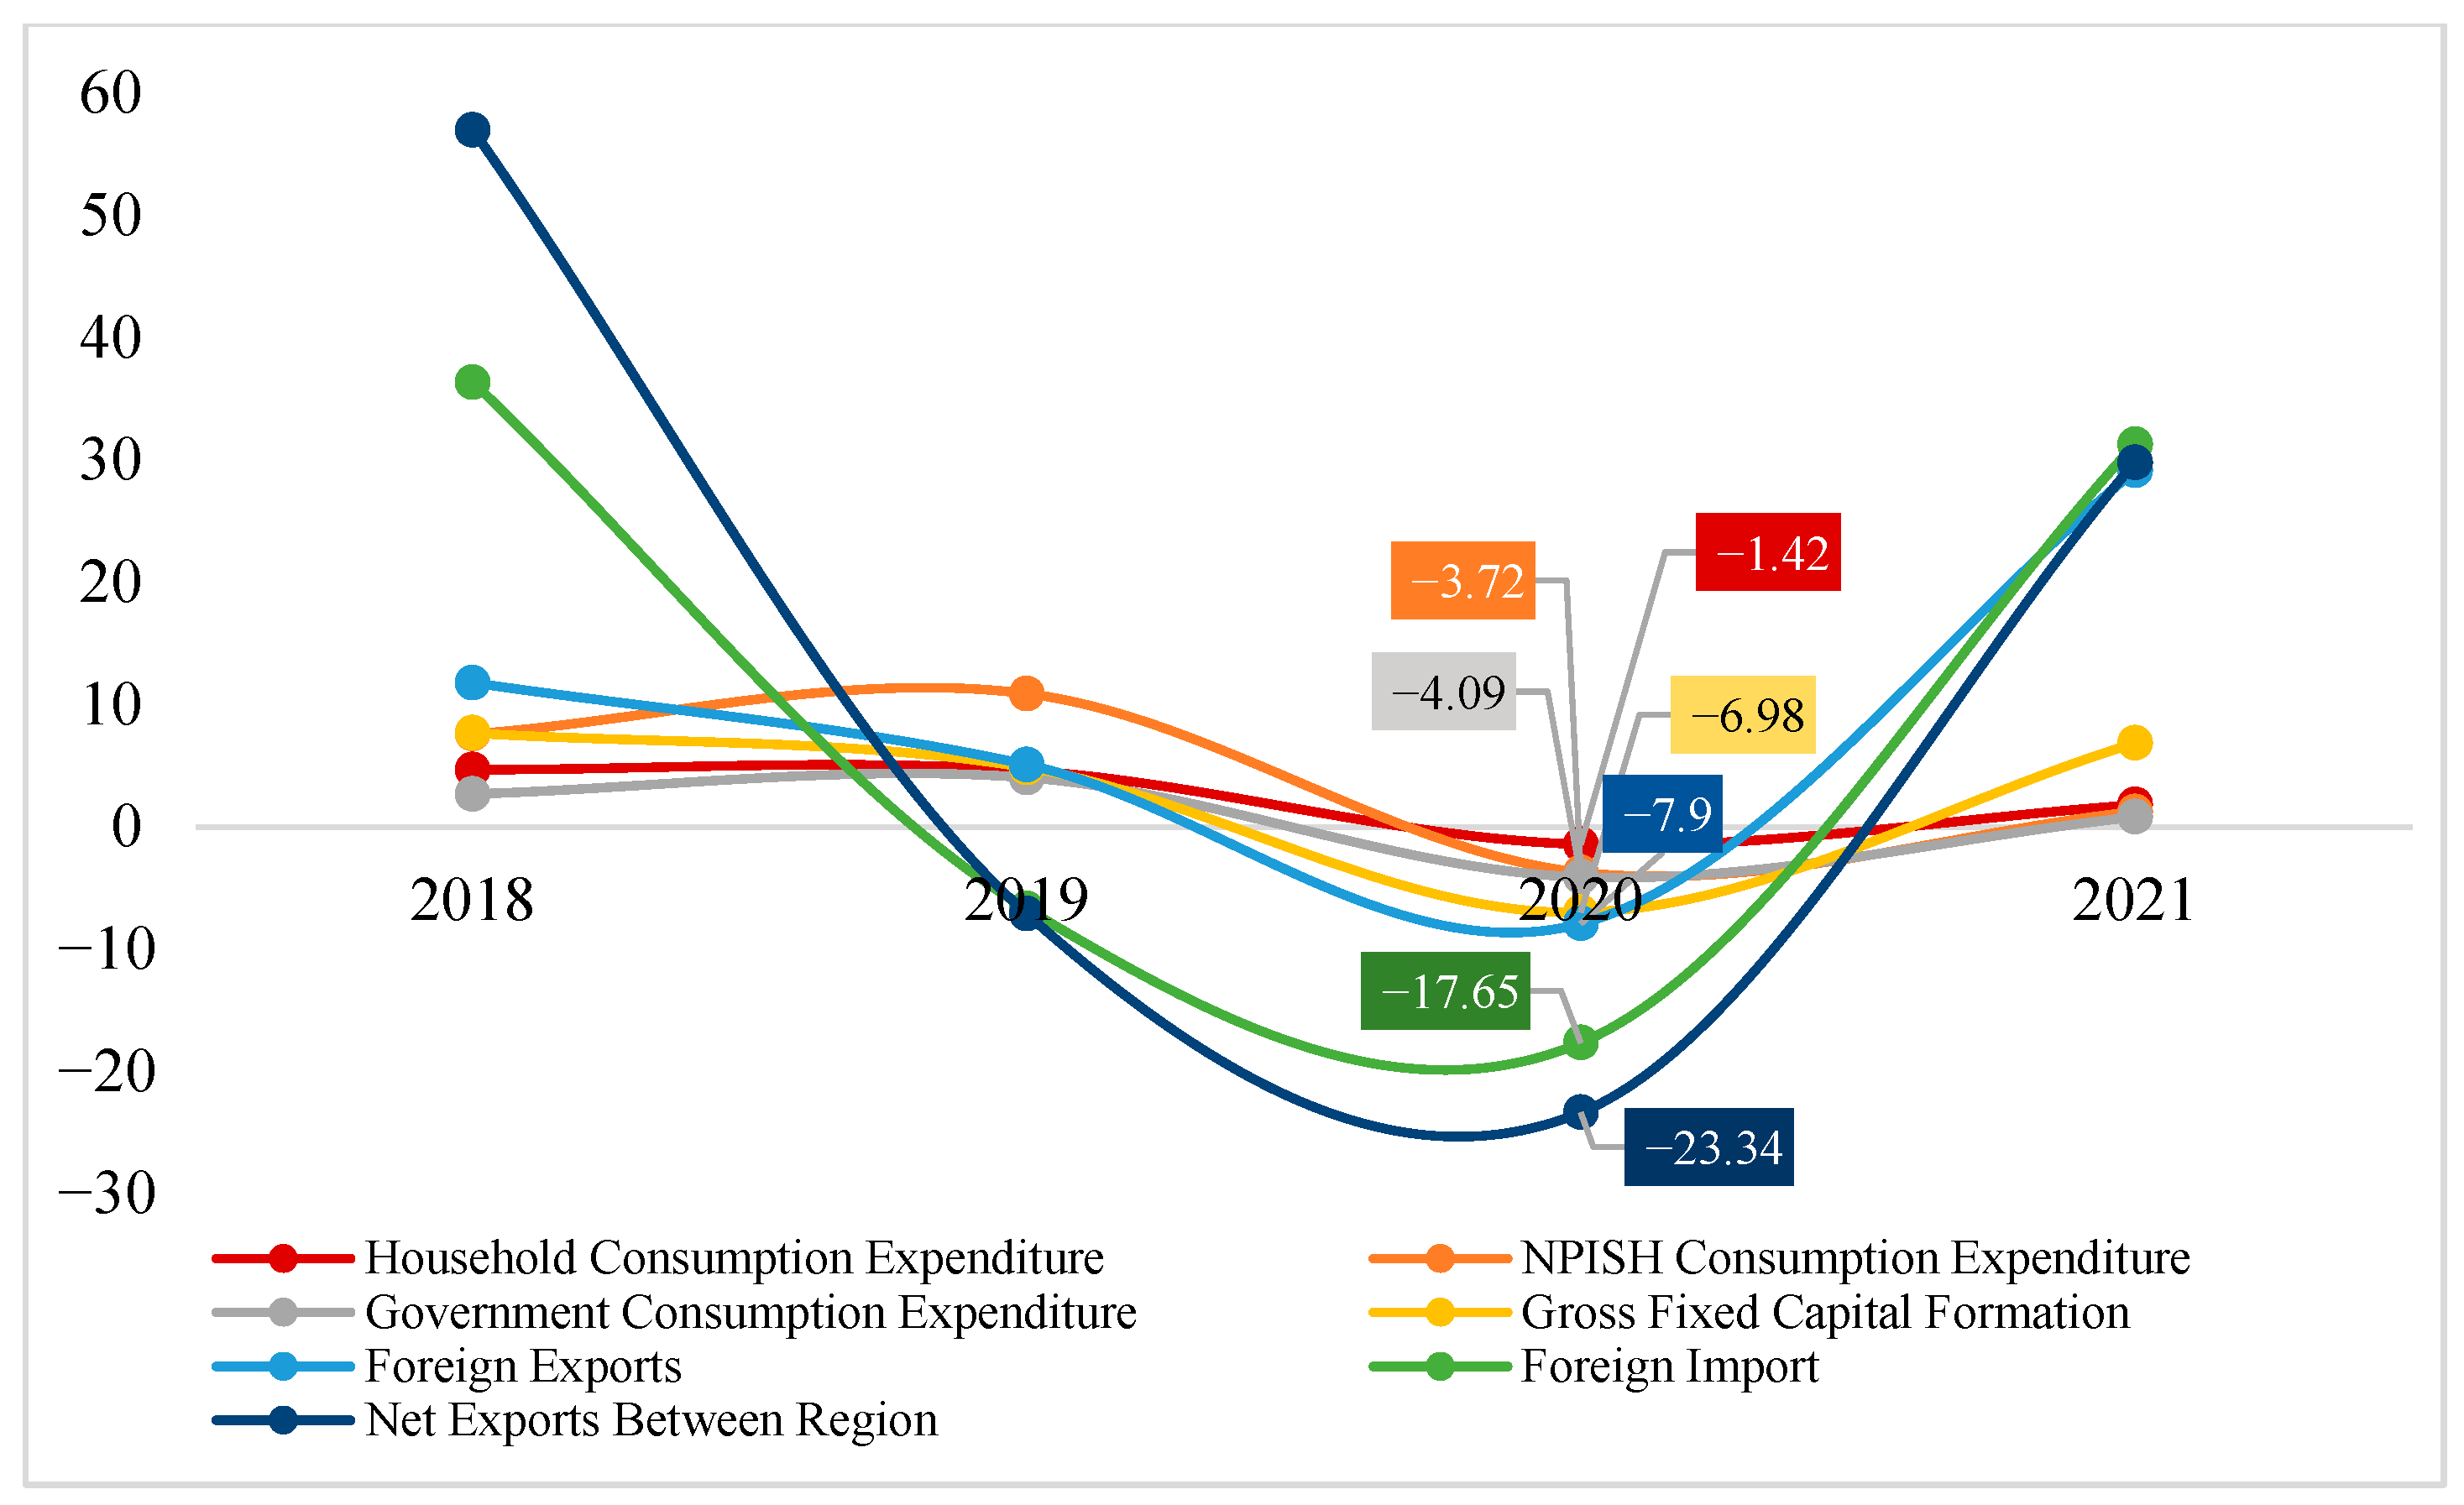
Figure 4). On the demand side, aggregate consumption levels fell in 2020, as did investment and exports (
Figure 5). Economic growth increased in 2021, restrained by the increase in the number of COVID-19 transmissions with the Delta virus variant in mid-2021, but did not return to the 2019 level. In early 2022, the positive COVID-19 numbers again increased with the spread of a new variant, namely Omicron, which was expected to add to the pressure on the economy.
This study analyzes the impact of COVID-19 on the economy from the perspective of industrial production in Central Java, namely the affected industry and the leading industry (with a high linkage and multiplier effect on the economy) and compiles the most effective policy alternatives for restoring the economy after the pandemic. Exploration in the selected industry was carried out by direct observation in the field, to reveal the effects of the pandemic on business actors and the effects of policies on the community.
This study used input–output analysis with a single regional table, including 52 industries in Central Java in 2016 (the list of industries can be seen in
Appendix A), to identify and estimate the impact of the crisis due to the COVID-19 pandemic, and make suggestions for recovery, based on an industrial approach. The simulation was carried out by calculating a shock to the final demand for the industries most affected by COVID-19, the leading industries (having the best backward and forward linkages) and the industries with the best multipliers, and formulating from these results alternative policies effective for enabling recovery of the post-pandemic economy. Central Java as a province experienced one of the largest economic sector impacts caused by theCOVID-19 pandemic in Indonesia, and has the largest number of micro and small industries, so that this study can be a benchmark for the economic recovery of other provinces in Indonesia after the COVID-19 pandemic.
2. Literature Review
According to the business-cycle approach, economic crises occur due to turmoil or shocks. A shock in the business cycle can be a shift in consumption stemming from a shift in consumer confidence, or a shift in investment, or a shift in the risk premium. When viewed from the perspective of the business cycle, the COVID-19 pandemic was the cause of turmoil and shocks to the economy (
Sharif et al. 2020;
Notteboom et al. 2021;
Huerta de Soto et al. 2021;
Kocaarslan and Soytas 2021). Each shock has a dynamic effect on output and its components. The effect of a shock on economic activity may increase over time then affect output in the medium term, or it may increase for a period and then decrease and disappear. Some shocks are sufficiently large themselves or come in combinations creating a recession (
Blanchard 2021). The COVID-19 pandemic caused shocks to supply and demand, and effects on output, unemployment, and inflation leading to a sluggish labor market (
Baqaee and Farhi 2021;
Guerrieri et al. 2022).
The input–output model (commonly abbreviated as I-O) was proposed by Wassily Leontief in the 1930s, based on the idea of
Tableu Eqonomique developed by Francis Quesnay in 1758 (
Miller and Blair 2009).
Leontief’s (
1936) publication examining I-O models in the economic systems of the United States was among the practical implementations of his theory. In economics, the input–output model is a quantitative economic technique that represents the interdependence between different branches of the national economy or regional economy (
Ten Raa 2009). Input–output analysis has also been considered as an applied equilibrium analysis tool (
Ten Raa 2017). The analysis in the I-O model is based on an economic situation, and was an alternative for the Walrasian theory of competitive equilibrium (
Rose 1995;
Yang 2018;
Folloni and Miglierina 1994). In its development, the method derived based on I-O analysis has increasingly been applied as a quantitative economic planning and analysis tool (
Jensen et al. 2017;
Shafer 2012). I-O analysis is based on a table in the form of a matrix which provides information about transactions of goods and services, usually reflected in a specific monetary unit, and the interrelationships between units of economic sectors in a national or regional context at a certain time period (
Firmansyah 2006;
Ottaviano and Thisse 2004), which results in a model called Table I-O. This analysis is suitable for economic planning because of its ability to analyze roles in the economy sector by sector to a very detailed level, making the applications of input–output models wide-ranging in many economic sectors (
Hewings and Sonis 2009). The equilibrium in I-O analysis is based on the flow of transactions between economic agents (
Igos et al. 2015;
Boero et al. 2018;
Hewings 1985;
Dietzenbacher et al. 2013;
Timmer et al. 2015). The main emphasis in the I-O model is on the production side and demand drive (
Miernyk 1965;
van Leeuwen et al. 2005).
Previous research has investigated theoretical and practical advantages of using the I-O model in industrial activities or specific economic sectors, as well as for analyzing interregional economic dependencies (
Casler 2004;
Zhu et al. 2022;
Tukker and Dietzenbacher 2013;
Zamani et al. 2018;
Huang and Kockelman 2020;
Yamano 2016;
Mi et al. 2018). Aside from its advantages in calculating input and output in a national economy, it is also useful for regional contexts (
van Leeuwen et al. 2005;
Jensen et al. 2017;
Shafer 2012;
Budzinski et al. 2023). The I-O model can be used, among other purposes, for estimating the impact of final demand, including consumption, government spending, corporate investment, and exports and their effects on output, added value, imports, demand, taxes, labor requirements, for projecting macroeconomic variables, observing the composition of supply and the use of goods or services to facilitate analysis of import needs and their substitution, analyzing price changes where changes in input prices affect output prices, and providing economic design and planning in leading sectors and those that are sensitive to economic growth. Finally, the I-O model can be utilized to assess the compatibility of statistical data and their weaknesses, and other for analyses (
Firmansyah 2006). Moreover,
van Leeuwen et al. (
2005) stated that internal consistency was the main advantage in input–output models.
Previous research on the economic impact in China arising from the COVID-19 pandemic showed that increases in COVID-19 infections could result in substantial decline in output, consumption, and employment during the pandemic (
Chan 2022). Moreover, in the long term, immediately after the pandemic ends, output, employment, and investment continue to decline (
Chan 2022). Empirical research in South Africa also found consistent results indicating that COVID-19 and the lockdown policy had an impact on the stagnation of poverty and hunger, due to an increase in unemployment and worsening conditions for the poor. Particularly, the conditions are even worse for informal workers who experience unemployment without social security protection (
Simon and Khambule 2021). The COVID-19 pandemic has also led to a decline in industrial production, loss of service-provision jobs, a sustained and drastic reduction in production in the air-transport industry, and 5 months of macroeconomic uncertainty (
Ludvigson et al. 2020). The decline in production occurred in almost all economic industries. The economic linkage between industries meant that shocks in one economic industry that occurred due to the COVID-19 pandemic had an impact on other industries.
The input–output model has been used to analyze the impact of the pandemic in several countries, especially to inspect priority industries, as in the study by
Temel and Phumpiu (
2021). Their research found that there has been a profound downward impact on employment performance and economic growth, particularly with contraction in the real estate and wholesale trade industries in eight countries, namely China, Japan, India, Russia, Germany, Turkey, UK, and USA. This research recommends the design of employment policies and growth strategies to recover from the pandemic effects. Input–output analysis has also been utilized as a knowledge resource for governments in Brazil (
Haddad et al. 2020a), Colombia (
Bonet et al. 2020), Angola (
AfDB 2021) and Morocco (
Haddad et al. 2020b), generally for analyzing the potential regional and sectoral economic costs arising due to restrictions on mobility during the pandemic. In these studies, simulations were carried out using several different policy-restriction scenarios.
Haddad et al. (
2020a) analyzed the economic losses due to the COVID-19 pandemic in the Brazilian state of Sao Paolo. They reported that economic losses were more concentrated in regions that contributed most to the country’s GRDP, which were also densely populated areas, and the sectors most affected were labor-intensive and fluid.
Haddad et al. (
2020b) found that the impact of the COVID-19 pandemic on each region in Morocco is highly dependent on the region’s economic structure, with regions that have a larger proportion of informal workforce and a lower share of government activity in their GRDP tending to be more affected and initially facing a deeper economic recession, with a greater share of jobs at risk. In Colombia,
Bonet et al. (
2020) found that monthly economic losses ranged between 0.5% and 6.1% of national GDP, with the most affected industries being accommodation and food services, real estate, administrative services, construction, and trade. Furthermore, they recommended that policy makers when considering industrial vulnerability should look not only at economic activities that are directly affected by isolation measures implemented in a region, but also consider economic activities that experience indirect impact due to their economic linkages with industry.
3. A Brief Overview: Indonesia’s Macroeconomic Policy and the Economic Development of Central Java during COVID-19
In Indonesia, the policy of implementing physical distancing in the early days of the pandemic had an impact on company activities in production. Although 58.95 percent of companies continue to produce as usual, 8.76 percent of companies stopped producing (
Statistics Indonesia 2020). Business actors from the manufacturing industry reduced work during the pandemic by 18.69 percent.
The Indonesian government implemented several policies at the beginning of the COVID-19 pandemic in order to reduce its impact (
Maftuchan 2020), including increasing the number of families receiving benefits from the Family Hope Program (
Program Keluarga Harapan/PKH)) by about 800,000 families, as well as increasing benefits by 25 percent. The program budget reached IDR 37.4 trillion. In addition, the government increased the number of recipients of non-cash food aid or basic food cards to 20 million recipients. The government budget for pre-employment cards (
Kartu Prakerja) reached 20 trillion rupiahs with a total of 5.6 million recipients, and free 450 VA electricity was provided to 24 million customers for 3 months (April–June 2020), with reduced costs of 50 percent for 900 VA supply available to as many as 7 million customers. The government reserved a budget of IDR 25 trillion in anticipation of the availability of basic necessities, and provided credit relief of around IDR 10 billion, especially for informal workers.
Indonesia’s economic growth in general contracted during the pandemic. The worst contractions were experienced by Bali and Nusa Tenggara, by −5.01 percent. Meanwhile, Java, Sumatera, Kalimantan experienced contractions of −2.51 percent, −1.19 percent, and −2.27 percent, respectively (
Widiastuti and Silfiana 2021).
Sayuti and Hidayati (
2020) found that the income received by the community in West Nusa Tenggara has decreased since the COVID-19 pandemic. Purchases made online were the preferred choice of respondents. The conclusion of the study showed that the pandemic has had a significant effect on people’s lives, including those with civil servant or non-civil servant backgrounds and those who live in rural or urban areas.
The industrial GRDP of Central Java decreased in 2020, from 5.36 percent in 2019 to −2.65 percent in 2020 (
Appendix A). The highest decline occurred in the railway and air-transport industries. Railway transport grew by 9.16 percent in 2019, down to −47.01 percent in 2020. Meanwhile, the air-transport industry grew by 2.4 percent in 2019, down to −49.1 percent in 2020. On the other hand, there were several sectors that experienced positive growth during the pandemic, namely the forestry and logging industry and the information and communications industry. Forestry and logging decreased by −2.39 percent in 2019, then grew by 2.07 percent in 2020, while the information and communications industry underwent growth of 11.62 percent in 2019 which increased to 15.65 percent in 2020.
4. Method
This study used the input–output (I-O) model developed by Wassily Leontif. Leontif’s input–output model is related to the activities of a group of industries that produce goods (output) and consume goods from other industries (input) in the process of producing the output of each industry (
Miller and Blair 2009). Thereby, this model can capture the wide effects of a change in one sector on other sectors, through the direct and indirect linkages between sectors.
This model has the advantage of measuring the impact of the pandemic on the economy as well as identifying the distribution of impacts by industry, so that the impact pathways can be traced through the connections between these industries, both directly and indirectly. Previous studies have used this tool, such as the research by
Temel and Phumpiu (
2021),
Haddad et al. (
2020a),
Bonet et al. (
2020),
Haddad et al. (
2020b), and
AfDB (
2021).
The application of the I-O model in this study may differ in several respects from research in other countries, due to the peculiarities of the I-O tables constructed for each context. Differences can occur in the use of total tables (including import transactions in intermediate transactions) or domestic tables, industry classification, open tables (not including households as production sectors) or closed tables, as well as in the economic year of the I-O table used. However, the general structure and matrix components of the I-O table are the same for all countries.
4.1. Input-Output Table of Central Java Province Framework
As mentioned previously, the analysis in this study employed the 2016 input–output table for Central Java, consisting of 52 industries (the table framework is shown in
Table 1). The table is a domestic table, that is, inter-industrial transactions do not involve imported goods either from abroad or outside the Central Java region. This can show the strength of industry in Central Java, as well as reflecting a limitation of the research data and methods, namely the exclusion of goods and services from outside Central Java.
The rows in
Table 1 can be interpreted as industry 1 produces a total output of X
1, where x
11 of X
1 is used as industry 1’s own input, x
12 is used as industry 2’s input, x
13 is used as industry 3’s input, and so on. Y
1 is the output of industry 1, which is used for final demand in the form of household consumption, government consumption, investment, and exports.
The interpretation of the columns in
Table 1 is that to produce output X
1 requires input of x
11 from industry 1, x
21 from industry 2, x
31 from industry 3, and so on. V
1 is industry 1’s added value, which consists of wages and salaries, business surplus, depreciation, and net indirect taxes.
4.2. Input–Output Formulation
The matrix in the I-O table is in the form shown as (
Firmansyah 2006):
and I is an identity matrix of order n × n. The matrix (I-A) has (1-a
11), (1-a
12), …, (1-a
nn) on its main diagonal, and the elements of matrix I which are 0 in (I-A) have the element –a
ij when written into matrix notation, as follows:
where I is an identity matrix of size n × n while A, X and Y are technology coefficient matrices of order n × n, the output column vector is n × 1, and the final demand column vector is n × 1.
If there is a change in final demand in the economy, there will be a change in national output, written:
The matrix (I − A)−1 is known as the Leontief Inverse Matrix. It is clear from the formula that the level of output depends on the value of the final demand. How to calculate and interpret each element of this matrix will be discussed in a separate section.
Due to the linear form of the equation, Equation (2) can also be written as:
where ΔY is the vector of changes in final demand and ΔX is the vector of changes in output.
The output multiplier of industry j is the total value of the output produced by the economy to meet (or result in) a change in one unit of money in the final demand for the industry. The output multiplier is the number of columns of elements of the Leontief Inverse Matrix. The notation for the formula is as follows:
where
Oj is the output multiplier of industry
j and
αij is the Leontief Inverse Matrix element, (I − A)
−1.
The multiplier of household income in an industry shows the change in the amount of income received by households created by the addition of one unit of final demand money in an industry.
The relationship between the total output of each industry and the renumeration for labor is shown by the (
n + 1) row of the input–output matrix, which is the wage and salary coefficient whose magnitude is the ratio between the value of wages and salaries and the total value of the input, HR. Therefore, the effect of final demand on household income is measured by the output multiplier and the household income coefficient, which is called the household income multiplier, Hj. The household income multiplier is a theoretical economic statistic that analyzes the effect of several variables of regional or national income on changes in household income over a certain period of time. Operationally, the household income multiplier is a number that describes the ratio between the amount of increase or decrease in the regional industrial income of Central Java and the amount of aggregate increase or decrease that can cause changes to household income. The household income multiplier matrix is:
where HR is the row vector
n + 1, because it is assumed that the transaction matrix and the input coefficient matrix have the order n × n.
where
xn+1,j in the formula is the same as row v (primary input).
For each industry, the household-income multiplier is:
The I-O multiplier used in this study was only the type 1 multiplier, which does not include household transactions, namely consumption spending and labor spending (
Miller and Blair 2009). The use of a type 1 multiplier limits the impact measurement in the analysis to focus only on the production industries. The impact variable measured in this I-O study is an endogenous variable, which is determined or generated in the formulation of the multiplier model. These variables were output, income, and employment opportunities.
4.3. Shock Development
To determine the impact of the economic crises due to the COVID-19 pandemic on each industry, a shock scenario from the demand side was developed, on the basis that restrictions on the movement of people caused pressure on the final demand for all industries. The industries most severely affected by the COVID-19 pandemic were identified from the development of sectoral Central Java GRDP at nominal prices. These industries were considered to be priority industries in need of recovery from the crisis.
To assist the affected industries as a policy objective, two more industry groups were developed to simulate the impact of improving final demand, so that there were three types of scenarios based on industry groups. These simulation scenarios were called Scenarios C1, C2, and C3. Scenario C1 was developed to simulate an injection of final demand to industries affected by COVID-19 (a total of 24 industries affected are listed in note (a) in
Table A1). To run a simulation in this industry, an industrial conversion was carried out from the GRDP to the input–output model. Scenario C2 was developed to simulate injection of final demand in leading industries, which were determined by backward and forward linkage analysis in the Central Java input–output table (seven industries in total, presented in note (b) in
Table A1). Scenario C3 simulated injection of final demand in industries with the highest output multiplier (a total of 26 industries, based on the highest output multiplier, can be seen in note (c) in
Table A1).
The magnitude of the shock in Scenarios C1, C2, and C3 was applied to two groups of differing shock magnitudes, namely Shock A, representing an increase in final demand by 1%, 2% and 5%; and Shock B, with a shock magnitude in final demand of IDR 1 trillion rupiah distributed equally to each industry in each industry group (
Table 2).
The shock was applied to the final demand in the selected industries. The components of final demand are household consumption, government spending, gross private investment, and exports, so that if these components experience an increase, then these increases will be aggregated as an increase in final demand. The application of shocks to final demand has limitations, such as aggregating interest changes in each component, for example increasing exports and raising investor interest in selected industries.
5. Results and Analysis
5.1. The Output Multiplier and Income Multiplier
The output multiplier of an industry is the total value of the output produced by the economy to meet (or result in) a change in one unit of money in the final demand for the industry. The output multiplier for the production industries in Central Java as a whole is shown in
Table 3. The five industries with the largest output multipliers were the electricity industry; manufacture of food and beverages; manufacture of rubber, rubber products, and plastics products; food and beverage service activities; and manufacture of paper, paper products, printing and reproduction of record media.
Furthermore, the income multiplier showed how much change in output occurs, because changes in the final demand of industry have an impact on the level of total income (either directly and indirectly).
Table 3 shows industrial income multiplier figures based on the I-O table for Central Java 2016. The education industry has the largest industrial income multiplier, followed by railway transport, public administration and defense, and compulsory social security. The magnitude of this income multiplier means that an increase in final demand in the industry with a value of IDR 1 million will produce the largest total (direct and indirect) impact on increasing wages and salary income in the economy.
In analyzing leading industries, the determination using Table I-O considers the closeness of the relationship or linkage between the production industry, i.e., forward linkage and backward linkage. By utilizing the two related concepts, the method can be used further to analyze the leading industry within a region. The leading industry referred to in this concept is that with the largest multiplier for the domestic economy of a region.
Based on
Table 3, there were seven industries with high forward linkage and backward linkage index values (including in Group 1). These industries were the manufacture of chemicals, pharmaceuticals, and botanical products, manufacture of food and beverages, electricity, land transport, construction, manufacture of wood, wood or cork products, and articles of straw and plaiting materials, and the manufacture of paper, paper products, printing, and reproduction of record media.
5.2. C1 Scenario Simulation Results
The shock of the C1 Scenario was an increase in final demand in industries affected by the COVID-19 pandemic. It was divided into two scenarios, namely C1A and C1B. The result of the C1A scenario simulation on Central Javanese output and income can be seen in
Table 4. Based on
Table 4, a 1 % increase in final demand for industries affected by the COVID-19 pandemic will increase Central Java’s total output by IDR 10.68 trillion; a 2% increase in final demand for industries affected by the COVID-19 pandemic will increase Central Java’s total output by IDR 21.36 trillion; and a 5% increase in final demand for industries affected by the COVID-19 pandemic will increase Central Java’s total output by IDR 53.4 trillion. The industries that experienced the largest increase in output were manufacturing of tobacco products, manufacture of coal and refined petroleum products, manufacture of textiles and clothing, education, public administration and defense, and compulsory social security.
Table 4 shows that a 1% increase in final demand for industries affected by the COVID-19 pandemic will increase Central Java’s total revenue by IDR 2.24 trillion, a 2% increase in final demand for industries affected by the COVID-19 pandemic will increase Central Java’s total income by IDR 4.5 trillion, and a 5% increase in final demand for industries affected by the COVID-19 pandemic will increase Central Java’s total revenue by IDR 11.21 trillion. The industries that experienced the largest increase in income were education, public administration and defense, compulsory social security, manufacture of tobacco products, wholesale and retail trade, repair of motor vehicles, and other service activities.
Table 5 shows the results of the simulation of the C1B scenario on the output of Central Java.
Table 5 represents a total increase in demand for all industries affected by the COVID-19 pandemic by IDR 1 trillion, which will cause an increase in Central Java’s total output of IDR 1.448 trillion. wherein this scenario, the industries experiencing the largest increase in output are the manufacture of coal and refined petroleum products, land transport, wholesale and retail trade, repair of motor vehicles, manufacture of textiles and clothing, and the manufacture of wood, wood or cork products, articles of straw, and plaiting materials. Based on
Table 5, an increase in the total demand for all industries affected by the COVID-19 pandemic by IDR 1 trillion will cause an increase of IDR 0.305 trillion in Central Java’s total income. The industries that experienced the highest increase in income were the education industry, railway transport, public administration and defense, compulsory social security, wholesale and retail trade, repair of motor vehicles, and plantation crops.
5.3. C2 Scenario Simulation Results
Scenario C2 involves an increase in final demand in the leading industry in Central Java. The C2 scenario shock is divided into two, namely the C2A and C2B scenarios. The results of the C2A scenario simulation for Central Java’s output and income can be seen in
Table 6. Based on
Table 6, a 1% increase in the final demand for leading industries will increase Central Java’s total output by IDR 12.34 trillion; a 2% increase in final demand leading industries will increase Central Java’s total output by IDR 24.68 trillion; and a 5% increase in final demand for leading industries will increase Central Java’s total output by IDR 61.71 trillion. The industries that experienced the largest increases in output were the construction industry, manufacture of food and beverages, land transport, wholesale and retail trade except motor vehicles, and electricity.
Table 6 also shows that a 1% increase in final demand for the leading industries will increase Central Java’s total income by IDR 1.94 trillion; a 2% increase in final demand for the leading industries will increase Central Java’s total income by IDR 3.88 trillion; and a 5% increase in final demand for the leading industries will increase Central Java’s total income by IDR 9.7 trillion. The industries that experienced the largest increase in income were the construction industry, manufacture of food and beverages; wholesale and retail trade except motor vehicles, food crops, and land transport.
Table 7 shows the results of the simulation of the C2B scenario for the output of Central Java. The findings showed that an increase in the total of all leading industries by IDR 1 trillion will lead to an increase in the total output of Central Java by IDR 1.725 trillion, among which the industries with the largest increases in output are the electricity industry, the manufacture of chemicals, pharmaceuticals and botanical products, manufacture of wood, wood and cork products, articles of straw and plaiting materials, manufacture of food and beverages, and manufacture of paper, paper products, printing, and the reproduction of record media.
The findings as shown in
Table 7 demonstrate that an increase of IDR 1 trillion in the total final demand for leading industries will lead to an increase in Central Java’s total income of IDR 0.232 trillion. In this model, the industries that experienced the largest increase in income were the construction industry, wholesale and retail trade except motor vehicles and motorcycles, manufacture of paper, paper products, printing, and reproduction of record media; manufacture of wood, wood and cork products, articles of straw and plaiting materials, and land transport.
5.4. C3 Scenario Simulation Results
The C3 scenario involved an increase in final demand in the industries in Central Java with the highest output multipliers. The C3 scenario shock was divided into two, namely, the C3A and C3B scenarios. The results of the C3A scenario simulation for Central Java’s output and income can be seen in
Table 8. Based on the
Table 8, a 1% increase in final demand for the industries with the highest output multipliers will increase Central Java’s total output by IDR 19.69 trillion; an increase of 2% in the final demand for the industries with the highest output multipliers will increase the total output of Central Java by IDR 39.37 trillion; and a 5% increase in the final demand of the industries with the highest output multipliers will increase the total output of Central Java by IDR 98.43 trillion. The industries that experienced the largest increases in output in this model were the construction industry, manufacture of food and beverages, food and beverage service activities, manufacture of textiles and clothing, and wholesale and retail trade except motor vehicles and motorcycles.
The results also showed that a 1% increase in final demand for the industries with the highest output multipliers will increase Central Java’s total revenue by IDR 3.41 trillion; a 2% increase in final demand for the industries with the highest output multipliers will increase Central Java’s total income by IDR 6.82 trillion; and a 5% increase in final demand for the industries with the highest output multipliers will increase Central Java’s total income by IDR 17.04 trillion. Under this scenario, the industries that experienced the largest increases in income were construction, manufacture of food products and beverages, wholesale and retail trade except motor vehicles, food and beverage service activities, and livestock.
Table 9 shows the results of the simulation of the C3B scenario for the output of Central Java. The findings as shown in
Table 8 predict that the total increase in all industries with the highest output multipliers will lead to an increase of IDR 1.662 trillion in Central Java’s total output, where the industries experiencing the largest increase in output were the manufacture of food and beverages, manufacture of chemicals, pharmaceuticals and botanical products, electricity, wholesale and retail trade except motor vehicles, and the manufacture of coal and refined petroleum products.
Based on
Table 9, an increase of IDR 1 trillion in the total final demand for the industries with the highest output multipliers will lead to an increase of IDR 0.299 trillion in Central Java’s total income. The industries that experienced the largest increase in income were wholesale and retail trade except for motor vehicles and motorcycles, railway transport, livestock, manufacture of leather, related products, and footwear, and human health and social work activities.
5.5. Comparison of Scenario Simulation Results
Based on the simulation results that were calculated (
Table 10) for scenarios C1, C2, and C3 shock A, the largest total output impact occurred in scenario C3 with every 1%, 2% or 5% increase in final demand. The implication of this scenario is that the largest increase in Central Java’s total output occurs if final demand grows by 1% or 2% or 5% in the industries that have the highest output multipliers (26 selected industries). The smallest total output impact occurred in scenario C1 for every 1%, 2%, or 5% increase in final demand.
The largest total income impact also occurred in the C3 scenario simulation, i.e., the largest increase in total industrial income in Central Java occurs if final demand grows by either 1%, 2% or 5% in industries with the highest output multipliers. The smallest total income impact occurs in scenario C2.
From the simulation results for C1, C2, C3 shock B, it was found that the largest output impact occurred in scenario C2. This means that the largest increase in Central Java’s total output occurs if final demand in leading industries increases by IDR 1 trillion. Meanwhile, the smallest total output impact occurred in scenario C1, and the largest total income impact occurred in scenario C1. This means that Central Java’s total income is projected to be greatest if final demand increases by IDR 1 trillion in industries affected by the COVID-19 pandemic. The smallest total income impact occurred in scenario C2.
6. Conclusions
The COVID-19 pandemic caused a global economic crisis, including Indonesia and Central Java Province. For industry, the impact of the crisis due to this pandemic can be seen from the contraction or slowdown in industrial output growth. This study analyzed the impact of the COVID-19 pandemic on the economy from the perspective of industrial production in Central Java, namely in industries affected by COVID-19, leading industries (with high economic linkages and multipliers) and industries with the highest output multipliers, then formulated the most effective policy alternatives. For recovery of the post-pandemic economy, the input–output model approach was used to estimate how much the impact of the crisis can be overcome, based on an industrial approach.
With the inherent advantages and limitations of I-O table analysis, not all information needed by policy makers for formulating policies was available in the table. With a focus on industrial linkages, an I-O table can provide complete information on leading industries, industries with high employment opportunities, and other aspects of industrial activity, that can be used for basic information as part of the analysis to form the basis for local government policy making.
The analysis in this study contributes as a basis for formulating policies to improve the post-pandemic economy. More specifically, this study recommends policies to improve demand for industries that have the largest output multipliers. In the future, it will be necessary to develop a more complex model that can accommodate shocks on the demand side as well as on the production side, for example improvements in employment.
Policy sensitivity can be estimated by developing several policy scenarios for subjection to input–output analysis. The results can be compared so that various accurate economic policies are obtained. In this study, several policy scenarios were developed for simulation; namely increases in final demand by 1%, 2%, and 5% in industries affected by the pandemic, leading industries, and the industry with the largest output multiplier, and an increase in final demand of IDR 1 trillion divided equally among each group of similar industries (government policy might take the form of policies to increase investment, consumption, government spending, or exports).
The results of the I-O table analysis for Central Java province 2016 and Central Java GRDP revealed that the most severely affected industries by the COVID-19 pandemic were especially the manufacturing of coal and refined petroleum products, land transport, manufacture of tobacco products, manufacture of textiles and clothing, and accommodation. From the analysis of the leading industries, it was apparent that the top five leading industries in Central Java province were the manufacturing of chemicals, pharmaceuticals, and botanical products, the food and beverage industry, electricity, land transport, and construction. These industries have higher forward and backward linkages than the averages of other industries in Central Java province. Analysis showed that the industries with the largest output multipliers were the electricity industry, manufacture of food and beverages, manufacture of rubber, rubber products, and plastics products, food and beverage service activities, and manufacture of paper, paper products, printing, and reproduction of record media. In addition to the worst affected industries by the COVID-19 pandemic, industries with high numbers of linkages and multipliers can be considered policy priorities, because in addition to their favorable production activities (good economic and business potential), they also have a positive impact on driving the economy.
The simulation results indicated that the best output impacts were due to the improvement in final demand in the industries with the largest output multipliers (1%, 2% and 5% increase in final demand in the industries with the largest output multipliers) and improvement in final demand in the leading industries (all leading industries experienced an increase in final demand of IDR one trillion divided equally). This means that these industries are best placed to restore the economy in Central Java by injection of increased final demand. If local government aims to restore the level of the economy (GRDP), then the priority of investment and recovery of consumption or injection of government spending can be given to entrepreneurs in this industry. Different results were obtained for the impact of income. There were two unique results to suggest that increases in final demand of 1%, 2%, or 5% in the industries with the best output multipliers will optimize the increase in the industrial income of Central Java province. In the simulation results, if the final demand increased by IDR 1 trillion and was divided equally among all industries in the selected group, then the biggest income impact was when the final demand was divided equally among the selected industries most affected by the COVID-19 pandemic. The most effective policy priority to increase the industrial income of the Central Java Province is to support an increase in final demand in industries affected by the COVID-19 pandemic.


