Article

Policy Drivers of Inter-Regional Investment in China

1
School of International Economics and Trade, Shanghai Lixin University of Accounting and Finance, Shanghai 201209, China
2
School of Business and Creative Industries, University of the Sunshine Coast, Sippy Downs, QLD 4556, Australia
*
Author to whom correspondence should be addressed.
Economies 2023, 11(5), 150; https://doi.org/10.3390/economies11050150
Submission received: 17 March 2023 / Revised: 11 May 2023 / Accepted: 15 May 2023 / Published: 18 May 2023
(This article belongs to the Section International, Regional, and Transportation Economics)

Abstract

:
We examine how the policies of Chinese regional governments affect the investment location decisions of firms. Using a dataset compiled from the reports on the investment decisions of 498 listed Chinese companies headquartered in the provinces of Guangdong, Jiangsu, Shanghai, and Zhejiang, we estimate discrete choice models of the investment decisions of these firms. The variables of interest relate to government policies, but we also control for both market and firm characteristics. The provision of superior communications infrastructure leads to an increased probability of investment, as does a lower proportion of state-owned enterprises and a lower burden of regional government administrative expenses. We quantify potential changes in the probability of attracting investment by calculating the average marginal effects over a range of values of the variables of interest. Our extraction of primary data on firms directly from their annual reports allows us to address a gap in the literature with respect to the influence of regional government policies on investment decisions during a historical period (2000–2010) when inter-regional investment was particularly important as it saw a move to the decentralisation of decision making to regional government level. Our results provide useful guidance as to how local governments can best attract investment, namely by focusing on improving communications infrastructure, reducing government ownership of the means of production, and reducing administrative burden. Although there is currently a renewed focus on central government control, these findings remain relevant and can contribute to the ongoing debate concerning the optimal balance between centralisation and decentralisation.

1. Introduction

An important factor in the economic development of China has been the attraction of foreign direct investment (Chen et al. 1995; Su and Liu 2016). The relocation to China of manufacturing from the developed economies of North America and Europe has been driven by lower labour costs and by the favourable policies of the Chinese government. However, this development has not been even, with the Eastern provinces surging ahead of the rest of China (Wan et al. 2007; Wang and Zhang 2016).
Since the turn of the century, the Chinese government has made the development of the Central, Western and Northern provinces more of a priority (Huang et al. 2010; Western Development Strategy 2012), and these regions are now, in their turn, experiencing development driven by investment from firms in Eastern China. To some extent, this can be seen as market-driven in processes such as those outlined in the early economic theory of industrial relocation (Ethier 1982; Krugman 1991), but policies such as the provision of infrastructure, subsidies, and tax breaks are also important (Owens and Sarte 2002; Devereux et al. 2007). In the light of fiscal decentralisation, regional governments in China can choose their own policies to attract investment (Jin et al. 2005). Our main purpose in this study is to examine the extent to which regional government policy choices have been effective in influencing the investment decisions of Chinese firms and, if such policies have been effective, which of them has had a significant impact. Naturally, both firm-specific characteristics and market factors are important determinants of investment decisions, and we appropriately control for these.
Using data over the period 2000–2010 on the investment decisions of 498 listed Chinese companies headquartered in the provinces of Guangdong, Jiangsu, Shanghai, and Zhejiang, we investigate the factors that drive their investment decisions in other Chinese provinces. The dataset we use is unique and cannot be easily extended. The period from 2000 to 2010 in China holds significant economic and policy implications for examining the effect of regional government policies on industrial transference. This period saw the decentralisation of decision making to regional governments and shifts in broader national economic strategy. China’s economic policy has undergone various changes and shifts over time (Garnaut et al. 2018). Historically, China’s industrial policy has been highly centralised, with the central government playing a dominant role in setting priorities, providing funding and resources, and directing investments in key industries. However, beginning in the 1990s and accelerating in the early 2000s, there was a notable trend towards the decentralisation of industrial policy to regional governments, with local officials gaining greater autonomy in decision making and implementation (Zhang et al. 2019).
One notable example of this trend was the development of the “Going Out” policy, launched in 1999, which encouraged Chinese firms to invest in overseas markets and allowed local governments to take a more active role in promoting international trade and investment (Yeh and Wharton 2016). Another example was the establishment of special economic zones (SEZs) and other regional development strategies that aimed to attract foreign investment, build infrastructure, and promote economic growth in specific regions of the country (Zeng 2011).
The decentralisation of economic decision-making and industrial policies to regional governments was a prominent feature of China’s economic reforms during the early part of this century. Regional governments were granted more autonomy in formulating and implementing policies to promote economic development within their respective regions. This resulted in regional governments playing a crucial role in shaping industrial transference, particularly the relocation of industries from coastal areas to inland or western regions of China. The development strategies and policies adopted by regional governments during this period varied significantly, leading to diverse outcomes in terms of industrial transference. Some regional governments implemented policies to attract and promote industrial investment, while others focused on environmental protection, resource conservation, or social welfare. By examining the policy approaches and outcomes of different regions during this period, researchers and policymakers can gain insights into the factors that facilitated or hindered industrial transference in China and draw lessons for future policy formulation and implementation. Furthermore, the 2000–2010 period witnessed the transformation of China’s economy from an export-oriented model to a more domestically driven model. This shift in economic strategy also influenced the dynamics of industrial transference, as regional governments sought to balance economic growth with environmental sustainability, resource conservation, and social welfare goals.
We propose an empirical model based on a previous theory that has been used in applications mainly at the supra-national level, but we apply it in a regional context. We estimate how a change in the probability of a firm deciding to invest is affected by policy-, market-, and firm-specific factors using our complete dataset. Then, to address the issue of heterogeneity, we examine the predictions of the model in more detail, breaking down the analysis at the levels of the investing provinces (Guangdong, Jiangsu, Shanghai, and Zhejiang), the major provincial areas of China (West, North, Central and East), and industry classification (labour-intensive, capital-intensive, technology-intensive, and service sector firms).

2. Methodology

2.1. Literature Review

There are three basic sets of elements that could drive the decision of a firm to invest in a different location: first, those things that are related to the market; second, those things which are specific to firms; and, finally, the ways in which government policies influence the decisions of firms. Although the latter is the focus of our attention in this paper, the first two must be controlled for in empirical work.
Table 1 sets out the three principal categories of factors that may influence a firm’s investment decision with respect to location. The theory behind these factors is presented in more detail in the review of the literature that follows, and the details of the variables used are defined in the outline of the model (Equation (1)) below.
Krugman (1998a) noted that, until the 1990s, mainstream economics had paid very little attention to the issue of spatial economics. The field was left largely to scholars of geography. Interestingly, Harris (1954, p. 315), a geographer, said that “Geographers can learn much from economists with their emphasis on wants and markets” before going on to develop a theory of the market as the principal factor determining the location of industry. Harris (1954, pp. 321–22) defined the term market potential of a location to be the sum of the size of markets accessible from that location divided by their distances from that point. Market size could be proxied by data such as retail sales or regional products. Distance can be thought of in terms of transport costs, which may or may not be directly related to geographical distance.
The location of industry has also been of interest to development economists. Focusing on the modern industrial development of Asian economies, Akamatsu (1962) proposed seven stages that these countries go through, from the very first stage, in which local industry is stimulated by exchanging local products for those of the developed economies, through to the final stage, when a country attains the position of an advanced economy with the capability of exporting consumer goods to the West and of manufacturing intermediate goods domestically. Kojima (1978) suggested that foreign direct investment should take place based on comparative advantage, just as for trade in goods and services. He distinguished between the Japanese and American models of foreign direct investment, arguing that American direct investment abroad tended to centre on industries in which the USA had a comparative advantage when, in fact, it would be advantageous both for the investing country and the host country were direct investment to be in those industries in which the comparative advantage of the investing country was declining. For example, Japan has moved the assembly of vehicles to countries such as Taiwan and Korea and, more recently, to China to take advantage of cheaper labour costs (Kojima 1978, p. 16).
In the 1990s, economists turned to the formal modelling of spatial processes in what has been called the New Economic Geography (NEG). Krugman (1991) is generally taken as the starting point of this approach. In his seminal paper, Krugman developed a formal model in which a core–periphery pattern emerges endogenously in a national economy through the interaction of economies of scale with transportation costs. Krugman (1998b) provided a useful summary of the main features of the NEG approach, listing the main factors that promote geographical agglomeration (centripetal factors) and those that oppose it (centrifugal factors). Market size, as in Harris (1954), is a centripetal factor, and so too are thick labour markets and external economies. The centrifugal factors include immobile factors, land rent, and external diseconomies. Krugman and Venables (1998) shifted the analysis to the international level. In their model, as transport costs fall, an international core-periphery develops, with the peripheral nations facing lower real income. However, then, as transport costs fall further, real incomes in the periphery grow at the expense of the core. This model fits well with recent experience across the regions of China.
Based on the literature that focuses on market factors as important to investment decisions, we can identify a potential set of variables: market size, including the potential of the export market, and cost factors, such as labour and land. However, even faced with precisely the same market conditions, different firms might make different decisions, most especially over whether to undertake an investment or not, based on factors specific to the firm, such as size, profitability, and level of debt.
In this paper, we consider only the behaviour of listed companies since very small enterprises are unlikely to be involved in decisions concerning expansion outside the area in which they are located. However, once past a certain threshold of firm size, there is a lack of consensus in the literature as to the nature of the relationship between firm size and industrial transference. In the context of a core–periphery model, Baldwin and Okubo (2006) pointed out that the assumption of identical firms in much previous modelling led to misleading conclusions. Allowing for firm heterogeneity, their model suggests that more productive firms seek to move to the core, while the less productive move to the periphery. This has an important implication for policy since subsidies to attract firms to the peripheral areas may have the unintended consequence of reinforcing the behaviour of the less productive firms. In practice, data on productivity are not available, so proxies such as size and profitability must be relied on. Wagner (2011) found that amongst German manufacturing enterprises, those that chose to expand their operation offshore were larger and more productive, in addition to already having a larger share of exports in their sales. Brouwer et al. (2004) proposed that a firm’s likelihood of relocation decreases with firm size and age but increases with the size of the potential market. However, in their empirical work based on a survey of European companies employing more than 200 workers, only firms with more than 1500 employees or established for over 80 years showed a decreased propensity to mobility.
In a perfect capital market, a firm’s decision to invest would not be dependent on its financial structure (Modigliani and Miller 1958). However, the ability to fund expansion might rely on a firm’s retained profits or debt level. A higher profitability or a lower level of existing debt could well be associated with a greater propensity to invest in general and to invest in other regions. Fazzari et al. (1988) considered differences in firm financing patterns, finding that firms that have exhausted their internal funds are more sensitive in their investment decisions to cash flows than mature high-dividend firms. This result is robust over several different models of investment. Of relevance to our study is the claim of Guariglia and Yang (2016) that Chinese financial markets are not especially efficient, dominated as they are by state-owned banks. Using a large panel of Chinese listed firms from 1998 to 2014, they show that firms with a lower-than-optimal cash flow tend to under-invest, and firms with a higher-than-optimal cash flow tend to over-invest.
While economic theory has rightly concentrated on market factors and, clearly, the specific circumstances of a firm matter to its investment decisions, governments, both national and regional, often intervene in ways that amount to deliberate attempts to alter the environment faced by firms with respect to both factor costs and transaction costs. From the factor cost perspective, local governments can act to artificially reduce the prices of labour, land, and capital using tax breaks and other incentives. From the transaction cost perspective, governments may affect transaction costs through the supply of infrastructure and by improvements in administrative efficiency. Improvements in a region’s transport infrastructure that reduce transport costs can help companies to exploit economies of scale and agglomeration economies. Improved communications infrastructure can allow companies to access the most appropriate technologies to improve productivity.
Some more recent theoretical and empirical work has concentrated on how government interventions affect investment decisions. Bjorvatn (2000) developed a formal model that shows that a city may become caught in a poverty trap if its infrastructure fails to keep pace with population growth so that congestion effects dominate. Becker and Fuest (2010) acknowledged the importance of the provision of infrastructure but noted that it interacts with competition between regional authorities in tax policy. In the case of the European Union (EU), which is the subject of Becker and Fuest’s study, infrastructure is co-financed by national governments and the EU, while national governments alone set tax policies. This lack of coordination between infrastructure provision and taxation policy can reduce welfare. Carlsen et al. (2005) used Norwegian data to examine whether the degree of mobility of firms affects the taxation decisions of local governments. Devereux et al. (2007) considered the interaction between agglomeration effects and the subsidies offered by local governments to attract industry. They studied the decision by multi-national and United Kingdom firms to set up new plants in the UK and, in contrast to some earlier work (Devereux and Griffith 1998, 2002; Holmes 1998), they found only a small effect of subsidies and other incentives, with the agglomeration effects, including market size, being the main driving force of the location of new plants. Martin and Rogers (1995) developed a formal model of how the provision of public infrastructure affects not only firm location decisions but also trade patterns and welfare. They defined infrastructure very broadly to include not only transport and communications infrastructure but “any facility, good or institution provided by the state which facilitates the juncture between production and consumption” (Martin and Rogers 1995, p. 336). Holl (2004) specifically examined the effect of road transport infrastructure on new plant locations in Portugal, finding that new road developments over the period 1980–1994 had significant positive spillover effects for adjacent municipalities in terms of the establishment of new manufacturing plants.
The main factors that come out of the literature on the role of government in attracting investment from firms are that all types of infrastructure very likely matter, as does any action that affects costs for the better, such as subsidies, or the worse, such as taxes, regulatory compliance costs, and administrative burden.
There is a good deal of literature examining the drivers of firm investment decisions in various contexts. We consider several papers representative of that literature that take an approach similar to the one we propose here.
Head et al. (1999) and Cheng and Stough (2006) were both concerned with the location decisions of Japanese manufacturing firms, the first in the USA and the second in China, having to do with the choice of a state or province in which to locate. Head et al. (1999) were interested in whether the promotional activities of US states, such as subsidies and taxes, have an effect on the choices of the investment locations of Japanese firms. Controlling for market size and labour costs, they found that if an individual state were to stop its promotional policies unilaterally, then it would lose out to other states, but that the impact of the promotional policies has little effect on the decisions of the Japanese firms since the policies of different states tend to cancel each other out. Cheng and Stough (2006) studied the effects of market size, the costs of labour, land, and energy, infrastructure capacity, and policy incentives on the investment decisions of Japanese firms in China. Their most interesting finding is that labour cost is positively associated with Japanese investment, perhaps indicating that high labour cost is a signal of highly productive labour.
Lv and Spigarelli (2016) and Quer et al. (2018) both examined the foreign direct investment decisions of Chinese firms in Europe, concerned themselves with the choice of country in which to locate. The focus of Lv and Spigarelli (2016) is on Chinese firms in the renewable energy sector. They find that greater political stability, weaker institutions, and greater market size all act to increase the probability of investment, while higher levels of human capital decrease the probability of investment. Quer et al. centres on the differences in the behaviour of Chinese state-owned enterprises (SOEs) and non-SOEs. Their key finding is that SOEs are more likely to choose to invest in counties with high political risk and less likely to indulge in inertial behaviour (that is, stick to investing where they have invested before) and mimetic behaviour (that is, less likely to copy the behaviour of similar firms in making their location investment decisions).
Although the studies just mentioned all dealt with firms making foreign investments, whether the investing firms under consideration are foreign or domestic is of no importance for the modelling strategy. Our focus is on Chinese domestic firms, rather than foreign firms, and their decisions to invest in provinces other than their home province. In the absence of readily accessible data at the firm level, we have extracted primary data on the firms under consideration directly from their annual reports. This allows us to address a gap in the literature, specifically with respect to the influence of regional government policies on investment decisions, but also controlling for the market and firm-specific characteristics discussed above. Under the policy of fiscal decentralisation (Jin et al. 2005), regional governments in China have a considerable degree of autonomy over policies that might attract investment, such as taxes, subsidies, compliance costs, and the provision of infrastructure.

2.2. Data

Researchers at the Nanjing University School of Economics, Shanghai Lixin University, and the University of Birmingham Business School have jointly worked on compiling data on Chinese-listed companies based on their annual reports. At the micro level, these data include information on the investment decisions and financial structure of individual firms, as well as firm size. In addition to this firm-level data, at the macro level, information on regional factor prices, infrastructure provision, taxation levels, exports, and local market demand has been collected. Using this information, we can address the question of what determines the decisions of firms to invest elsewhere in China to assess the relative importance of government policies, market factors and firm-specific factors.
We have selected data on listed companies from Guangdong, Jiangsu, Shanghai, and Zhejiang. These eastern coastal provinces are facing resource constraints and environmental challenges, which are causing firms located there to consider moving their production base. The Chang Jiang Delta and Pearl River Delta regions have become the forefront of this industrial transference; for example, the cities of Shenzhen, Dongguan, Foshan, and Zhuhai have built more than twenty Industrial Transfer Parks (HKTDC 2014). In addition, central government policy has encouraged the acceleration of both East to West and South to North industrial transference.
The data cover 498 companies in total, with 175 firms based in Guangdong, 115 enterprises in Jiangsu, 78 in Shanghai, and 130 in Zhejiang. The sample is made up of large enterprises and small and medium enterprises in the A-share market. It includes, amongst others, firms in the food processing, machinery and equipment manufacturing, ferrous metal, mineral products, and electrical machinery industries.
The full dataset is available upon request from the corresponding author. The firm-level data were extracted directly from the websites of the Shanghai Stock Exchange (Various Dates) (n.d.) and the Global Enterprise Library (Various Dates) (n.d.). The macro-level data are from various issues of the China Industrial Statistical Yearbook available at the website of the National Bureau of Statistics of China (Various Dates) (n.d.), as well as the compilation of New China’s 60-Year Data available at the website of China Statistics Press (Various Dates) (n.d.).

2.3. Model

An act of inter-regional investment is defined to include the setting up of a factory, as well as a merger or acquisition or investment in equity, but explicitly excludes real estate investment and investment in securities. Given the range of possible investment activities and the inherent difficulties of measurement, we chose as our dependent variable a dummy indicating whether a company invests in a region in a given year or not. This characteristic of the dependent variable, along with the combined time series and cross-sectional nature of the data, suggests the use of a discrete choice model, such as probit or logit.
Probit and logit models produce qualitatively similar results, the primary difference being that the probit model assumes the error term follows the standard normal distribution, and the logit model assumes that the error term is distributed as a standard logistic (Wooldridge 2013). The different assumptions mean that the estimated coefficients from the two models will, of course, differ quantitatively, although their statistical significance should be similar. It should be noted that the coefficients of neither model are directly interpretable economically. To better understand the practical and substantive importance of the effects of the statistically significant variables on the probability of a firm making an investment decision, one can calculate the predicted probabilities at various representative values of the independent variables (Williams 2012).
The probit model takes the form of Equation (1), where Φ is the standard normal cumulative distribution function, while, for the logit model, Φ is the logistic function.
P ( I N V j i k t = 1 ) = Φ ( α 0 + α 1 G O V k t + β 1 M K T k t + β 21 F R M j i t + ξ j + ξ k + ξ t + υ j i k t )  
Table 2 sets out the variable definitions.
The dependent variable INVjikt is 1 if company j in region i invests in region k at time t and 0 otherwise. The probability of such an investment taking place is modelled as dependent on three sets of factors. These sets of factors are as follows: (1) policy variables, represented by the vector GOVkt; (2) factors measuring the nature of the local market, represented by the vector MKTkt; and (3) firm-specific factors, captured by the vector FRMjit. The elements of each of these vectors are proxies for the effects discussed in the literature review.
The variables in GOVkt capture the policies of local government in receiving region k at time t. These variables are the focus of our study. We chose two different infrastructure variables, one to represent transport infrastructure and one to represent communications infrastructure, both of which we would expect to be positively associated with attracting industrial relocation. INT is the highway network density (km of highway per km2 of land area), and INC is the log of the value of post and telecommunications infrastructure in CNY bn. We consider three variables to measure the type of local government interventions that may act as disincentives to investment. TAX represents regional user charges and surcharges as a proportion of regional industrial output. SOE is the proportion of enterprises that are state-owned; the higher this proportion, the fewer opportunities for private investors. The final government variable is ADM, which is an index measuring the administrative expenses of local government. This index, which is based on administrative expenditure as a fraction of the total expenditure, represents the efficiency of local government. A higher value of this index represents a lower efficiency level.
The variables in MKTkt are chosen to describe the characteristics of each regional market into which investment may be attracted. As market characteristics variables, we selected labour costs, WGE, land costs, LND, trade openness, EXP, and a measure of local market size, LMS.
WGE is simply the natural log of the regional average wage at time t. LND is the natural log of the average cost of the land in the region. The cost of land is proxied by the average house price in the region. A higher value of this variable represents a higher investment cost in the region. EXP is international exports from the region as a share of regional GDP.
LMS is a measure of the potential of local market demand and is calculated, following the discussion in the literature review of Harris (1954), as:
L M S = l n { s r G D P s d r s 1 + G D P r d r r 1 }
where GDPs is the gross domestic product of region s, GDPr is the gross domestic product of region r, drs is the distance between the two provinces, and d r r = 2 3 a r e a r π is the intra-province distance (with arear being the area of the province).
FRMjit is made up of variables to control for the nature of the investing firms. The enterprise characteristic variables were chosen to reflect the discussion in the literature. They are company size, SZE, company profitability, ROA, and capital structure, CAP.
SZE is defined as the natural logarithm of the total value of assets. The level of profitability, ROA, is measured conventionally as return on assets, specifically as the ratio of gross profit to total assets. Capital structure, CAP, is defined as the ratio of total debt to total assets.
To control for other unobserved factors, we added regional and industry dummy variables to the model. INVREG is a categorical variable for the four investing provinces: (1) Guangdong, (2) Jiangsu, (3) Shanghai, and (4) Zhejiang. MAJORREG is also a categorical variable for the four traditional groupings of Chinese provinces: (1) East, (2) North, (3) Central, and (4) West. The provinces of Beijing, Tianjin, Hebei, Shanghai, Jiangsu, Zhejiang, Fujian, Shandong, Guangdong, and Hainan make up the Eastern Coastal region. The Northeast region comprises Heilongjiang, Jilin and Liaoning; the Central region comprises Shanxi, Anhui, Jiangxi, Henan, Hubei, Hunan, Guangxi, Sichuan, Chongqing, Guizhou, Yunnan, Inner Mongolia, and Shaanxi, and the Western region includes Gansu, Qinghai, Ningxia, and Xinjiang. Because of a change in the reporting of data during the period under consideration, to ensure continuity, we incorporated Hainan into Guangdong Province and Chongqing into Sichuan Province. Tibet is excluded since no data are available for this area. The China Securities Regulatory Commission has a set of industry classification guidelines that set out 13 industry groups. We combined groups of these industries into four major classifications coded by the categorical variable INDYCLASS, where (1) represents labour-intensive industries, (2) indicates capital-intensive industries, (3) indicates technology-intensive industries, and (4) represents service industries. The food, beverages, textiles, clothing, fur, wood, furniture, and paper and printing industry were defined as labour-intensive industries; the petroleum, chemical, rubber, plastic, metal, and non-metal industries were defined as capital-intensive industries. The machinery, equipment, instrumentation, communications, and electronics industries, as well as other manufacturing fields, were regarded as technology-intensive industries, while the electricity, gas, transportation, warehousing, post, and telecommunications industries were service industries. A set of year dummies was also added to the model.
Table 3 presents summary statistics on the variables; maximum and minimum values, along with averages and standard deviations, are reported. For the dependent variable, INV, note that an act of investment is recorded for fewer than 6% of the observations; in each year, most of the firms do not invest in another province. A cursory look at the average values and the corresponding standard deviations for the dependent variables indicates the presence of significant variation in the data but also alerts us to the difficulty of how to convey the substantive economic importance of findings from the model as opposed to their statistical significance. As noted already, one clear way of doing this is to report the predicted probabilities of an act of investment at certain chosen values of the independent variables. Given that the wide variety of units of measurement of these variables creates difficulties of interpretation, obvious values to choose are the means supplemented by means plus or minus one and two standard deviations.
In Equation (1), the subscript identifying the cross-sectional element of the panel is j, which indexes the firms in the sample. Apart from the firm-specific explanatory variables in the model, there may be an unobserved effect, ξ j , and this could be accounted for by adding dummy variables for the cross-sections, although this typically would lead to so many explanatory variables that it would prevent the estimation of the model (Wooldridge 2013, p. 488). The alternative is to estimate a fixed effects model, but it should be noted that this will entail dropping from the sample those firms which make no investments over the period under consideration or, alternatively, make an investment in every period since, in these cases, there is no variation over time. Indeed, we experimented with a fixed effects model but found that none of the explanatory variables ever showed as statistically significant since so many observations were dropped.
The key assumption necessary for using a random effects model is that the unobserved effect is uncorrelated with all the explanatory variables (Wooldridge 2013, p. 496). Certainly, in our case, there is no reason to think that any unobserved effects might be related in any way to the principal explanatory variables of interest, namely the government policy variables. Nor does it seem plausible that the unobserved effects are related to the market variables. Moreover, the firm-specific variables are factors concerning the cross-sections (firms) that are observed in that we have measured values of these factors.

3. Results

Table 4 presents the results of estimating Equation (1) and two reduced versions of it using the random effects probit model. Model (1) in Table 4 shows the results just using the set of government variables, the focus of the study. Model (2) augments the government variables with the market features variables, and Model (3) adds in the enterprise characteristic variables as well. Table 5 presents the results of estimating the same models as in Table 4 but using a logit model.
See the text for a discussion of the significance of the categorical variables not reported here.
The estimates of the coefficients in Table 4 and Table 5 follow the same pattern with respect to statistical significance. A coefficient that is statistically significant at the x% level in the probit model is of the same level of significance in the logit model. The magnitudes of the coefficients in the two models, of course, differ and will have to be transformed into predicted probabilities before interpretation.
See the text for a discussion of the significance of the categorical variables not reported here.
In Model (1), the coefficients of both transport infrastructure (INT) and communications infrastructure (INC) are significantly positively related to investment, while the regional tax burden (TAX), the proportion of state-owned enterprises (SOE), and government administrative expenses (ADM) are significantly negatively related to investment.
However, when we add in the market variables and then the firm-specific variables, the coefficients of INT and TAX lose their significance. The coefficients of INC, SOE, and ADM retain their signs and remain highly statistically significant. They fall in magnitude a little but are generally very robust to the changes in specification across Models (2) and (3).
Of the market characteristic variables, neither the regional average wage (WGE) nor regional exports (EXP) are significant. The proxies for the land cost (LND) and the market size variable (LMS) are significant and robust in both sign and magnitude across Models (2) and (3). Both are positively related to the dependent variable. The positive effect of market size is as expected, and since land cost is proxied by house price, its positive effect also seems plausible in that it may be indicative of wealthier consumers or land already developed to a stage suitable for new ventures.
Of the three enterprise-level variables, only company size (SZE) turns out to be statistically significant, with larger companies being more likely to undertake investment in another province.
In general terms, we can say that the probability of undertaking an act of investment rises with the size of the available market and land cost, as well as with the scale of the investing firms. Furthermore, firms are influenced positively by the provincial government’s provision of communications infrastructure and negatively by the proportion of state-owned enterprises and by the administrative inefficiency of the provincial government.
Before turning to the analysis of the substantive economic significance of these statistically significant findings, since it may be that provincial governments respond to firm behaviour, we examined the possibility of endogeneity of the policy variables. To do this, we re-estimated the full version of Equation (1) (i.e., Model (3)) using an instrumental variables probit model. We instrumented each of the policy variables with its lag. The results of the IV probit estimation are shown in Table 6 alongside the original probit estimates. The IV probit estimates are, of course, different from the probit estimates. The policy variable ADM is no longer statistically significant, and the WGE variable becomes statistically significant. Most other findings are qualitatively similar across the two modelling approaches.
The key point, however, is that the Wald test of exogeneity, which has a null hypothesis of no endogeneity, has a p-value of 0.2735, so there is insufficient evidence to reject the null. Therefore, the standard probit regression is preferable, and in the substantive interpretation of the policy variables that follows, we use the probit estimates reported in Table 4 and the broadly similar logit estimates from Table 5.
Figure 1, Figure 2 and Figure 3 can be used to interpret the practical significance of the findings concerning the policy variables INC, SOE and ADM, respectively. They display the predicted probabilities of a firm investing in another province across specifically fixed values of the policy variable of interest, namely at the mean value, as well as plus or minus one and two standard deviations from the mean value. This allows us to directly compare the substantive effect of equivalent variations in the three statistically significant policy variables. The predicted probabilities are average marginal effects (AMEs); that is, they are calculated using the observed values of the other variables in the sample and then averaged.
For the Wald test of exogeneity, chi2(5) = 6.35 Prob > chi2 = 0.2735.
Figure 1 shows the AMEs for the variable representing communications infrastructure (INC) fixed at the following values: 3.83, 4.89, 5.95, 7.01, and 8.07. The top panel uses the results from the probit estimation, and the bottom panel uses the results from the logit estimation. At the mean value of INC, the predicted probability of relocation is around 0.01; this rises to around 0.03 one standard deviation of INC above its mean and to nearly 0.08 at two standard deviations above the mean. The chances of attracting investment from another province plummet dramatically if communications infrastructure falls below average, approaching zero if the measure draws close to two standard deviations below the sample average.
Figure 2 shows the AMEs for the proportion of state-owned enterprises (SOE) set at 0.051, 0.252, 0.453, 0.654, and 0.855. Firms are much more strongly attracted to invest in provinces where the proportion of SOEs is low. There is just under a 1% estimated chance of relocation if SOE is at its mean value, rising to over 1.5% with SOE being one standard deviation below its mean but falling to not much more than 0.5% with SOE one standard deviation above its mean.
Figure 3 shows the AMEs for the variable capturing the administrative expenses of regional government (ADM) set at 0.049, 0.087, 0.125, 0.163, and 0.021. The pattern and magnitude of the effects for ADM quite closely parallel that of SOE. High values of administrative expenses impose a burden on business and make it much less likely for a firm from another province to consider relocation of any of its activities.
There is likely to be a degree of heterogeneity with respect to findings across different regions and firm types. Guangdong was used as the reference class for the INVREG categorical variable, and in Model (3), it turned out that both Jiangsu and Shanghai were significantly different at the 5% level, but Zhejiang was not. The Eastern provinces were the reference class for the MAJORREG category, and in the full version of the model, the Central and Western provinces, but not the Northern provinces, were significantly different at the 0.1% level. As for classification by major industry (INDYCLASS), with the labour-intensive industries as the reference class, capital-intensive industries were found to be not significantly different, but technology-intensive and the services industries were, at the 5% and 1% level, respectively.
Considering the heterogeneity of the results as evidenced by the significance of some of the dummy variables for investing region, main provincial groupings, and industry types, we proceeded to break down the analysis by INVREG, MAJORREG, and INDYCLASS. Since the probit and logit models give very similar results, to avoid cluttering the figures, we show the results using only the logit model. Figure 4 presents the predictive probabilities with the communications infrastructure variable (INC) set at the same values as in Figure 1. The top panel shows the predictive probabilities for each of the four investing provinces separately; the centre panel shows the predictive probabilities for each of the four major traditional provincial groupings separately; and the bottom panel shows the predictive probabilities broken down by the four major industrial classifications. Figure 5 is similar to Figure 4 but relates to the variable SOE, while Figure 6 is for ADM.
Across all three of Figure 4, Figure 5 and Figure 6, we see that the effects for Zhejiang track those of Guangdong closely, while the paths followed by Jiangsu and Shanghai depart from that of Guangdong, in line with their statistical difference, as reported earlier. Similarly, the effects in the Central and Western provinces differ much more from the East than do those for the North, which were not significantly different from the East. The results for the labour-intensive and capital-intensive industries, which are not significantly different, track each other very closely, while those for tech-intensive and service industries diverge.
In Figure 4, we can see that firms in Guangdong and Zhejiang respond much more strongly to improved communications infrastructure than those in Jiangsu and Shanghai. The provision of infrastructure is a much more important drawcard in the Central and Western provinces than in the already more developed East and North. Both labour-intensive and capital-intensive industries are also more likely to be attracted by good infrastructure than tech-intensive and service industries. The tech-intensive industries are more likely to remain located in the more developed provinces, while service industries are already more widely dispersed across the whole country.
Figure 5 shows that firms in Guangdong and Zhejiang have higher probabilities of making an inter-provincial investment than firms in the other two investing provinces, regardless of the proportion of SOEs in those provinces. In the less-developed provinces of the Central and Western regions, a lower proportion of SOEs acts very strongly to attract investment. In the more developed East, this factor makes much less difference to the relocation decision of firms. The proportion of SOEs is also a greater determining factor in the labour-intensive and capital-intensive industries than the other industry classifications.
The pattern Indicated in Figure 6 is that the effect of regional government administrative expenses (ADM) parallels that of the proportion of SOEs in Figure 5. The differences between the less developed and more developed regions with respect to ADM are even stronger than with respect to SOE.

4. Discussion

The focus of this paper is to examine the effect of regional government policies on industrial transference within China as measured by the inter-provincial investment acts of a sample of listed companies from the provinces of Guangdong, Jiangsu, Shanghai, and Zhejiang. Probit and logit models were estimated using data over the period 2000–2010 from 498 listed companies. As noted in the introduction, in this period, there was a notable decentralisation of industrial policy to regional governments, allowing regional governments to play a crucial role in shaping industrial transference. Although in recent years there has been some evidence of a renewed focus on centralisation and control in Chinese economic policy, there remain ongoing discussions within China about the optimal balance between centralisation and decentralisation in economic policy, with some arguing that a more decentralised approach is necessary to promote innovation and entrepreneurship, while others emphasize the importance of central coordination and planning to achieve national development goals. For example, the government has increased regulation and oversight of key industries, such as technology and finance, and has sought to strengthen the role of state-owned enterprises (SOEs) in strategic sectors. To increase trade and China’s economic influence, a new national economic policy known as the Belt and Road Initiative (BRI) was launched in 2013 (Ploberger 2017). The current status of the debate around centralisation/decentralisation is complex and evolving, and our findings from the period covered by our dataset remain relevant and can allow us to draw lessons for future policy formulation, especially in relation to infrastructure, government ownership, and administrative burden. We outline these lessons below.
In addition to the government policy variables, a range of market and firm characteristics was controlled for.
In terms of firm characteristics, the only variable to show as important in the overall results was firm size. Return on assets and capital structure were, in contrast, not associated with differences in the probability of undertaking an investment in another province.
Turning to market characteristics, potential market size is an important driver of investment decisions. Additionally, it was found that higher land costs increased the probability of attracting investment.
Of the policy variables, the regional transport infrastructure and the tax burden turned out not to be significantly related to the decision to invest once market characteristics and firm-level differences were controlled for. In contrast, superior communications infrastructure proved to lead to an increased probability of investment, as did a lower proportion of state-owned enterprises and a lower burden of regional government administrative expenses.
The benefits of improving communications infrastructure are particularly important and can be quantified as increasing the probability of attracting investment approximately by a factor of three by lifting communications infrastructure one standard deviation above average and by a factor of eight by lifting it two standard deviations above average. The benefits of reducing the proportion of state-owned enterprises by one and two standard deviations below their mean amount to an over 50% and 120% increase, respectively, in the probability of attracting investment. Reducing the administrative burden in a similar way results in lesser, but still important, benefits of about 25% and 55%.
From the results, we can draw some clear lessons for provincial governments in terms of policy priorities:
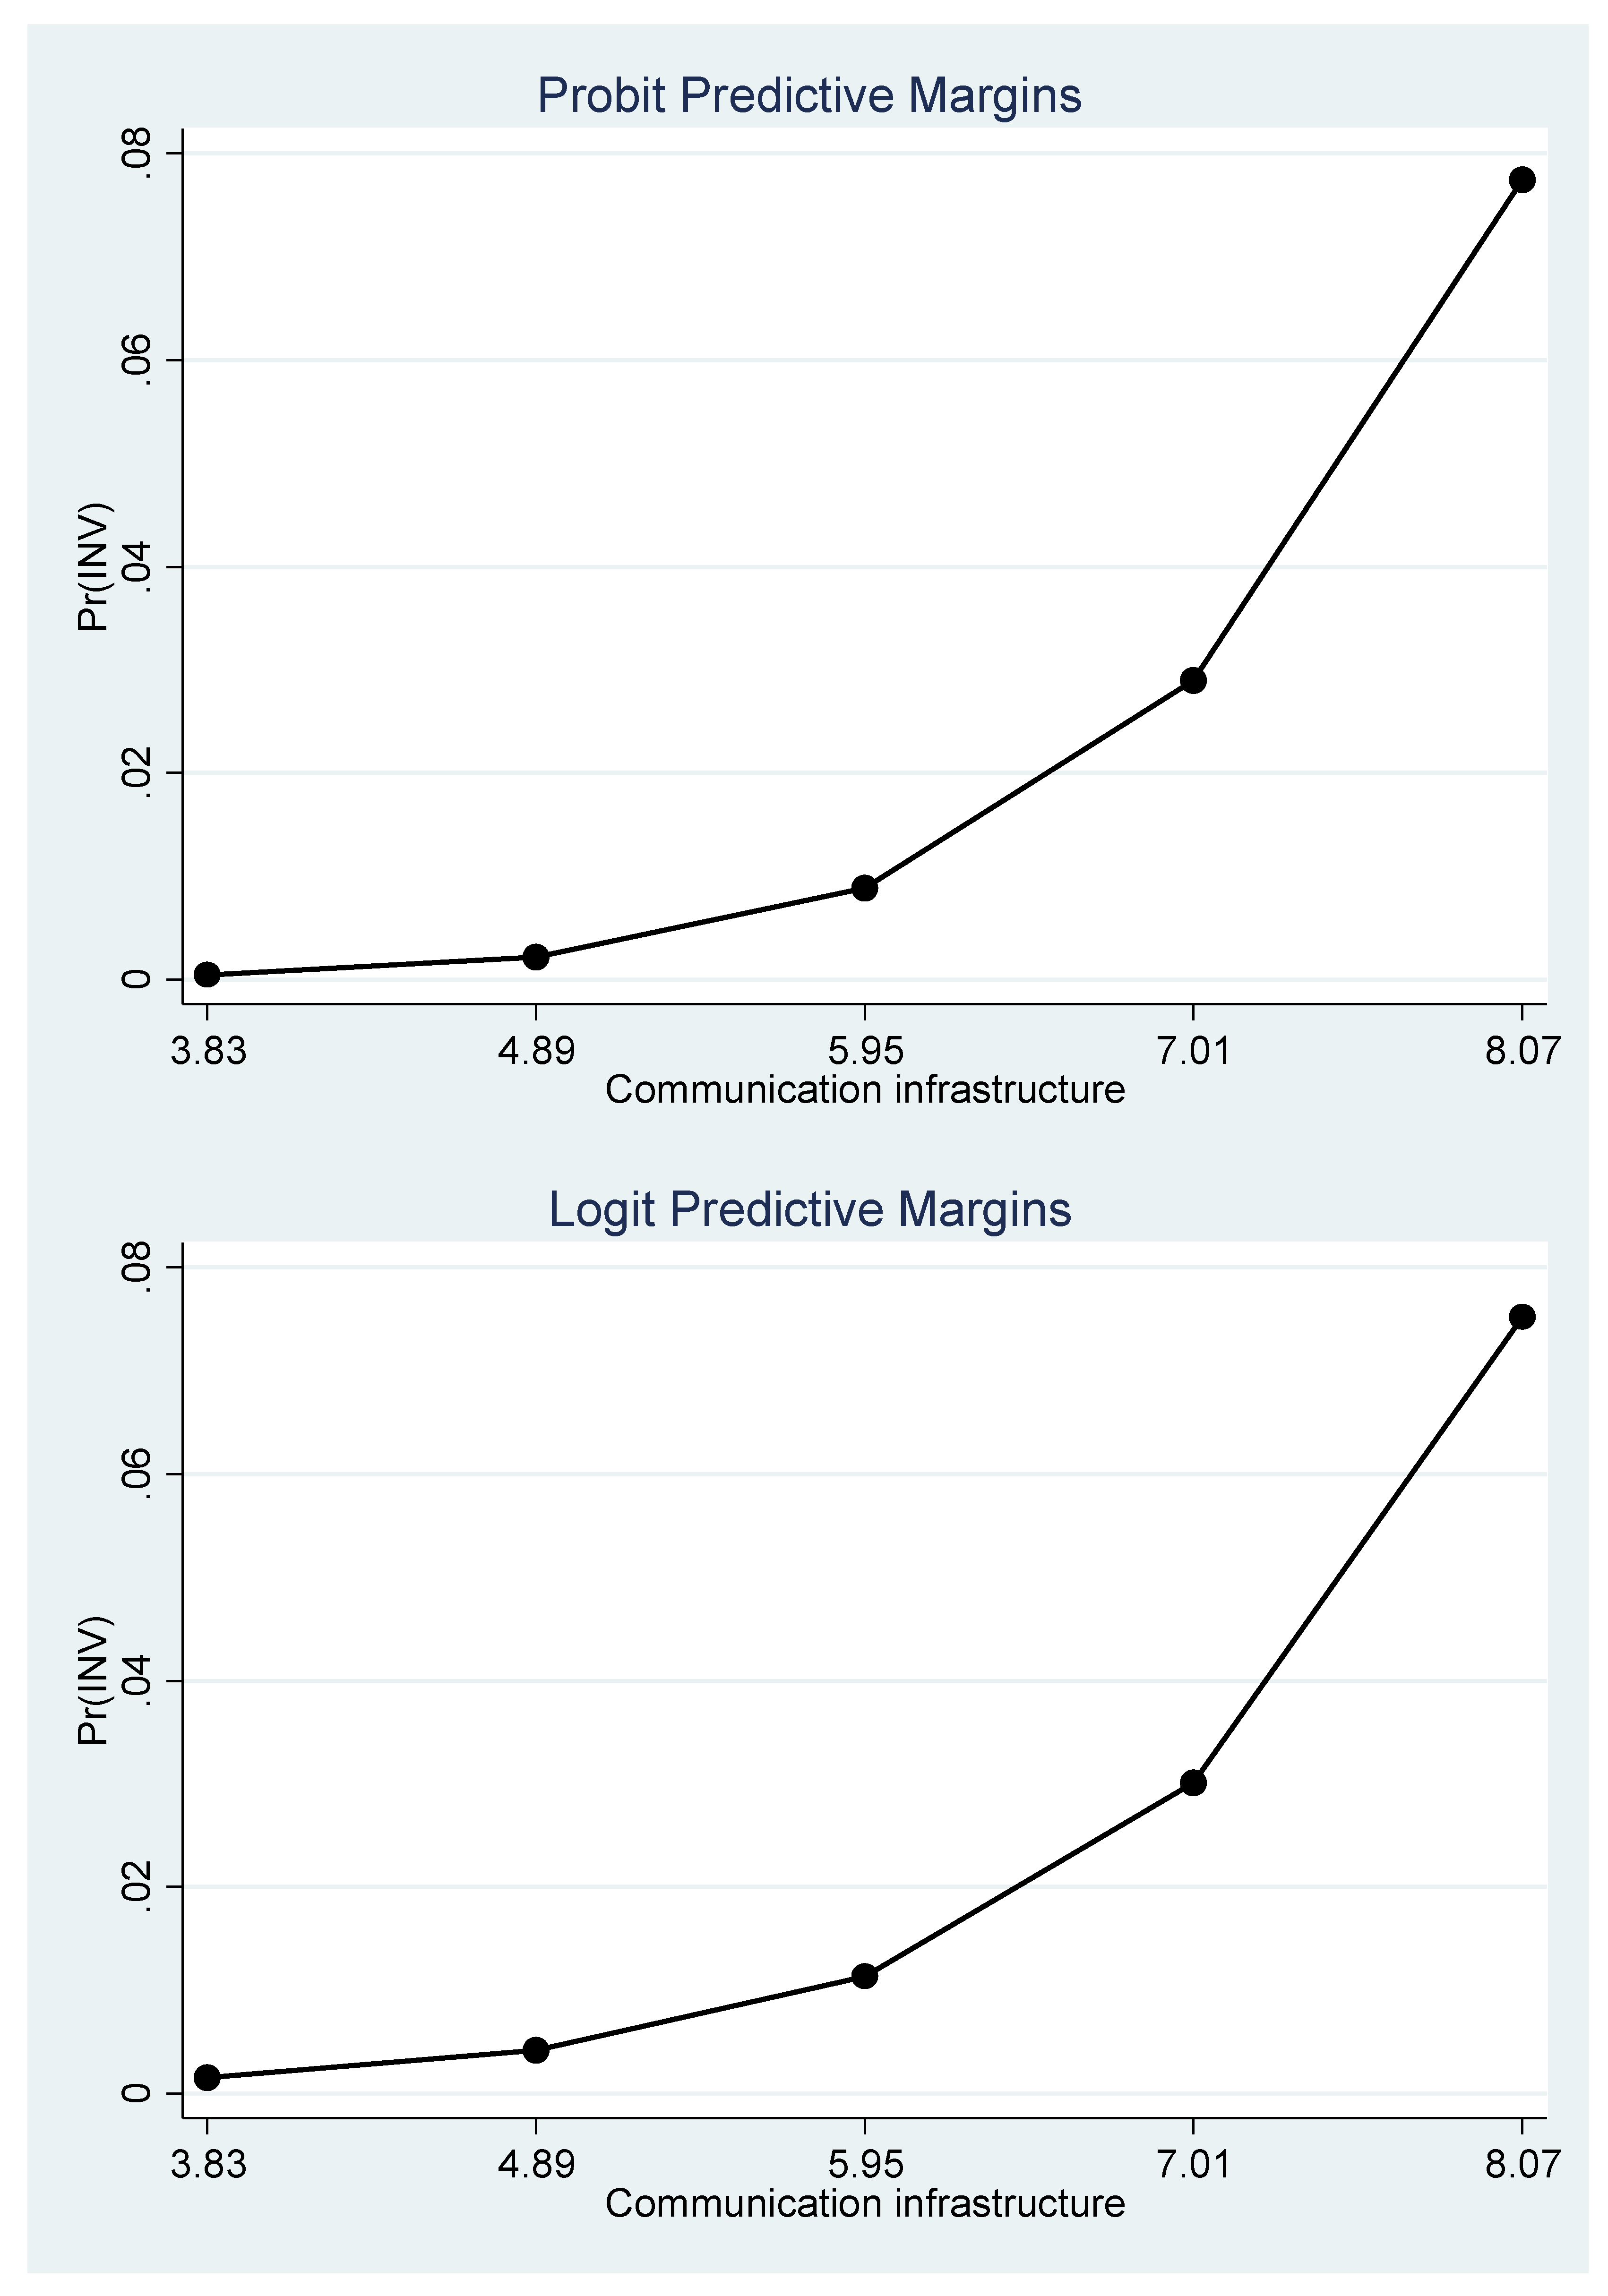
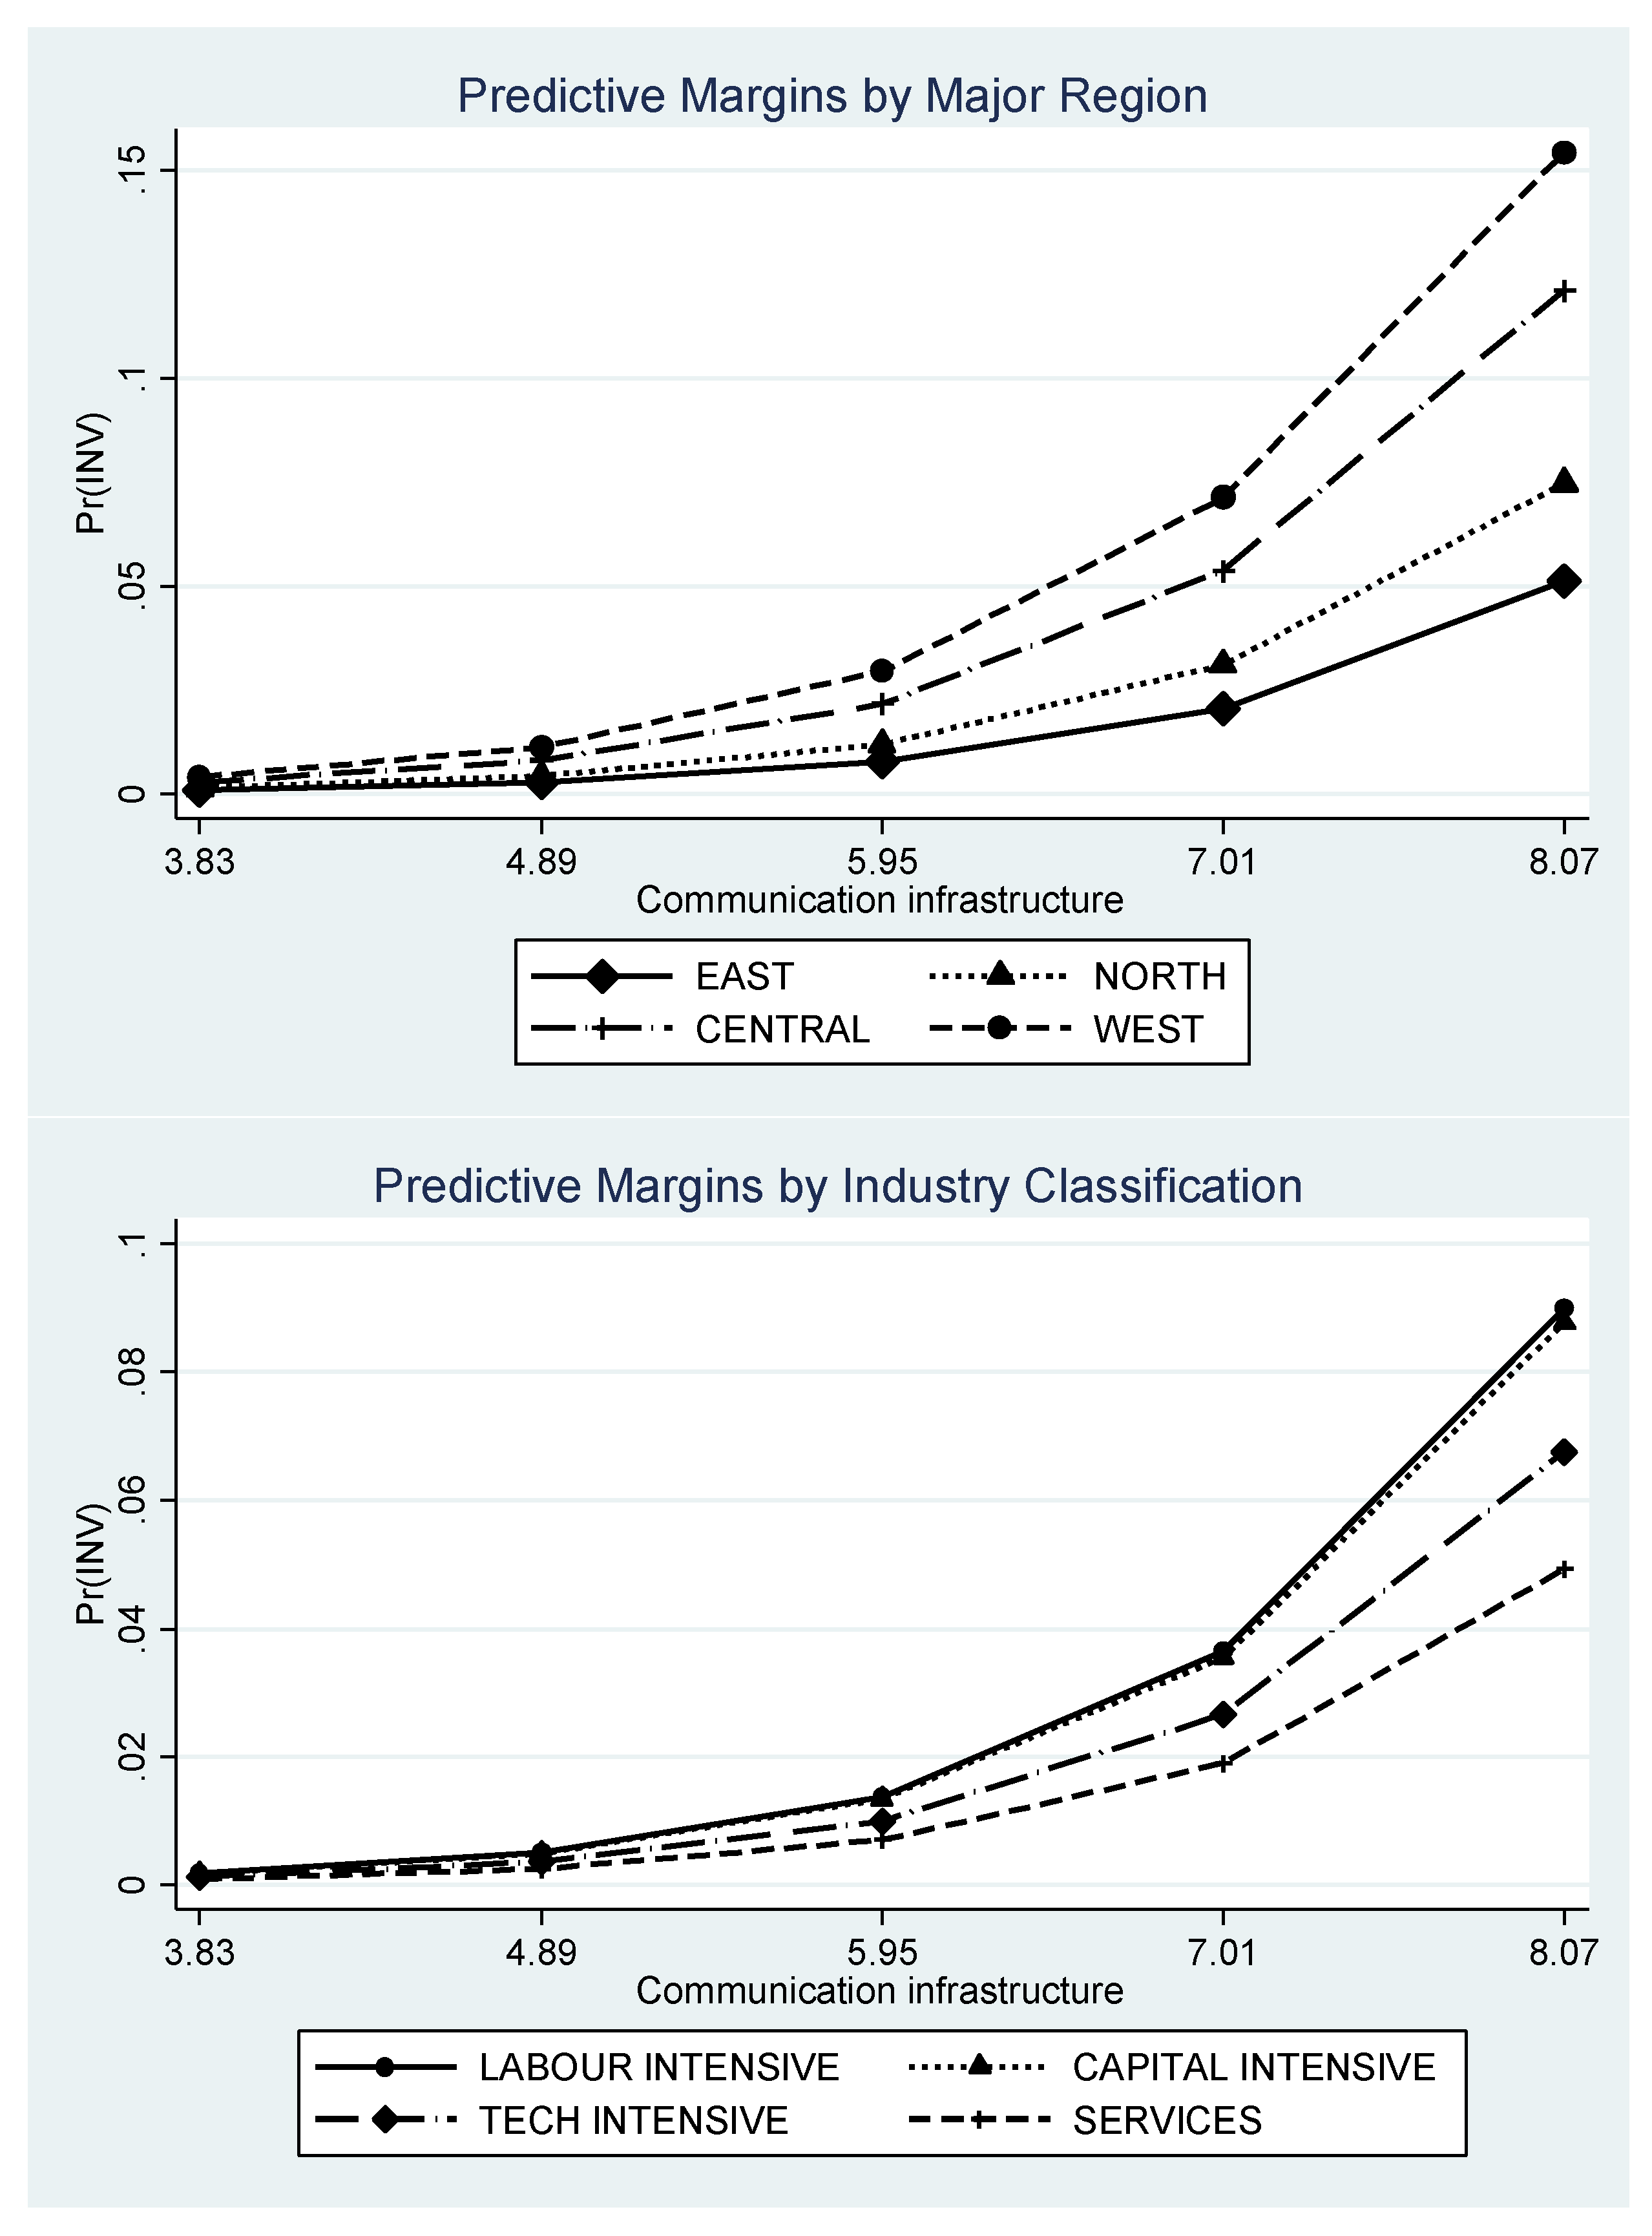
  • A focus on improving communications infrastructure is likely to reap very high rewards in the form of inward investment.
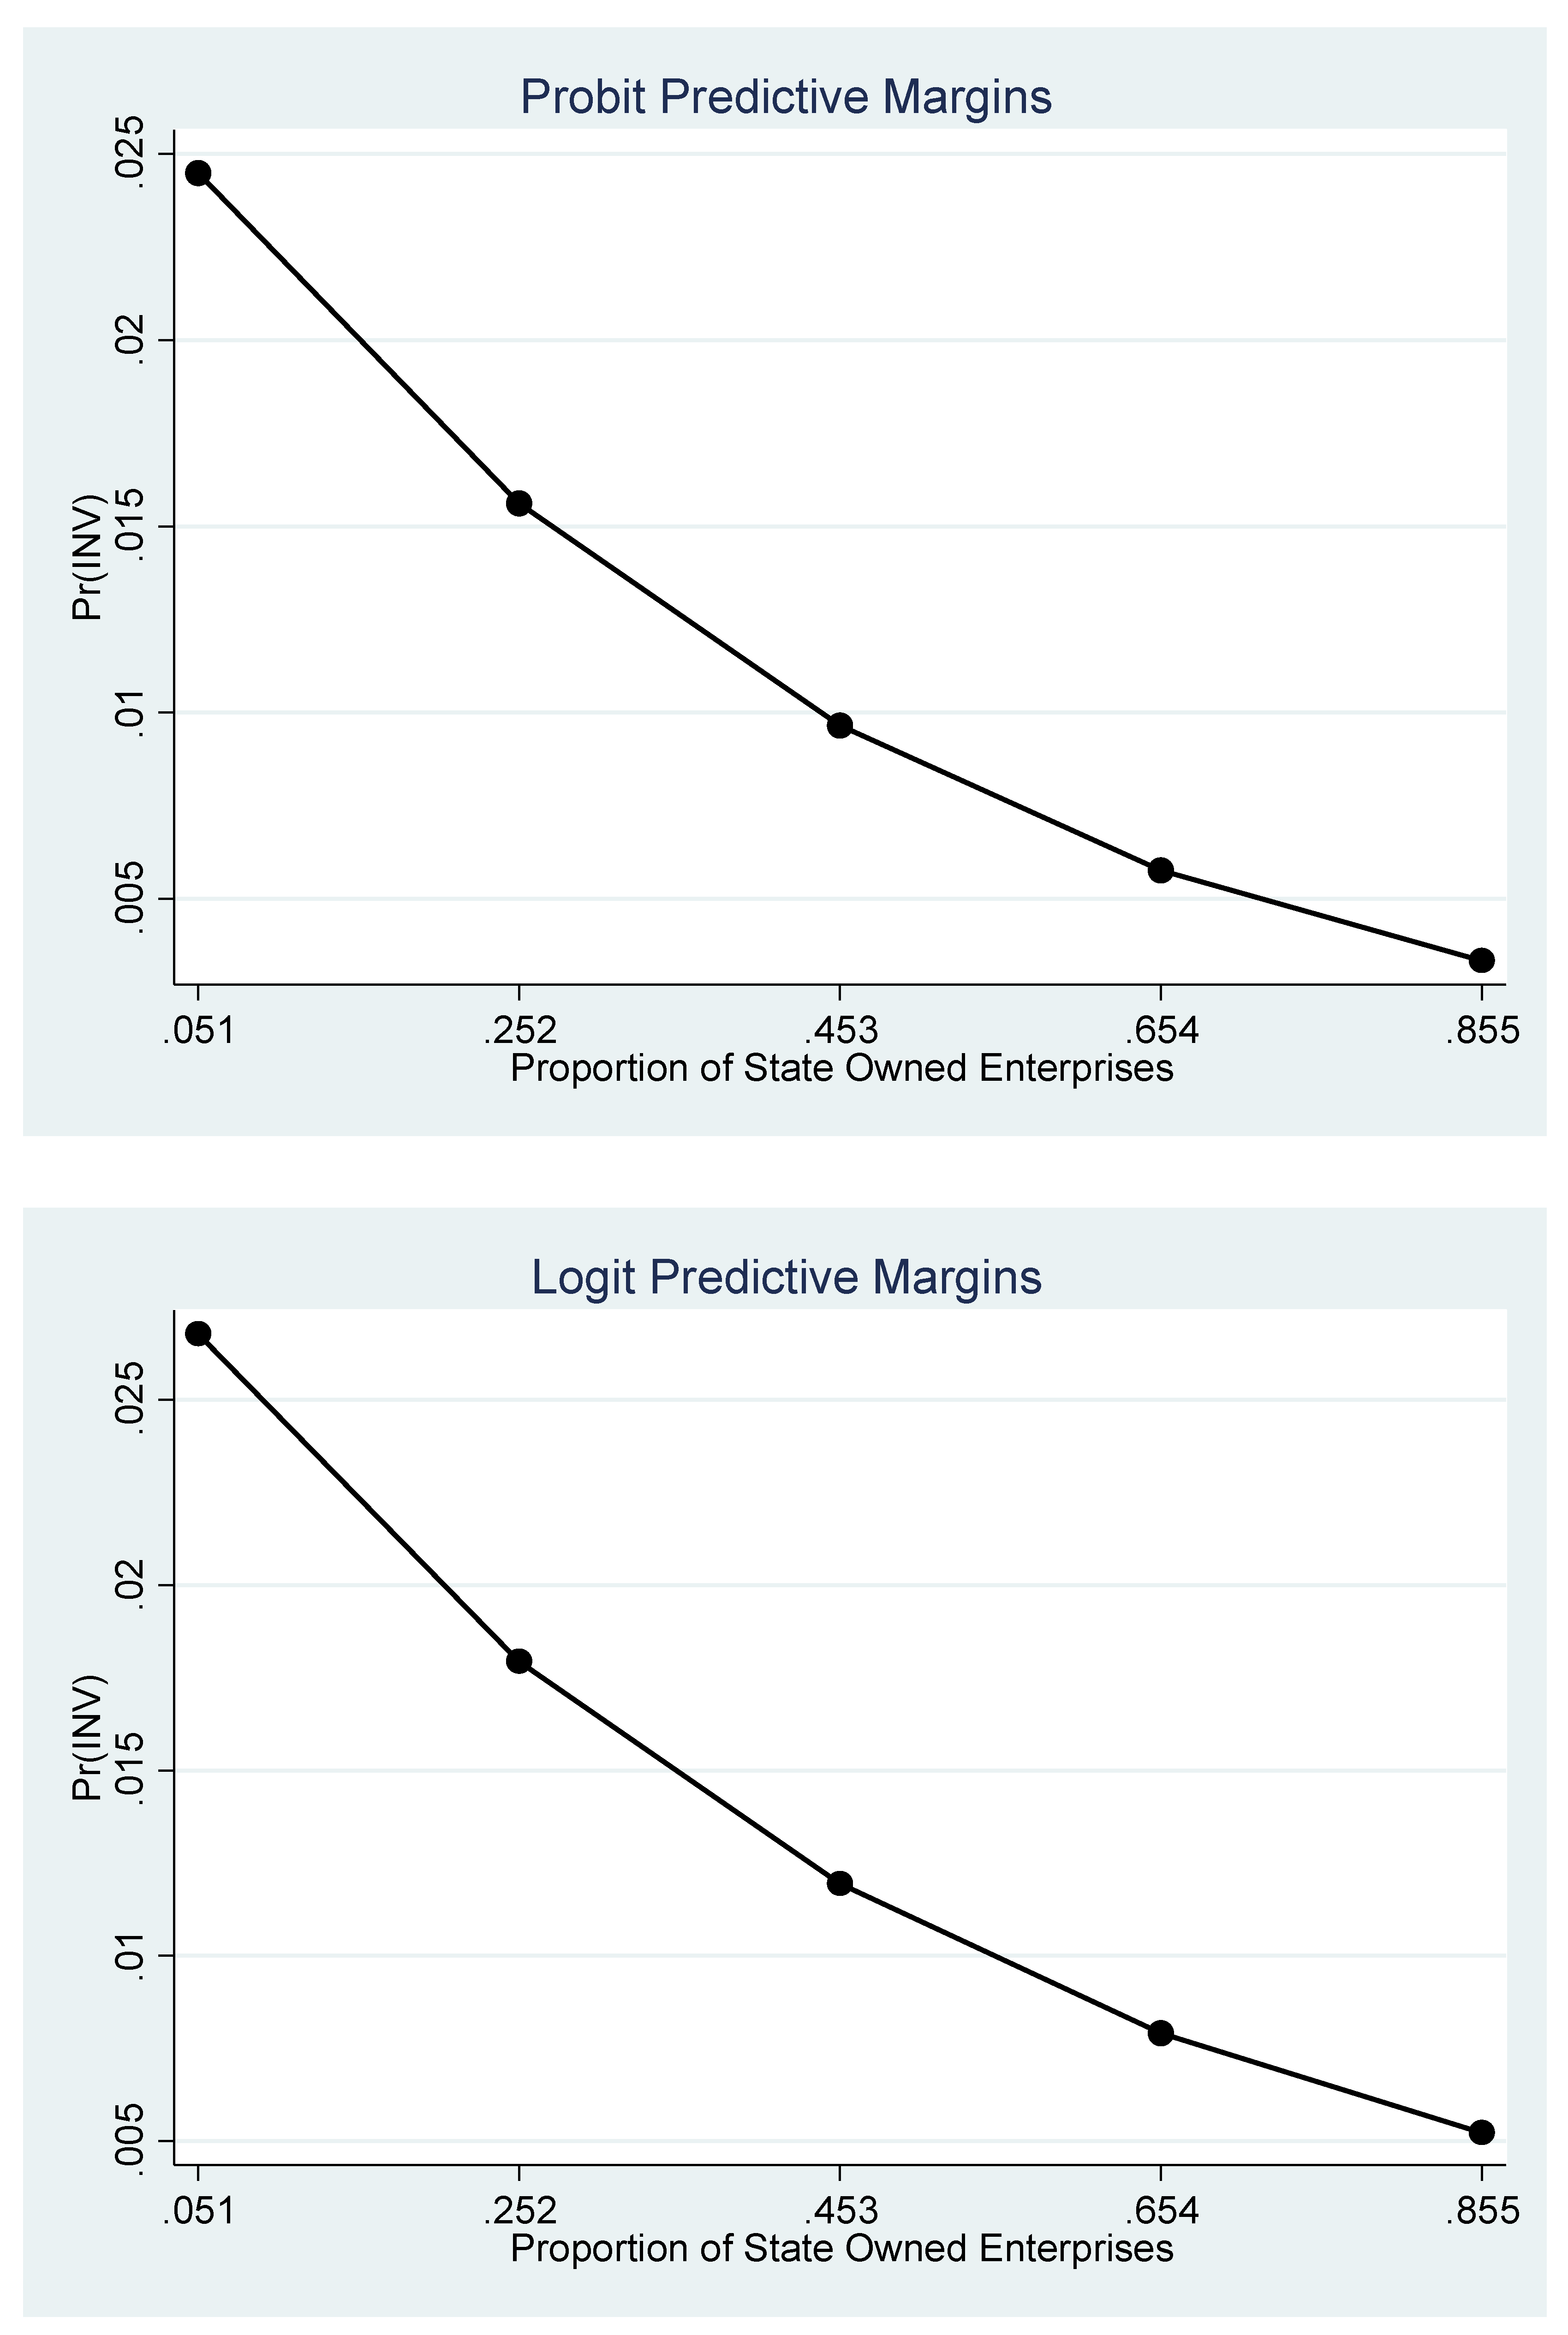
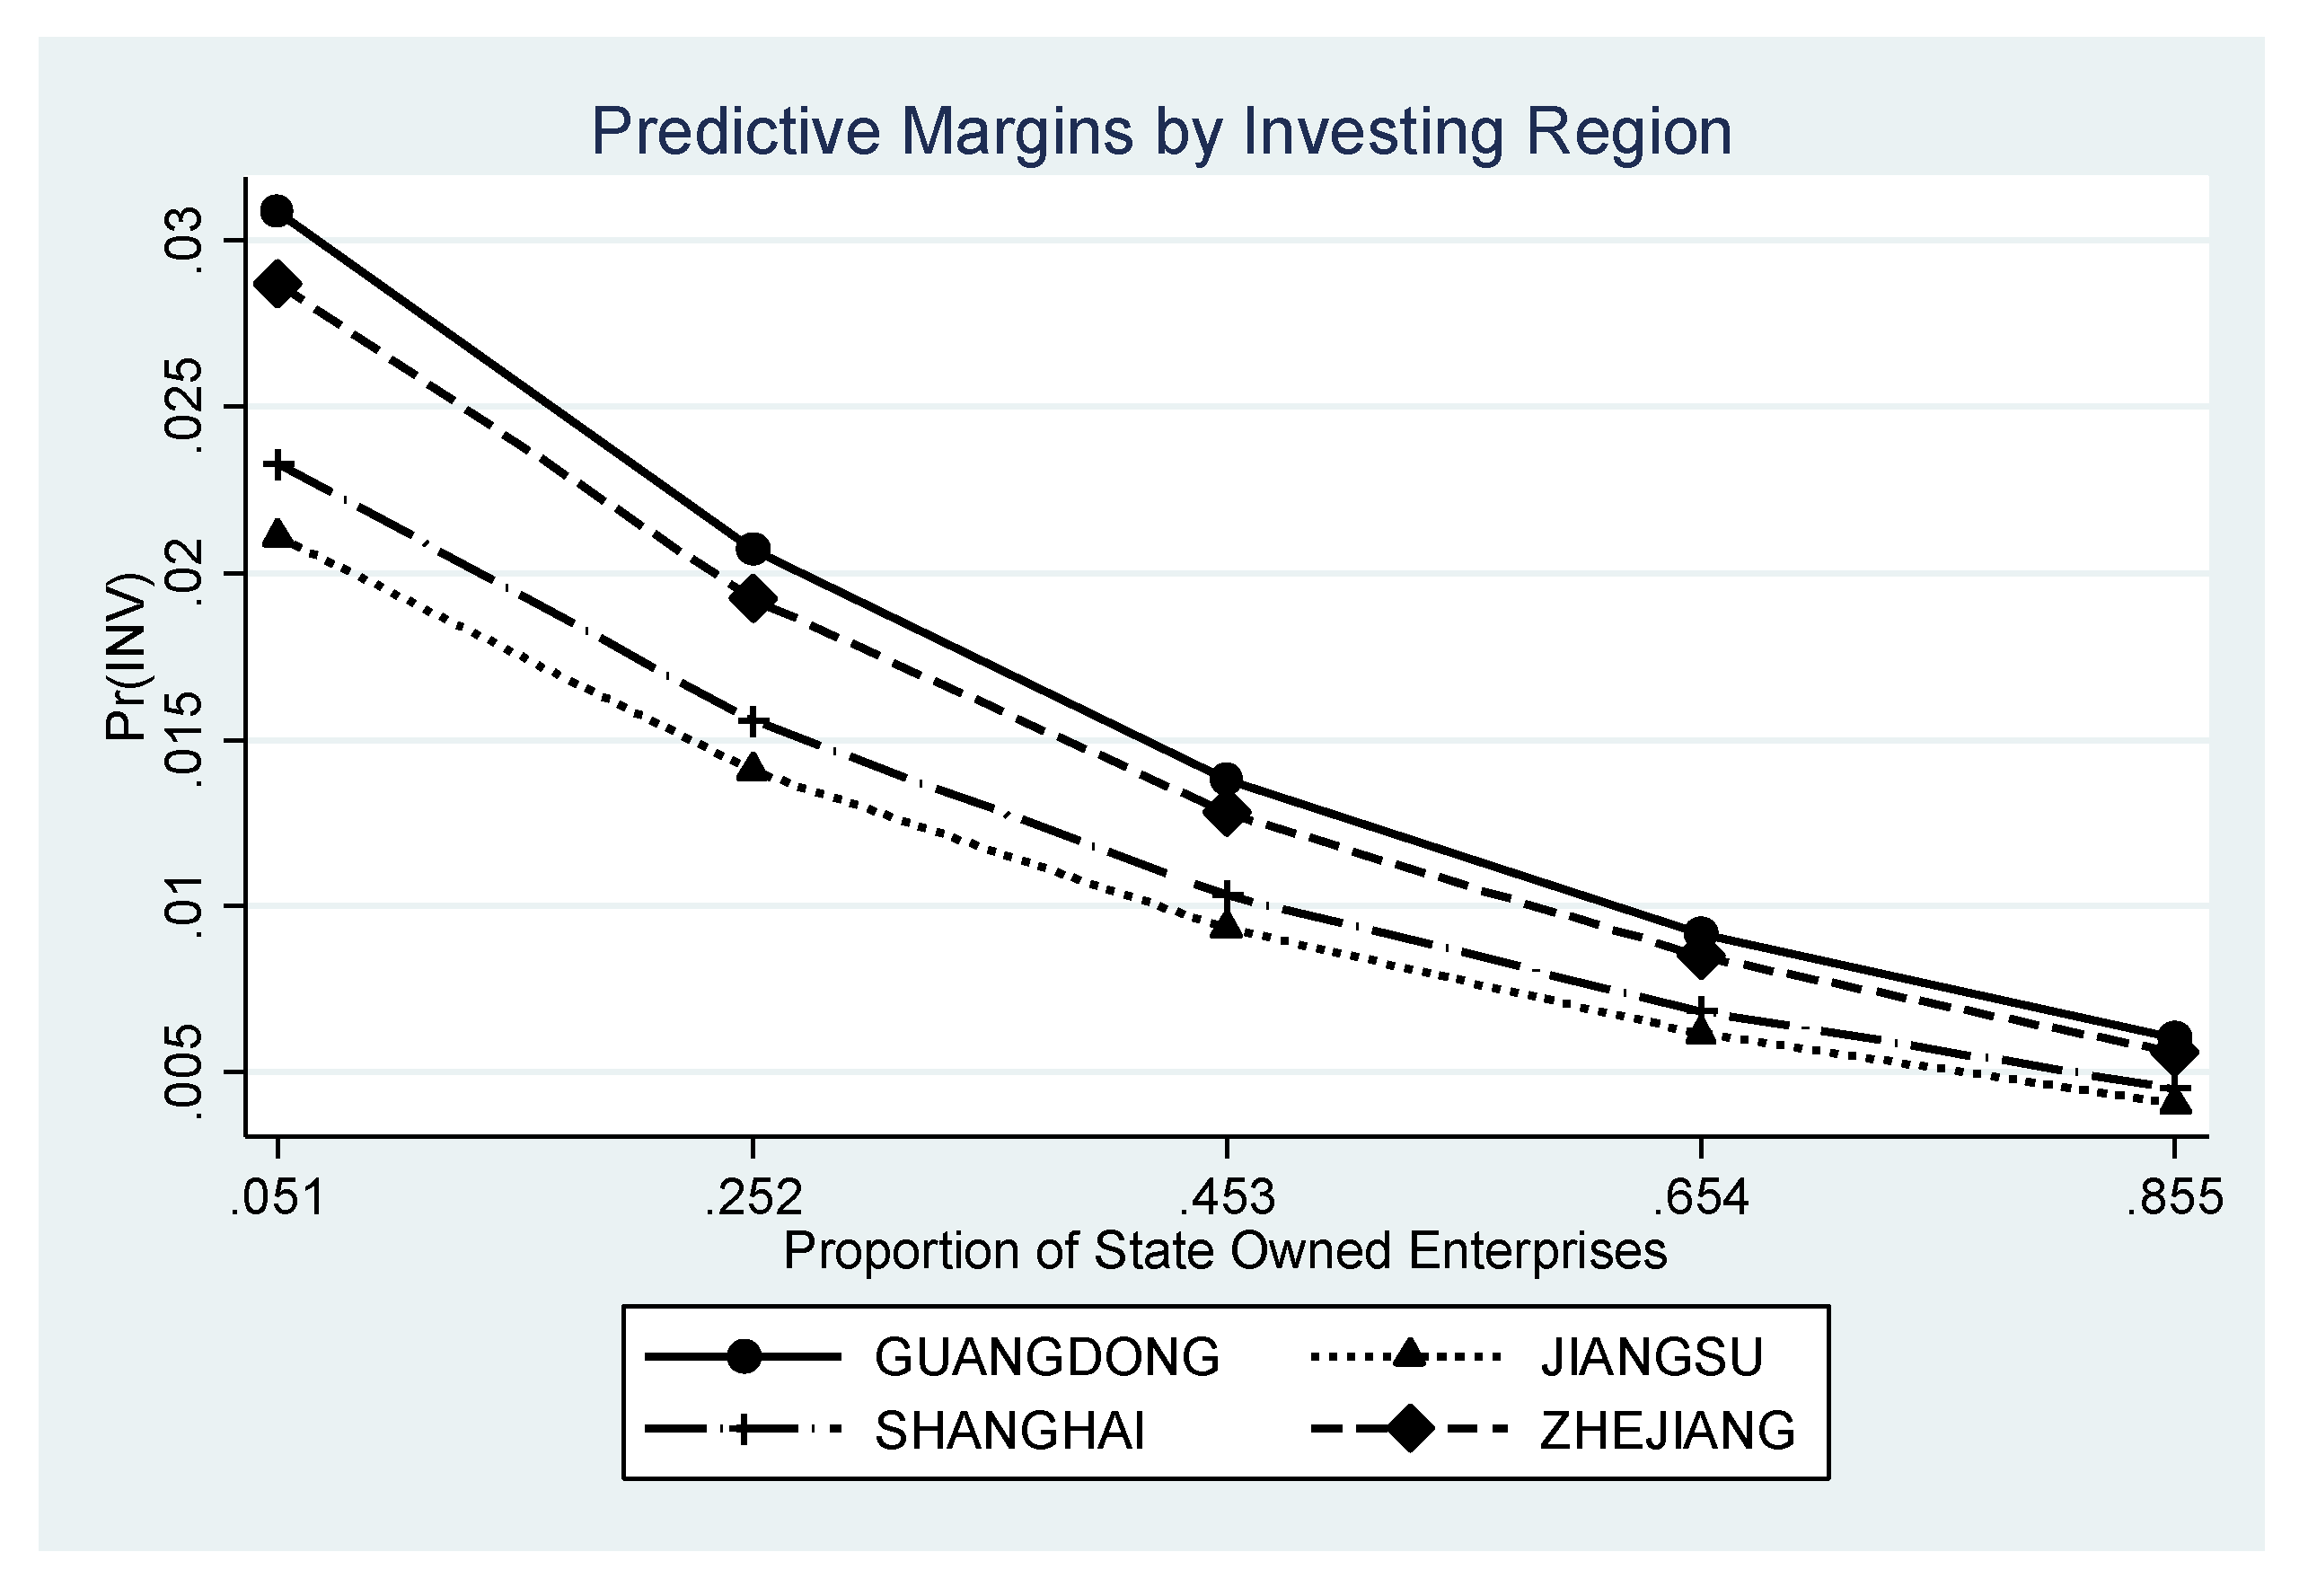
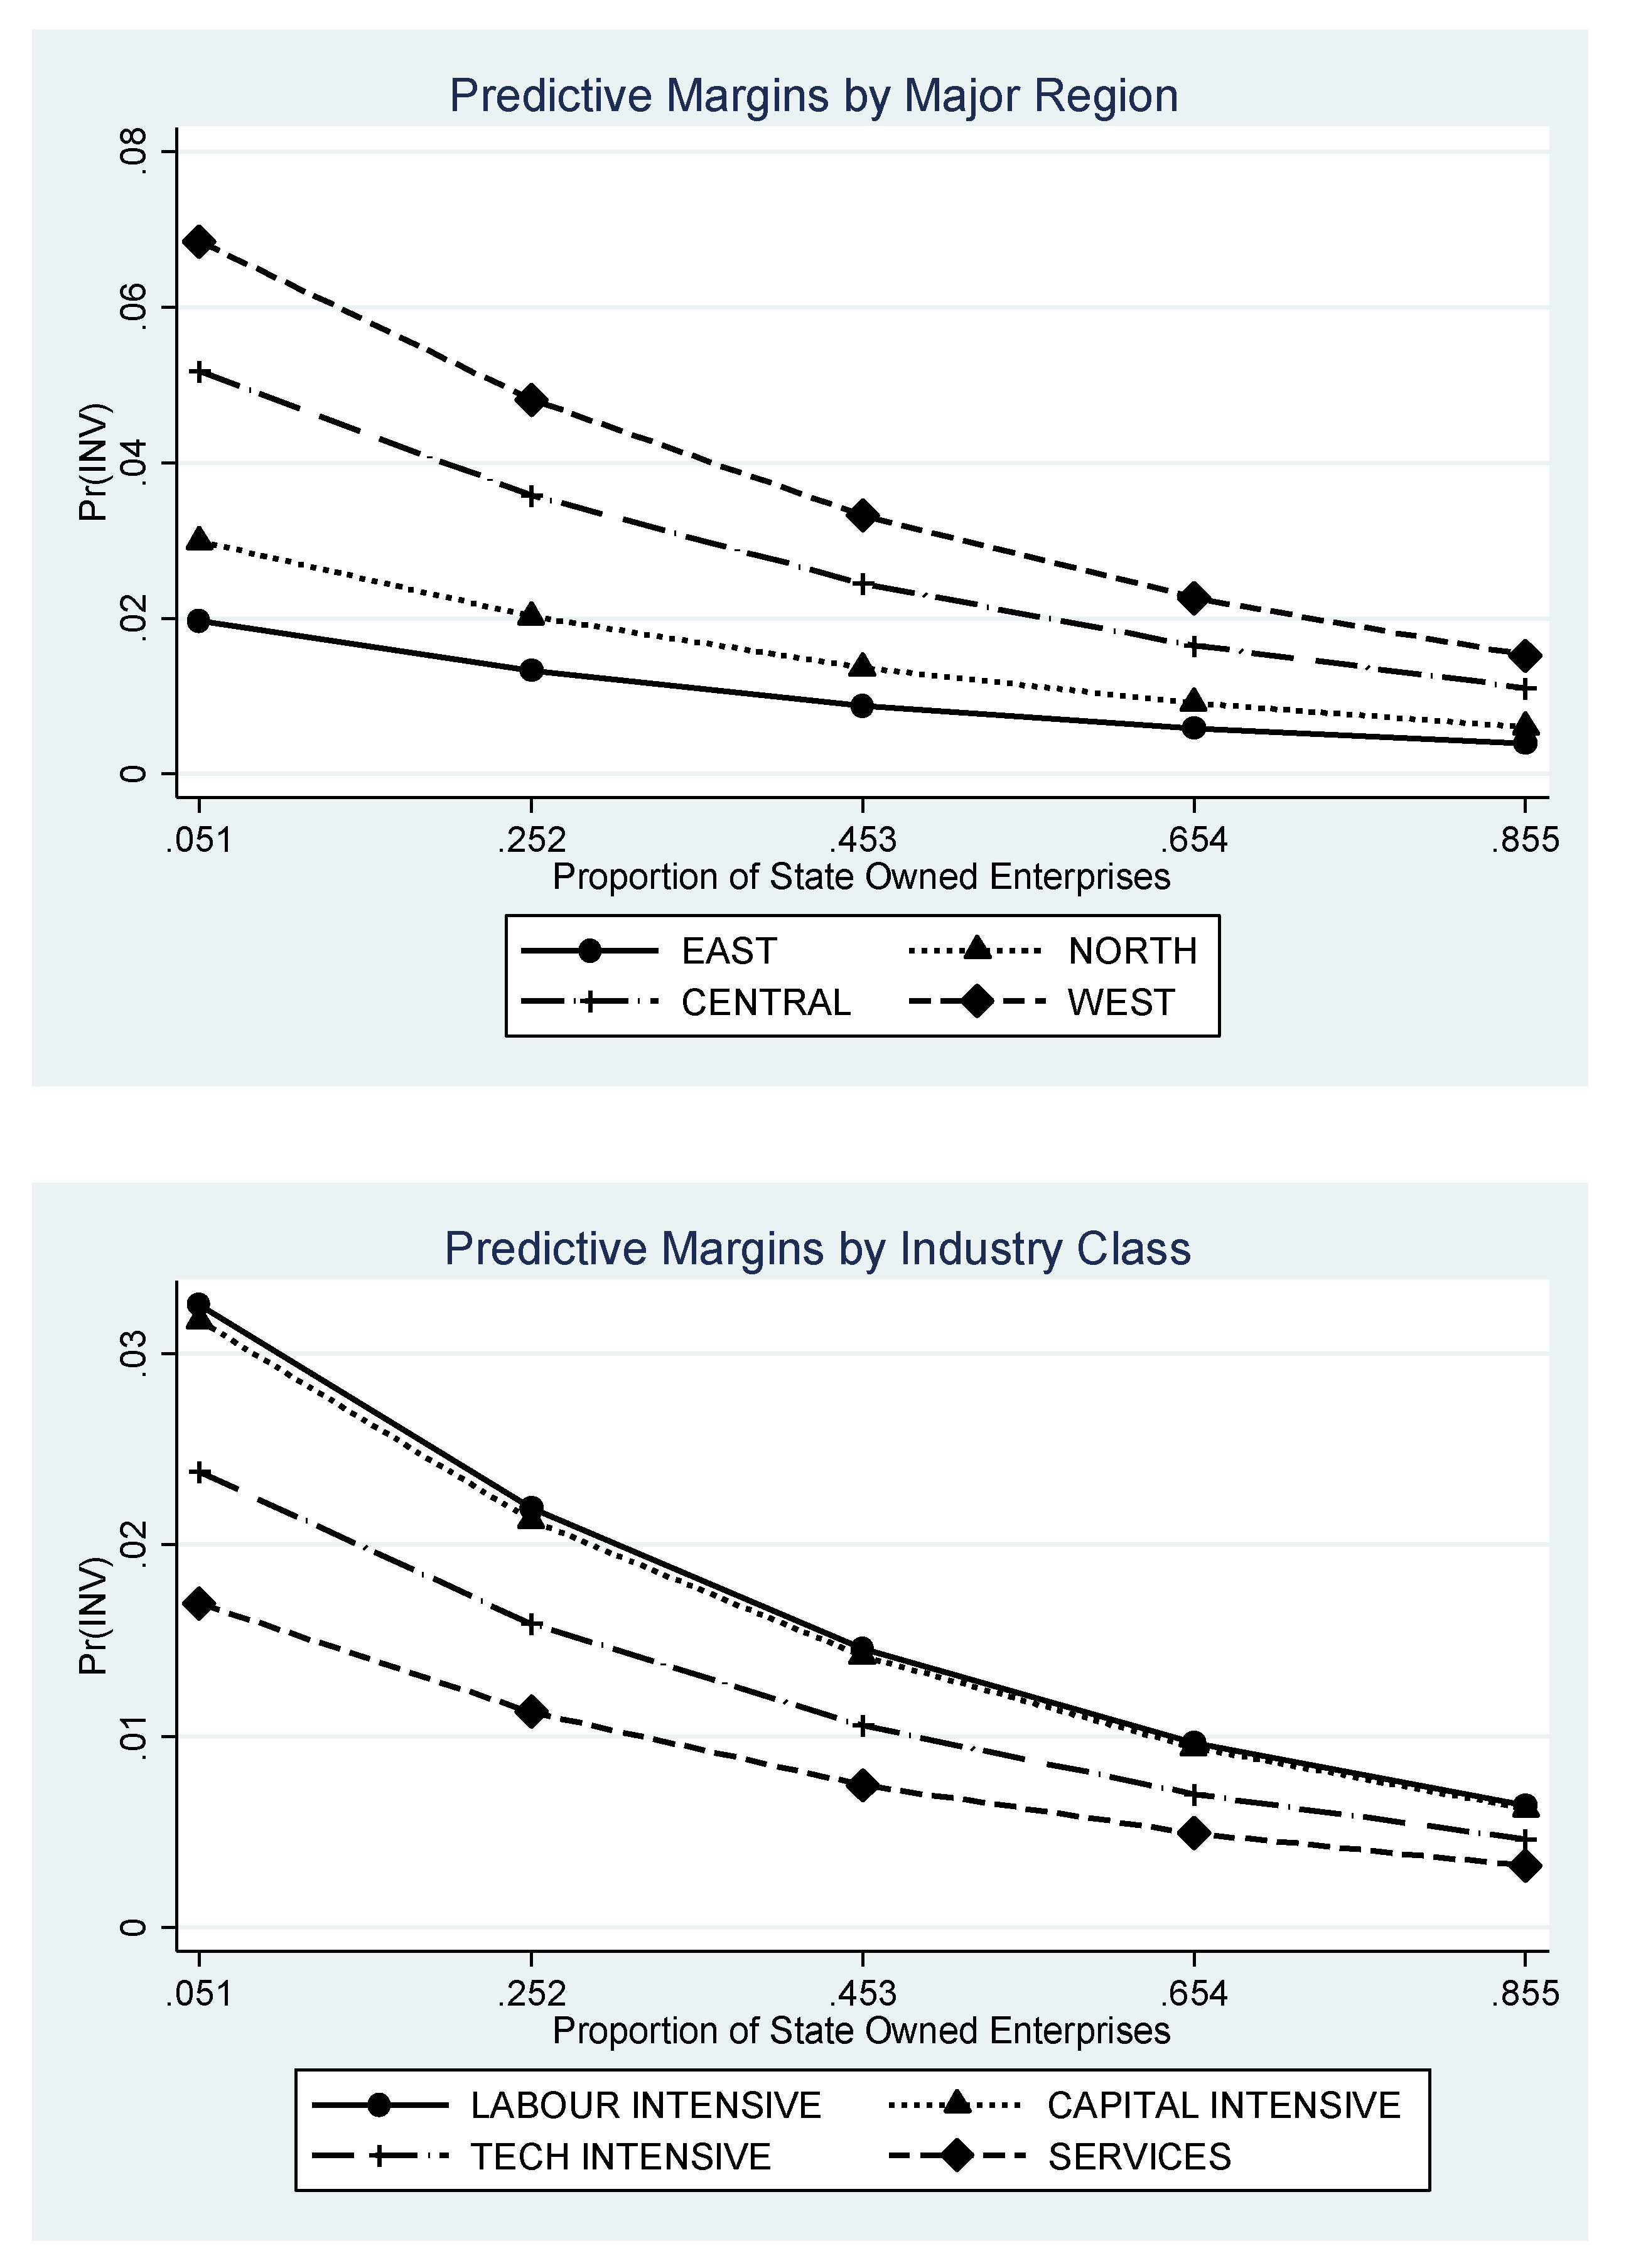
  • Reducing government ownership of the means of production, particularly if the proportion of state-owned enterprises currently exceeds 45%, will also attract investment.
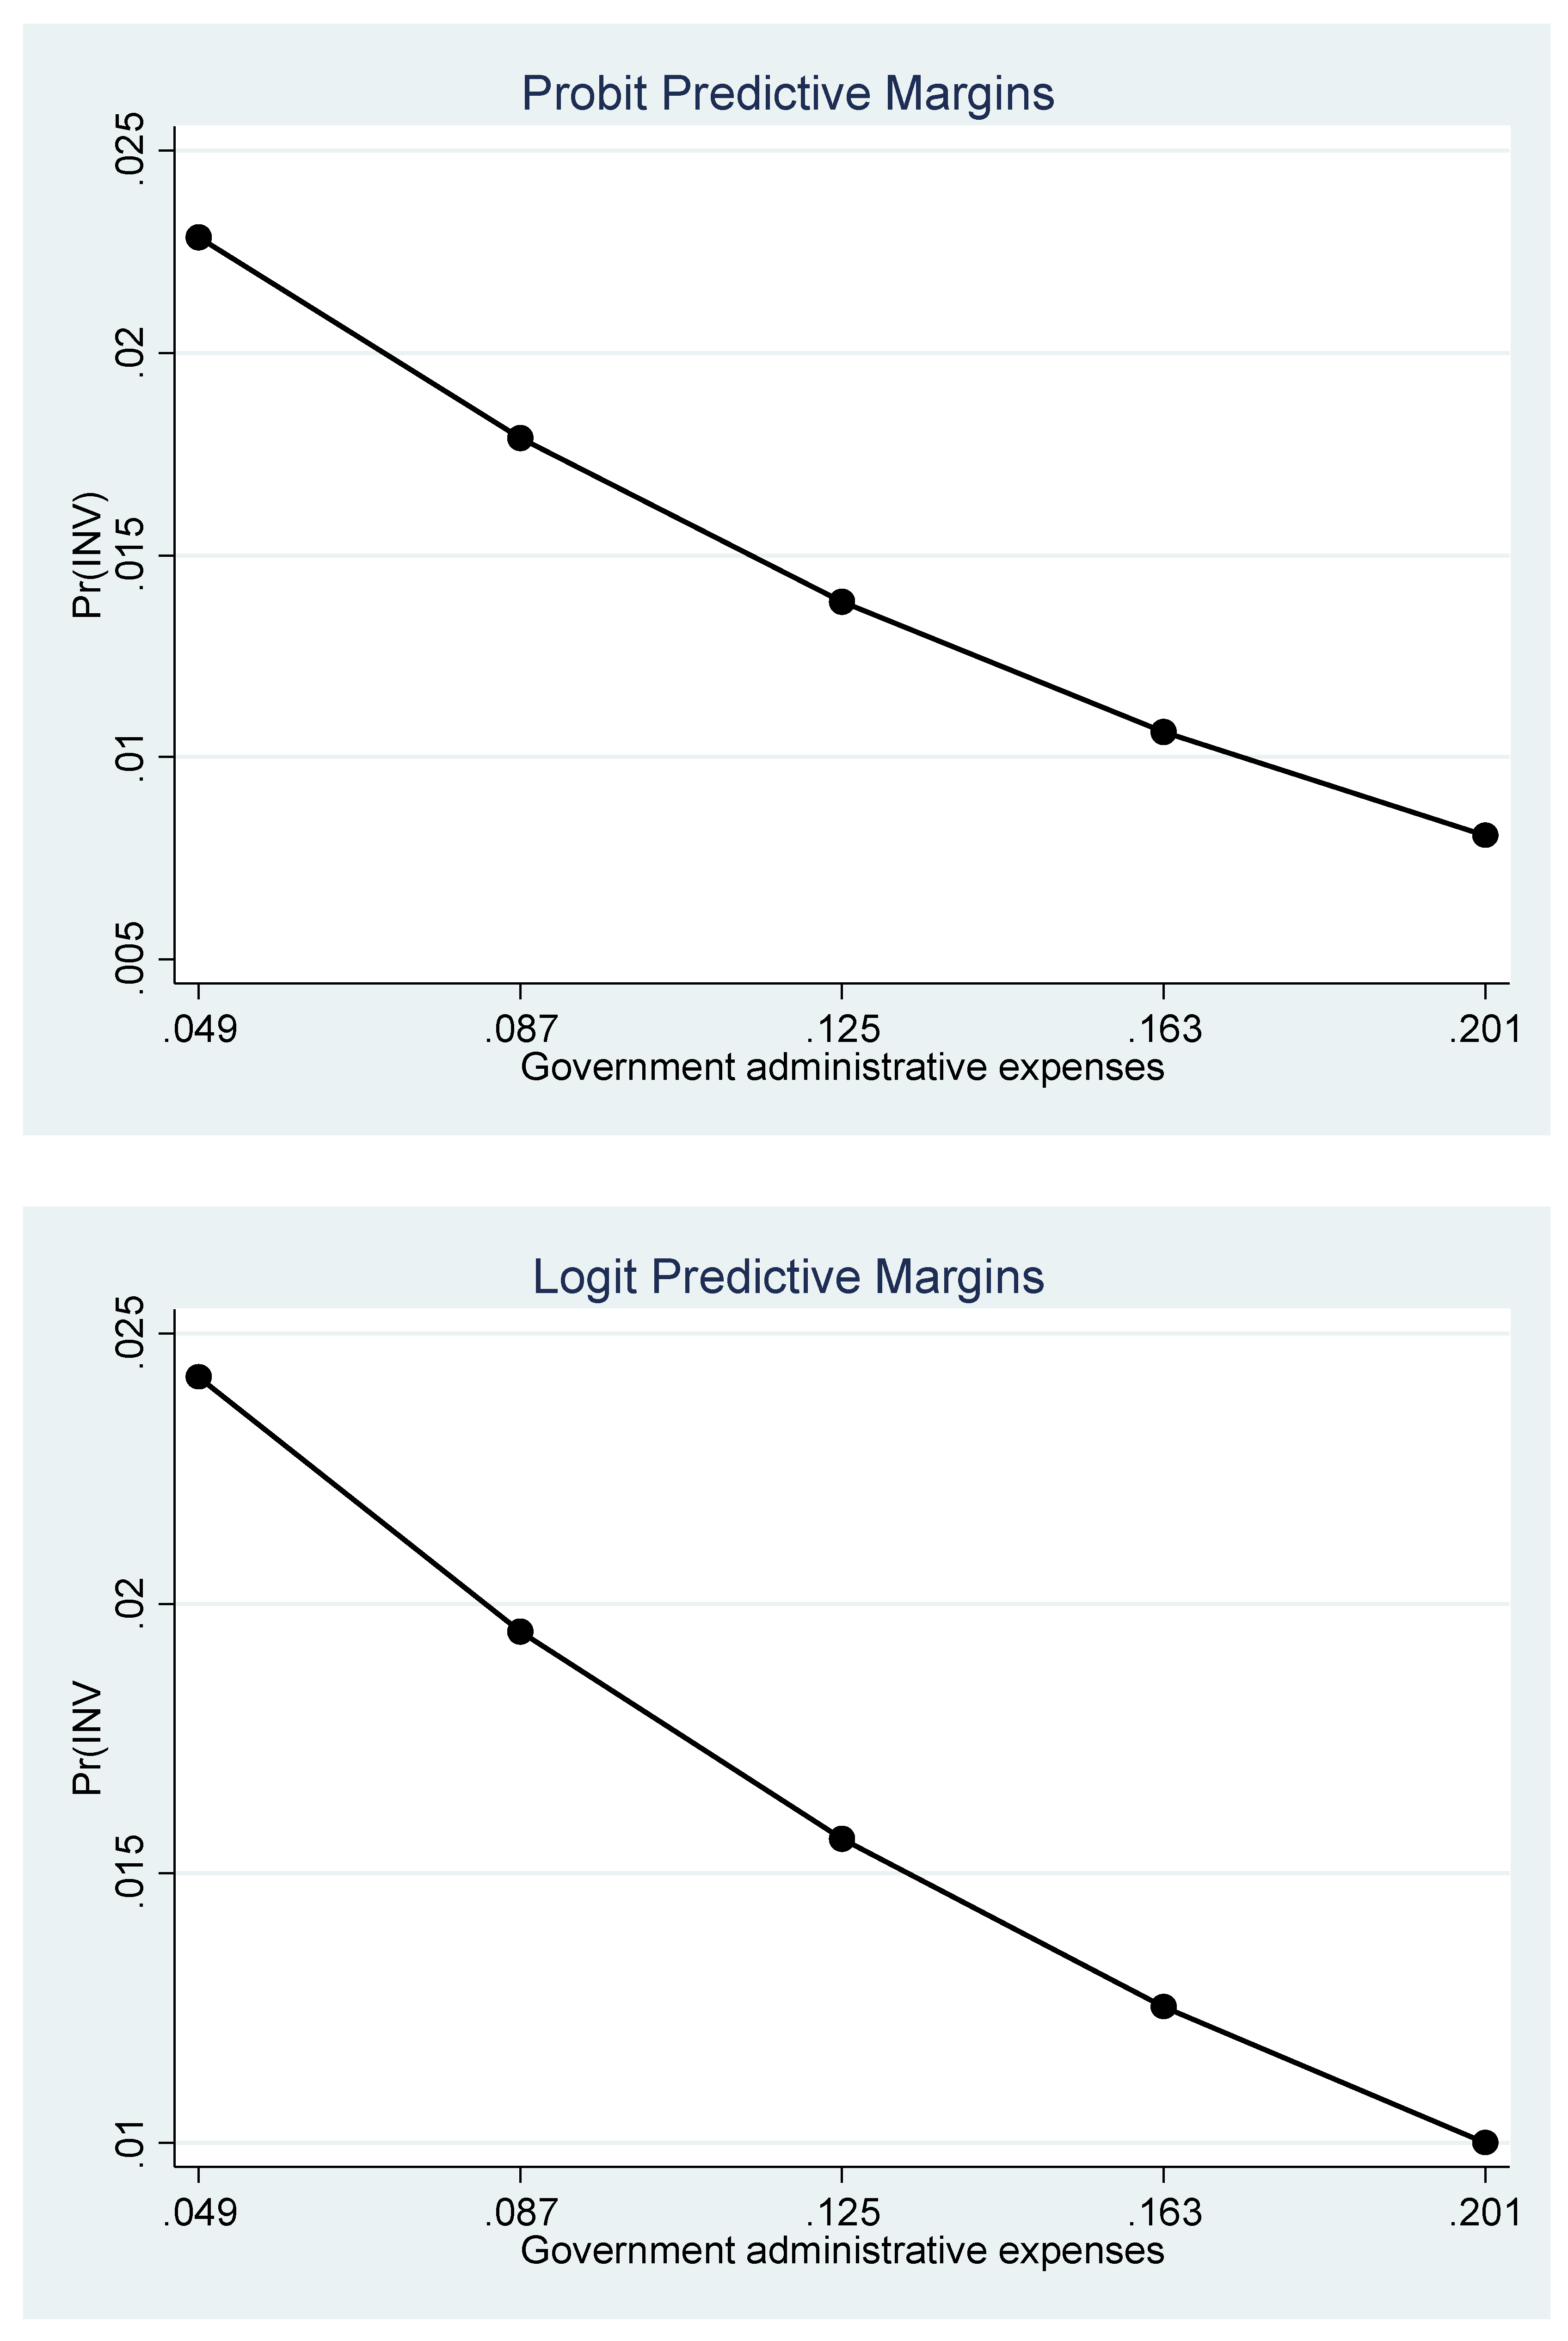
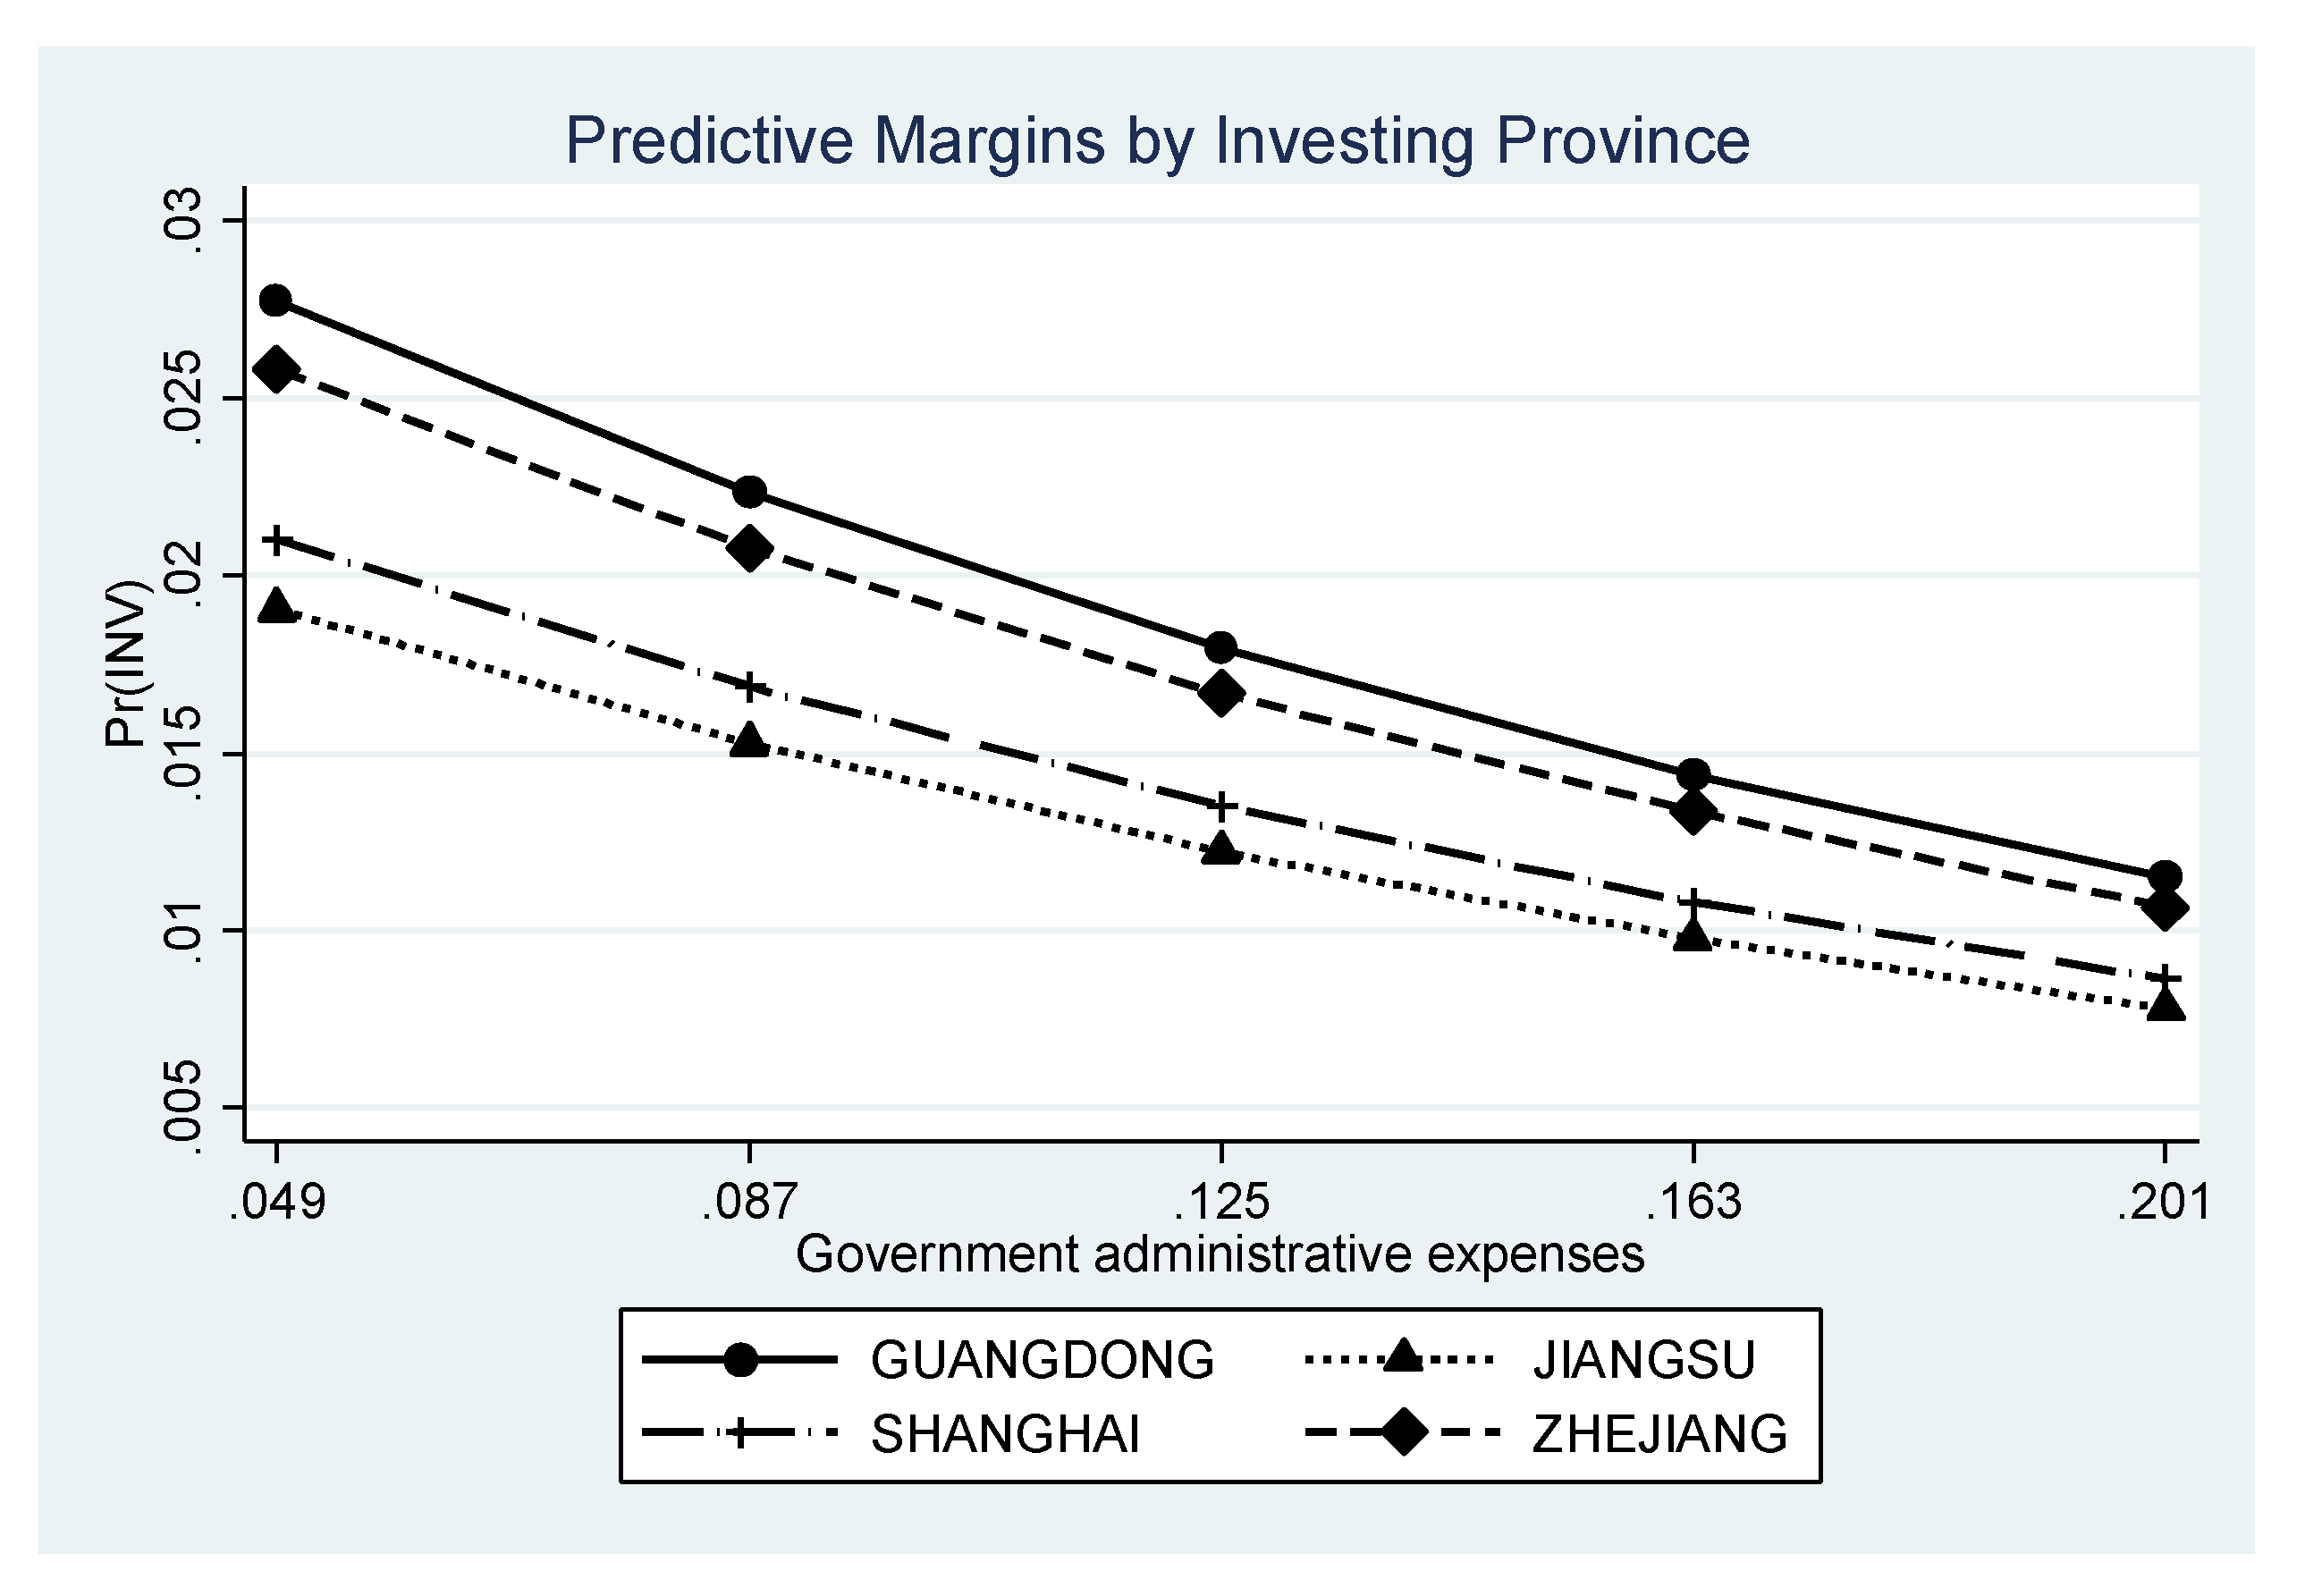
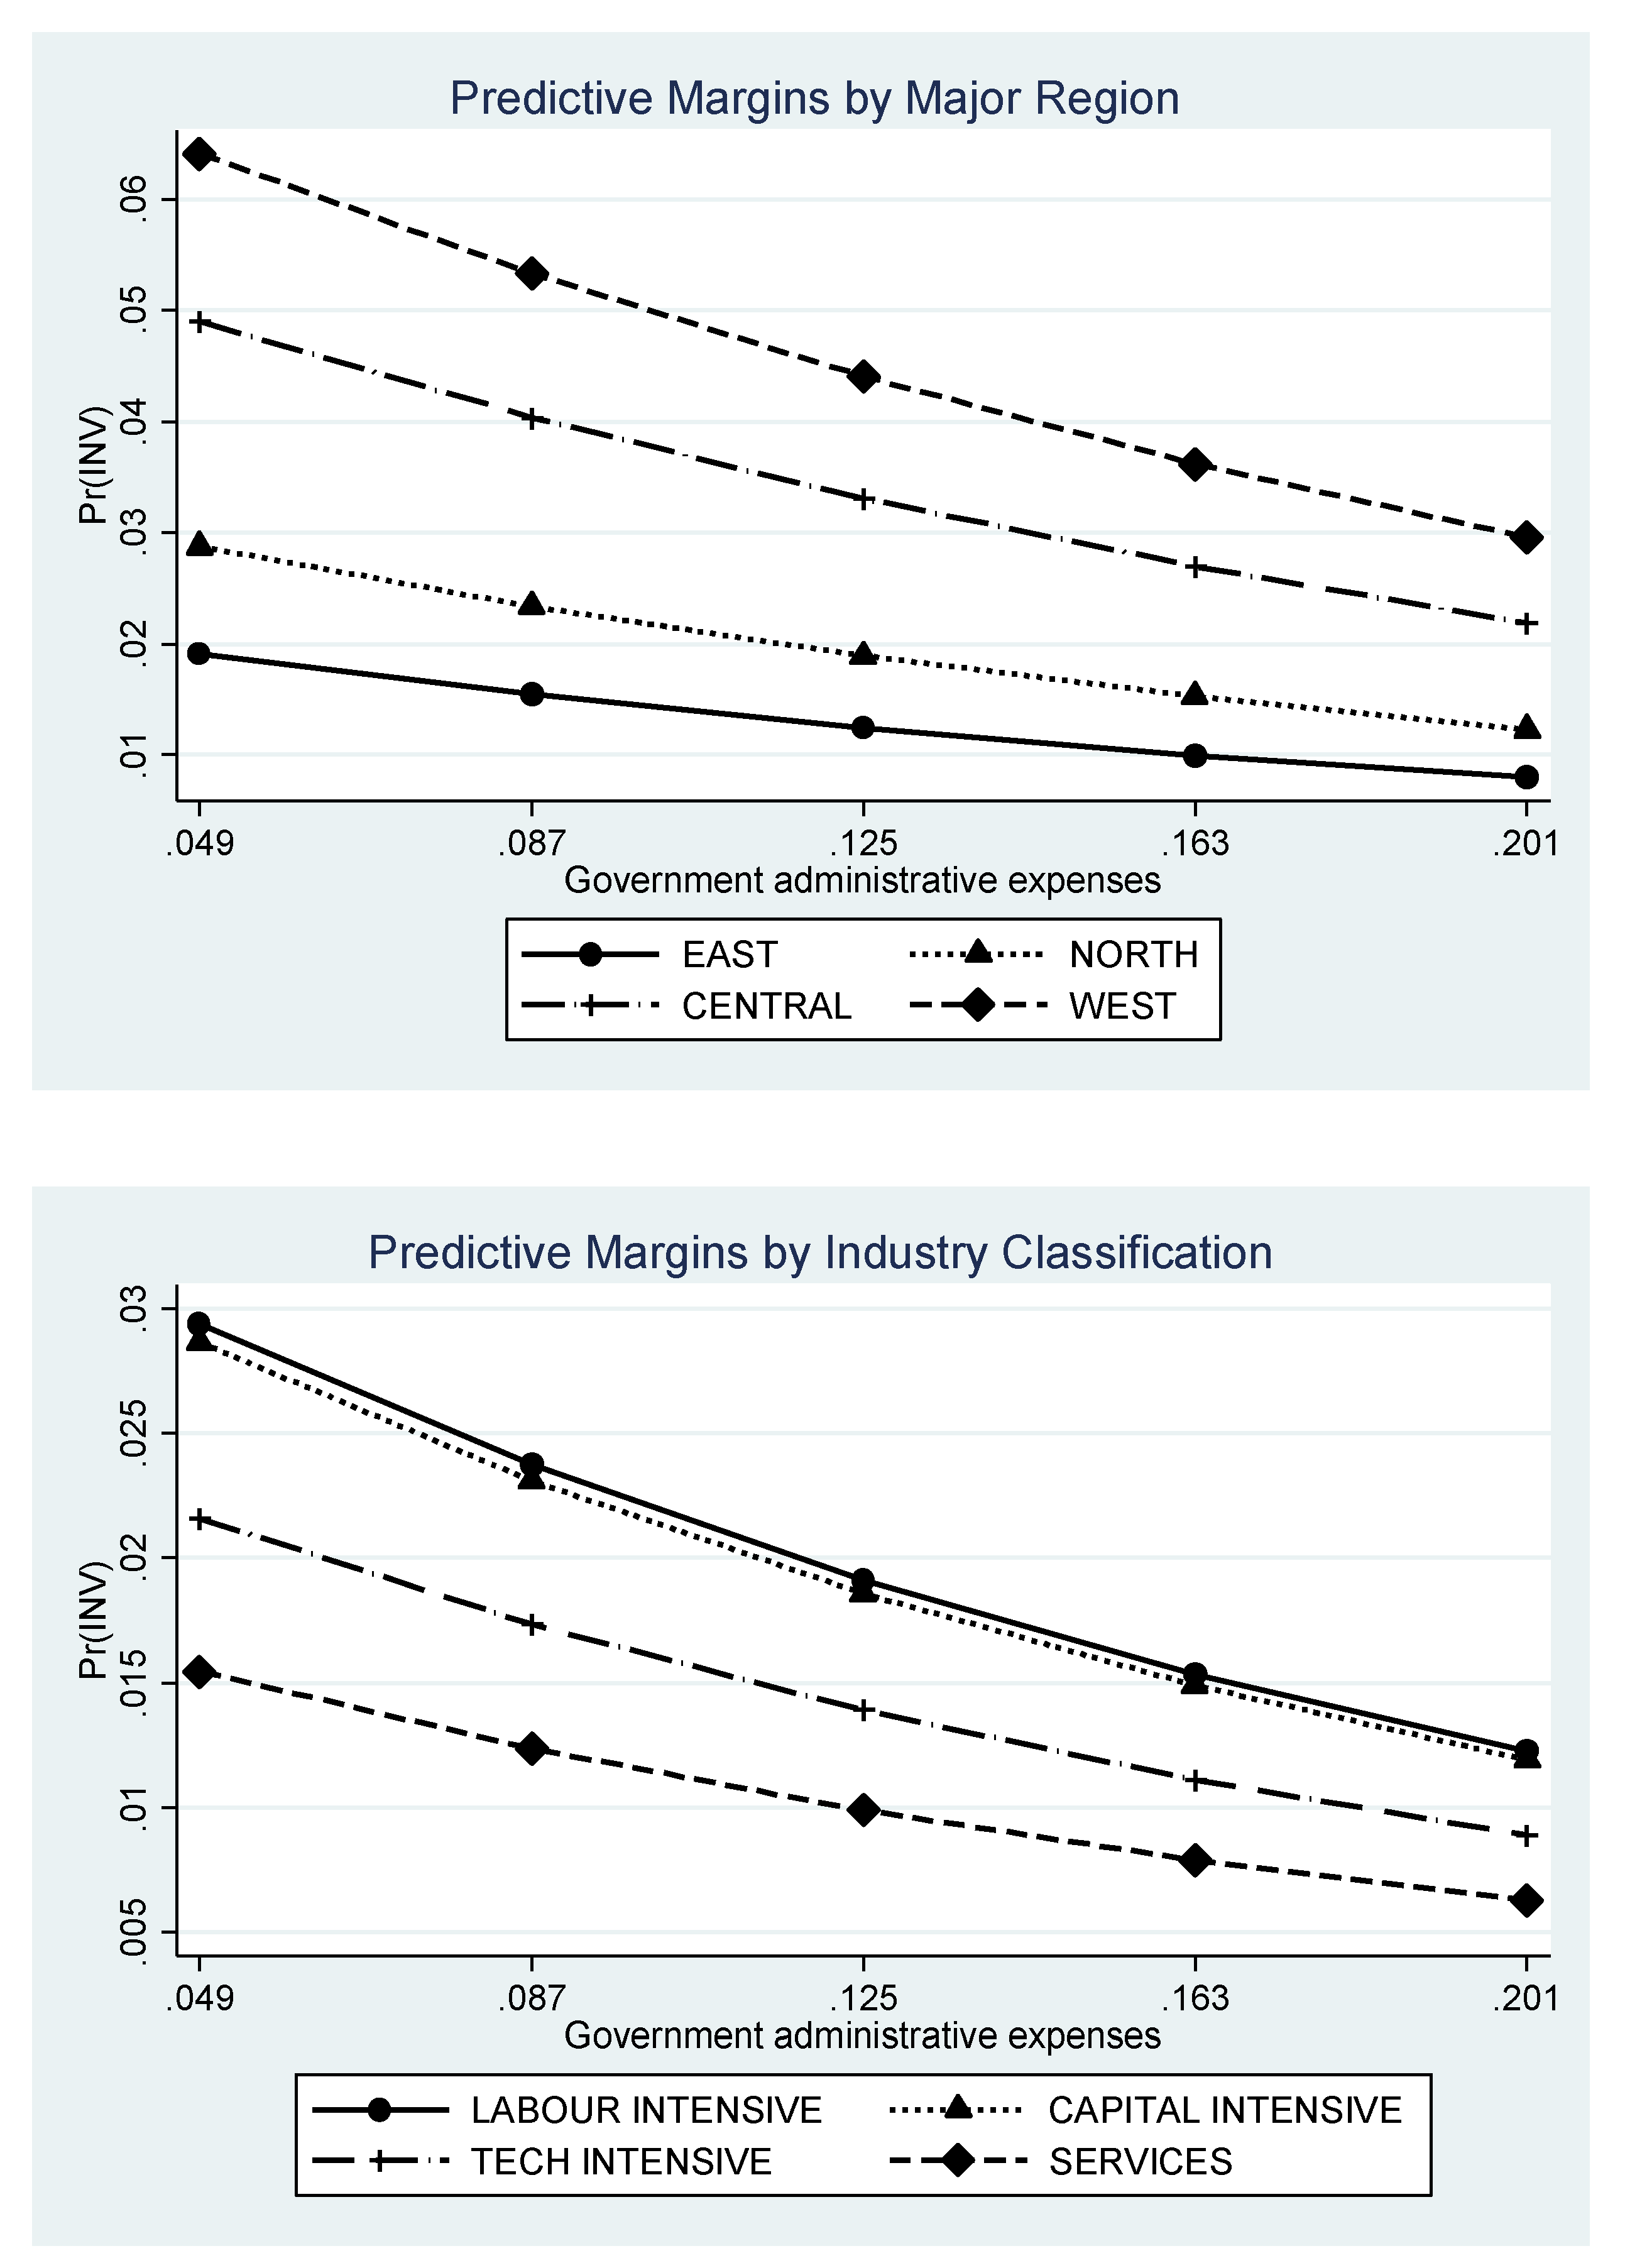
  • Reducing administrative burden, such as compliance costs, will pay dividends across the entire range of observed values, so it would be worthwhile to benchmark administrative performance against best practices.
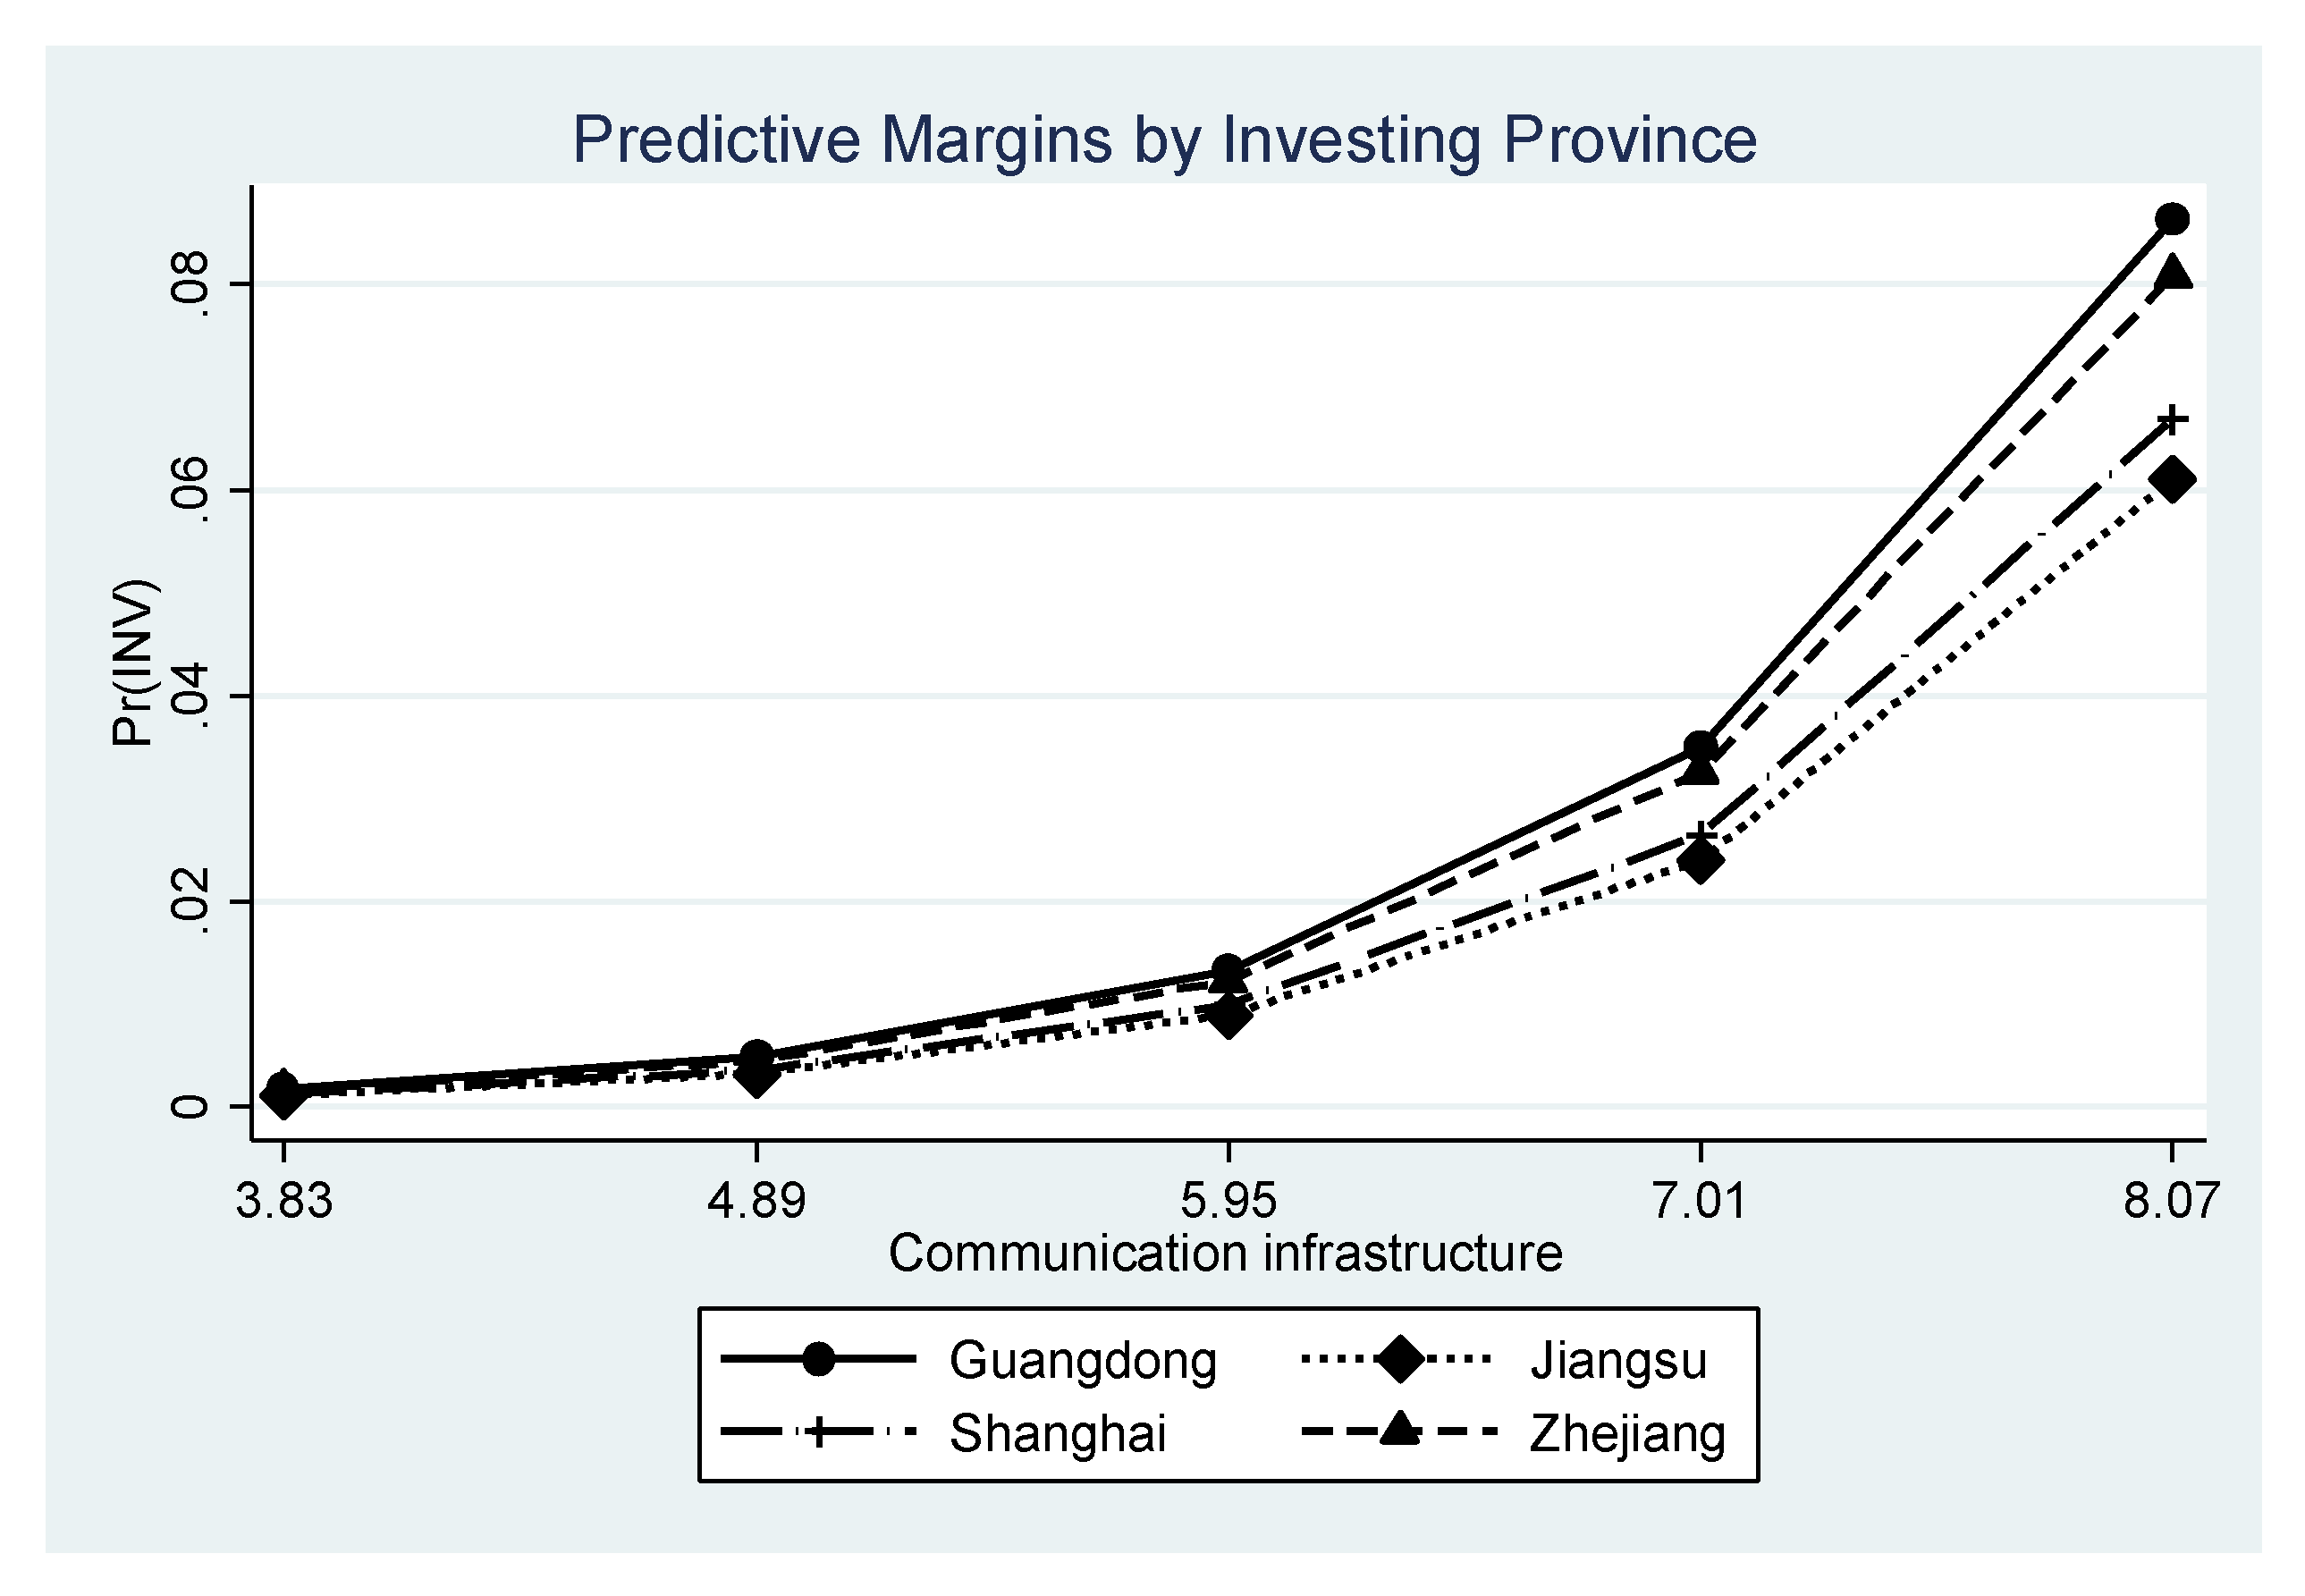
  • These points apply most strongly to the Central and Eastern provincial groupings.
  • Our results are in accord with some of the findings from the literature that we have reviewed above. Bjorvatn (2000) noted the importance of the provision of infrastructure. Becker and Fuest (2010) drew attention to how infrastructure provision interacts with government policy at both the national and regional levels. This point is important in the Chinese context as regional governments have a degree of autonomy over policies (Jin et al. 2005), which may lead to policy competition amongst regions cancelling out any positive effects, as noted by Head et al. (1999) in the US context. In summary, our main conclusion is that the most important contribution government can make to economic development in terms of attracting investment is to carefully consider its role. Our findings indicate that government should focus on the provision of public goods in the form of improved infrastructure while, at the same time, both reducing its role in direct ownership of productive activities and minimising the compliance costs of firms. That these findings remain relevant is underscored by the reform plans of the Third Plenum of the Chinese Communist Party in 2013, which noted “the need for markets to play a decisive role in allocating resources, as well as limiting government focus to effective regulation and preserving macroeconomic stability, rather than micromanaging economic decisions” (Dieppe et al. 2018, p. 30).

Author Contributions

Conceptualization, R.S. and S.A.; methodology, R.S. and W.R.J.A.; validation, R.S., S.A. and W.R.J.A.; formal analysis, W.R.J.A. and R.S.; data curation, R.S.; writing—original draft preparation, R.S.; writing—review and editing: W.R.J.A. and S.A., supervision, S.A. All authors have read and agreed to the published version of the manuscript.

Funding

Ruicong Sang acknowledges funding from the Ministry of Education Humanities and Social Sciences Youth Project, Project Name: Dynamic Evolution Mechanism of China’s Export Product Structure and Its Impact on Economic Performance, 19YJC790107.

Informed Consent Statement

Not applicable.

Data Availability Statement

The data presented in this study are available on request from the corresponding author.

Acknowledgments

We are grateful to the editor and three anonymous referees who provided insightful comments which have improved the paper. An earlier version of this paper (entitled “Regional Policy and Industrial Relocation in China: A Panel Data Analysis) was presented to the International Conference on Economic Modelling (EcoMod 2016) held in Lisbon, Portugal.

Conflicts of Interest

The authors declare no conflict of interest.

References

  1. Akamatsu, Kastuya. 1962. A Historical Pattern of Economic Growth in Developing Countries. The Developing Economies 1: 3–25. [Google Scholar] [CrossRef]
  2. Baldwin, Richard E., and Toshihiro Okubo. 2006. Heterogeneous Firms, Agglomeration and Economic Geography: Spatial Selection and Sorting. Journal of Economic Geography 6: 323–46. [Google Scholar] [CrossRef]
  3. Becker, Johannes, and Clemens Fuest. 2010. EU regional policy and tax competition. European Economic Review 54: 150–61. [Google Scholar] [CrossRef]
  4. Bjorvatn, Kjetil. 2000. Urban Infrastructure and Industrialization. Journal of Urban Economics 48: 205–18. [Google Scholar] [CrossRef]
  5. Brouwer, Aleid E., Ilaria Mariotti, and Jos N. van Ommeren. 2004. The Firm Relocation Decision: An Empirical Investigation. The Annals of Regional Science 38: 335–47. [Google Scholar] [CrossRef]
  6. Carlsen, Fredrik, Bjork Langset, and Jorn Rattso. 2005. The relationship between firm mobility and tax level; Empirical evidence of fiscal competition between local governments. Journal of Urban Economics 58: 273–88. [Google Scholar] [CrossRef]
  7. Chen, Chung, Lawrence Chang, and Yimin Zhang. 1995. The role of foreign direct investment in China’s post-1978 economic development. World Development 23: 691–703. [Google Scholar] [CrossRef]
  8. Cheng, Shaoming, and Roger R. Stough. 2006. Location decisions of Japanese new manufacturing plants in China: A discrete choice analysis. Annals of Regional Science 40: 369–87. [Google Scholar] [CrossRef]
  9. China Statistics Press (Various Dates). n.d. Available online: https://ceidata.cei.cn/ (accessed on 3 October 2022).
  10. Devereux, Michael P., and Rachel Griffith. 1998. Taxes and the location of production: Evidence from a panel of US multinationals. Journal of Public Economics 68: 335–67. [Google Scholar] [CrossRef]
  11. Devereux, Michael P., and Rachel Griffith. 2002. The impact of corporate taxation on the location of capital: A review. Swedish Economic Policy Review 9: 79–102. [Google Scholar] [CrossRef]
  12. Devereux, Micalel P., Rachel Griffith, and Helen Simpson. 2007. Firm Location Decisions, Regional Grants and Agglomeration Externalities. Journal of Public Economics 91: 413–35. [Google Scholar] [CrossRef]
  13. Dieppe, Alistair, Robert Gilhooly, Jenny Han, Iikka Korhonen, and David Lodge. 2018. The transition of China to sustainable growth–implications for the global economy and the euro area. ECB Occasional Paper 206. [Google Scholar] [CrossRef]
  14. Ethier, Wilfrid J. 1982. National and International Returns to Scale in the Modern Theory of International Trade. American Economic Review 72: 389–405. [Google Scholar]
  15. Fazzari, Steven, R. Glenn Hubbard, and Bruce Petersen. 1988. Financing constraints and corporate investment. Brookings Papers on Economic Activity 1988: 141–206. [Google Scholar] [CrossRef]
  16. Garnaut, Ross, Ligang Song, and Cai Fang. 2018. China’s 40 Years of Reform and Development: 1978–2018. Canberra: Australian National University Press. [Google Scholar]
  17. Global Enterprise Library (Various Dates). n.d. Available online: https://www.wind.com.cn/portal/zh/GEL/index.html (accessed on 7 October 2022).
  18. Guariglia, Alessandra, and Junhong Yang. 2016. A balancing act: Managing financial constraints and agency costs to minimize investment inefficiency in the Chinese market. Journal of Corporate Finance 36: 111–30. [Google Scholar] [CrossRef]
  19. Harris, Chauncy D. 1954. The market as a factor in the localization of production. Annals of the Association of American Geographers 44: 315–48. [Google Scholar]
  20. Head, C. Keith, John C. Riesa, and Deborah L. Swenson. 1999. Attracting foreign manufacturing: Investment promotion and agglomeration. Regional Science and Urban Economics 29: 197–218. [Google Scholar] [CrossRef]
  21. HKTDC. 2014. New Bridge and Pearl River Delta West (3): Industrial Relocation. Available online: http://hkmb.hktdc.com/en/1X0A0PKD/hkdtc-research/New-Bridge-and-Pearl-River-Delta-West-3_Industrial-Relocation (accessed on 9 September 2022).
  22. Holl, Adelheid. 2004. Transport Infrastructure, Agglomeration Economies, and Firm Birth: Empirical Evidence from Portugal. Journal of Regional Science 44: 693–712. [Google Scholar] [CrossRef]
  23. Holmes, Thomas J. 1998. The effect of state policies on the location of manufacturing: Evidence from state borders. Journal of Political Economy 106: 667–705. [Google Scholar] [CrossRef]
  24. Huang, Nancy, Joie Ma, and Kyle Sullivan. 2010. Economic development policies for Central and Western China. China Business Review 37: 24. [Google Scholar]
  25. Jin, Hehui, Yingyi Qian, and Barry R. Weingast. 2005. Regional Decentralization and Fiscal Incentives: Federalism. Chinese Style. Journal of Public Economics 89: 1719–42. [Google Scholar] [CrossRef]
  26. Kojima, Kyoshi. 1978. Direct Foreign Investment: A Japanese Model of Multinational Business Operations. New York: Praeger. [Google Scholar]
  27. Krugman, Paul. 1991. Increasing returns and economic geography. Journal of Political Economy 99: 483–99. [Google Scholar] [CrossRef]
  28. Krugman, Paul. 1998a. Space: The Final Frontier. Journal of Economic Perspectives 12: 161–74. [Google Scholar] [CrossRef]
  29. Krugman, Paul. 1998b. What’s new about the new economic geography? Oxford Review of Economic Policy 14: 7–17. [Google Scholar] [CrossRef]
  30. Krugman, Paul, and Anthony J. Venables. 1998. Globalization and the inequality of nations. Quarterly Journal of Economics 110: 857–80. [Google Scholar] [CrossRef]
  31. Lv, Ping, and Francesca Spigarelli. 2016. The determinants of location choice. Chinese foreign direct investments in the European renewable energy sector. International Journal of Emerging Markets 11: 333–56. [Google Scholar] [CrossRef]
  32. Martin, Phillipe, and Carol Ann Rogers. 1995. Industrial location and Public Infrastructure. Journal of International Economics 39: 333–51. [Google Scholar] [CrossRef]
  33. Modigliani, Franco, and Merton H. Miller. 1958. The cost of capital, corporation finance and the theory of investment. American Economic Review 48: 261–97. [Google Scholar]
  34. National Bureau of Statistics of China (Various Dates). n.d. Available online: http://www.stats.gov.cn/sj/zgtjnj/ (accessed on 12 July 2022).
  35. Owens, Raymond E., and Pierre-Daniel Sarte. 2002. Analyzing Firm Location Decisions: Is Public Intervention Justified? Journal of Public Economics 86: 223–33. [Google Scholar] [CrossRef]
  36. Ploberger, Christian. 2017. One Belt, One Road—China’s new grand strategy. Journal of Chinese Economic and Business Studies 15: 289–305. [Google Scholar] [CrossRef]
  37. Quer, Diego, Enrique Claver, and Laura Rienda. 2018. The influence of political risk, inertia and imitative behavior on the location choice of Chinese multinational enterprises. Does state ownership matter? International Journal of Emerging Markets 13: 518–35. [Google Scholar] [CrossRef]
  38. Shanghai Stock Exchange (Various Dates). n.d. Available online: http://www.sse.com.cn/disclosure/listedinfo/regular/ (accessed on 6 July 2022).
  39. Su, Yaqin, and Zhiqiang Liu. 2016. The Impact of Foreign Direct Investment and Human Capital on Economic Growth: Evidence from Chinese Cities. China Economic Review 37: 97–109. [Google Scholar] [CrossRef]
  40. Wagner, Joachim. 2011. Offshoring and Firm Performance: Self-Selection, Effects on Performance, or Both? Review of World Economics 147: 217–47. [Google Scholar] [CrossRef]
  41. Wan, Guanghua, Ming Lu, and Zhao Chen. 2007. Globalization and regional income inequality: Empirical evidence from within China. Review of Income and Wealth 53: 35–59. [Google Scholar] [CrossRef]
  42. Wang, Yunfei, and Hong Zhang. 2016. Globalization and Economic Development in China. In Globalization and Development Volume II: Country Experiences. Edited by Shigeru Thomas Otsubo. Oxford: Routledge. [Google Scholar]
  43. Western Development Strategy. 2012. Western Development: The Twelfth Five Year Plan. Available online: www.ce.cn (accessed on 30 June 2022).
  44. Williams, Richard. 2012. Using the margins command to estimate and interpret adjusted predictions and marginal effects. The Stata Journal 12: 308–31. [Google Scholar] [CrossRef]
  45. Wooldridge, Jeffrey M. 2013. Introductory Econometrics, 5th ed. Mason: South-Western. [Google Scholar]
  46. Yeh, E. T., and E. Wharton. 2016. Going West and Going Out: Discourses, migrants, and models in Chinese development. Eurasian Geography and Economics 57: 286–315. Available online: https://www.tandfonline.com/doi/abs/10.1080/15387216.2016.1235982 (accessed on 10 August 2022). [CrossRef]
  47. Zeng, Douglas Zhihua. 2011. How do special economic zones and industrial clusters drive China’s rapid development? In Policy Research Working Paper. No. WPS 5583. Washington, DC: World Bank Group. Available online: http://documents.worldbank.org/curated/en/310891468018256346/How-do-special-economic-zones-and-industrial-clusters-drive-Chinas-rapid-development (accessed on 7 October 2022).
  48. Zhang, Tinglin, Bindong Sun, Yinyin Cai, and Rui Wang. 2019. Government fragmentation and economic growth in China’s cities. Urban Studies 56: 1850–64. [Google Scholar] [CrossRef]
Figure 1. Predicted probabilities with INC at mean and plus or minus two SDs.
Economies 11 00150 g001
Figure 2. Predicted probabilities with SOE at mean and plus or minus two SDs.
Economies 11 00150 g002
Figure 3. Predicted probabilities with ADM at mean and plus or minus two SDs.
Economies 11 00150 g003
Figure 4. Predicted probabilities of INC by INVREG, MAJOREG, and INDYCLASS.
Economies 11 00150 g004aEconomies 11 00150 g004b
Figure 5. Predicted probabilities of SOE by INVREG, MAJOREG, and INDYCLASS.
Economies 11 00150 g005aEconomies 11 00150 g005b
Figure 6. Predicted probabilities of ADM by INVREG, MAJOREG, and INDYCLASS.
Economies 11 00150 g006aEconomies 11 00150 g006b
Table 1. Drivers of a firm’s investment decision.
CategoryMeasures
Government policiesInfrastructure provision
Tax burden
State-owned enterprise proportion
Administrative expenses
Market-related factorsLabour cost
Land cost
Export share
Market size
Firm-specific characteristicsSize
Profitability
Capital structure
Table 2. Variable Definitions.
NameDefinition
INVjiktDependent variable measuring industrial relocation; takes the value 1 if company j in region i invests in region k at time t; otherwise, 0.
Local government GOVEach variable measured for region k at time t.
INTRegional transport infrastructure, measured as regional road density in km of highway/surface area of region (km/km2).
INCRegional telecommunications infrastructure, measured as the natural log of the value of post and telecommunications infrastructure (CNY billion).
TAXRegional tax burden, measured as the ratio of local taxes and surcharges to the value of regional industrial output.
SOEThe proportion of businesses in a region that are state-owned enterprises.
ADMAn index that measures the administrative expenses of the regional government as a fraction of the total.
Market characteristics MKTEach variable measured for region k at time t.
WGEThe natural log of the regional average wage as a measure of the cost of labour.
LNDThe natural log of the price of an average commercial house, which is a proxy for the cost of land.
EXPExports from the region as a share of regional GDP.
LMSA measure of local market size to capture potential demand.
L M S = ln { s r G D P s d r s 1 + G D P s r d r r 1 }
where GDPs is the gross domestic product of region s, GDPr is the gross domestic product of region r, drs is the distance between the two provinces, and d r r = 2 3 a r e a r π is the intra-province distance (with arear being the province’s area).
Firm characteristics FRMEach variable measured for firm j in region i at time t.
SZEFirm size, measured as the natural log of total assets.
ROAReturn on assets, as a measure of profitability, defined as net profit/total assets.
CAPCapital structure, measured as asset-to-liability ratio.
Categorical (Dummy) variables
INVREGLocation of the investing firms. 1: Guangdong. 2: Jiangsu. 3: Shanghai. 4: Zhejiang.
MAJORREGMajor provincial grouping receiving investment. 1: East. 2: North. 3: Central. 4: West.
INDYCLASSMajor industry classifications. 1: Labour-intensive industries. 2: Capital-intensive industries. 3: Technology-intensive industries. 4: Service industries.
YEARYear of observation (2000–2010).
Table 3. Summary Statistics.
VariableMeanStandard DeviationMinimumMaximum
INV0.0588378N/A01
INT0.64440560.42839690.02083431.900635
INC5.9512721.0645772.1633238.423625
TAX0.02112050.01825390.00577010.164441
SOE0.45382010.20179890.09209570.8910649
ADM0.12458570.03789190.03717120.2592029
WGE9.97530.49088118.84188211.18267
LND7.9636530.54720496.8554099.785942
EXP0.16924710.20441670.00525840.9051254
LMS5.769940.64632383.6471827.136748
SZE21.496681.06131217.9203326.1563
ROA0.04951360.06086820.52373610.3897035
CAP0.43851260.18807970.01272792.258085
Note: The panel is balanced; there are 24780 observations for each variable.
Table 4. Probit estimation of Equation (1).
VariableModel (1)Model (2)Model (3)
INT0.43660464 ***0.204002770.19796123
INC0.55900919 ***0.49505422 ***0.50471382 ***
TAX−4.279756 *−2.8156894−2.8311528
SOE−0.80141995 ***−1.0362848 ***−1.0465065 ***
ADM−4.801426 ***−3.1808374 **−3.2037023 **
WGE −0.44269669−0.43134058
LND 0.53034116 ***0.53366381 ***
EXP 0.377425870.38130881
LMS 0.3588615 **0.36748048 **
SZE 0.14014136 ***
ROA 0.32573334
CAP −0.02272468
constant−4.2348581 ***−5.8536407 ***−8.9992135 ***
Notes: * p < 0.05, ** p < 0.01, *** p < 0.001.
Table 5. Logit estimation of Equation (1).
VariableModel (1)Model (2)Model (3)
INT0.82950528 ***0.394313540.3805061
INC0.10590548 ***0.9438466 ***0.96150437 ***
TAX−8.7166736 *−5.709996−5.6842483
SOE−1.5437591 ***−2.0739192 ***−2.0983987 ***
ADM−9.1593013 ***−6.0791368 **−6.1234514 **
WGE −0.83200279−0.80745708
LND 1.0419983 ***1.0454238 ***
EXP 0.611541220.61585561
LMS 0.69001749 **0.70958825 **
SZE 0.26991016 ***
ROA 0.58583844
CAP −0.06225517
constant−7.8661387 ***−11.301255 ***−17.354669 ***
Notes: * p < 0.05, ** p < 0.01, *** p < 0.001.
Table 6. Estimation of Equation (1)—Model (3).
VariableIV ProbitProbit
INT0.01642660.19796123
INC0.2269846 ***0.50471382 ***
TAX0.5147498−2.8311528
SOE−1.002299 ***−1.0465065 ***
ADM0.2672673−3.2037023 **
WGE−0.5901624 *−0.43134058
LND0.5566808 ***0.53366381 ***
EXP0.38009760.38130881
LMS0.4889643 **0.36748048 **
SZE0.1182275 ***0.14014136 ***
ROA0.47315840.32573334
CAP−0.2319111−0.02272468
constant−7.265602 **−8.9992135 ***
Notes: * p < 0.05, ** p < 0.01, *** p < 0.001.
Disclaimer/Publisher’s Note: The statements, opinions and data contained in all publications are solely those of the individual author(s) and contributor(s) and not of MDPI and/or the editor(s). MDPI and/or the editor(s) disclaim responsibility for any injury to people or property resulting from any ideas, methods, instructions or products referred to in the content.

