
The Effects of Aging Populations on U.S. Communities

Abstract
:1. Introduction
2. Data
3. Empirical Strategy
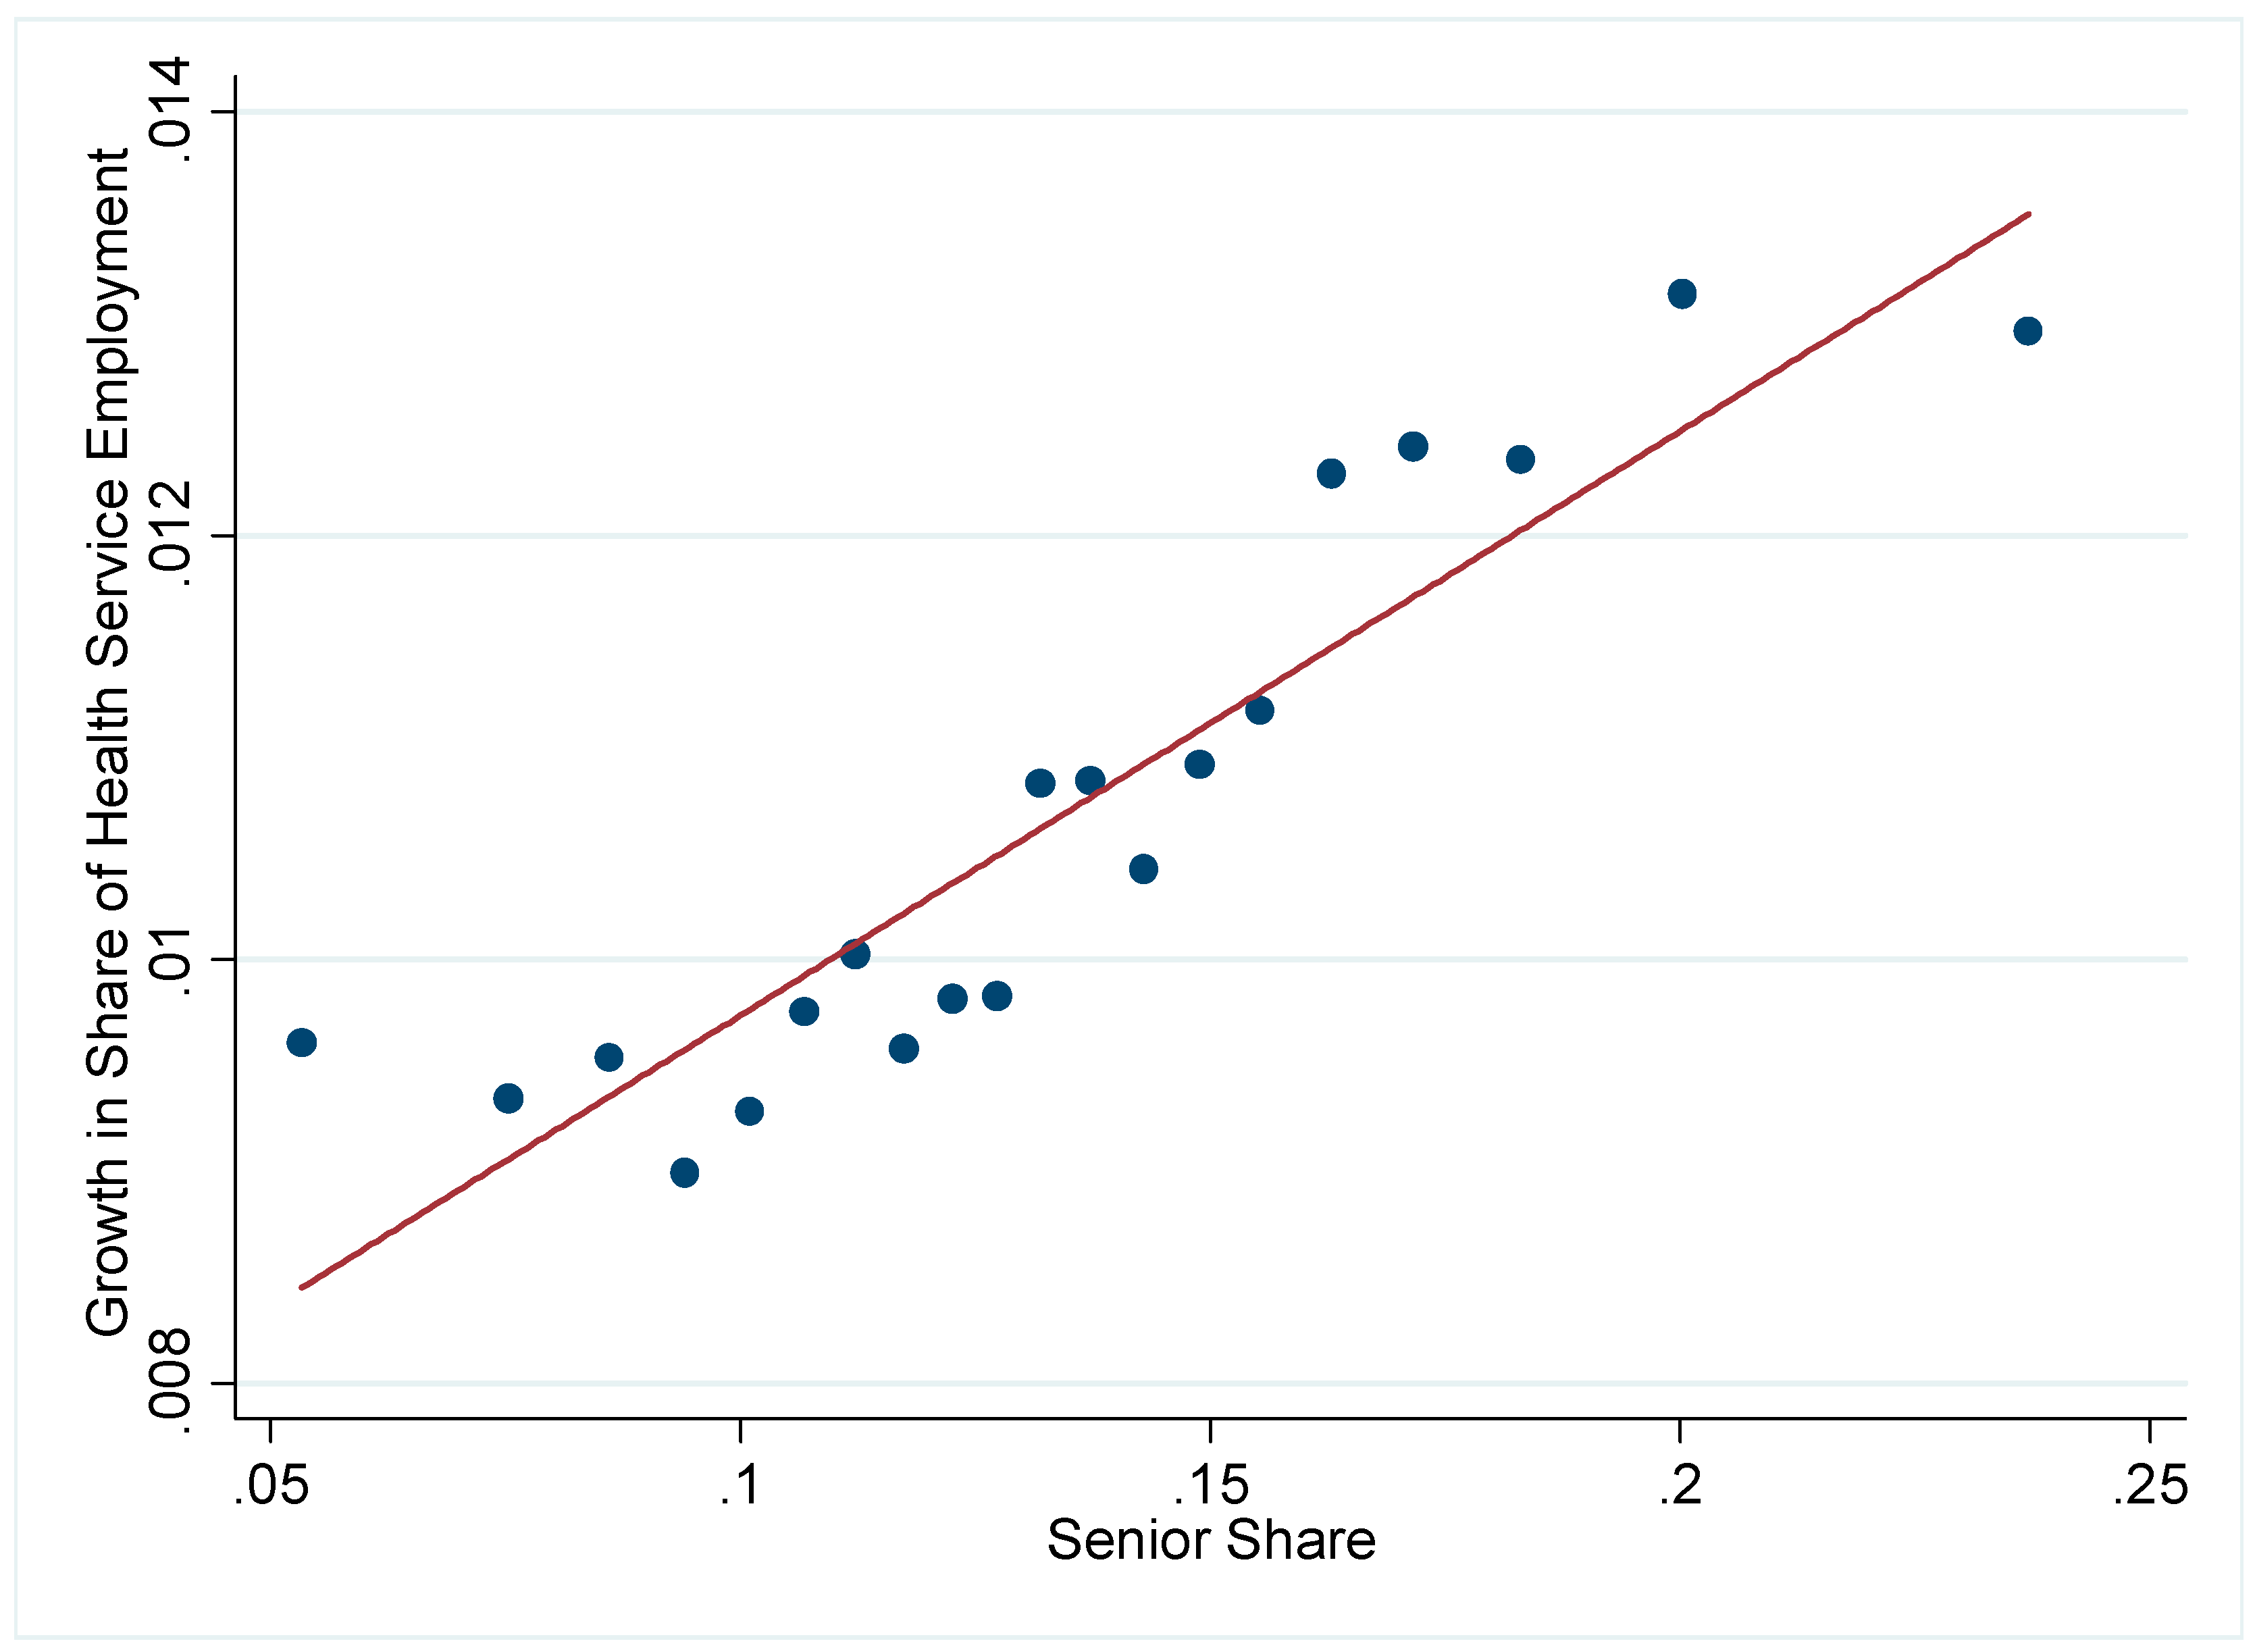
4. Empirical Results
5. Sensitivity Analysis
6. Discussion
7. Conclusions
Author Contributions
Funding
Informed Consent Statement
Data Availability Statement
Conflicts of Interest
Appendix A

| (1) | |
|---|---|
| Variables | Growth in the Share of College Graduates |
| Senior share | −0.0106 |
| (0.0376) | |
| Total population | 8.44 × 10⁻¹¹ |
| (7.37 × 10⁻⁹) | |
| Immigrant share | −0.0178 |
| (0.0257) | |
| Share of some college experience | 0.0635 *** |
| (0.0164) | |
| Share of college | −0.633 *** |
| (0.0392) | |
| Black share | −0.0686 *** |
| (0.0173) | |
| Share of minors | 0.0412 |
| (0.0255) | |
| Birth rate | −0.00616 |
| (0.0116) | |
| Share of healthcare sector | 0.138 * |
| (0.0781) | |
| Share of agricultural employment | 0.00150 |
| (0.0153) | |
| Year fixed effect | Yes |
| County fixed effect | Yes |
| Observations | 9098 |
| R-squared | 0.316 |
| F | 55.57 |
| Rss | 1.590 |
| (1) | |
|---|---|
| Variables | Growth in the Share of Health Care Sector Employment |
| Senior share | 0.0834 *** |
| (0.0319) | |
| Total population | −1.93 × 10⁻⁹ |
| (3.49 × 10⁻⁹) | |
| Immigrant share | −0.0878 *** |
| (0.0186) | |
| Share of some college experience | 0.0164 ** |
| (0.00782) | |
| Share of college | 0.0386 *** |
| (0.0101) | |
| Black share | −0.000441 |
| (0.0150) | |
| Share of minors | 0.0262 |
| (0.0185) | |
| Birth rate | −0.00193 |
| (0.00324) | |
| Share of healthcare sector | −1.214 *** |
| (0.0350) | |
| Share of agricultural employment | −0.0106 *** |
| (0.00301) | |
| Year fixed effect | Yes |
| County fixed effect | Yes |
| Observations | 6070 |
| R-squared | 0.759 |
| F | 464.5 |
| Rss | 0.0710 |
References
- Ahlfeldt, Gabriel M., Wolfgang Maennig, and Malte Steenbeck. 2019. Direct democracy and intergenerational conflicts in ageing societies. Journal of Regional Science 60: 129–55. [Google Scholar] [CrossRef]
- Alehegn, Esubalew, Silvia Sacchetti, and Ermanno Tortia. 2013. Human Capital, Creative Class and Regional Economic Performance: A Dynamic Panel Analysis. Working paper. EERI Research Paper Series (No. 11/2013); Brussels: Economics and Econometrics Research Institute (EERI). [Google Scholar]
- Faggian, Alessandra, Félix Modrego, and Philip McCann. 2019. Human capital and regional development. Handbook of Regional Growth and Development Theories 128: 149–71. [Google Scholar]
- Gaigné, Carl, and Jacques-François Thisse. 2009. Aging nations and the future of cities. Journal of Regional Science 49: 663–88. [Google Scholar] [CrossRef]
- Glaeser, Edward L., JoséA Scheinkman, and Andrei Shleifer. 1995. Economic growth in a cross-section of cities. Journal of Monetary Economics 36: 117–43. [Google Scholar] [CrossRef]
- Kim, Tae-jeong, and Geoffrey J. D. Hewings. 2013. Endogenous growth in an aging economy: Evidence and policy measures. The Annals of Regional Science 50: 705–30. [Google Scholar] [CrossRef]
- Linlin, Zhu, Li Xiuting, and Dong Jichang. 2016. The impact of aging on urban housing demand based on CGE. Filomat 30: 4151–71. [Google Scholar] [CrossRef]
- Maestas, Nicole, Kathleen J. Mullen, and David Powell. 2023. The effect of population aging on economic growth, the labor force and productivity. American Economic Journal: Macroeconomics 15: 306–32. [Google Scholar] [CrossRef]
- Peri, Giovanni. 2012. The effect of immigration on productivity: Evidence from US states. Review of Economics and Statistics 94: 348–58. [Google Scholar] [CrossRef]
- Roback, Jennifer. 1982. Wages, rents, and the quality of life. Journal of Political Economy 90: 1257–78. [Google Scholar] [CrossRef]
- Sun, Tianyu, Satish Chand, and Keiran Sharpe. 2018. Effect of Aging on Housing Prices: A Perspective from an Overlapping Generation Model. Available online: https://mpra.ub.uni-muenchen.de/94419/ (accessed on 18 January 2022).
- Wang, Xinrui, Eddie Chi-Man Hui, and Jiuxia Sun. 2018. Population aging, mobility, and real estate price: Evidence from cities in China. Sustainability 10: 3140. [Google Scholar] [CrossRef]
- White, Mercedia Stevenson, Candace Burns, and Helen Acree Conlon. 2018. The impact of an aging population in the workplace. Workplace Health & Safety 66: 493–98. [Google Scholar]
- Zhang, Xiaochen. 2021. How does the age structure affect local economy in the US? Review of Regional Studies 51: 129–60. [Google Scholar] [CrossRef]
| Variable | Observation | Mean | S.D. | Min | Max |
|---|---|---|---|---|---|
| Growth in senior share in 10 years | 9319 | 0.0095 | 0.0176 | −0.1054 | 0.1886 |
| Growth rate in employment in 10 years | 9349 | 0.0633 | 0.2671 | −0.747 | 6.2333 |
| Growth rate in total population in 10 years | 9349 | 0.0684 | 0.157 | −0.8109 | 1.9105 |
| Senior share | 9349 | 0.1429 | 0.0431 | 0.0081 | 0.3472 |
| Total population | 9429 | 79,898 | 264,660 | 67 | 9,519,338 |
| Share of the population with some college experience | 9349 | 0.2038 | 0.0767 | 0.0325 | 0.4522 |
| Share of college graduates | 9349 | 0.138 | 0.0693 | 0.0159 | 0.6375 |
| Black share | 9349 | 0.0861 | 0.144 | 0 | 0.8649 |
| Share of minors | 9349 | 0.2728 | 0.0386 | 0 | 0.4738 |
| Birth rate | 9349 | 0.3388 | 0.062 | 0 | 0.8652 |
| Share of healthcare sector | 9429 | 0.0358 | 0.0155 | 0 | 0.1647 |
| Metropolitan areas (2000 definition) | 9352 | 0.3459 | 0.4757 | 0 | 1 |
| Share of agricultural employment | 9429 | 0.0911 | 0.0952 | 0 | 0.7178 |
| Assumptions on the Effect of High Senior Concentration | Implications on | ||||
|---|---|---|---|---|---|
| Case | Productivity Assumed to | Amenities Assumed to | Wages | Rents | Employment Growth |
| 1 | Increase | Increase | Ambiguous | Increase | Increase |
| 2 | Increase | Decline | Increase | Ambiguous | Increase |
| 3 | Decline | Increase | Decline | Increase | Decrease |
| 4 | Decline | Decline | Ambiguous | Decline | Ambiguous |
| (1) | |
|---|---|
| Variables | Senior Share |
| 0.417 *** | |
| (0.0323) | |
| Total population | −1.51 × 10⁻⁹ |
| (3.32 × 10⁻⁹) | |
| Immigrant share | −0.0323 *** |
| (0.00934) | |
| Share of people some college experience | −0.0506 *** |
| (0.0133) | |
| Share of college graduates | −0.00472 |
| (0.0113) | |
| Black share | −0.0263 |
| (0.0225) | |
| Share of minors | −0.113 *** |
| (0.0242) | |
| Birth rate | −0.0529 *** |
| (0.00804) | |
| Employment share in the healthcare sector | 0.194 *** |
| (0.0515) | |
| Employment share in agricultural employment | −0.00726 |
| (0.00782) | |
| Year fixed effect | Yes |
| County fixed effect | Yes |
| Observations | 9329 |
| F | 139.66 |
| (1) | (2) | (3) | (4) | |
|---|---|---|---|---|
| Growth Rate of Population | Growth Rate of Employment | Growth Rate of Wages | Growth Rate of Rent | |
| Senior share | −1.238 *** | 2.551 *** | −2.395 | 8.962 * |
| (0.307) | (0.572) | (1.978) | (4.868) | |
| Total population | −2.71 × 10⁻⁷ *** | −6.29 × 10⁻⁷ *** | 2.34 × 10⁻⁷ | −7.65 × 10⁻⁷ |
| (6.51 × 10⁻⁸) | (1.57 × 10⁻⁷) | (1.49 × 10⁻⁷) | (5.32 × 10⁻⁷) | |
| Immigrant share | −0.122 | 1.209 *** | −0.592 ** | −0.0139 |
| (0.1000) | (0.244) | (0.294) | (0.391) | |
| Share of people some college experience | −0.294 * | −1.720 *** | −1.515 *** | 0.383 |
| (0.151) | (0.330) | (0.367) | (0.524) | |
| Share of college graduates | −0.181 | −0.329 | −1.418 *** | −1.378 *** |
| (0.153) | (0.415) | (0.368) | (0.421) | |
| Black share | −0.359 ** | 2.367 *** | 0.0323 | −0.748 |
| (0.141) | (0.318) | (0.346) | (0.671) | |
| Share of minors | −0.698 *** | 2.686 *** | 0.453 | 0.802 |
| (0.191) | (0.459) | (0.942) | (1.517) | |
| Birth rate | −0.261 *** | −1.200 *** | 0.0478 | −0.612 * |
| (0.0797) | (0.184) | (0.236) | (0.355) | |
| Employment share of healthcare sector | 1.469 *** | −0.986 | 5.589 *** | −3.320 |
| (0.323) | (1.085) | (0.978) | (2.590) | |
| Share of agricultural employment | 0.00511 | −0.177 | 4.970 *** | −0.869 * |
| (0.0814) | (0.110) | (0.618) | (0.496) | |
| Year fixed effect | Yes | Yes | Yes | Yes |
| County fixed effect | Yes | Yes | Yes | Yes |
| Observations | 9345 | 9345 | 6235 | 6235 |
| R-squared | 0.312 | 0.336 | 0.786 | 0.429 |
| (1) | (2) | (3) | (4) | |
|---|---|---|---|---|
| Model | Growth Rate of Population | Growth Rate of Employment | Growth Rate of Wages | Growth Rate of Rent |
| Senior share | −1.187 ** | 3.870 *** | −0.479 | 7.136 ** |
| (0.526) | (1.221) | (1.108) | (3.090) | |
| Total population | −2.91 × 10⁻⁷ *** | −5.70 × 10⁻⁷ *** | −5.31 × 10⁻⁸ | −3.25 × 10⁻⁷ |
| (7.61 × 10⁻⁸) | (1.46 × 10⁻⁷) | (9.36 × 10⁻⁸) | (2.59 × 10⁻⁷) | |
| Immigrant share | 0.0713 | 0.719 ** | −0.541 *** | −0.0605 |
| (0.139) | (0.355) | (0.165) | (0.314) | |
| Share of some college experience | −0.326 | −3.731 *** | −1.059 *** | 1.312 * |
| (0.258) | (0.445) | (0.365) | (0.696) | |
| Share of college | −0.293 | −0.397 | −1.337 *** | −2.591 *** |
| (0.226) | (0.562) | (0.335) | (0.641) | |
| Black share | −0.227 * | 1.745 *** | 0.124 | −2.081 *** |
| (0.127) | (0.470) | (0.145) | (0.440) | |
| Share of minors | −0.599 | 4.431 *** | 1.309 | 4.280 *** |
| (0.382) | (1.081) | (0.809) | (1.547) | |
| Birth rate | −0.458 *** | −1.950 *** | −1.235 *** | −2.132 *** |
| (0.160) | (0.314) | (0.305) | (0.496) | |
| Employment share of healthcare sector | 1.422 ** | −5.469 ** | 5.709 *** | −3.031 |
| (0.689) | (2.179) | (1.036) | (2.093) | |
| Share of agricultural employment | 0.226 | 0.699 ** | 3.672 *** | −0.173 |
| (0.161) | (0.342) | (0.725) | (0.771) | |
| Year fixed effect | Yes | Yes | Yes | Yes |
| County fixed effect | Yes | Yes | Yes | Yes |
| Observations | 3229 | 3229 | 2162 | 2162 |
| R-squared | 0.436 | 0.150 | 0.861 | 0.459 |
| (1) | (2) | (3) | (4) | |
|---|---|---|---|---|
| Model | Growth Rate of Population | Growth Rate of Employment | Growth Rate of Wages | Growth Rate of Rent |
| Senior share | −1.184 *** | 1.724 *** | −2.980 | 10.92 * |
| (0.291) | (0.584) | (2.588) | (6.433) | |
| Total population | −6.71 × 10⁻⁶ *** | −1.16 × 10⁻⁵ *** | 2.30 × 10⁻⁶ | −1.09 × 10⁻⁵ ** |
| (1.22 × 10⁻⁶) | (1.85 × 10⁻⁶) | (2.04 × 10⁻⁶) | (4.67 × 10⁻⁶) | |
| Immigrant share | −0.146 | 1.619 *** | −0.486 | 0.164 |
| (0.139) | (0.269) | (0.503) | (0.524) | |
| Share of some college experience | −0.134 | −0.675 ** | −1.554 *** | 0.164 |
| (0.128) | (0.297) | (0.441) | (0.568) | |
| Share of college | −0.00765 | 0.386 | −2.348 *** | 0.524 |
| (0.147) | (0.401) | (0.493) | (0.957) | |
| Black share | −0.844 *** | 2.413 *** | −0.581 | 1.841 |
| (0.323) | (0.394) | (1.086) | (2.379) | |
| Share of minors | −0.910 *** | 1.895 *** | −0.856 | 1.981 |
| (0.217) | (0.513) | (1.393) | (3.049) | |
| Birth rate | −0.118 | −0.793 *** | 0.00267 | 0.0179 |
| (0.0766) | (0.218) | (0.226) | (0.557) | |
| Employment share of healthcare sector | 1.193 *** | −0.287 | 6.054 *** | −4.195 |
| (0.335) | (0.865) | (1.055) | (3.199) | |
| Share of agricultural employment | 0.0515 | −0.127 | 4.701 *** | −0.536 |
| (0.0943) | (0.114) | (0.580) | (0.469) | |
| Year fixed effect | Yes | Yes | Yes | Yes |
| County fixed effect | Yes | Yes | Yes | Yes |
| Observations | 6100 | 6100 | 4073 | 4073 |
| R-squared | 0.258 | 0.307 | 0.781 | 0.439 |
Disclaimer/Publisher’s Note: The statements, opinions and data contained in all publications are solely those of the individual author(s) and contributor(s) and not of MDPI and/or the editor(s). MDPI and/or the editor(s) disclaim responsibility for any injury to people or property resulting from any ideas, methods, instructions or products referred to in the content. |
© 2023 by the authors. Licensee MDPI, Basel, Switzerland. This article is an open access article distributed under the terms and conditions of the Creative Commons Attribution (CC BY) license (https://creativecommons.org/licenses/by/4.0/).
Share and Cite
Chung, S.; Hean, O. The Effects of Aging Populations on U.S. Communities. Economies 2023, 11, 277. https://doi.org/10.3390/economies11110277
Chung S, Hean O. The Effects of Aging Populations on U.S. Communities. Economies. 2023; 11(11):277. https://doi.org/10.3390/economies11110277
Chicago/Turabian StyleChung, Seunghun, and Oudom Hean. 2023. "The Effects of Aging Populations on U.S. Communities" Economies 11, no. 11: 277. https://doi.org/10.3390/economies11110277
APA StyleChung, S., & Hean, O. (2023). The Effects of Aging Populations on U.S. Communities. Economies, 11(11), 277. https://doi.org/10.3390/economies11110277