Case Report

Domestic vs. External Economic Sectors and the Political Process: Insights from Greece

1
Department of Public Administration, Panteion University, 136 Syngrou Avenue, EL-17671 Athens, Greece
2
Department of Sociology, University of the Aegean, University Hill, EL-81100 Mytilene, Greece
3
Department of Methods and Models for Economics, Territory and Finance, Sapienza University of Rome, Via del Castro Laurenziano 9, I-00161 Rome, Italy
4
Department of Economics, National and Kapodistrian University of Athens, 1 Sofokleous Str., EL-10559 Athens, Greece
*
Author to whom correspondence should be addressed.
Economies 2022, 10(8), 198; https://doi.org/10.3390/economies10080198
Submission received: 30 March 2022 / Revised: 2 August 2022 / Accepted: 10 August 2022 / Published: 17 August 2022

Abstract

:
Building on the well-established relationship between economic dynamics and political processes, we focus on the most important element of the political process, namely, general (or national) elections, and look into their effects on public finance and total economic output. In this vein, the present study has three objectives: (i) to investigate political budget cycles in Greece during the period known as the ‘Third Hellenic Republic’ (in Greek, ‘Metapolitefsi’, hereafter THR) since 1974; (ii) to assess whether national elections affect total economic activity in a stabilizing or destabilizing way; and (iii) to examine the possible effects of the external sector of the economy on the budget balance. The empirical findings of our analysis document how the Greek economy was characterized by sharp political budget cycles in correspondence with the THR, exerting a destabilizing effect on the total output of the economy. Performances of the external sector of the economy have significantly affected budget balances in Greece.

1. Introduction

Over the last decade, Greece has repeatedly faced bankruptcy risk as a result of its public debt crisis. Bankruptcy is still plausible nowadays, since the Greek government’s consolidated gross debt has surpassed 200% of GDP1, topping all European Union (EU) member states and amounting to more than twice the EU average. In this study, we document how the political process has been instrumental in the Greek debt crisis—mainly through the emergence of severe political budget cycles—and we explore the generating mechanism of these cycles and their impact on the stability of the aggregate economy and international trade.
Political budget cycles (or electoral fiscal cycles) occur when governments in pre-election periods pursue expansionary fiscal policies (e.g., public spending increases, tax cuts, budget deficit increases) followed by restrictive fiscal policies in post-election periods. In fact, excessive public spending and tax reductions are basic mechanisms generating political budget cycles. Each one is associated with different social welfare implications (Alesina 1987). Reducing taxes tends to be of practical concern to relatively wealthier people, while policies leveraging public spending—usually materializing through increases in transfer payments—favor the less well-off (Alesina 1988). Earlier studies support the hypothesis that budget cycles are stronger on the expenditure side (e.g., Rogoff 1990; Alt and Rose 2007), although there is some evidence on the existence of budget cycles on the revenue side (e.g., Katsimi and Sarantides 2012). The final outcome of this political and economic behavior is the creation of budget cycles which are neither due to exogenous shocks nor due to policy failures. Instead, they are deliberately generated in the context of governments’ opportunistic efforts to maximize their re-election chances (Philips 2016). The success of this practice hinges on the voters’ myopic perspective and the ability of incumbent politicians to exploit their temporary information advantage2.
Political budget cycles have been the subject of empirical research documenting how the ability of governments to create political-economic cycles becomes limited as (i) the level of socioeconomic development rises (Block 2002; Shi and Svensson 2006; Klomp and de Haan 2013), (ii) the quality of institutions improves, and (iii) the transparency of its political process increases (Persson and Tabellini 2005; De Haan and Klomp 2013; Veiga et al. 2017). In other words, this happens when the quality and duration (or maturity) of democracy in a given country increase (Shi and Svensson 2003; Brender and Drazen 2005; De Haan 2013). In particular, the quality of institutions, and especially the existence of effective mechanisms controlling the financial decisions of governments (checks, balances, and fiscal rules), seem to be the most important means of limiting the extent of political budget cycles, as institutions shape the choices of the electorate and determine the incentives as well as the opportunities for incumbents to resort to these cycles (Chang 2008; Streb and Torrens 2013; Gootjes et al. 2021)3.
Therefore, the main conclusion of the existing works is that political budget cycles are more evident in developing economies (Brender and Drazen 2005), being negligible (or very limited) in wealthier countries (Andrikopoulos et al. 2004; Shi and Svensson 2006; Mandon and Cazals 2019). Our analysis focuses on Greece, a European country representing a remarkable deviation from the aforementioned rule. Chortareas et al. (2018) have documented the occurrence of opportunistic budgetary policies in this country, despite mixed evidence on their effectiveness in maximizing re-election prospects (Brender and Drazen 2008; Aidt et al. 2011; De Haan and Klomp 2013). In a more recent work, we have documented the significance, direction and size of political budget cycles in Greece (Petrakos et al. 2021a). This process is justified with the limited quality of the country’s institutions (Afonso et al. 2015) and lack of internal/external controls (Trantidis 2016), as well as with the fact that its governments often pursue clientele policies (Mitsopoulos and Pelagidis 2011) and resort to populism (Christodoulakis 2019).
This paper serves three main objectives. The first is to investigate the existence of political budget cycles in Greece in the Third Hellenic Republic (in Greek, ‘Metapolitefsi’, hereafter THR) since 1974. For this purpose, we specified econometric models in which the actual budget balance (as the percent share of Gross Domestic product, GDP) is used as the dependent variable, with the aim of quantifying the effects of the electoral cycle on the formation of budget balances in Greece. The second objective is to examine whether general (or parliamentary) elections affect a country’s GDP, and whether the effects are stabilizing or destabilizing. More specifically, the question is whether general elections have statistically significant (stabilizing or destabilizing) effects on GDP. The third objective is to examine the possible impact of the external sector of the economy (i.e., external trade) on budget deficits. Based on these objectives, the structure of the paper is organized as follows. Section 2 introduces empirical data and presents the empirical methodology. Section 3 illustrates our findings in full detail and discusses the main results of this study, and Section 4 concludes the paper with some remarks for future research.

2. Methodology

2.1. Study Area

Considering Greece, a Southern European country, as the study area, our empirical analysis tests the intensity of political economic cycles and, particularly, political budget cycles over the THR since 1974, and more specifically, during a time interval encompassing more than four decades (1974–2020). This relatively long time horizon is considered representative of sequential economic downturns (Salvia et al. 2020), from the democratic recovery after the colonel’s dictatorship (1967–1973) in the hand of the center-right ‘Nea Dimokratia’ party of K. Karamanlis and G. Rallis (1974–1981), to intense economic development under the government of the socialist party of A. Papandreou (1981–1989). After a relatively short dominance of a center-right government with K. Mitsotakis (1990–1993), the socialist party of A. Papandreou won the 1993 elections, taking the lead continuously up to 2004 with three governments of K. Simitis (1996–2004), after the premature death of A. Papandreou (1996). A moderate economic growth—mostly characterized by rising expenditure in public infrastructure expanding the public debt significantly—was the main trait of this political phase. The subsequent center-right government of K. Karamanlis (2004–2009) consolidated the intense economic expansion following the 2004 Olympic Games celebrated in Athens, introducing some reforms and trying to manage the early signs of the imminent financial crisis (Vinci et al. 2022). The short center-left government of G. Papandreou (2009–2010) was unable to manage the drastic impact of the recession on Greek society (Tomao et al. 2021), and a more evident instability characterized the political life of the country for some years (2011–2012). Alternated center-right (A. Samaras) and center-left (A. Tsipras) governments was representative of the 2010s political course of Greece. While reducing the impact of the crisis, the center-right government—answering the pressing requests of the European Commission and International Monetary Fund—was forced to cut salaries and pensions (Salvati 2016), and introduced a sort of austerity regime in public expenditures causing urban poverty, among others (Gkartzios 2013; Rontos et al. 2016; Panori et al. 2019). The subsequent center-left government tried to alleviate the economic consequences of Troika’s austerity, while fueling social spending, public infrastructure, and tourism (Salvati 2019).

2.2. Logical Framework and Scope of the Study

The existence of political budget cycles has been documented for the Greek economy, with specific reference to a shorter time period, namely, 1980–2017 (Petrakos et al. 2021a). We have also demonstrated how these cycles have been generated primarily on the expenditure side and not on the revenue side (Petrakos et al. 2021c). The present analysis differs substantially from the existing research in many aspects. For the first time in the literature, the effects of the external sector of the economy (exports, imports, trade balance) were examined as explanatory variables of the public budget deficit in the context of political budget cycles and prove to be significant. These outcomes support the ‘twin deficit hypothesis’ (Miller and Russek 1989; Cavallo 2005; Corsetti and Müller 2006; Kim and Roubini 2008; Algieri 2013; Badinger et al. 2017; Afonso et al. 2022). Relating budget deficits to trade deficits, these outcomes had important policy implications for economic competitiveness (e.g., Rontos et al. 2016; Di Feliciantonio et al. 2018; Benassi et al. 2022). Moreover, we explicitly examined the effects of unemployment on the evolution of public budget deficits, regarded as a significant policy issue (Salvati and Benassi 2021). We studied a relatively long time series, incorporating predictors that may evaluate the influence of several election rounds from 1974 to 2019.
Our second goal was to ascertain the possible existence of a relationship between election years and total real output (hereafter ‘real GDP’). In other words, we investigated whether the rate of change of total real GDP (hereafter ‘DTYGR1’) during the election years differs from the corresponding rate of change of non-election years (Petrakos et al. 2021b). Our final objective is to examine the possible effects of the external trade (exports of goods and services, imports of goods and services, and balance of goods and services) on the state budget balance, testing in this way the hypothesis of a direct linkage of budget balances with economic competitiveness at large.

2.3. Variables and Indicators

To achieve our objectives, we constructed five econometric models using the following dependent (1) and explanatory (2–10) variables:
(1) The actual budget balance (ABB) of a general government as a percent of GDP, as defined and measured by Eurostat. The minus (−) sign corresponds to a deficit, while the plus (+) sign corresponds to a surplus. We consider the actual budget balance as a percent share of GDP (instead of computing absolute monetary terms) for three main reasons: because (i) percent metrics provide a more reliable indicator of the relative magnitude of the actual budget balance; (ii) percentages remove the long-term effect of inflation on fiscal aggregates; (iii) the main fiscal policy condition of the EU member states, in order to avoid entering the Excessive Deficit Procedure (EDP) of the Stability and Growth Pact, is not to exceed 3% of their GDP.
(2) The one-year lag of the actual budget balance (ABB-1) of a general government as a percent of GDP, since the public balance might be ‘compounded’ in the sense that the budget deficit of the previous year might affect, to some extent, the deficit of the current year. In effect, the one-year lag of the dependent variable is used to control for the autoregressive, AR(1), component of the actual budget balance (Petrakos et al. 2021a).
(3) The two-year lag of the actual budget balance (ABB-2) of a general government as a percent of GDP, since not only the budget deficit of the previous year but also the deficit of the year before might affect the deficit of the current year. In effect, the two year lag of the dependent variable is used to capture the autoregressive, AR(2), component of the actual budget balance. We also considered the impact of a three-year lag of the actual budget, but our preliminary analysis suggests that this variable is largely insignificant.
(4) The growth rate of real total GDP (TYGR), as estimated by the World Bank.
(5) The change in the growth rate of total real GDP (DTYGR1), i.e., the difference between the growth rate of total real GDP of the current year and the previous one, i.e., DTYGR1i = TYGR1i − TYGR1i−1. This variable is introduced as it might not be the rates of change in total real GDP that cause pressures for expansionary fiscal policy as much as it is the variations (or fluctuations) of these rates from year to year.
(6) The unemployment rate (UNR) as it is measured by Eurostat and the Hellenic Statistical Authority (ELSTAT).
(7) Exports of goods and services as a percent of GDP (EXPO) as they are estimated by the World Bank (World Development Indicators).
(8) Imports of goods and services as a percent of GDP (IMPO) as they are estimated by the World Bank (World Development Indicators).
(9) Balance of goods and services as a percent of GDP (BAGS), estimated as the difference between exports of goods and services and imports of goods and services as a percent of GDP (BAGS = EXPO − IMPO).
(10) Election (ELE), a binary variable taking the value of 1 for (general) election years and 0 otherwise.

2.4. Statistical Analysis

We have specified five linear regression models with the actual budget balance as the dependent variable. In what follows (Section 3), results of these models were presented and commented in the order they are listed in Table 1, reporting the regression coefficients of each model in separated tables. All models were checked against the basic assumptions of Ordinary Least Square (OLS) model fitting, i.e., testing for linearity, homoscedasticity, independence, and normality assumptions (Ciommi et al. 2019). Results of statistical checks were presented in a graphical form (Lamonica et al. 2020).

3. Results and Discussion

3.1. Outcomes of Model 1

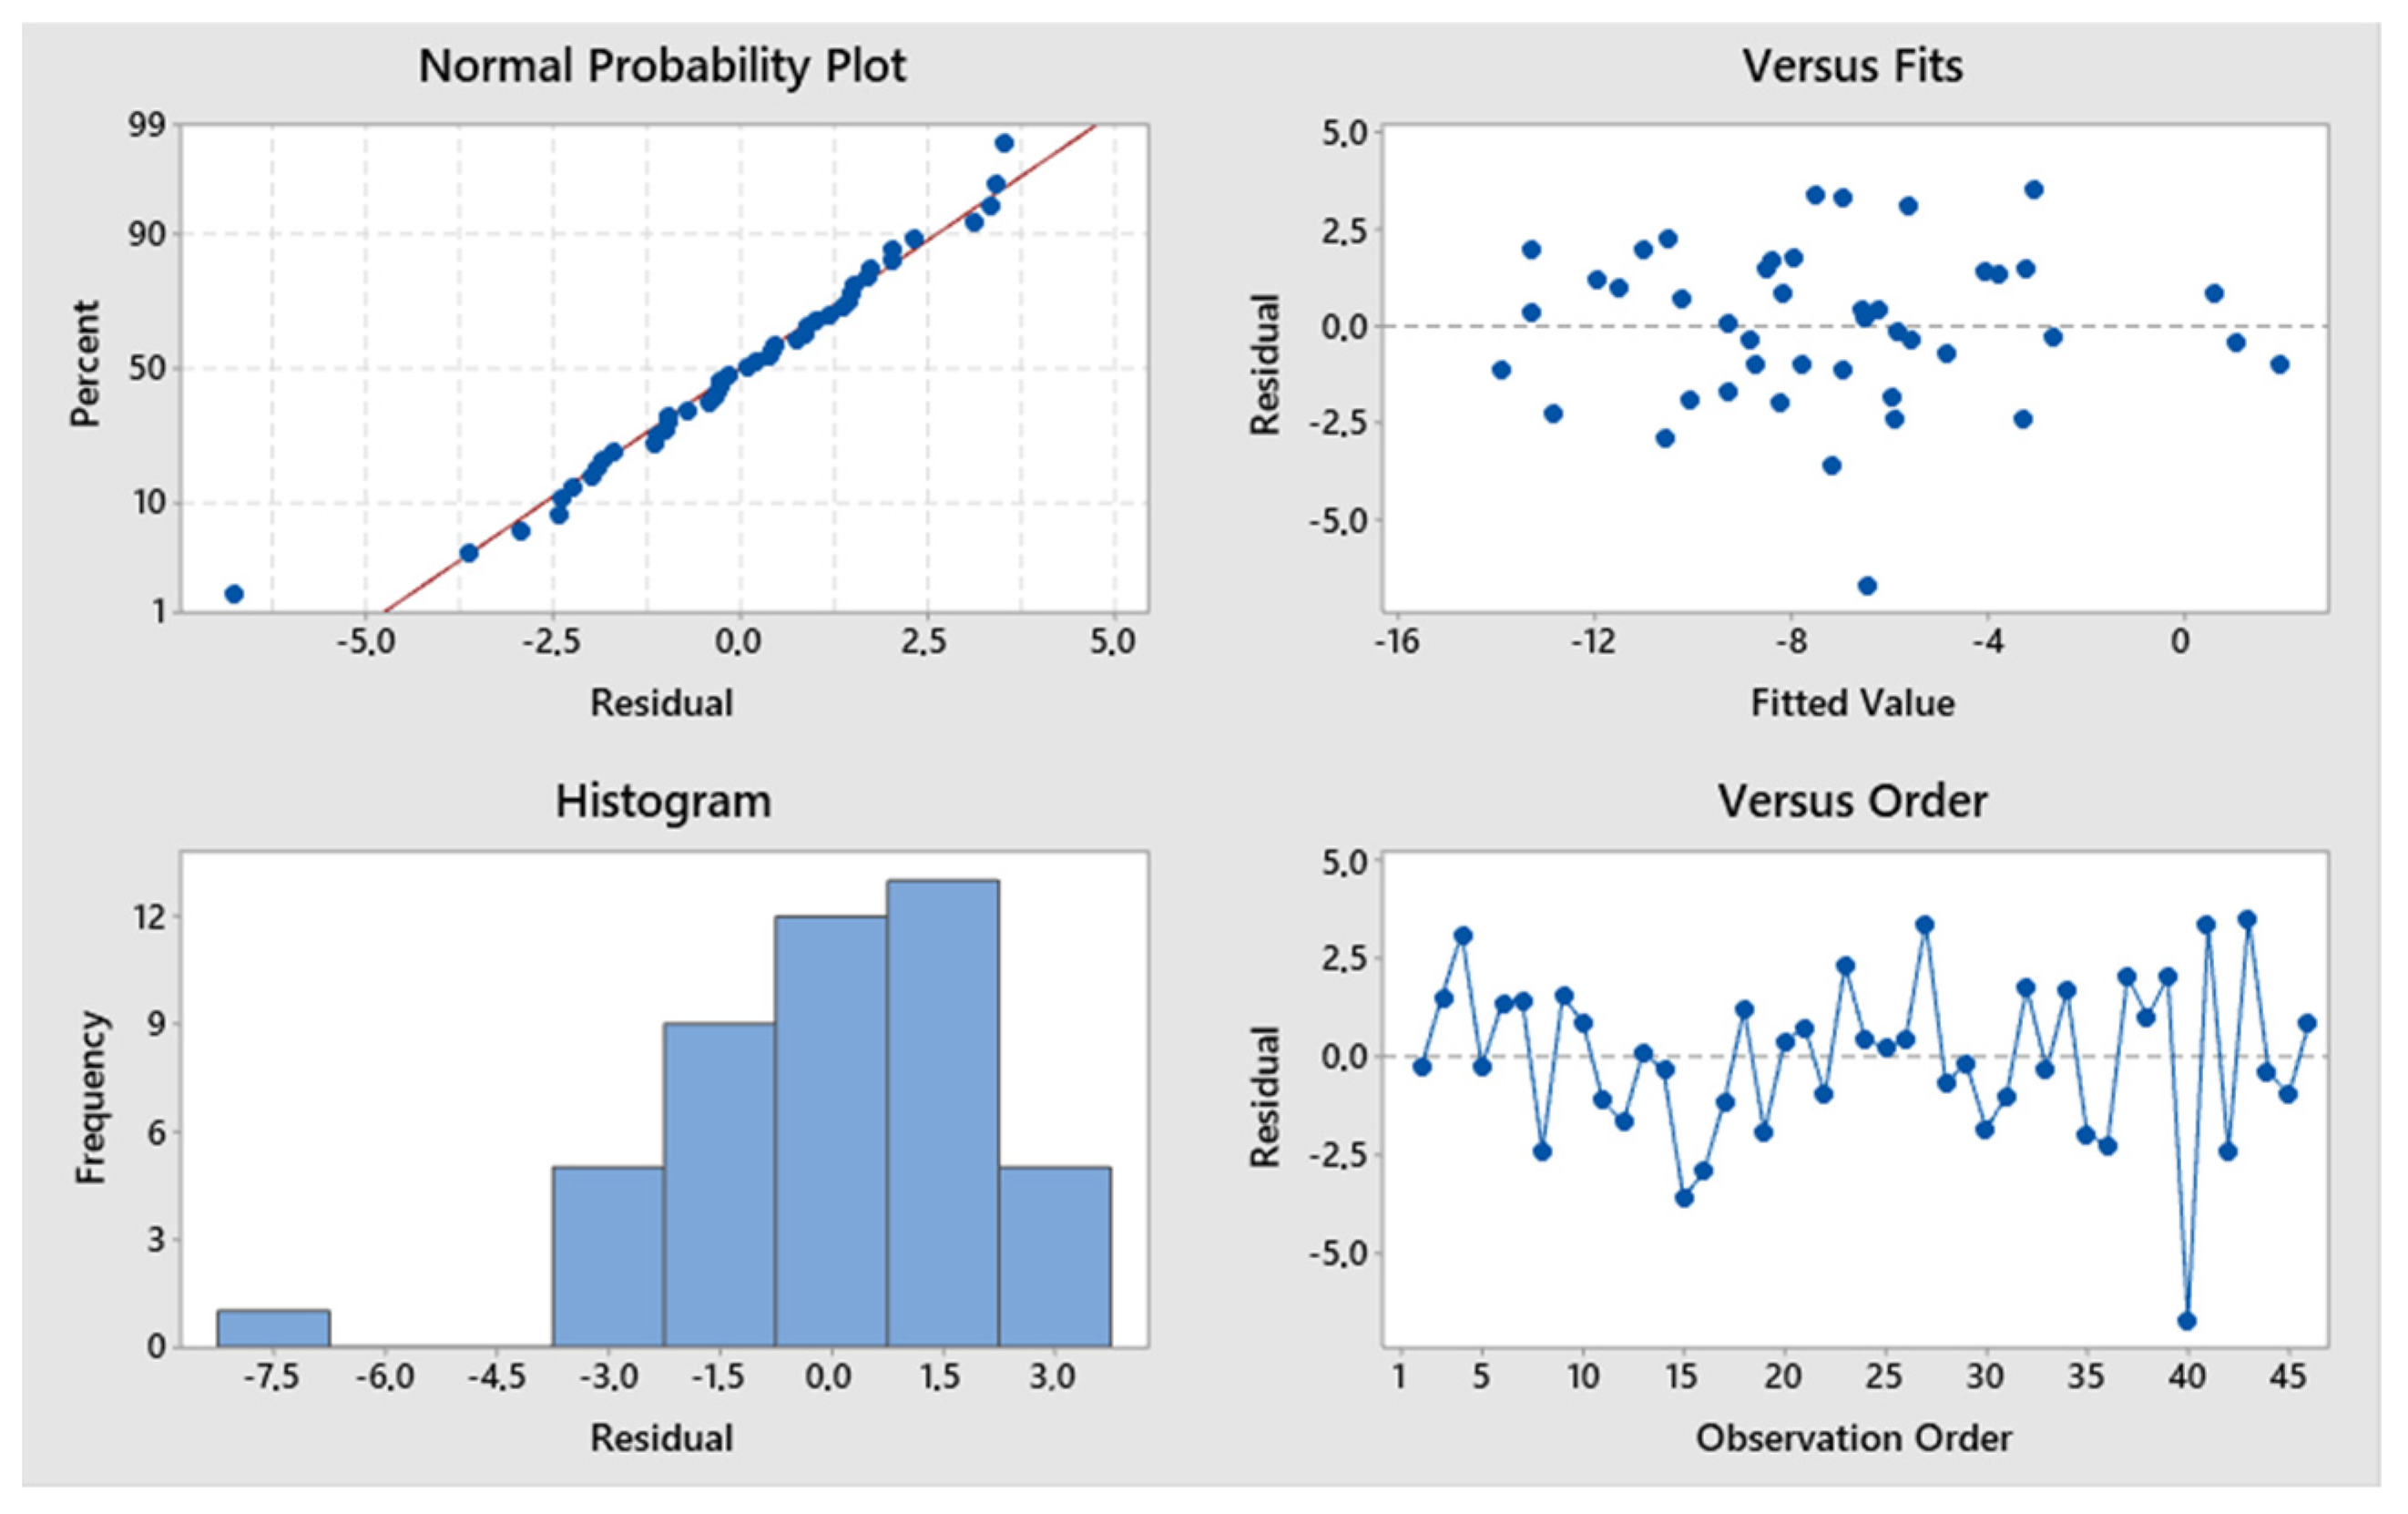
Model 1 provided the simplest specification of the variability in the actual budget balances of Greece (1974–2020) using only four variables. Since the lagged dependent variable is included in the explanatory variables, residuals are independently distributed (Salvati 2022). Plotting the residuals versus the fit, we verify that the linearity and homoscedasticity assumptions hold (Figure 1). Finally, a QQ plot and histogram of the residuals reveal no serious departures from normality (Ciommi et al. 2018). ABB-1 and UNR are significant at α = 0.01, ELE is significant at α = 0.05, and TYGR is significant at α = 0.1. Low Variance Inflation Factors (VIF) values indicate no evidence of multicollinearity (Table 2). The proportion of explained variance is relatively high (adjusted-R2 = 0.70).

3.2. Outcomes of Model 2

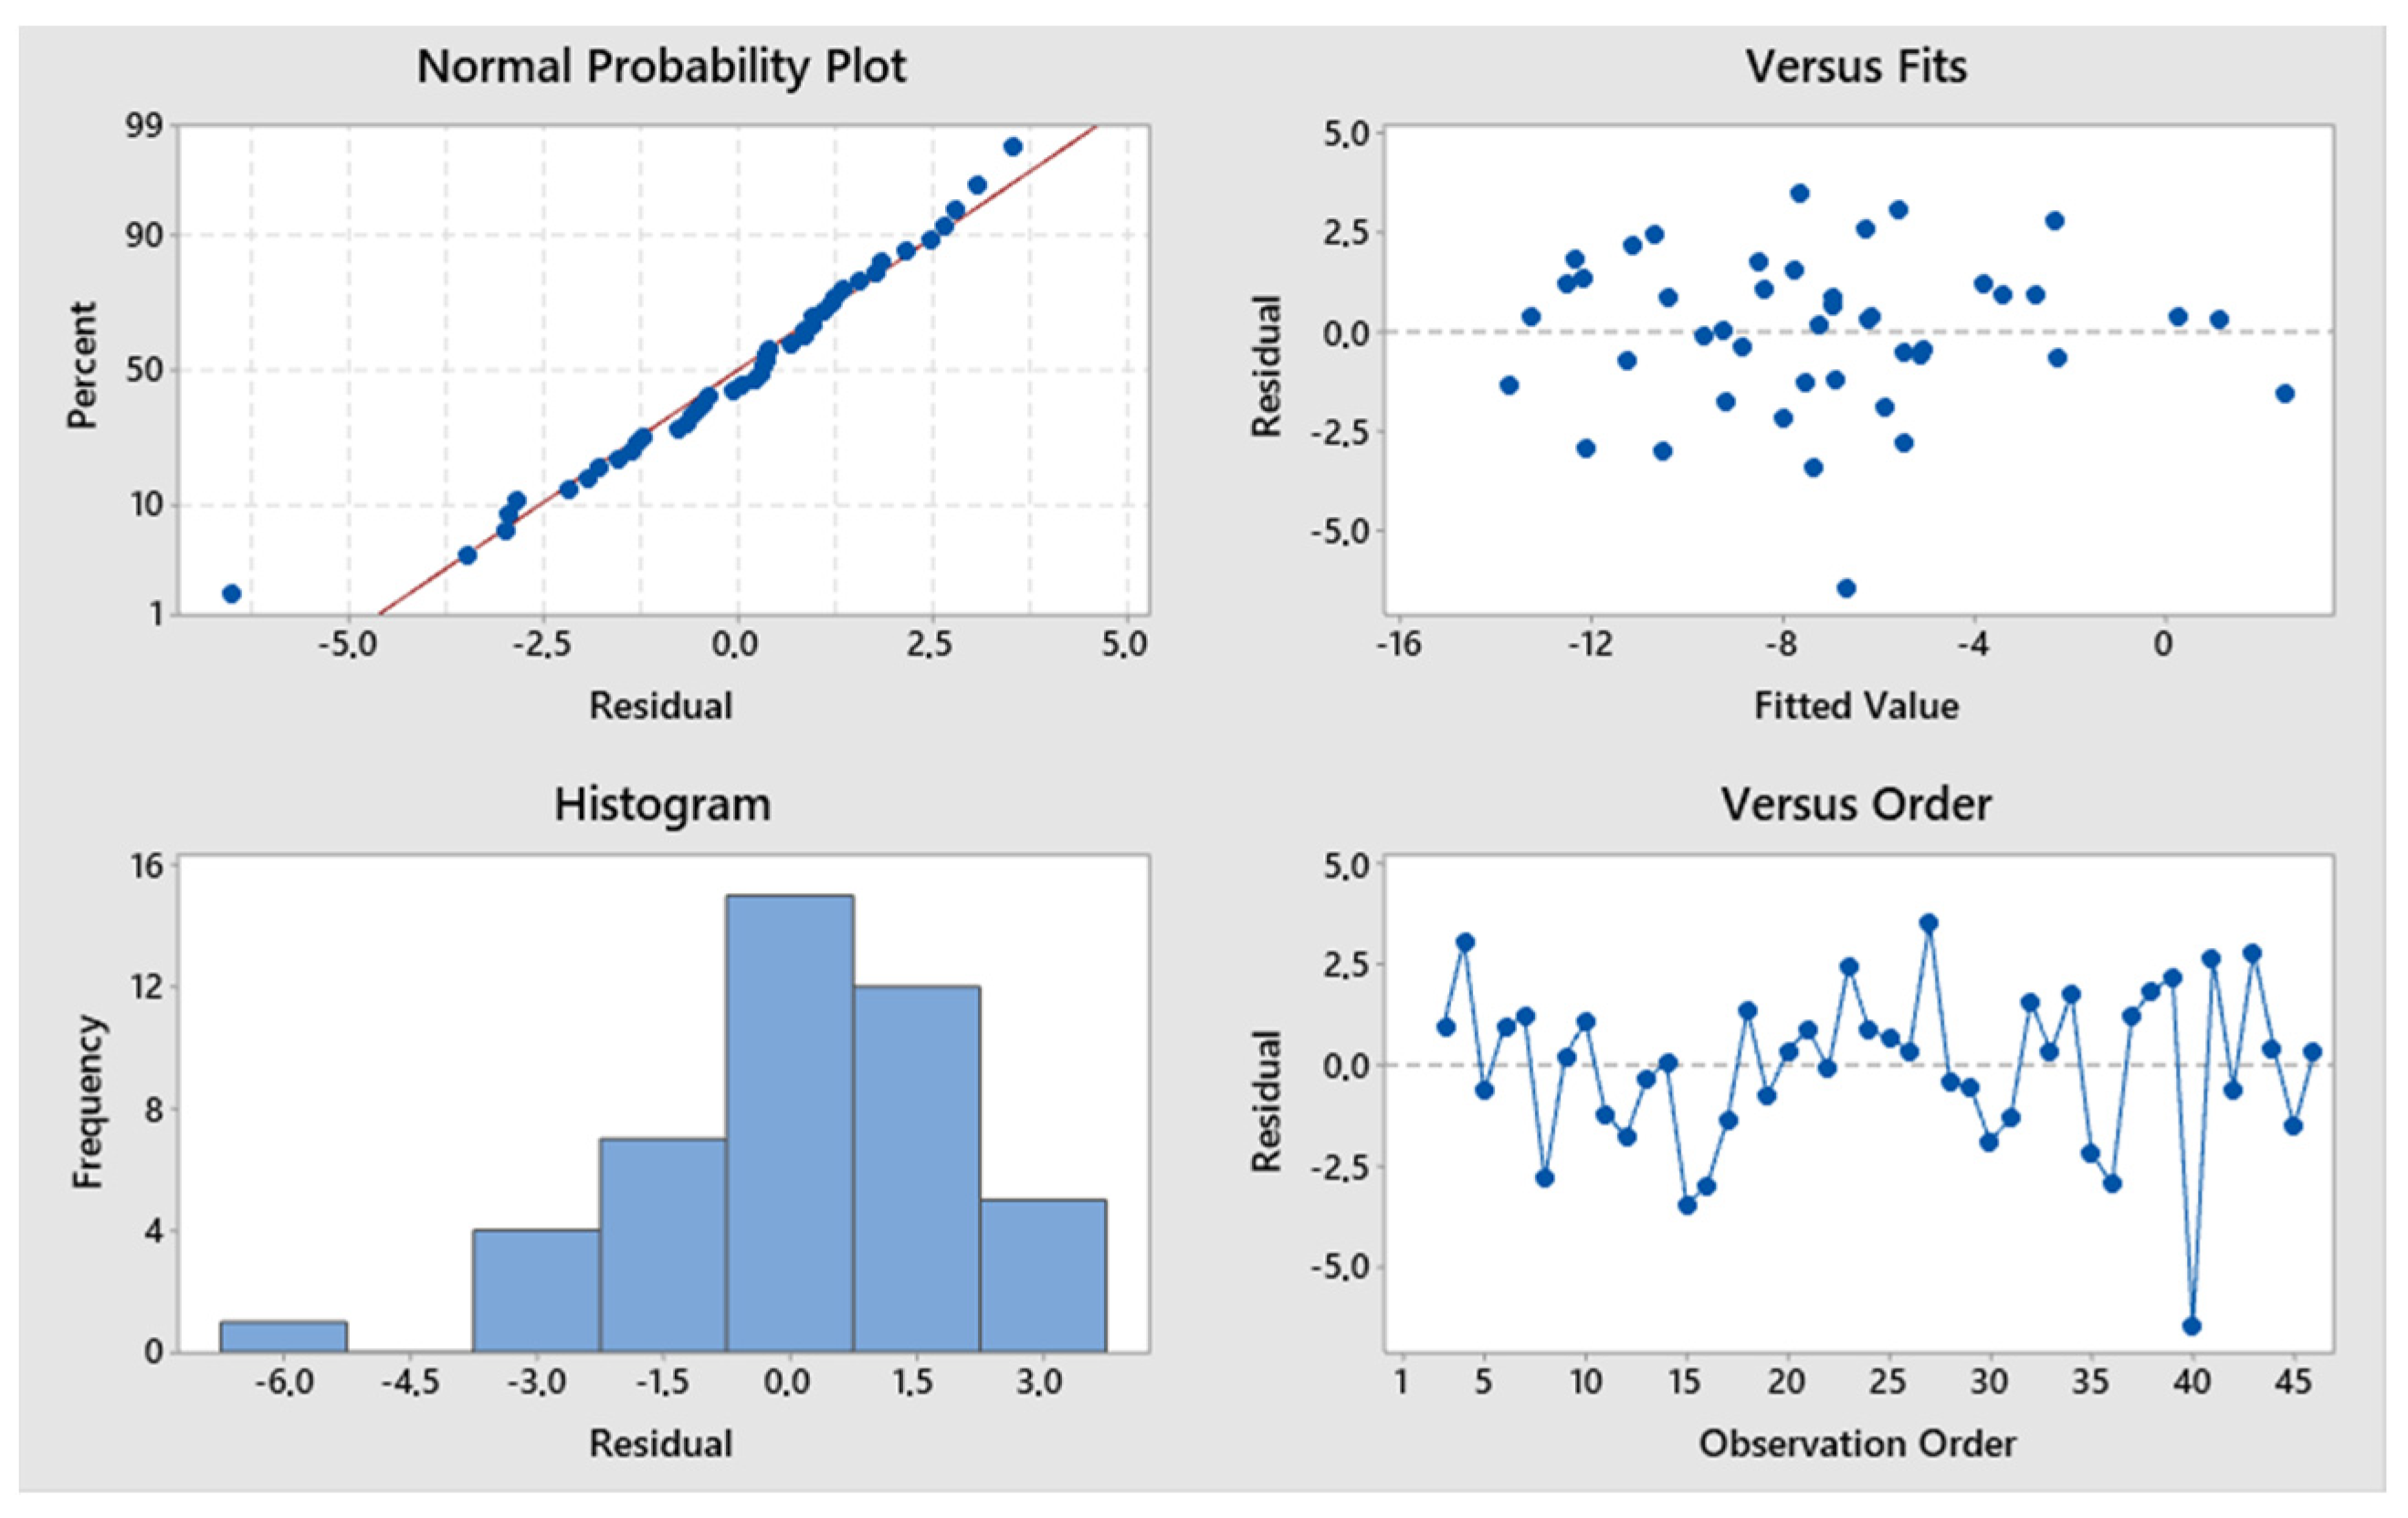
EXPO and IMPO were introduced in Model 2 together with the predictors already considered in Model 1. Residual plots in Figure 2 document how results of Model 2 fully adhere to linearity, homoscedasticity, independence, and normality assumptions. ABB-1, TYGR, and EXPO are significant at α = 0.01, while ELE and IMPO are significant at α = 0.05. VIF values indicate evidence of a residual multi-collinearity in Model 2, mainly attributable to IMPO and EXPO variables (Table 3). The proportion of explained variance is rather high (adjusted-R2 = 0.74).

3.3. Outcomes of Model 3

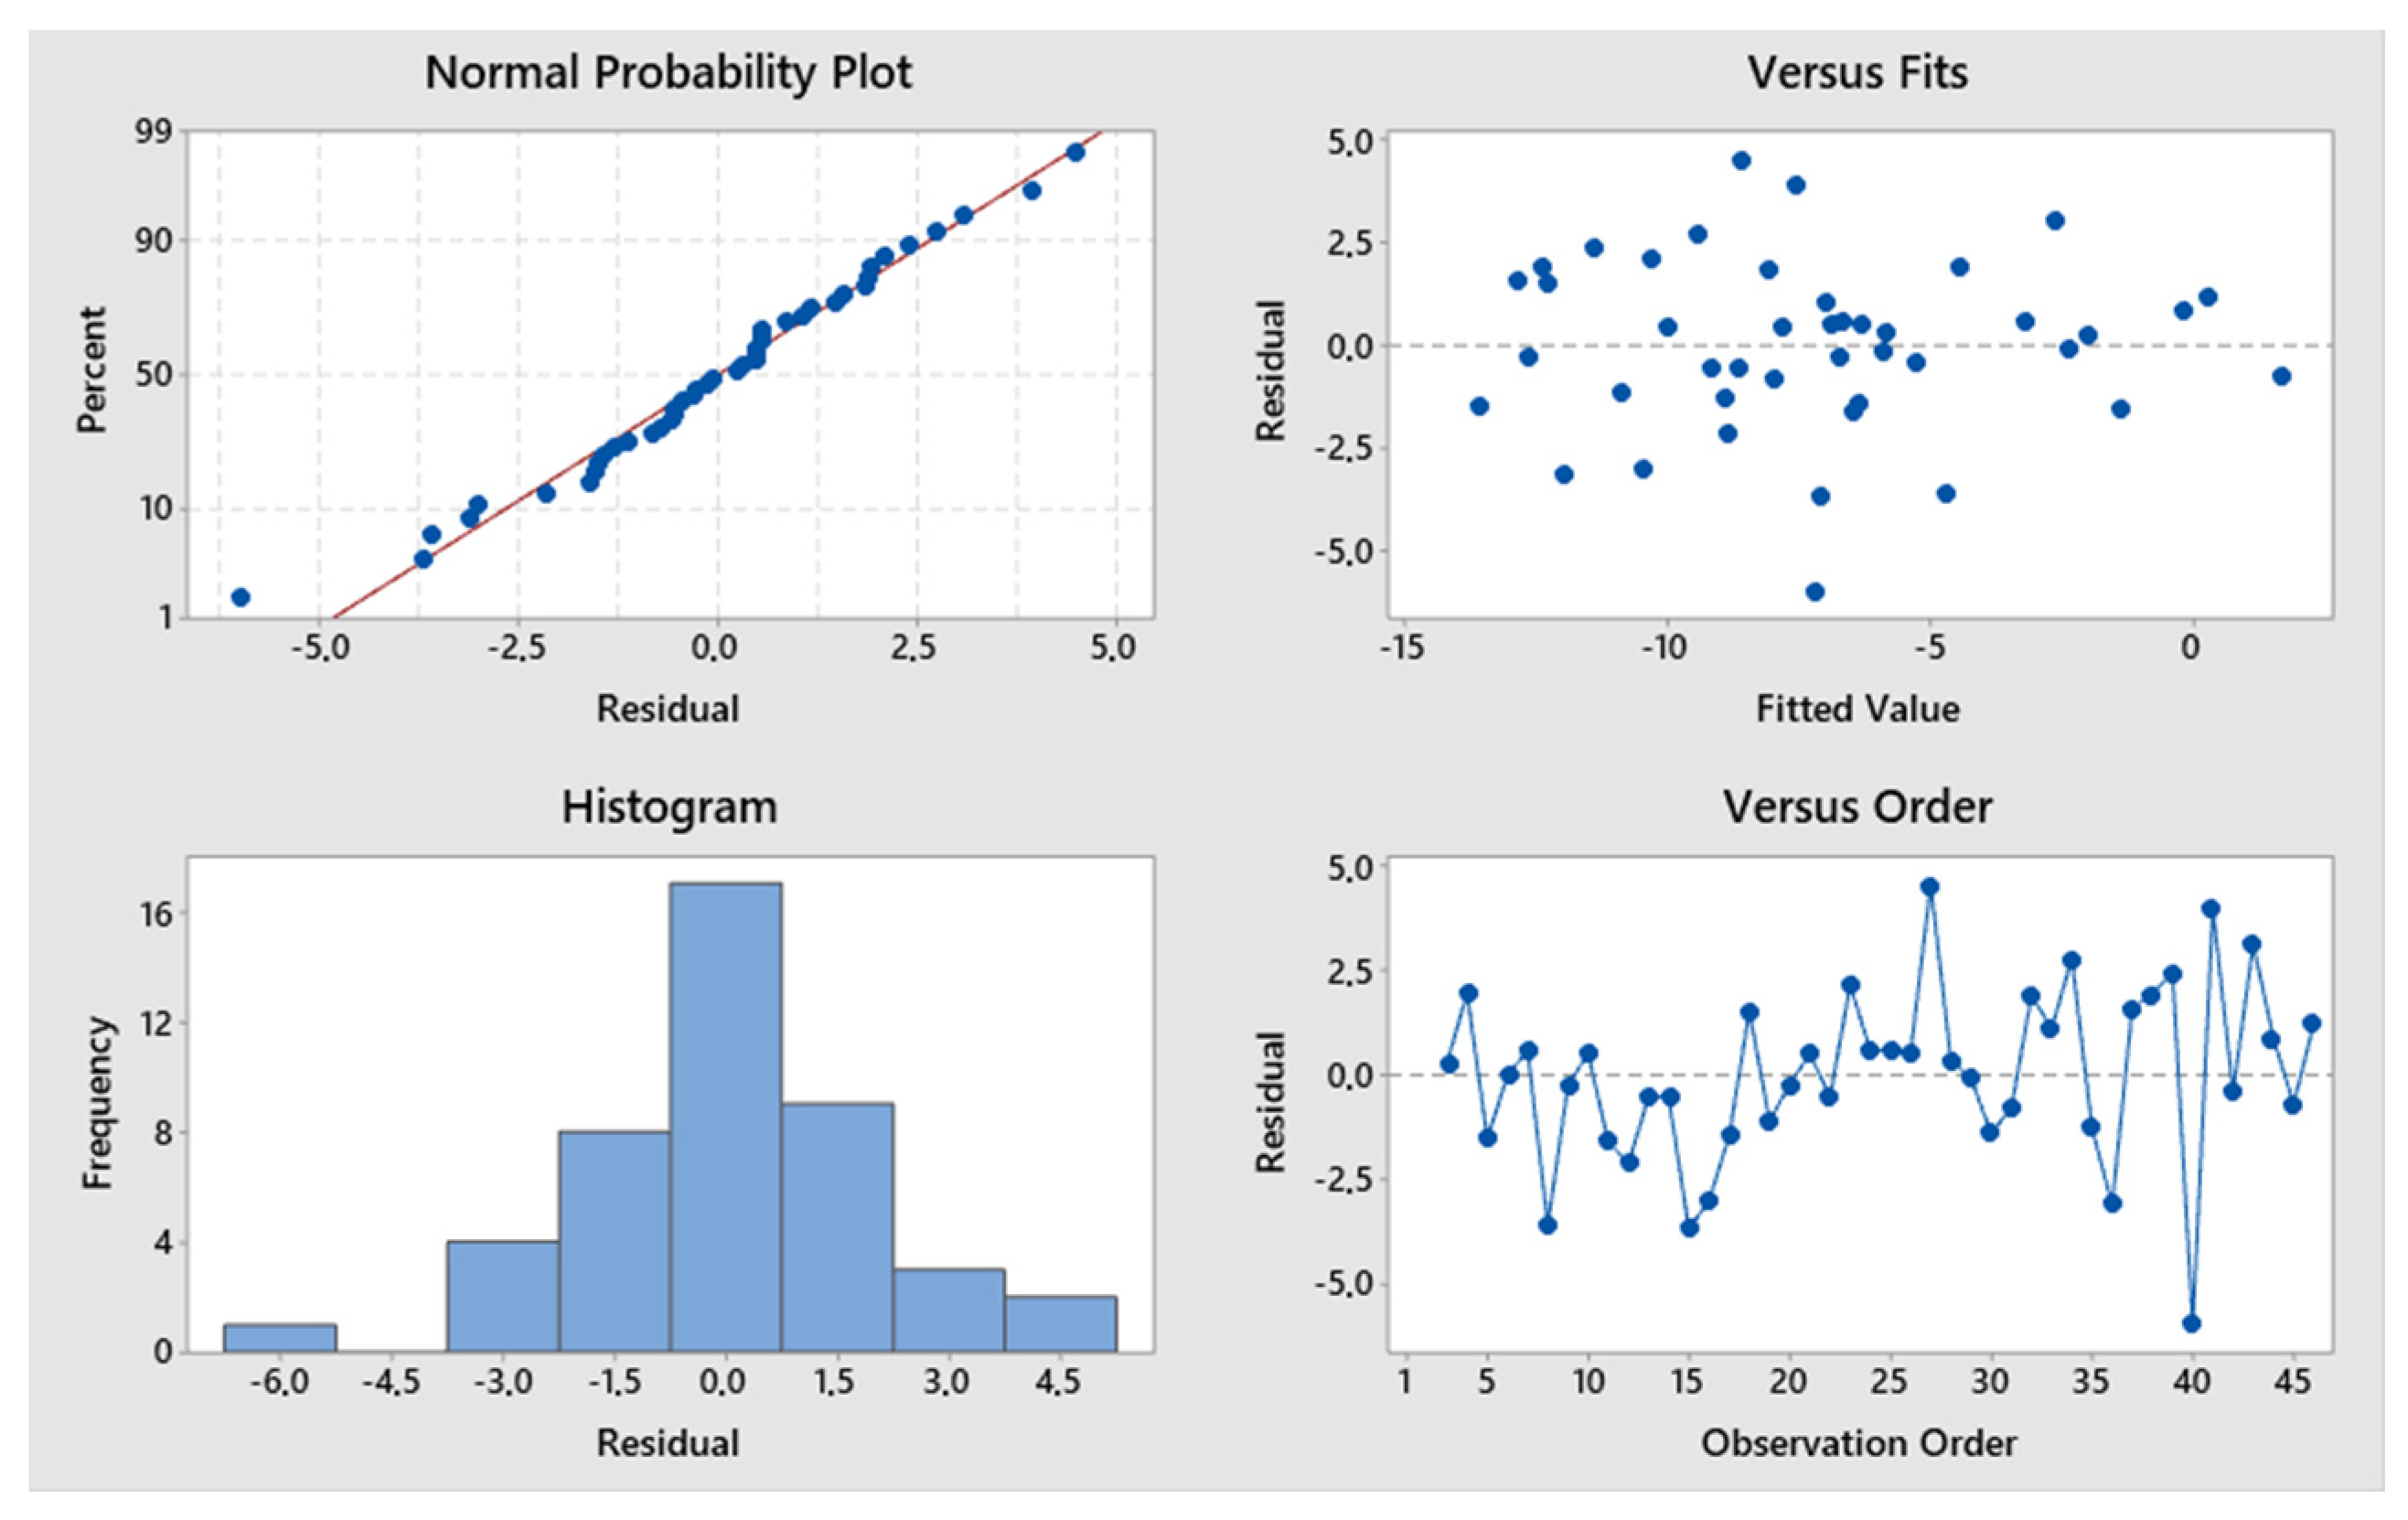
The lagged variable ABB-2 was introduced as a predictor in Model 3 and accounted for a particularly high proportion of the explained variance (adjusted-R2 = 0.75). The residual plots in Figure 3 indicate no deviations from the basic regression assumptions. EXPO was significant at α = 0.01, ELE, IMPO, TYGR, and ABB-1 were all significant at α = 0.05, and ABB-2 was significant at α = 0.1 (Table 4). A weak multi-collinearity issue (VIF > 5) was a distinctive characteristic of the estimation of Model 3, in line with what has been observed for the results of Model 2.

3.4. Outcomes of Model 4

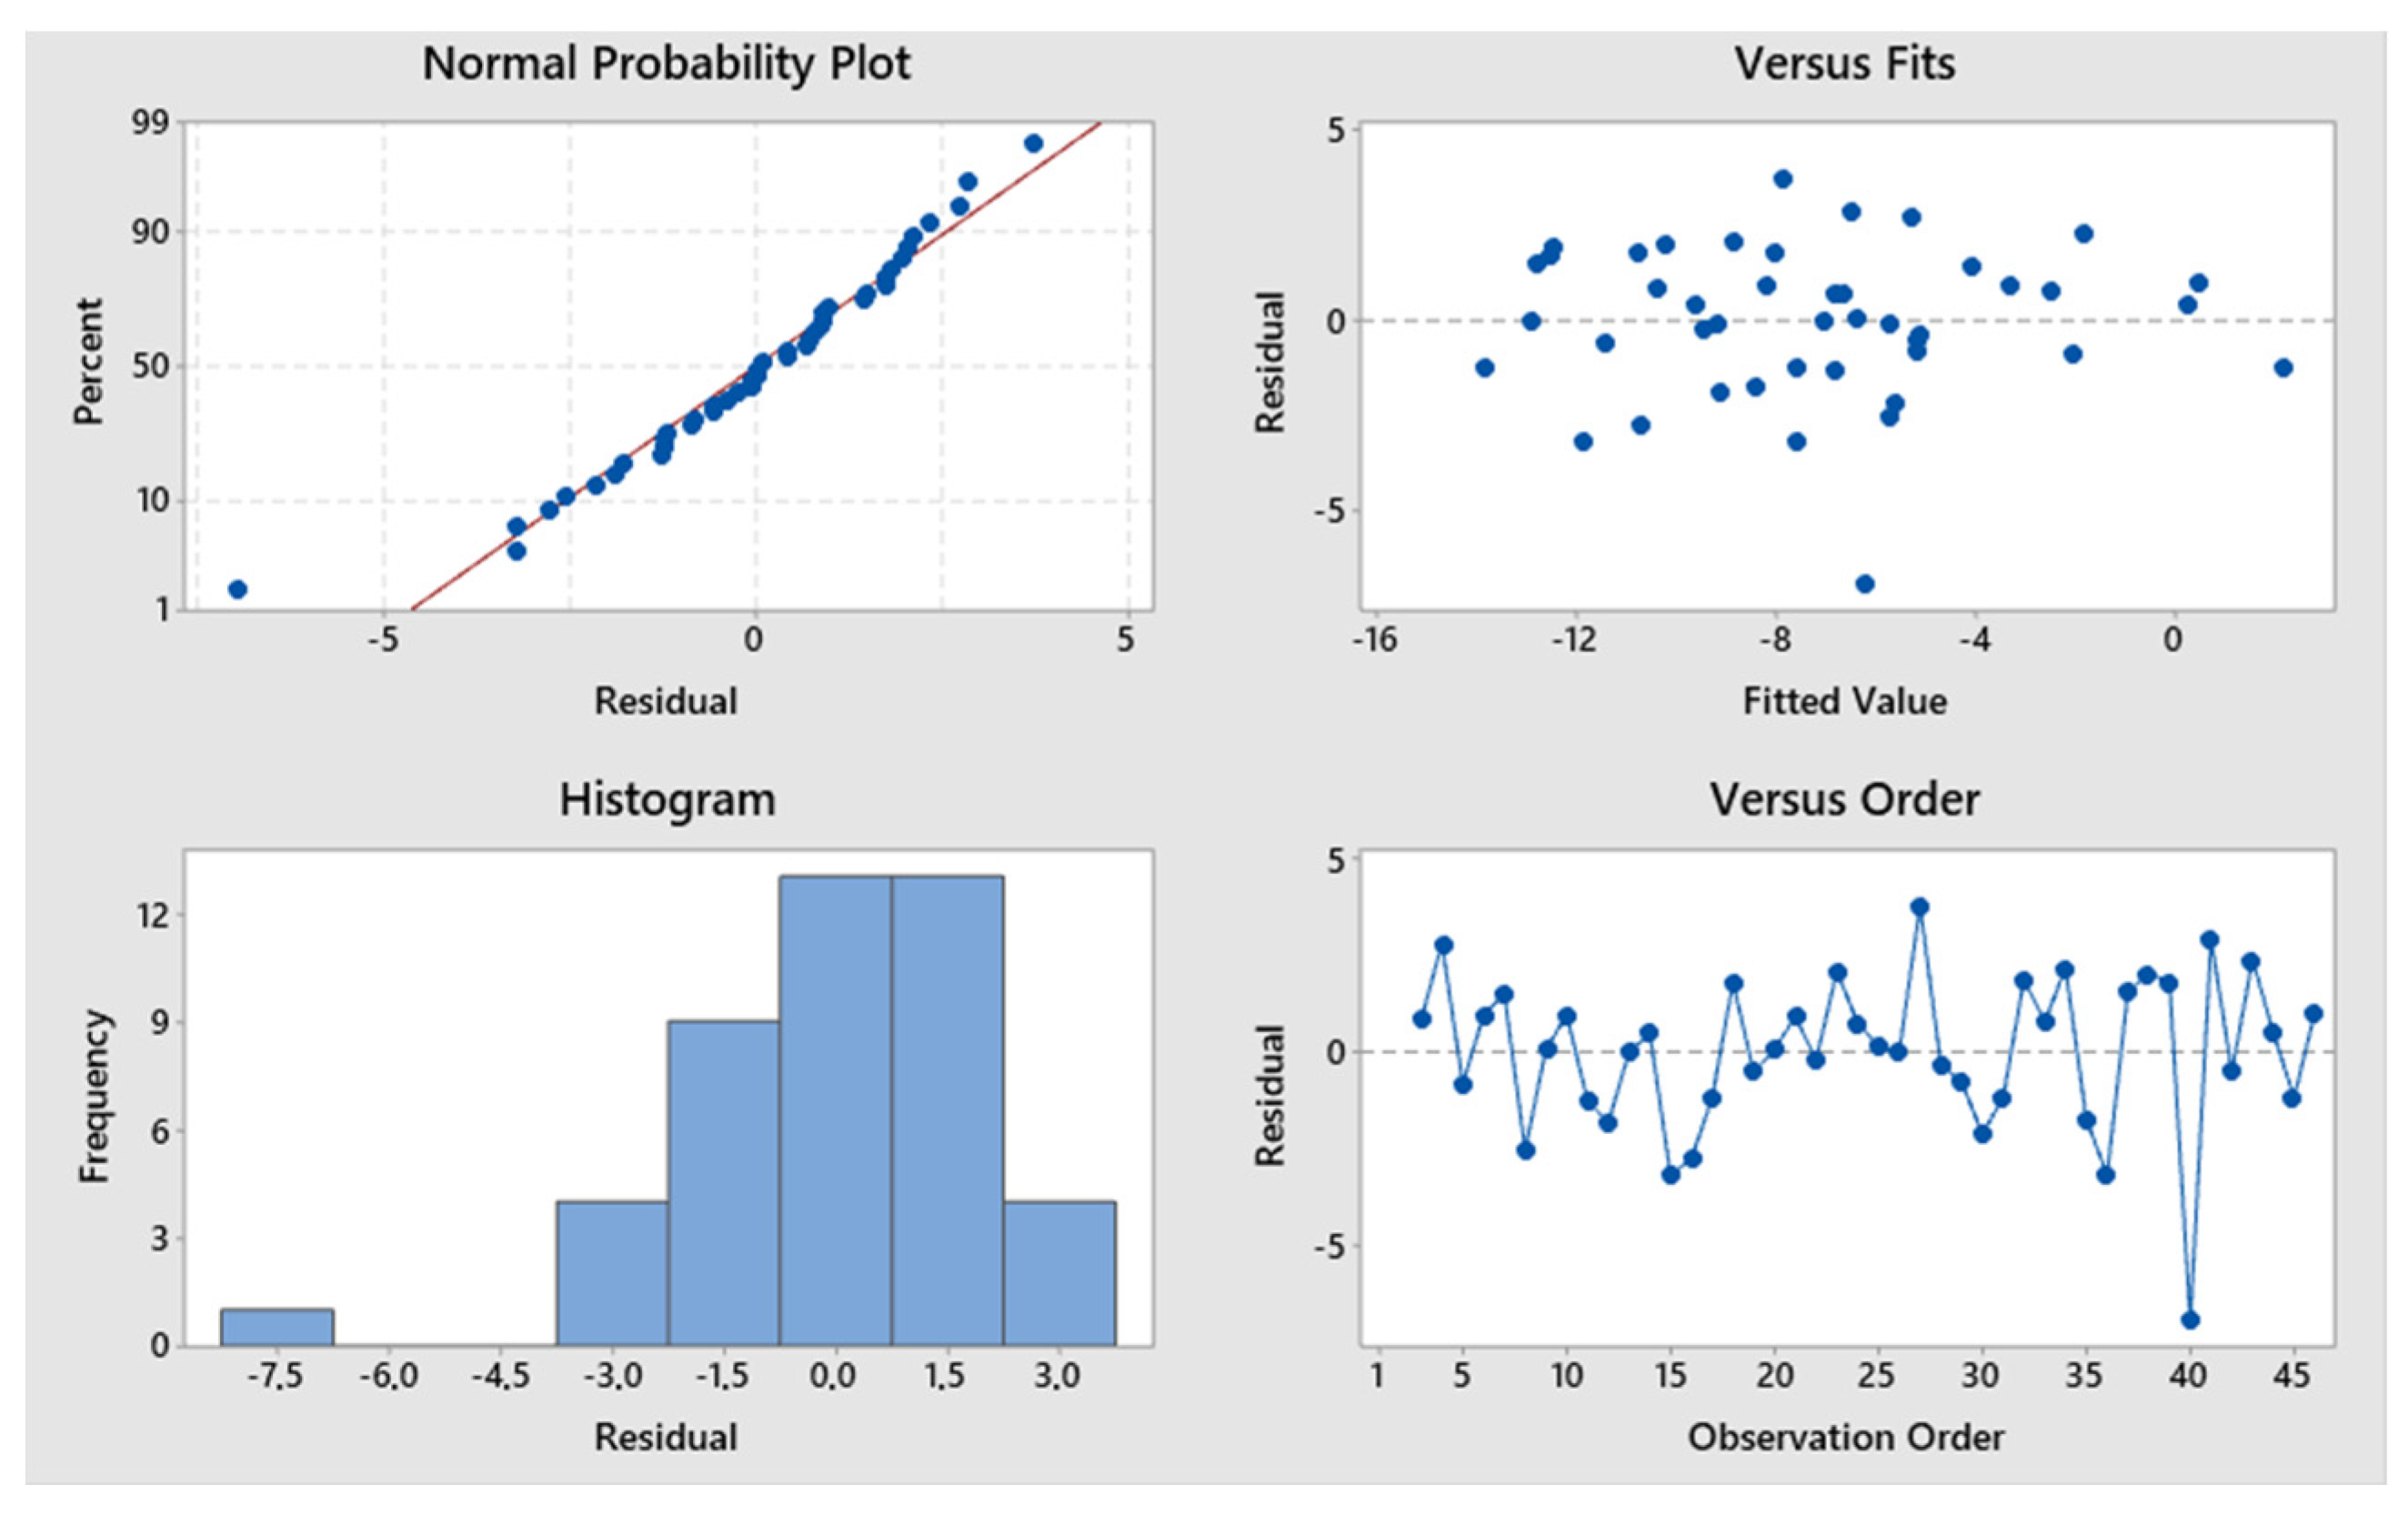
To cope with the weak multi-collinearity observed in Model 3, the variables IMPO and EXPO were replaced with their difference, named BAGS, in Model 4. The residual plots in Figure 4 indicate that the basic assumptions were not violated with this specification. The proportion of explained variance remained satisfactory (adjusted-R2 = 0.73). ABB-1 and BAGS are significant at α = 0.01, ELE is significant at α = 0.05, TYGR is marginally significant at α = 0.05, and ABB-2 is marginally significant at α = 0.1 (Table 5). Low VIF values indicate no evidence of multicollinearity.

3.5. Outcomes of Model 5

Unemployment rate (UNR) was introduced as an additional predictor in Model 5. The proportion of explained variance was satisfactory (adjusted-R2 = 0.75). Plots of residuals (Figure 5) indicate no violation of the basic econometric assumptions for Model 5. ABB-1 is significant at α = 0.01, ELE, ABB-2, TYGR, BAGS, are all significant at α = 0.05, and UNR is significant at α = 0.1. Low VIF values indicate no evidence of multicollinearity (Table 6).
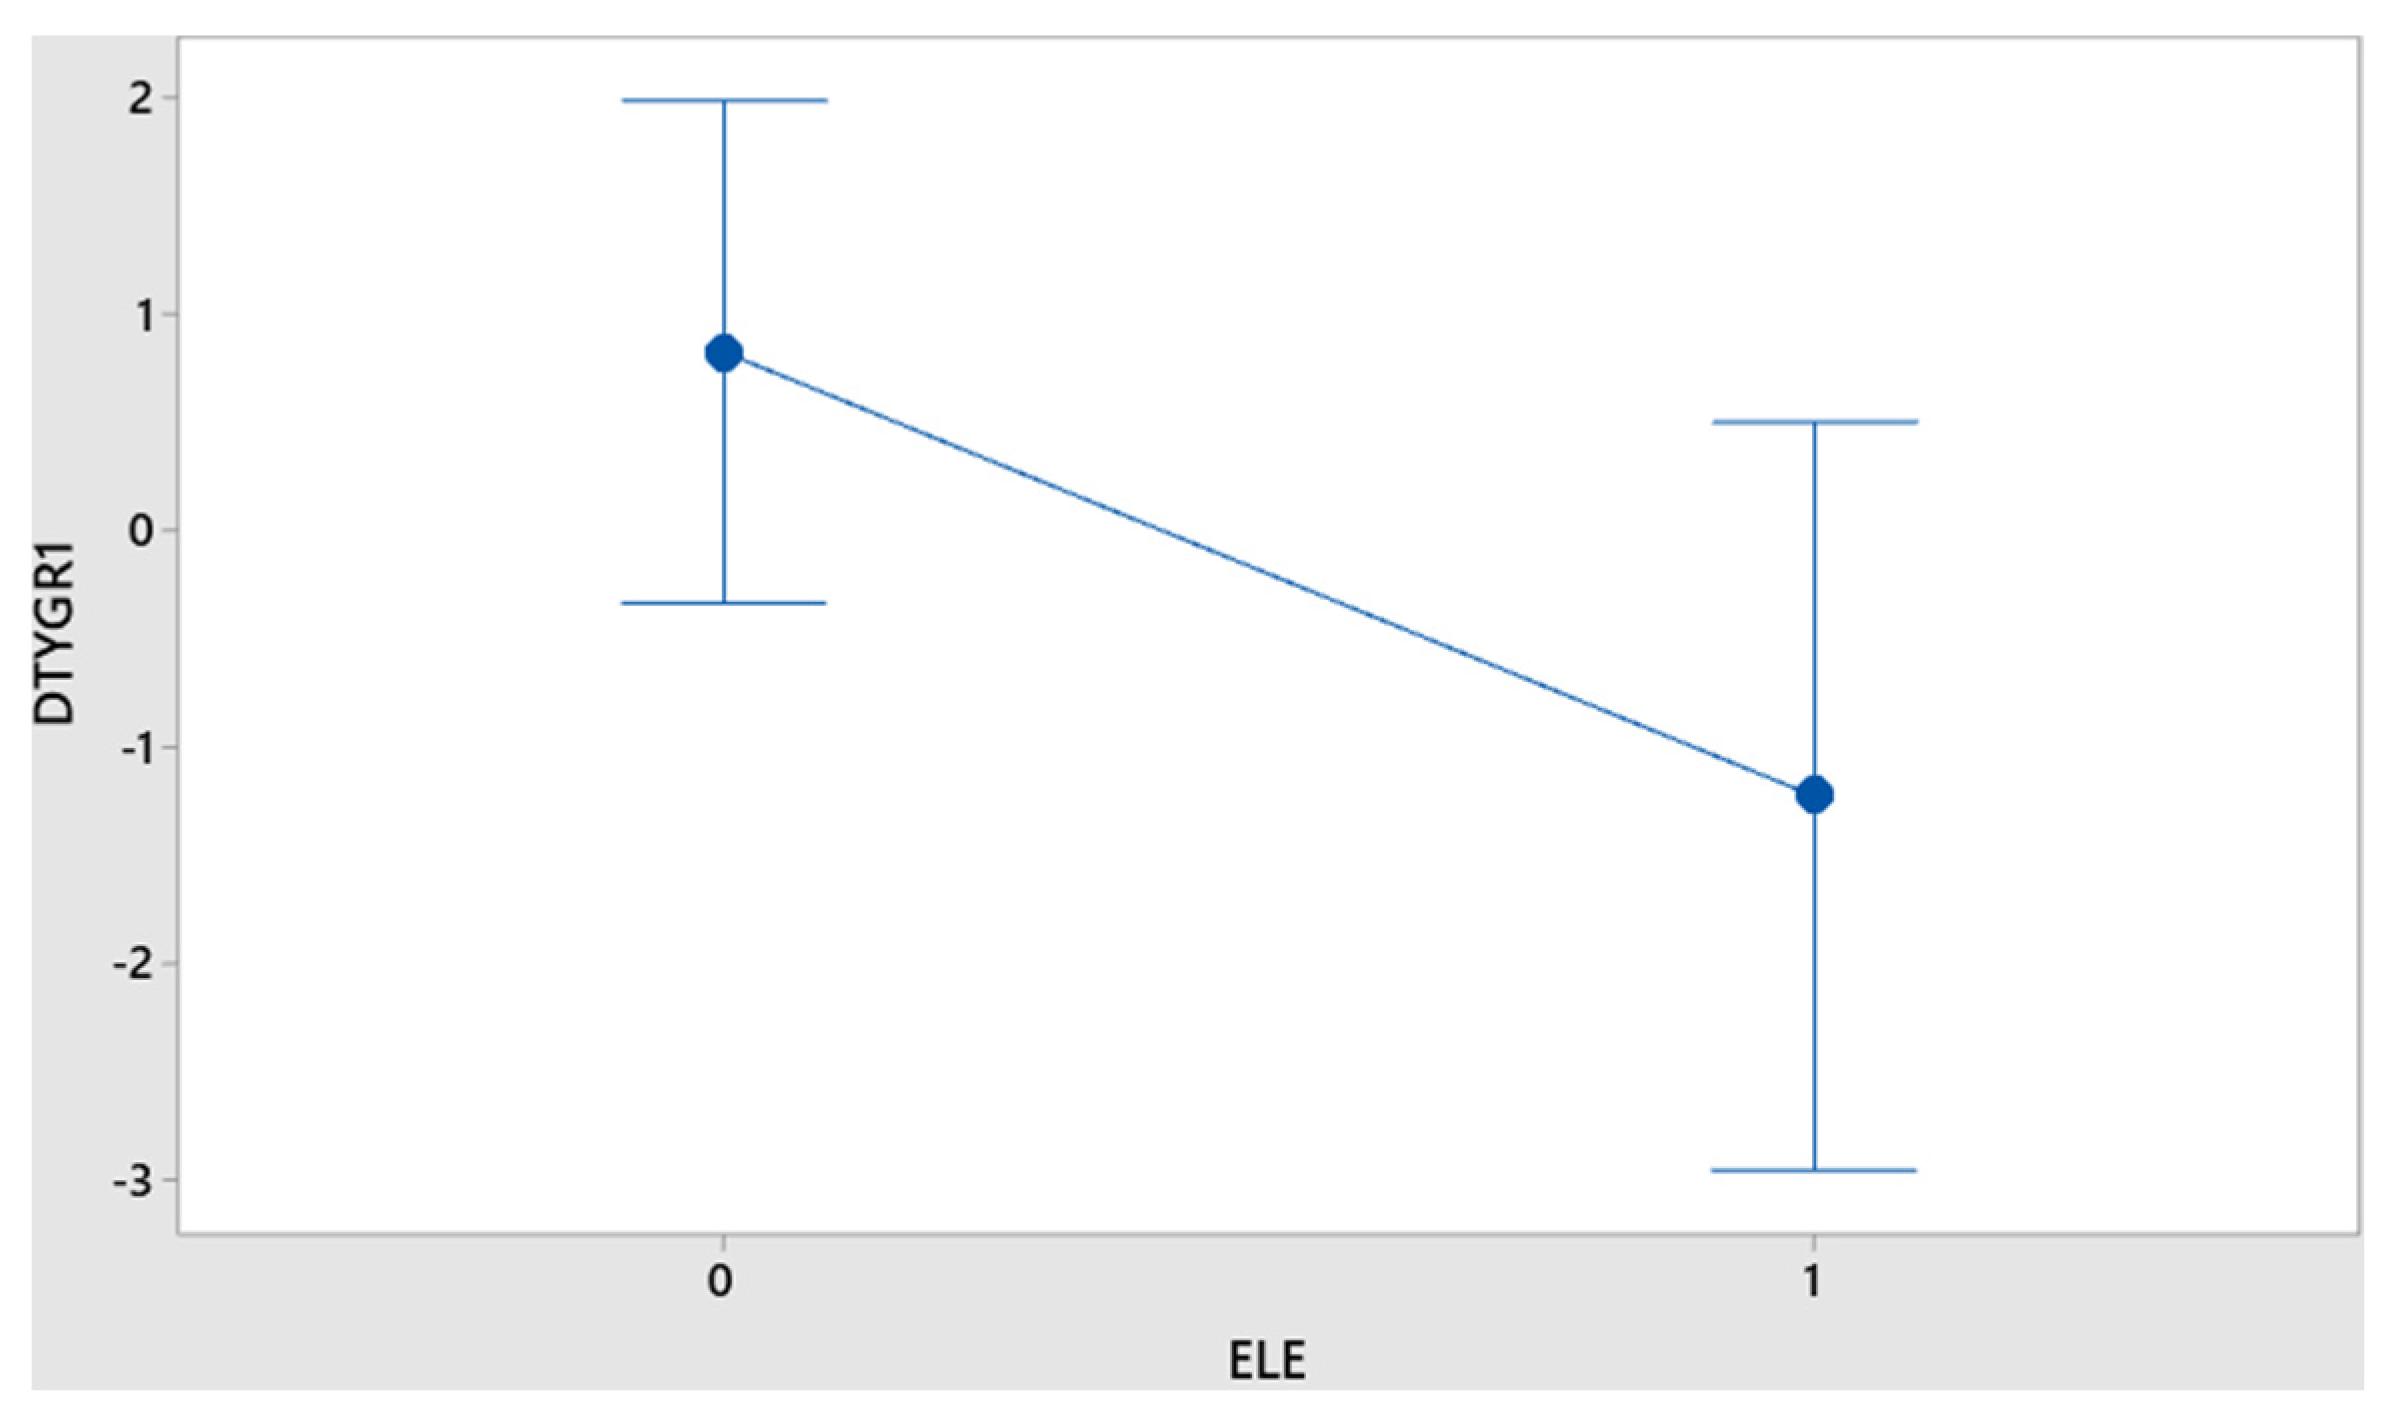
In order to investigate possible differences in the mean growth rate (%) of total (real) GDP between the two ELE groups (i.e., election and non-election years), the null hypothesis H0: μ1 − µ2 = 0 was tested against the alternative H1: μ1 − µ2 ≠ 0, where μ1 = Ε(DTYGR1|ELE = 0) and μ2 = Ε(DTYGR1|ELE = 1). H0 is rejected at α = 0.05, and the differences in the means of GDP growth are significant. The results of our analysis were presented in Table 7 and Figure 6.

3.6. Discussing the Outcomes of Econometric Models (1 to 5)

The models illustrated above have a good fit as the adjusted R2 was systematically above 0.7. In all of them, the actual budget balances (which correspond to public deficits in the case of Greece) were strongly correlated to their one-year lagged values (the coefficient of ABB-1 is 0.75 and 0.53, respectively, in Models 1 and 2). The impact of ABB-1 was reduced slightly when considering the two-year lagged variable ABB-2 (ABB-1 coefficient ranged between 0.37 in Model 3 and 0.43 in Model 4, while ABB-2 coefficient ranged between 0.22 in Model 4 and 0.29 in Model 5). Hence, we conclude that public deficits were persistent in Greece, adjusting slowly over longer periods of time that could last up to two years.
Regarding the impact of the external sector of the economy (EXPO, IMPO, BAGS), exports of goods and services tend to reduce the budget deficit, while imports seem to increase it (Models 2 and 3). Moreover, the balance of goods and services (BAGS = EXPO − IMPO) tends to reduce the budget deficit (Models 4 and 5). This result is a strong indication for the presence of ‘twin deficits’ in the case of the Greek economy. In particular, according to the ‘twin deficits hypothesis’, large and growing budget deficits are reflected in the widening of the current account deficit, leading to declining economic policy credibility, macroeconomic imbalances, and a slowdown in economic growth. Although making use of different approaches, these findings are in line with earlier literature testing this hypothesis for Greece (Vamvoukas 1999; Pantelidis et al. 2009; Kalou and Paleologou 2012; Magazzino 2012; Piersanti 2000; Forte and Magazzino 2013; Panousis and Koukouritakis 2020; Katrakilidis and Trachanas 2011; Paparas et al. 2016; Kosteletou 2013). Few additional studies ended up with more mixed, and sometimes contrasting, results (Algieri 2013; Papadogonas and Stournaras 2006).
The results of all econometric models presented in our study demonstrate how the growth rate of real GDP positively affects the actual budget balance, reducing budget deficits. The coefficient of GDP growth rate varied between 0.335 (Model 2) and 0.221 (Model 1). This finding implies that during times of economic slowdown, Greek governments tend to respond with expansionary fiscal policies. Unemployment also affected the dependent variable in a positive way, although with a relatively low coefficient (0.162 in Model 1 and 0.117 in Model 5). This correlation appears counterintuitive at first (sensu Rontos et al. 2019). However, economic dynamics in the 2010s may justify this outcome in the case of Greece, since the country was under budgetary supervision by the European Institutions (‘Troika memoranda’). In that decade, budget deficits were strictly controlled, and unemployment skyrocketed to unprecedented levels, fueling income inequalities and rising social segregation, especially in urban areas (Gavalas et al. 2014; Di Feliciantonio and Salvati 2015; Panori et al. 2019; Rontos et al. 2016; Salvati 2016, 2018).
Election years (ELE) were found statistically significant in all econometric models. In other words, the political cycle (general parliamentary elections) in Greece was demonstrated to significantly affect the actual budget balance as a percent share of GDP. In all models, the ELE coefficient was higher than −1.5, ranging between −1.72 (Model 4) to −1.77 (Model 3). That is, in the years of general (or national) elections, budget deficits increased by more than 1.5% of GDP. More precisely, the increase was as high as 1.84% of GDP according to Model 1, 1.73%, 1.77%, 1.72% and 1.74% of GDP, respectively, according to Models 2, 3, 4, and 5. This effect is disproportionately high in comparison with other developed economies, where the effects of budget cycles have been estimated to be well below 1% of GDP (Andrikopoulos et al. 2004) and, in most cases, insignificant (Mandon and Cazals 2019).
We finally investigated the relationship between general elections (ELE) and changes over time in the growth rate of real GDP (DTYGR1) between 1974 and 2019. Descriptive statistics indicate that in non-election years, economic growth rates amounted to 0.82%, on average. On the contrary, in election years, the value of economic output decreased at a rate of 1.23% on average. This evidence suggests how the electoral cycle in Greece has serious destabilizing effects on total real output.

4. Concluding Remarks

The empirical results of our study demonstrate how severe political budget cycles have characterized Greece since 1974. These persistent political budget (or fiscal) cycles have contributed to the country’s public debt. Moreover, the political budget cycles in Greece have played a destabilizing or pro-cyclical role, in terms of their effects on the country’s real GDP. This is mainly due to the fact that the cycles materialize through an ‘unproductive’ public expenditures’ increase, especially a rise in social transfers, during the election years (Petrakos et al. 2021d). It is therefore crucial to restrict political budget cycles, basically to improve the country’s public finances and to stabilize the Greek economy—considering that the country had lost 30% of its real GDP between 2007 and 2020. Moreover, at the end of 2021, the gross debt of the general government in Greece had skyrocketed to 209% of its GDP, a magnitude more than two times higher than the corresponding average of the Eurozone (102% of GDP).
In addition, the existence of large political budget cycles suggests that certain socio-political characteristics in Greece—such as low-quality political institutions and insufficient control mechanisms or ineffective checks and balances—strongly resemble those of developing countries. These characteristics are basically the result of low-quality governance. Consequently, the effects of the electoral cycles cannot be ignored by any systematic scrutiny of the reforms needed to boost economic growth and to reduce budget deficits and public debt. Short-term performances of the external sector of the economy, namely, the balance of goods and services, were finally documented to affect the budget balance in Greece. Reduced external sector deficits and, more generally, a reduction in the balance of payments deficits, may contribute to the handling of budget deficits. Since the improvement of the trade balance is the result of the rising competitiveness of a given economic system, this should be a long-term objective of economic policy pursued through the implementation of specific strategies. Such issues are arguably among the most serious structural problems of the Greek economy and, as such, call for an effective and immediate policy response.

Author Contributions

Conceptualization, G.P. and I.V.; methodology, C.V. and K.R.; software, C.V. and L.S.; validation, I.V. and G.P.; formal analysis, C.V. and K.R.; investigation, L.S.; resources, I.V.; data curation, K.R.; writing—original draft preparation, I.V. and C.V.; writing—review and editing, K.R. and L.S.; visualization, G.P. and C.V.; supervision, I.V.; project administration, I.V. All authors have read and agreed to the published version of the manuscript.

Funding

This research received no external funding.

Data Availability Statement

The data presented in this study are available on request from the corresponding author.

Conflicts of Interest

The authors declare no conflict of interest.

Notes

1
See Eurostat, online data code: GOV_10DD_EDPT1, update: 22 February 2022.
2
3
Another factor that may influence the occurrence of political budget cycles is uncertainty regarding the outcome of the forthcoming elections, given that if governments are very confident of their re-election possibilities, they have limited motivation or no motivation at all to resort to them (Schultz 1995; Alt and Rose 2007; Hanusch and Magleby 2014; Eibl and Lynge-Mangueira 2017).

References

  1. Afonso, António, Florence Huart, João Tovar Jalles, and Piotr Stanek. 2022. Twin deficits revisited: A role for fiscal institutions? Journal of International Money and Finance 121: 102506. [Google Scholar] [CrossRef]
  2. Afonso, António, Sotirios Zartaloudis, and Yannis Papadopoulos. 2015. How party linkages shape austerity politics: Clientelism and fiscal adjustment in Greece and Portugal during the eurozone crisis. Journal of European Public Policy 22: 315–34. [Google Scholar] [CrossRef]
  3. Aidt, Toke S., Francisco José Veiga, and Linda Gonçalves Veiga. 2011. Election results and opportunistic policies: A new test of the rational political business cycle model. Public Choice 148: 21–44. [Google Scholar] [CrossRef]
  4. Alesina, Alberto. 1987. Macroeconomic policy in a two-party system as a repeated game. Quarterly Journal of Economics 102: 651–78. [Google Scholar] [CrossRef]
  5. Alesina, Alberto. 1988. Credibility and policy convergence in a two-party system with rational voters. American Economic Review 78: 796–805. [Google Scholar]
  6. Alesina, Alberto, and Roberto Perotti. 1995. The political economy of budget deficits. International Monetary Fund Staff Papers 42: 1–31. [Google Scholar] [CrossRef]
  7. Algieri, Bernardina. 2013. An empirical analysis of the nexus between external balance and government budget balance: The case of the GIIPS countries. Economic Systems 37: 233–53. [Google Scholar] [CrossRef]
  8. Alt, James E., and Shanna S. Rose. 2007. Context-conditional political business cycles. In Oxford Handbook of Comparative Politics. Edited by Carles Boix and Susan C. Stokes. Oxford: Oxford University Press, pp. 845–67. [Google Scholar]
  9. Andrikopoulos, Andreas, Ioannis Loizides, and Kyprianos Prodromidis. 2004. Fiscal policy and political business cycles in the EU. European Journal of Political Economy 20: 125–52. [Google Scholar] [CrossRef]
  10. Badinger, Harald, Aurélien Fichet de Clairfontaine, and Wolf Heinrich Reuter. 2017. Fiscal rules and twin deficits: The link between fiscal and external balances. World Economy 40: 21–35. [Google Scholar] [CrossRef]
  11. Benassi, Federico, Alessia Naccarato, Ricardo Iglesias-Pascual, Luca Salvati, and Salvatore Strozza. 2022. Measuring residential segregation in multi-ethnic and unequal European cities. International Migration. [Google Scholar] [CrossRef]
  12. Block, Steven. A. 2002. Political business cycles, democratization, and economic reform: The case of Africa. Journal of Development Economics 67: 205–28. [Google Scholar] [CrossRef]
  13. Bohn, Frank. 2019. Political budget cycles, incumbency advantage, and propaganda. Economics and Politics 31: 43–70. [Google Scholar] [CrossRef]
  14. Bonfiglioli, Alessandra, and Gino Gancia. 2013. Uncertainty, electoral incentives and political myopia. The Economic Journal 123: 373–400. [Google Scholar] [CrossRef]
  15. Brender, Adi, and Allan Drazen. 2005. Political budget cycles in new versus established democracies. Journal of Monetary Economics 52: 1271–95. [Google Scholar] [CrossRef]
  16. Brender, Adi, and Allan Drazen. 2008. How do budget deficits and economic growth affect reelection prospects? Evidence from a large panel of countries. American Economic Review 98: 2203–20. [Google Scholar] [CrossRef]
  17. Cavallo, Michele. 2005. Understanding the Twin Deficits: New Approaches, New Results. FRBSF Economic Letter. San Francisco: Federal Reserve Bank of San Francisco. [Google Scholar]
  18. Chang, Eric C. C. 2008. Electoral incentives and budgetary spending: Rethinking the role of political institutions. The Journal of Politics 70: 1086–97. [Google Scholar] [CrossRef]
  19. Chortareas, Georgios, Vassilis E. Logothetis, and Andreas A. Papandreou. 2018. Elections and opportunistic budgetary policies in Greece. Managerial and Decision Economics 40: 854–62. [Google Scholar] [CrossRef]
  20. Christodoulakis, Nicos. 2019. Greece and the Euro Area: The Cost of Weak Institutions. CGK Working Paper No. 2019-05. Medford: The Fletcher School, Tufts University, May. [Google Scholar]
  21. Ciommi, Mariateresa, Francesco M. Chelli, and Luca Salvati. 2019. Integrating parametric and non-parametric multivariate analysis of urban growth and commuting patterns in a European metropolitan area. Quality & Quantity 53: 957–79. [Google Scholar]
  22. Ciommi, Mariateresa, Francesco M. Chelli, Margherita Carlucci, and Luca Salvati. 2018. Urban growth and demographic dynamics in southern Europe: Toward a new statistical approach to regional science. Sustainability 10: 2765. [Google Scholar] [CrossRef]
  23. Corsetti, Giancarlo, and Gernot J. Müller. 2006. Twin deficits: Squaring theory, evidence and common sense. Economic Policy 21: 598–638. [Google Scholar] [CrossRef]
  24. De Haan, Jakob. 2013. Democracy, elections and government budget deficits. German Economic Review 15: 131–42. [Google Scholar] [CrossRef]
  25. De Haan, Jakob, and Jeroen Klomp. 2013. Political budget cycles and election outcomes. Public Choice 157: 245–67. [Google Scholar]
  26. Di Feliciantonio, Cesare, and Luca Salvati. 2015. ‘Southern’ Alternatives of Urban Diffusion: Investigating Settlement Characteristics and Socio-Economic Patterns in Three Mediterranean Regions. Tijdschrift voor Economische en Sociale Geografie 106: 453–70. [Google Scholar] [CrossRef]
  27. Di Feliciantonio, Cesare, Luca Salvati, Efthymia Sarantakou, and Kostas Rontos. 2018. Class diversification, economic growth and urban sprawl: Evidences from a pre-crisis European city. Quality & Quantity 52: 1501–22. [Google Scholar]
  28. Downs, Anthony. 1957. An Economic Theory of Democracy. New York: Harper & Row. [Google Scholar]
  29. Dubois, Eric. 2016. Political business cycles 40 years after Nordhaus. Public Choice 166: 235–59. [Google Scholar] [CrossRef]
  30. Eibl, Ferdinand, and Halfdan Lynge-Mangueira. 2017. Electoral confidence and political budget cycles in non-OECD countries. Studies in Comparative International Development 52: 45–63. [Google Scholar] [CrossRef]
  31. Eslava, Marcela. 2011. The political economy of fiscal deficits: A survey. Journal of Economic Surveys 25: 645–73. [Google Scholar] [CrossRef]
  32. Forte, Francesco, and Cosimo Magazzino. 2013. Twin deficits in the European countries. International Advances in Economic Research 19: 289–310. [Google Scholar] [CrossRef]
  33. Garcia, Israel, and Bernd Hayo. 2021. Political budget cycles revisited: Testing the signaling process. European Journal of Political Economy 69: 1–18. [Google Scholar] [CrossRef]
  34. Gavalas, Vasilis S., Kostas Rontos, and Luca Salvati. 2014. Who becomes an unwed mother in Greece? Sociodemographic and geographical aspects of an emerging phenomenon. Population, Space and Place 20: 250–63. [Google Scholar] [CrossRef]
  35. Gkartzios, Menelaos. 2013. ‘Leaving Athens’: Narratives of counterurbanisation in times of crisis. Journal of Rural Studies 32: 158–67. [Google Scholar] [CrossRef]
  36. Gootjes, Bram, Jakob de Haan, and Richard Jong-A-Pin. 2021. Do fiscal rules constrain political budget cycles? Public Choice 188: 1–30. [Google Scholar] [CrossRef]
  37. Hanusch, Marek, and Daniel B. Magleby. 2014. Popularity, polarization, and political budget cycles. Public Choice 159: 457–67. [Google Scholar] [CrossRef]
  38. Kalou, Sofia, and Suzanna-Maria Paleologou. 2012. The twin deficits hypothesis: Revisiting an EMU country. Journal of Policy Modeling 34: 230–41. [Google Scholar] [CrossRef]
  39. Katrakilidis, Constantinos P., and Emmanouil Trachanas. 2011. Has the accession of Greece in the EU influenced the dynamics of the country’s “twin deficits”? An empirical investigation. European Research Studies Journal 14: 45–54. [Google Scholar]
  40. Katsimi, Margarita, and Vassilis Sarantides. 2012. Do elections affect the composition of fiscal policy in developed, established democracies? Public Choice 151: 352–62. [Google Scholar] [CrossRef]
  41. Kim, Soyoung, and Nouriel Roubini. 2008. Twin deficit or twin divergence? Fiscal policy, current account, and real exchange rate in the U.S. Journal of International Economics 74: 362–83. [Google Scholar] [CrossRef]
  42. Klomp, Jeroen, and Jakob de Haan. 2013. Do political budget cycles really exist? Applied Economics 45: 329–41. [Google Scholar] [CrossRef]
  43. Kosteletou, Nikolina E. 2013. Financial integration, euro and the twin deficits of southern eurozone countries. Panoeconomicus 60: 161–78. [Google Scholar] [CrossRef]
  44. Lamonica, Giuseppe R., Maria C. Recchioni, Francesco M. Chelli, and Luca Salvati. 2020. The efficiency of the cross-entropy method when estimating the technical coefficients of input–output tables. Spatial Economic Analysis 15: 62–91. [Google Scholar] [CrossRef]
  45. Magazzino, Cosimo. 2012. Fiscal policy, consumption and current account in the European countries. Economics Bulletin 32: 1330–44. [Google Scholar]
  46. Mandon, Pierre, and Antoine Cazals. 2019. Political budget cycles: Manipulation by leaders versus manipulation by researchers? Evidence from a meta-regression analysis. Journal of Economic Surveys 33: 274–308. [Google Scholar] [CrossRef]
  47. Miller, Stephen M., and Frank S. Russek. 1989. Are the twin deficits really related? Contemporary Economic Policy 7: 91–115. [Google Scholar] [CrossRef]
  48. Mitsopoulos, Michaele, and Theodore Pelagidis. 2011. Understanding the Crisis in Greece: From Boom to Bust. Basingstoke: Palgrave Macmillan. [Google Scholar]
  49. Nordhaus, William D. 1975. The political business cycle. Review of Economic Studies 42: 169–90. [Google Scholar] [CrossRef]
  50. Panori, Anastasia, Yannis Psycharis, and Dimitris Ballas. 2019. Spatial segregation and migration in the city of Athens: Investigating the evolution of urban socio-spatial immigrant structures. Population, Space and Place 25: e2209. [Google Scholar] [CrossRef]
  51. Panousis, Konstantinos P., and Minoas Koukouritakis. 2020. Twin deficits: Evidence from Portugal, Italy, Spain and Greece. Intereconomics 55: 332–38. [Google Scholar] [CrossRef]
  52. Pantelidis, Panagiotis, Emmanouil Trachanas, and Athanasios L. Athanasenas. 2009. On the dynamics of the Greek twin deficits: Empirical evidence over the period 1960–2007. International Journal of Economic Sciences and Applied Research 2: 9–32. [Google Scholar]
  53. Papadogonas, Theodore, and Yannis Stournaras. 2006. Twin deficits and financial integration in EU member-states. Journal of Policy Modeling 28: 595–602. [Google Scholar] [CrossRef]
  54. Paparas, Dimitrios, Christian Richter, and Hairong Mu. 2016. An econometric analysis of the twin deficits hypothesis in Greece during the period 1960–2014. Applied Economics Quarterly 62: 341–60. [Google Scholar] [CrossRef]
  55. Persson, Torsten, and Guido Tabellini. 2000. Political Economics: Explaining Economic Policy. Cambridge: The MIT Press. [Google Scholar]
  56. Persson, Torsten, and Guido Tabellini. 2005. The Economic Effects of Constitutions. Cambridge: The MIT Press. [Google Scholar]
  57. Petrakos, George, Kostantinos Rontos, Chara Vavoura, and Ioannis Vavouras. 2021a. The mechanism of political budget cycles in Greece. Paper presented at 2020 International Conference on Applied Economics (ICOAE 2020): Advances in Longitudinal Data Methods in Applied Economic Research, Virtual, July 2–3; Springer Proceedings in Business and Economics. Edited by Nicholas Tsounis and Aspasia Vlachei. Berlin and Heidelberg: Springer, pp. 123–33. [Google Scholar]
  58. Petrakos, George, Konstantinos Rontos, Chara Vavoura, and Ioannis Vavouras. 2021b. The destabilizing effects of political budget cycles: The case of Greece. Paper presented at the International Conference on Applied Economics (ICOAE): Advances in Quantitative Economic Research, Heraklion Crete, Greece, June 30; Springer Proceedings in Business and Economics. Berlin: Springer. [Google Scholar]
  59. Petrakos, George, Konstantinos Rontos, Chara Vavoura, Luca Salvati, and Ioannis Vavouras. 2021c. Political budget cycles and the effects of the Excessive Deficit Procedure: The case of Greece. Regional Statistics 11: 1–20. [Google Scholar] [CrossRef]
  60. Petrakos, George, Konstantinos Rontos, Chara Vavoura, Luca Salvati, and Ioannis Vavouras. 2021d. Toward a political budget cycle? Unveiling long-term latent paths in Greece. Quality and Quantity. [Google Scholar] [CrossRef]
  61. Philips, Andrew Q. 2016. Seeing the forest through the trees: A meta-analysis of political budget cycles. Public Choice 168: 313–41. [Google Scholar] [CrossRef]
  62. Piersanti, Giovanni. 2000. Current account dynamics and expected future budget deficits: Some international evidence. Journal of international Money and Finance 19: 255–71. [Google Scholar] [CrossRef]
  63. Rogoff, Kenneth. 1990. Equilibrium political budget cycles. American Economic Review 80: 21–36. [Google Scholar]
  64. Rogoff, Kenneth, and Anne Sibert. 1988. Elections and macro-economic policy cycles. Review of Economic Studies 55: 1–16. [Google Scholar] [CrossRef]
  65. Rontos, Kostas, Efstathios Grigoriadis, Adele Sateriano, Maria Syrmali, Ioannis Vavouras, and Luca Salvati. 2016. Lost in protest, found in segregation: Divided cities in the light of the 2015 “Oχι” referendum in Greece. City, Culture and Society 7: 139–48. [Google Scholar] [CrossRef]
  66. Rontos, Kostas, Ioannis Vavouras, Maria Teresa Ciommi, and Luca Salvati. 2019. Two faces of the same coin? A comparative, global approach to corruption and socioeconomic development. Quality & Quantity 53: 1875–94. [Google Scholar]
  67. Salvati, Luca. 2016. The dark side of the crisis: Disparities in per capita income (2000–12) and the urban-rural gradient in Greece. Tijdschrift voor Economische en Sociale Geografie 107: 628–41. [Google Scholar] [CrossRef]
  68. Salvati, Luca. 2018. Population growth and the economic crisis: Understanding latent patterns of change in Greece, 2002–16. Letters in Spatial and Resource Sciences 11: 105–26. [Google Scholar] [CrossRef]
  69. Salvati, Luca. 2019. Bridging the divide: Demographic dynamics and urban–rural polarities during economic expansion and recession in Greece. Population, Space and Place 25: e2267. [Google Scholar] [CrossRef]
  70. Salvati, Luca. 2022. Exploring long-term urban cycles with multivariate time-series analysis. Environment and Planning B: Urban Analytics and City Science 49: 1212–27. [Google Scholar] [CrossRef]
  71. Salvati, Luca, and Federico Benassi. 2021. Rise (and decline) of European migrants in Greece: Exploring spatial determinants of residential mobility (1988–2017), with special focus on older ages. Journal of International Migration and Integration 22: 599–613. [Google Scholar] [CrossRef]
  72. Salvia, Rosanna, Gianluca Egidi, Luca Salvati, Jesús Rodrigo-Comino, and Giovanni Quaranta. 2020. In-between ‘Smart’urban growth and ‘Sluggish’rural development? reframing population dynamics in Greece, 1940–2019. Sustainability 12: 6165. [Google Scholar] [CrossRef]
  73. Schultz, Kenneth A. 1995. The politics of the political business cycle. British Journal of Political Science 25: 79–99. [Google Scholar] [CrossRef]
  74. Shi, Min, and Jakob Svensson. 2003. Political budget cycles: A review of recent developments. Nordic Journal of Political Economy 29: 69–76. [Google Scholar]
  75. Shi, Min, and Jakob Svensson. 2006. Political budget cycles: Do they differ across countries and why? Journal of Public Economics 90: 1367–89. [Google Scholar] [CrossRef]
  76. Streb, Jorge M., and Gustavo Torrens. 2013. Making rules credible: Divided government and political budget cycles. Public Choice 156: 703–22. [Google Scholar] [CrossRef]
  77. Tomao, Antonio, Giovanni Quaranta, Rosanna Salvia, Sabato Vinci, and Luca Salvati. 2021. Revisiting the ‘southern mood’? Post-crisis Mediterranean urbanities between economic downturns and land-use change. Land Use Policy 111: 105740. [Google Scholar] [CrossRef]
  78. Trantidis, Aris. 2016. Clientelism and Economic Policy: Greece and the Crisis. Advances in European Politics (Book 126). London: Routledge. [Google Scholar]
  79. Vamvoukas, George A. 1999. The twin deficits phenomenon: Evidence from Greece. Applied Economics 31: 1093–100. [Google Scholar] [CrossRef]
  80. Veiga, Francisco José, Linda Gonçalves Veiga, and Atsuyoshi Morozumi. 2017. Political budget cycles and media freedom. Electoral Studies 45: 88–99. [Google Scholar] [CrossRef]
  81. Vinci, Sabato, Francesca Bartolacci, Rosanna Salvia, and Luca Salvati. 2022. Housing markets, the great crisis, and metropolitan gradients: Insights from Greece, 2000–14. Socio-Economic Planning Sciences 80: 101171. [Google Scholar] [CrossRef]
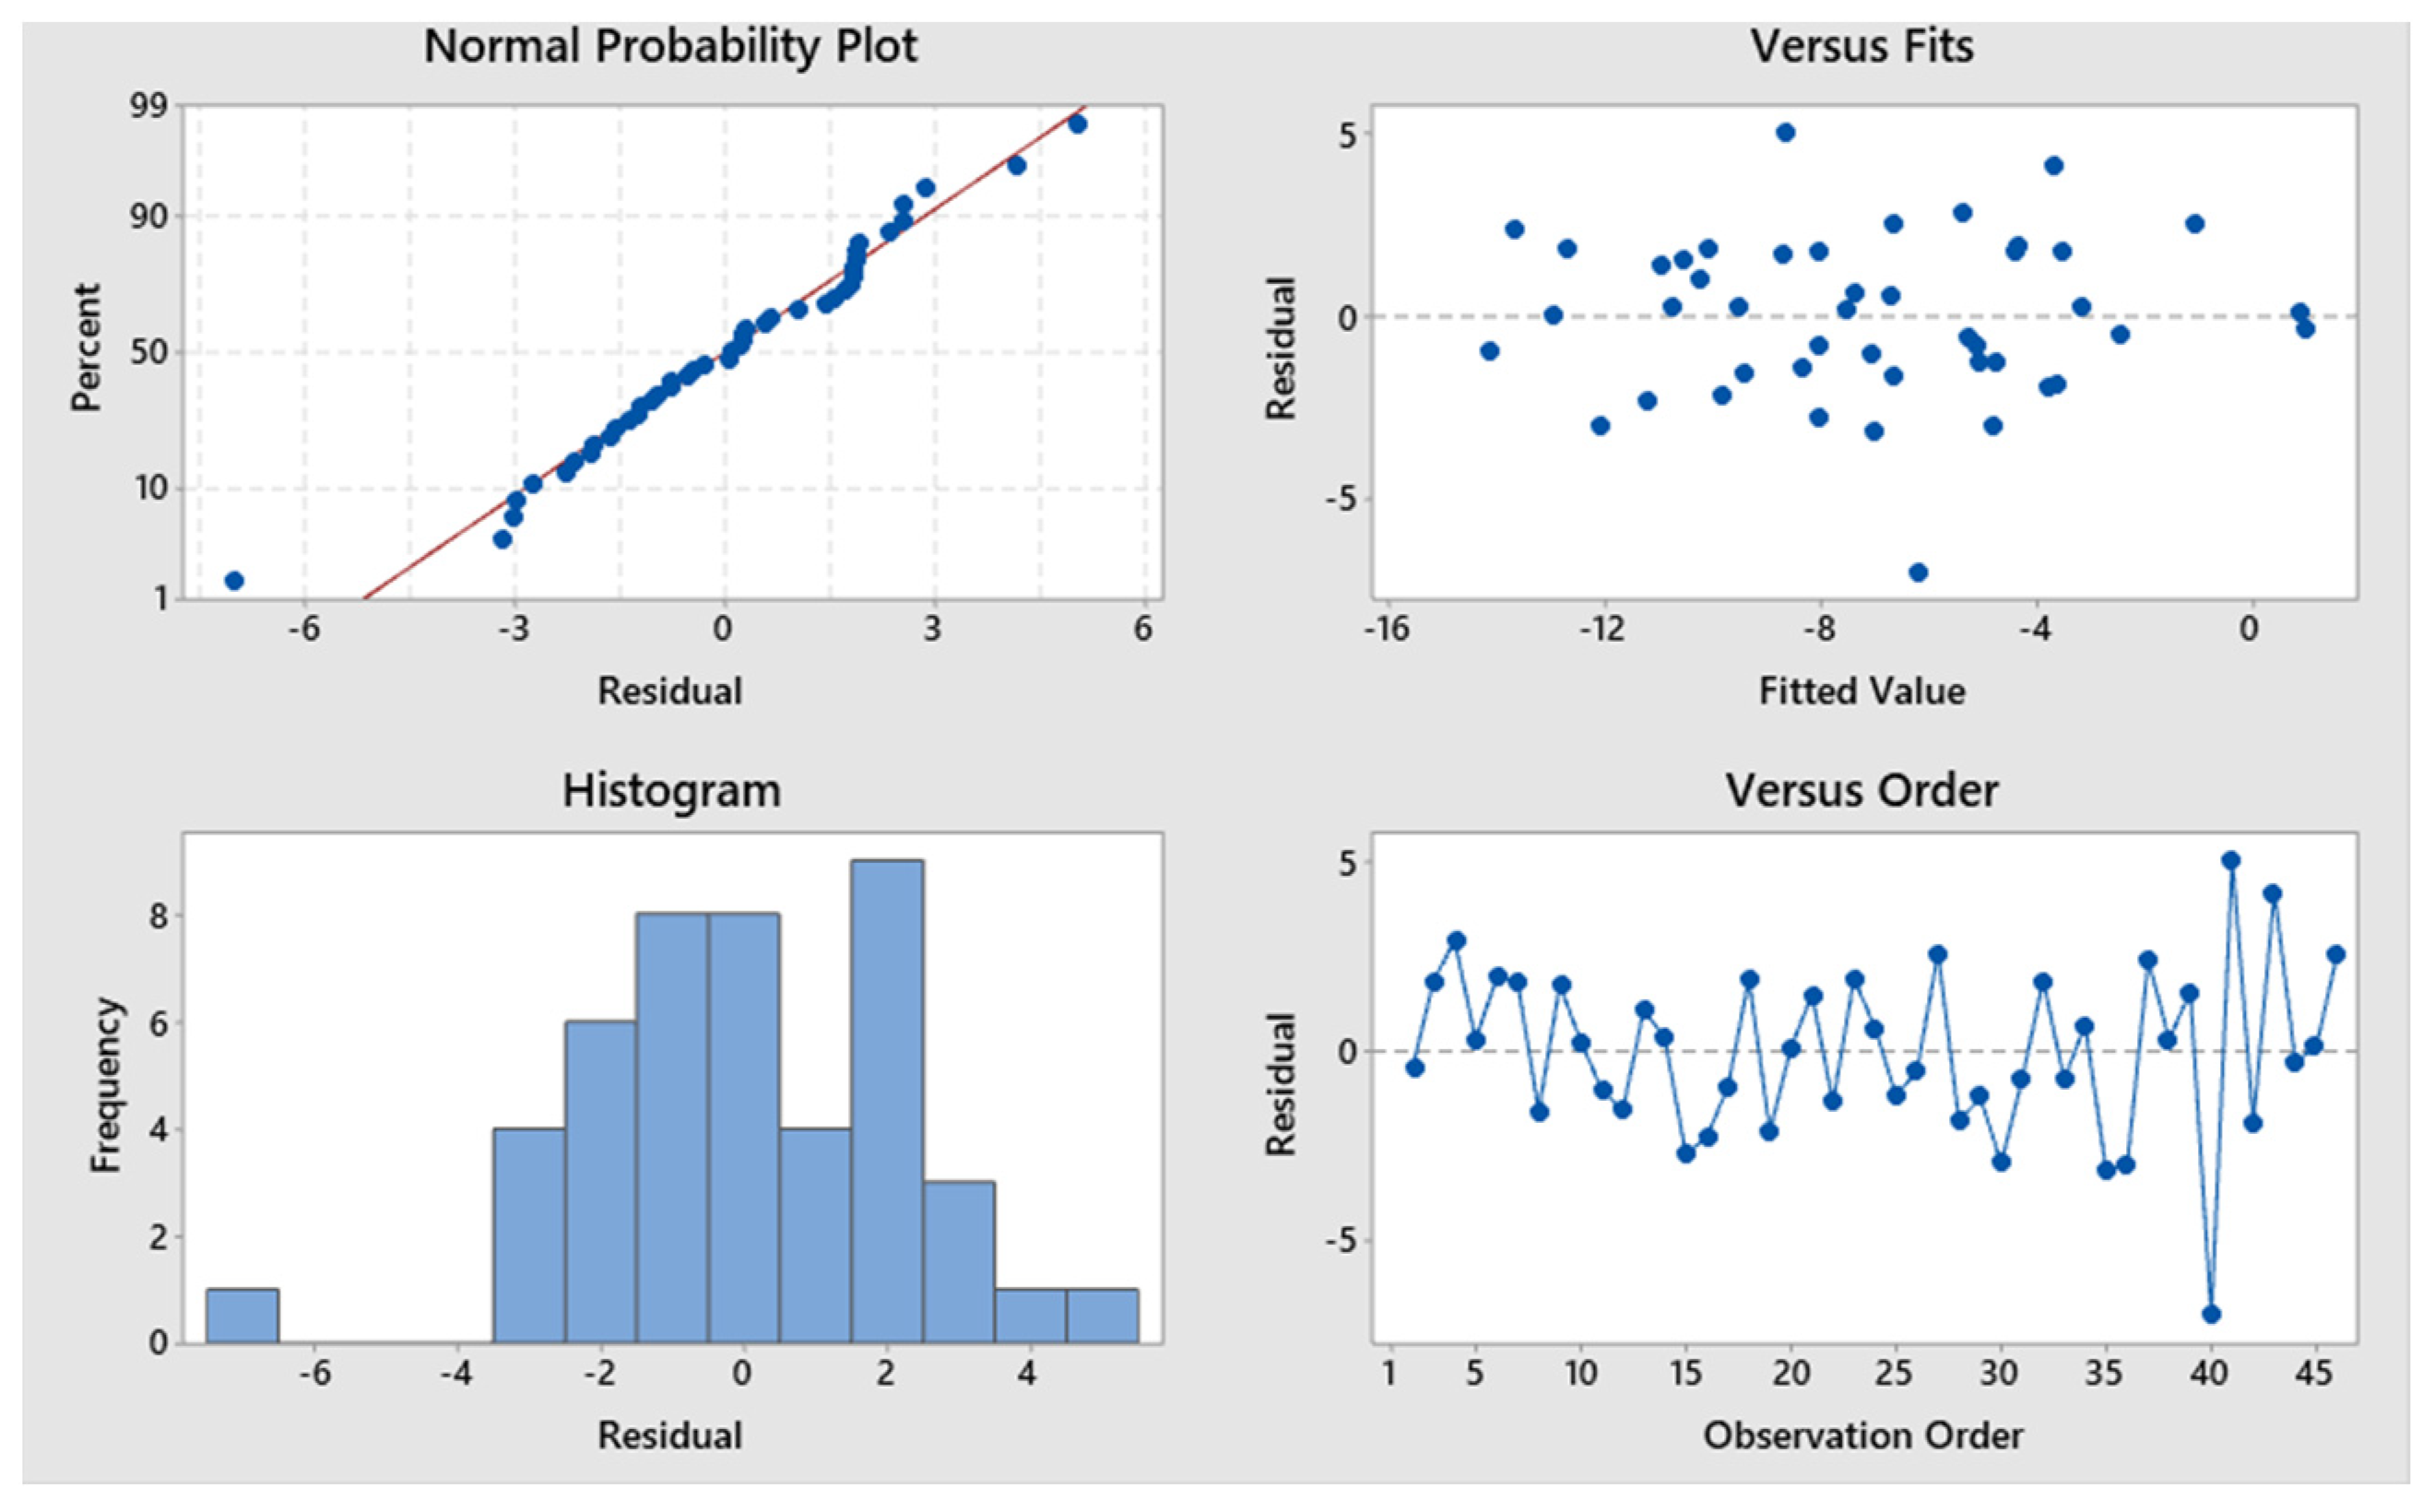
Figure 1. Residual plots for Model 1 with Actual Budget Balance as dependent variable.
Economies 10 00198 g001
Figure 2. Residual plots for Model 2 with Actual Budget Balance as the dependent variable.
Economies 10 00198 g002
Figure 3. Residual plots for Model 3 with Actual Budget Balance as the dependent variable.
Economies 10 00198 g003
Figure 4. Residual plots for Model 4 with Actual Budget Balance as the dependent variable.
Economies 10 00198 g004
Figure 5. Residual plots for Model 5 with Actual Budget Balance as the dependent variable.
Economies 10 00198 g005
Figure 6. Interval Plot (95% Confidence Interval around the mean) of changes over time in the growth rate (%) of total (real) Gross Domestic Product (DTYGR1) against election year (1) or non-election year (0); pooled standard deviation (3.20) was used to calculate the intervals.
Economies 10 00198 g006
Table 1. Specification of econometric models used in our analysis (Acronyms in Section 2.3).
ModelDependent VariablePredictors
1Actual Budget BalanceABB-1, TYGR, UNR, ELE
2Actual Budget BalanceABB-1, TYGR, EXPO, IMPO, ELE
3Actual Budget BalanceABB-1, ABB-2, TYGR, EXPO, IMPO, ELE
4Actual Budget BalanceABB-1, ABB-2, TYGR, BAGS, ELE
5Actual Budget BalanceABB-1, ABB-2, TYGR, BAGS, UNR, ELE
Table 2. Regression coefficients of Model 1 (see Table 1 and Section 2 for model’s description).
VariableCoefficientStandard Errort-Valuep-ValueVIF
Constant−3.181.170−2.710.010-
Budget Balance, previous year0.750.0988.020.0001.22
GDP growth0.220.1221.810.0781.52
Unemployment0.160.0572.830.0071.26
Election year−1.840.755−2.440.0191.02
Table 3. Regression coefficients of Model 2 (see Table 1 and Section 2 for the model description).
VariableCoefficientStandard Errort-Valuep-ValueVIF
Constant−3.7102.360−1.570.125-
Budget Balance, previous year0.5310.1084.930.0001.86
GDP growth0.3350.1222.740.0091.77
Exports0.4440.1223.630.0015.97
Imports−0.3120.140−2.240.0314.66
Election year−1.7330.708−2.450.0191.03
Table 4. Regression coefficients of Model 3 (see Table 1 and Section 2 for the model description).
VariableCoefficientStandard Errort-Valuep-ValueVIF
Constant−3.1002.410−1.280.207-
Budget Balance, previous year0.3650.1442.530.0163.29
Budget Balance, two years before0.2280.1301.760.0872.52
GDP growth0.3130.1212.580.0141.71
Exports0.4580.1213.780.0015.88
Imports−0.3260.138−2.360.0234.51
Election year−1.7670.701−2.520.0161.03
Table 5. Regression coefficients of Model 4 (see Table 1 and Section 2 for the model description).
VariableCoefficientStandard Errort-Valuep-ValueVIF
Constant1.0030.9791.020.312-
Budget Balance, previous year0.4260.1452.930.0063.12
Budget Balance, two years before0.2240.1341.680.1022.52
GDP growth0.2360.1182.010.0521.51
Balance of goods and services0.4490.1253.600.0011.52
Election year−1.7240.723−2.390.0221.03
Table 6. Regression coefficients of Model 5 (see Table 1 and Section 2 for the model description).
VariableCoefficientStandard Errort-Valuep-ValueVIF
Constant−0.9201.450−0.630.532-
Budget Balance, previous year0.4170.1412.950.0053.12
Budget Balance, two years before0.2900.1362.140.0392.73
GDP growth0.2740.1172.350.0241.56
Balance of goods and services0.3040.1472.060.0462.23
Unemployment rate0.1170.0671.750.0891.96
Election year−1.7440.704−2.480.0181.03
Table 7. Descriptive statistics of the growth rate (%) of total (real) Gross Domestic Product (DTYGR1) by election year.
YearNo. YearsMeanStandard Deviation95% Confidence Interval
No election310.8233.620(−0.338; 1.983)
Election14−1.2291.929(−2.956; 0.499)
Publisher’s Note: MDPI stays neutral with regard to jurisdictional claims in published maps and institutional affiliations.