
Investigation of Attributes Influencing the Attractiveness of Mobile Commerce Advertisements on the Facebook Platform

Abstract
1. Introduction
2. Literature Review
2.1. M-Commerce Versus E-Commerce
2.2. Mobile Commerce Advertising and Intention to Buy
3. Materials and Methods
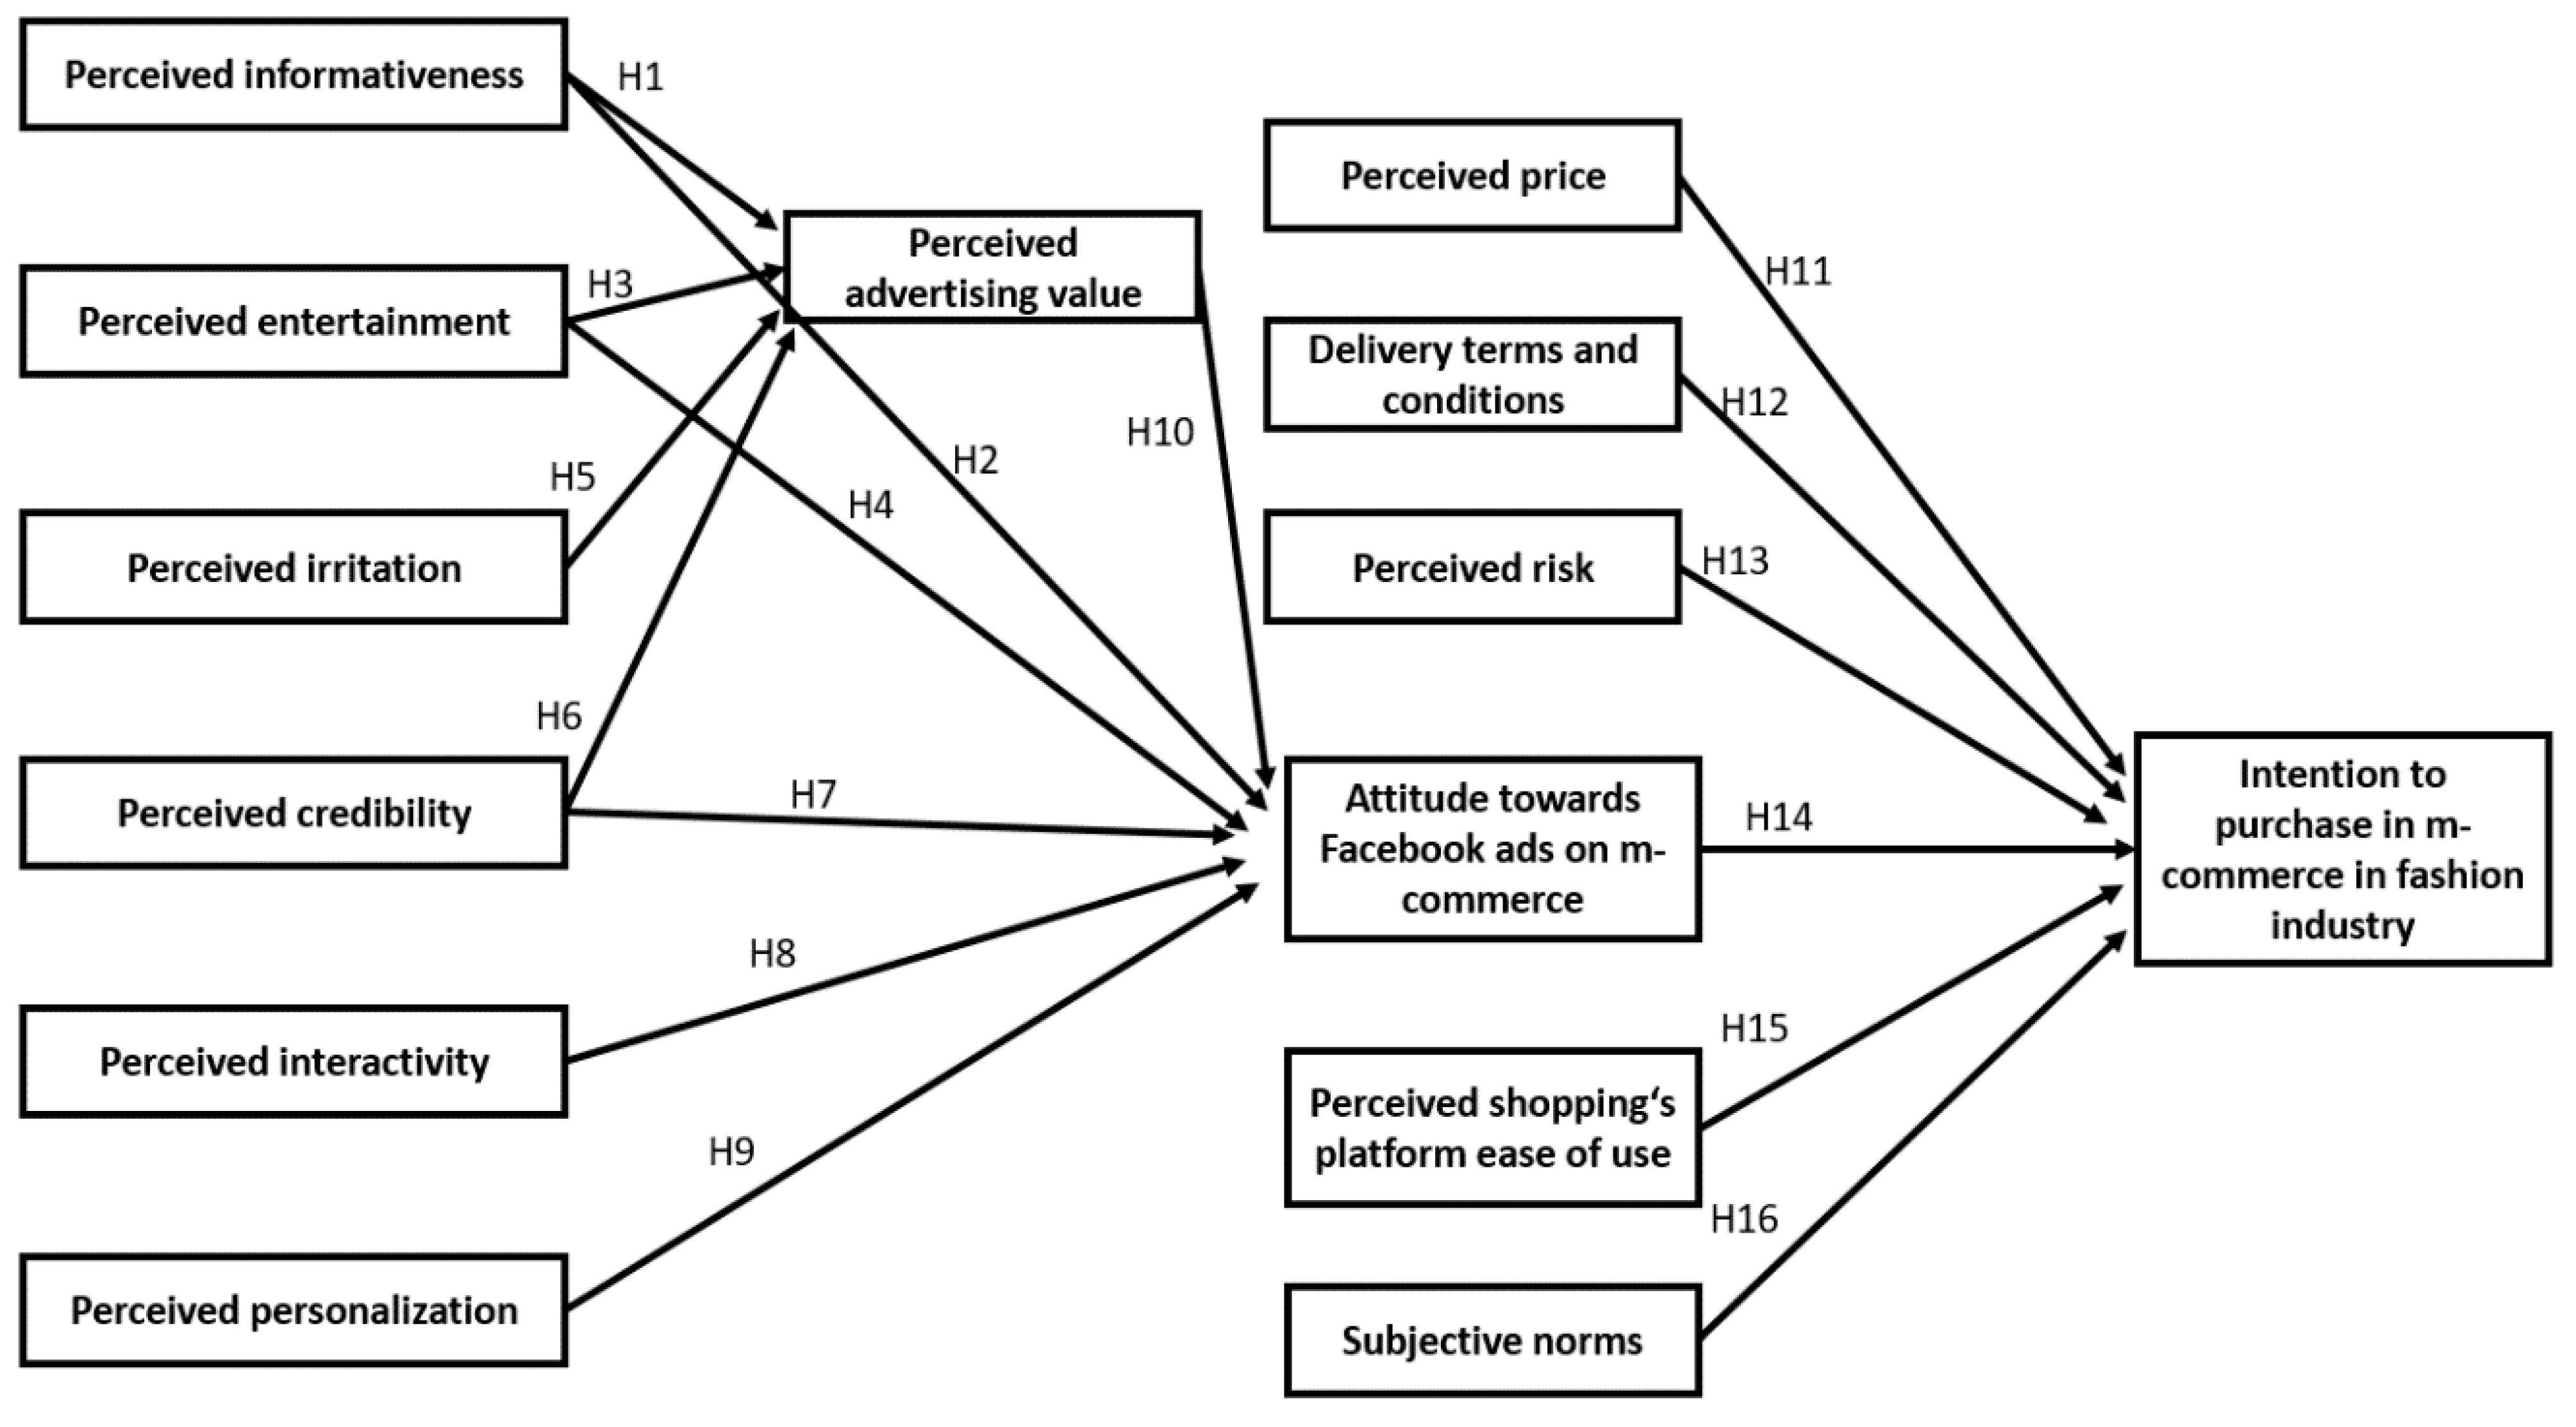
3.1. Hypotheses Building
3.1.1. Perceived Informativeness
3.1.2. Perceived Entertainment
3.1.3. Perceived Irritation
3.1.4. Perceived Credibility
3.1.5. Perceived Interactivity
3.1.6. Perceived Personalization
3.1.7. Perceived Advertising Value
3.1.8. Perceived Price
3.1.9. Delivery Terms and Conditions
3.1.10. Perceived Risk
3.1.11. Attitude towards Ads
3.1.12. Perceived Shopping Platform’s Ease of Use
3.1.13. Subjective Norm
3.2. Research Design and Reliability Indicators
4. Results
Sample Profile and Demographics
- Perceived Personalization (H9) due to poor scale reliability—Cronbach alpha’s below 0.5;
- Perceived Price (H11) due to poor scale reliability—Cronbach alpha’s below 0.5;
- Perceived Risk (H13) due to weak and negligible correlations with other variables.
5. Conclusions and Discussion
5.1. Managerial Implications
5.2. Research Limitations
Author Contributions
Funding
Conflicts of Interest
Appendix A

| Variable | Statement | Source |
|---|---|---|
| Perceived Informativeness | Clothes ads on Facebook via mobile are good sources of product information | Ducoffe (1996) |
| Clothes ads on Facebook via mobile supply relevant product information | Ducoffe (1996) | |
| Clothes ads on Facebook via mobile provide timely information | Ducoffe (1996) | |
| Clothes ads on Facebook via mobile are good sources of up-to-date product information | Ducoffe (1996) | |
| Clothes ads on Facebook via mobile are convenient sources of product information | Ducoffe (1996) | |
| Perceived Entertainment | Clothes ads on Facebook via mobile are entertaining. | Ducoffe (1996) |
| Clothes ads on Facebook via mobile are pleasing. | Ducoffe (1996) | |
| Clothes ads on Facebook via mobile are enjoyable. | Ducoffe (1996) | |
| Clothes ads on Facebook via mobile are fun. | Ducoffe (1996) | |
| Perceived Irritation | Clothes ads on Facebook via mobile are annoying. | Ducoffe (1996), Brackett and Carr (2001) |
| Clothes ads on Facebook via mobile are irritating. | Ducoffe (1996), Brackett and Carr (2001) | |
| Clothes ads on Facebook via mobile are deceptive. | Ducoffe (1996), Brackett and Carr (2001) | |
| Clothes ads on Facebook via mobile are confusing. | Ducoffe (1996), Brackett and Carr (2001) | |
| Clothes ads on Facebook via mobile insult people’s intelligence. | Ducoffe (1996), Brackett and Carr (2001) | |
| Perceived Credibility | Clothes ads on Facebook via mobile are convincing. | Brackett and Carr (2001) |
| Clothes ads on Facebook via mobile are credible. | Brackett and Carr (2001) | |
| Clothes ads on Facebook via mobile are trustworthy. | Brackett and Carr (2001) | |
| Clothes ads on Facebook via mobile are believable. | Brackett and Carr (2001) | |
| Clothes ads on Facebook via mobile are useful references for purchasing products. | Brackett and Carr (2001) | |
| Perceived Interactivity | Clothes ads on Facebook via mobile make it easy to convey my opinion. | Kim and Ko (2012) |
| Clothes ads on Facebook via mobile allow us to exchange opinions or conversations with other users. | Kim and Ko (2012) | |
| Clothes ads on Facebook via mobile allow two-way interactions with a brand. | Kim and Ko (2012) | |
| Clothes ads on Facebook are interactive. | Ching et al. (2013) | |
| Perceived Personalization | Clothes ads on Facebook communicate targeted solutions and offers to me. | Peppers and Rogers (1999) |
| Clothes ads on Facebook are personalized. | Peppers and Rogers (1999) | |
| Perceived Advertising Value | Clothes ads on Facebook via mobile are useful. | Ducoffe (1996), Brackett and Carr (2001) |
| Clothes ads on Facebook via mobile are valuable. | Ducoffe (1996), Brackett and Carr (2001) | |
| Clothes ads on Facebook via mobile are important. | Ducoffe (1996), Brackett and Carr (2001) |
| Attitude Towards Facebook Ads | Clothes ads on Facebook via mobile are a good thing. | Tsang et al. (2004) |
| I like clothes ads on Facebook via mobile. | Tsang et al. (2004) | |
| My general opinion about clothes ads on Facebook via mobile is favorable. | Tsang et al. (2004) | |
| I like to watch clothes ads on Facebook via mobile. | Tsang et al. (2004) | |
| Perceived Price | When buying clothes via smartphone, price comparisons between online and offline are important to me. | Wei et al. (2018) |
| When buying clothes via smartphone, price promotions are important to me. | Wei et al. (2018) | |
| When buying clothes via smartphone, the price versus performance ratio is important to me. | Wei et al. (2018) | |
| Delivery Terms and Conditions | The clarity of delivery terms and conditions when buying clothes via smartphone is important to me. | Chen et al. (2010) |
| The length of delivery time when buying clothes via smartphone is important to me. | Chen et al. (2010) | |
| Perceived Risk | When buying clothes via smartphone, I worry about the product quality. | Wei et al. (2018) |
| When buying clothes via smartphone, I worry about payment privacy. | Added by thesis author | |
| When buying clothes via smartphone, I worry about the risk of information privacy. | Wei et al. (2018) | |
| Perceived Shopping Platform’s Ease of Use | The ease of choosing the product on a shopping platform when buying clothes via smartphone is important to me. | Zeithaml et al. (2002) |
| The ease of operating and understanding the shopping platform when buying clothes via smartphone is important to me. | Zeithaml et al. (2002) | |
| The shopping platform’s downloading and loading time when buying clothes via smartphone is important to me. | Tsimonis and Dimitriadis (2019) | |
| Subjective Norm | People important to me think I should buy clothes via smartphone. | Mainardes et al. (2020) |
| It is expected that people like me should buy clothes via smartphone. | Mainardes et al. (2020) | |
| People I look up to expect that I should buy clothes via smartphone. | Mainardes et al. (2020) |
| Intention to Purchase | I prefer to buy clothes via mobile rather than other online or offline options. | Wei et al. (2018) |
| As I see clothes ads on Facebook, I have the intention to buy clothes via my smartphone. | Taylor and Bearden (2002) | |
| After seeing clothes ads on Facebook, I would recommend them to other people buying via smartphone. | Taylor and Bearden (2002) |
| PInf | Perceived Informativeness |
|---|---|
| PEnt | Perceived Entertainment |
| PIrr | Perceived Irritation |
| PCre | Perceived Credibility |
| PInt | Perceived Interactivity |
| PAdV | Perceived Advertising Value |
| ATFAd | Attitude Towards Facebook Ads |
| DTCo | Delivery Terms and Conditions |
| PRis | Perceived Risk |
| PSPEUs | Perceived Shopping Platform’s Ease of Use |
| SNor | Subjective Norm |
| IPur | Intention to Purchase |
References
- Akhlaq, Ather, and Ejaz Ahmed. 2014. Online shopping: A global perspective. Journal of Basic and Applied Scientific Research 4–5: 153–60. [Google Scholar]
- Alalwan, Ali Abdallah. 2018. Investigating the impact of social media advertising features on customer purchase intention. International Journal of Information Management 42: 65–77. [Google Scholar] [CrossRef]
- Al Kurdi, Barween, and Muhammad Alshurideh. 2021. Facebook advertising as a marketing tool: Examining the influence on female cosmetic purchasing behaviour. International Journal of Online Marketing (IJOM) 11: 52–74. [Google Scholar] [CrossRef]
- Alin, Aylin. 2010. Multicollinearity. Wiley Interdisciplinary Reviews: Computational Statistics 2: 370–74. [Google Scholar] [CrossRef]
- Alwreikat, Ahmad, and Husam Rjoub. 2021. Impact of Mobile Ad Wearout on Consumer Irritation, Perceived Intrusiveness, Engagement, and Loyalty: A PLS-SEM Analysis. Journal of Organizational and End User Computing (JOEUC) 33: 69–84. [Google Scholar] [CrossRef]
- Ariffin, Shaizatulagma, Aun Kamalul, Lok Tan, and Yashar Salamzadeh. 2018. How personal beliefs influence consumer attitude towards online advertising in malaysia: To trust or not to trust? Global Business and Management Research 10: 30–47. [Google Scholar]
- Aziza, Dhiyaa Nadhifa, and Rifelly Dewi. 2019. Evaluating the effect of Youtube advertising towards young customers’ purchase intention. Advances in Economics, Business and Management Research 72: 93–98. [Google Scholar] [CrossRef]
- Baek, Tae Hyun, and Mariko Morimoto. 2012. Stay away from me: Examining the determinants of consumer avoidance of personalized advertising. Journal of Advertising 41: 59–76. [Google Scholar] [CrossRef]
- Boardman, Rosy, and Helen McCormick. 2018. Shopping Channel Preference and Usage Motivations: Exploring Differences Amongst a 50-Year Age Span. Journal of Fashion Marketing and Management: An International Journal 22: 270–84. [Google Scholar] [CrossRef]
- Brackett, Lana, and Benjemin Carr. 2001. Cyberspace advertising vs. other media: Consumer vs. mature student attitudes. Journal of Advertising Research 41: 23–32. [Google Scholar] [CrossRef]
- Cabiles, Victoriano. 2019. 2018 Facebook Advertisement Click-Through Characteristics and User Attitudes. Master’s thesis, School of Business London South Bank University, London, UK. [Google Scholar]
- Camoiras-Rodriguez, Zaira, and Conception Varela. 2020. The influence of consumer personality traits on mobile shopping intention. Spanish Journal of Marketing—ESIC 24: 331–53. [Google Scholar] [CrossRef]
- Chen, Ying-Hueih, I-Chieh Hsuand, and Chia-Chen Lin. 2010. Website attributes that increase consumer purchase intention: A conjoint analysis. Journal of Business Research 63: 1007–14. [Google Scholar] [CrossRef]
- Ching, Russell, Pingsheng Tong, and Hung-Yen Chen. 2013. Narrative online advertising: Identification and its effects on attitude toward a product. Internet Research 23: 414–38. [Google Scholar] [CrossRef]
- Chong, Alain Yee-Loong. 2013. Mobile commerce usage activities: The roles of demographic and motivation variables. Technological Forecasting and Social Change 80: 1350–59. [Google Scholar] [CrossRef]
- Clarke, Irvine. 2008. Emerging value propositions for m-commerce. Journal of Business Strategies 25: 41–57. [Google Scholar] [CrossRef]
- Dehghani, Milad, and Mustafa Tümer. 2015. A research on effectiveness of Facebook advertising on enhancing purchase intention of consumers. Computers in Human Behavior 49: 597–600. [Google Scholar] [CrossRef]
- Deraz, Hossam. 2019. Consumers’ Responses to Ads on Social Networking Sites: A Systematic Literature Review (SLR). Paper presented at the 17th International Conference on e-Society, Utrecht, The Netherlands, April 11–13. [Google Scholar]
- Ducoffe, Robert. 1996. Advertising value and advertising on the web. Journal of Advertising Research 36: 21–35. [Google Scholar]
- Field, Andy. 2009. Discovering Statistics Using SPSS, 3rd ed. London: SAGE Publications Ltd. [Google Scholar]
- Florenthal, Bela, and Aviv Shoham. 2010. Four-Mode Channel Interactivity Concept and Channel Preferences. Journal of Service Marketing 24: 29–41. [Google Scholar] [CrossRef]
- Ghazali, Ezlika, Dilip Mutum, Jiu Hui Chong, and Bang Nguyen. 2018. Do consumers want mobile commerce? A closer look at m-shopping and technology adoption in Malaysia. Asia Pacific Journal of Marketing and Logistics 30: 1064–86. [Google Scholar] [CrossRef]
- Grewal, Dhruv, Yakov Bart, Martin Spann, and Peter Pal Zubcsek. 2016. Mobile advertising: A framework and research agenda. Journal of Interactive Marketing 34: 3–14. [Google Scholar] [CrossRef]
- Gupta, Anil, and Neelika Arora. 2017. Understanding determinants and barriers of mobile shopping adoption using behavioral reasoning theory. Journal of Retailing and Consumer Services 36: 1–7. [Google Scholar] [CrossRef]
- Haghirian, Parissa, Maria Madlberger, and Andrea Tanuskova. 2005. Increasing Advertising Value of Mobile Marketing—An Empirical Study of Antecedents. Paper presented at the 38th Hawaii International Conference on System Sciences, Big Island, HI, USA, January 6. [Google Scholar]
- Haj Eid, Mohammed Al, Nawras M. Nusairat, Mahmud Alkailani, and Hamad Al-Ghadeerd. 2020. Internet users’ attitudes towards social media advertisements: The role of advertisement design and users’ motives. Management Science Letters 10: 2361–70. [Google Scholar] [CrossRef]
- Hamouda, Manel. 2018. Understanding social media advertising effect on consumers’ responses: An empirical investigation of tourism advertising on Facebook. Journal of Enterprise Information Management 31: 426–45. [Google Scholar] [CrossRef]
- Hasbullah, Nurul Aqila, Abdullah Osman, Safizal Abdullah, Shahrul Nizam Salahuddin, Nor Faizzah Ramlee, and Hazalina Mat Soha. 2016. The relationship of attitude, subjective norm and website usability on consumer intention to purchase online: An evidence of Malaysian youth. Procedia Economics and Finance 35: 493–502. [Google Scholar] [CrossRef]
- Huang, Lingling, Juan Feng, and Fengxian Yan. 2014. Study on the perceived risk about the online shopping for fresh agricultural commodities and customer acquisition. Asian Agricultural Research 6: 1–7. [Google Scholar] [CrossRef]
- Jaeger, Anna Katharina, and Anja Weber. 2020. Can you believe it? The effects of benefit type versus construal level on advertisement credibility and purchase intention for organic food. Journal of Cleaner Production 257: 120543. [Google Scholar] [CrossRef]
- Jalilvand, Mohammad Reza, and Neda Samiei. 2012. The impact of electronic word of mouth on a tourism destination choice: Testing the theory of planned behavior (TPB). Internet Research 22: 591–612. [Google Scholar] [CrossRef]
- Janssens, Wim, and Patrick De Pelsmacker. 2005. Emotional or Informative? Creative or Boring? International Journal of Advertising 24: 373–94. [Google Scholar] [CrossRef]
- Kim, Yoo Jung, and Jin Young Han. 2014. Why smartphone advertising attracts customers: A model of web advertising, flow, and personalization. Computer sin Human Behavior 338: 256–69. [Google Scholar] [CrossRef]
- Kim, Nam Young, and Shyam S. Sundar. 2010. Relevance to the Rescue: Can ‘Smart Ads’ Reduce Negative Response to Online Ad Clutter? Journalism & Mass Communication Quarterly 87: 346–62. [Google Scholar] [CrossRef]
- Kim, Hee-Wong, Yunjie Xu, and Sumeet Gupta. 2011. Which is more important in internet shopping, perceived price or trust? Electronic Commerce Research and Applications 11: 241–252. [Google Scholar] [CrossRef]
- Kim, Angella. J., and Eunju Ko. 2012. Do social media marketing activities enhance customer equity? An empirical study of luxury fashion brand. Journal of Business Research 65: 1480–86. [Google Scholar] [CrossRef]
- Koetsier, John. 2019. Facebook Getting Too Expensive for Advertisers? Costs Jumped 90% Year-over-Year. Available online: https://www.forbes.com/sites/johnkoetsier/2019/12/13/facebook-getting-too-expensive-for-advertisers-costs-jumped-90-year-over-year/?sh=a6149203bca5. (accessed on 15 December 2021).
- Koo, Wanmo, Dee K. Knight, Kiseol Yang, and Zheng Xiang. 2012. Generation Y consumers’ value perceptions toward apparel mobile advertising: Functions of modality and culture. International Journal of Marketing Studies 4: 56. [Google Scholar] [CrossRef][Green Version]
- Koukia, Spiridoula, Rigou Maria, and Sirmakessis Spiros. 2006. The role of context in m-commerce and the personalization dimension. Paper presented at the 2006 IEEE/WIC/ACM International Conference on Web Intelligence and Intelligent agent Technology, Hong Kong, China, December 18–22; pp. 267–76. [Google Scholar]
- Koutsiouris, Vasilis, and Adam P. Vrechopoulos. 2009. Developing a user typology in the context of location based mobile services: A multidisciplinary Research Approach. Paper presented at the Mediterranean on Information Systems, Athens University of Economics and Business, AUEB, Athens, Greece, September 25–27. [Google Scholar]
- Lee, Dokyun, Kartik Hosanagar, and Harikesh S. Nair. 2018. Advertising content and consumer engagement on social media: Evidence from Facebook. Management Science 64: 4967–5460. [Google Scholar] [CrossRef]
- Lim, Xin Jean, Jun-Hwa Cheah, and Mun Wai Wong. 2017. The impact of social media influencers on purchase intention and the mediation effect of customer attitude. Asian Journal of Business Research 7: 19. [Google Scholar] [CrossRef]
- Lin, Fen Hui, and Yu Fan Hung. 2009. The value of and attitude toward sponsored links for internet information searchers. Journal of Electronic Commerce Research 10: 235–51. [Google Scholar]
- Lin, Hota Chia-Sheng, Neil Chueh-An Lee, and Yi-Chieh Lu. 2021. The Mitigators of Ad Irritation and Avoidance of YouTube Skippable In-Stream Ads: An Empirical Study in Taiwan. Information 12: 373. [Google Scholar] [CrossRef]
- Liu, Baoshan, Xu Guan, Haijun Wang, and Shihua Ma. 2019. Channel configuration and pay-on-delivery service with the endogenous delivery lead time. Omega 84: 175–88. [Google Scholar] [CrossRef]
- Love, Steve. 2005. Understanding Mobile Human-Computer Interaction, Published by Elsevier Information Systems Series (ISS). Newton: Butterworth Heinemann. [Google Scholar] [CrossRef]
- Lutfie, Harrie, and Dandy Marcelino. 2020. Investigating Facebook advertising feature through performance expectancy on customer purchase intention. Paper presented at the 2020 8th International Conference on Cyber and IT Service Management (CITSM), Pangkal, Indonesia, October 23–24. [Google Scholar]
- MacKenzie, Scott B., and Richard J. Lutz. 1989. An empirical examination of the structural antecedents of attitude toward the ad in an advertising pretesting context. Journal of Marketing 53: 48–65. [Google Scholar] [CrossRef]
- Maity, Moutusy. 2010. Critical factors of consumer decision-making on m-commerce: A qualitative study in the United States. International Journal of Mobile Marketing 5: 87–101. [Google Scholar]
- Mainardes, Emerson Wagner, Irailton Melo de Souza, and Rogério Dias Correia. 2020. Antecedents and consequents of consumers not adopting e-commerce. Journal of Retailing and Consumer Services 55. [Google Scholar] [CrossRef]
- Maity, Moutusy, and Mayukh Dass. 2014. Consumer decision-making across modern and traditional channels: E-commerce, m-commerce, in-store. Decision Support Systems 61: 34–46. [Google Scholar] [CrossRef]
- Maria, Siti, Tommy Pusriadi, Yundi Permadi Hakim, and Dio Caisar Darma. 2019. The effect of social media marketing, word of mouth, and effectiveness of advertising on brand awareness and intention to buy. Journal Manajemen Indonesia 19: 107–22. [Google Scholar] [CrossRef]
- Martins, José, Catarina Costa, Tiago Oliveira, Ramiro Gonçalves, and Frederico Branco. 2018. How smartphone advertising influences consumers’ purchase intention. Journal of Business Research 94. [Google Scholar] [CrossRef]
- Maseeh, Haroon Iqbal, Hafiz Ahmad Ashraf, and Mehak Rehman. 2020. Examining the impact of digital mobile advertising on purchase intention. Review of Integrative Business and Economics Research 9: 84–95. [Google Scholar]
- Mathers, Nigel, Nick Fox, and Amanda Hunn. 1998. Surveys and Questionnaires. Trent: NHS Executive. Available online: https://www.rds-yh.nihr.ac.uk/wp-content/uploads/2013/05/12_Surveys_and_Questionnaires_Revision_2009.pdf (accessed on 15 December 2021).
- McLean, Graeme, Kofi Osei-Frimpong, Khalid Al-Nabhani, and Hannah Marriott. 2020. Examining consumer attitudes towards retailers’ m-commerce mobile applications—An initial adoption vs. continuous use perspective. Journal of Business Research 106: 139–57. [Google Scholar] [CrossRef]
- McQuail, Denis. 2005. Mass Communication Theory, 5th ed. London: Sage Publications Ltd. [Google Scholar]
- Mekawiea, Nermeen, and Aly Hanyb. 2020. Understanding the factors driving consumers’ purchase intention of over the counter medications using social media advertising in Egypt: (A Facebook advertising application for cold and flu products). Procedia Computer Science 164: 698–705. [Google Scholar] [CrossRef]
- Mishra, Udgam. 2020. Determination of purchase intention applying technology acceptance model: A case of Facebook influence. Dristikon: A Multidisciplinary Journal 10: 253–264. [Google Scholar] [CrossRef]
- Munsch, Alison. 2021. Millennial and generation z digital marketing communication and advertising effectiveness: A qualitative exploration. Journal of Global Scholars of Marketing Science 31: 10–29. [Google Scholar] [CrossRef]
- Murillo, Enrique, Maria Merino, and Adriana Núñez. 2016. The advertising value of Twitter ads: A study among Mexican millennials. Review of Business Management 18: 436–56. [Google Scholar] [CrossRef]
- Namin, Aidin, Mitchell. L. Hamilton, and Andrew J. Rohm. 2020. Impact of message design on banner advertising involvement and effectiveness: An empirical investigation. Journal of Marketing Communications 26: 115–29. [Google Scholar] [CrossRef]
- Nettelhorst, Stephen, Laura Brannon, Angela Rose, and Whitney Whitaker. 2020. Online viewers’ choices over advertisement number and duration. Journal of Research in Interactive Marketing 14: 215–38. [Google Scholar] [CrossRef]
- Nguyen, Dung H., Sander De Leeuw, Wout Dullaert, and Bram P. J. Foubert. 2019. What is the right delivery option for you? Consumer preferences for delivery attributes in online retailing. Journal of Business Logistics 40: 299–321. [Google Scholar] [CrossRef]
- Nguyen, Thu Ha, and Ayda Gizaw. 2014. Factors That Influence Consumer Purchasing Decisions of Private Label Food Products. Available online: https://www.diva-portal.org/smash/get/diva2:705384/fulltext01.pdf (accessed on 25 December 2021).
- Oh, Jeeyun, Saraswathi Bellur, and Shyam Sundar. 2015. Clicking, assessing immersing, and sharing: An empirical model of user engagement with interactive media. Communication 45: 5. [Google Scholar] [CrossRef]
- Park, Jungkun, Sujin Yang, and Xinran Y. Lehto. 2007. Adoption and usage of mobile technologies for chinese consumers. Journal of Electronic Commerce Research 31: 196–206. [Google Scholar]
- Peppers, Don, and Martha Rogers. 1999. Enterprise One to One. New York: Doubleday. [Google Scholar]
- Raditya, Djoko, Willy Gunadi, Dennis Andariski Setiono, and Jonathan Andreas Rawung. 2020. The effect of ad content and ad length on consumer response towards online video advertisement. Binus Journal Publishing 21: 119–28. [Google Scholar] [CrossRef]
- Raman, Prashant. 2019. Understanding female consumers’ intention to shop online: The role of trust, convenience and customer service. Asia Pacific Journal of Marketing and Logistics 31: 1138–60. [Google Scholar] [CrossRef]
- Ramayah, T., and J. Ignatius. 2010. Intention to shop online: The mediating role of perceived ease of use. Middle -East Journal of Scientific Research 5: 152–56. [Google Scholar]
- Reddy, B. V. B. 2014. Phylogenetic analysis of factors that influence customer purchase intention on e-commerce and m-commerce platforms. International Journal of Business, Management and Allied Sciences (IJBMAS) 1: 273–82. [Google Scholar]
- Rozina, Imtiaz, Ahmad Salem Alsoud Malek, Muhammad Sufyan Ramish, Aziz Atif, and Anwar Adnan. 2021. Impact of Facebook on advertising: Analysis of effectiveness of Facebook on enhancing customer purchase intention. Ilkogretim Online - Elementary Education Online 20: 7130–49. [Google Scholar] [CrossRef]
- Schiffman, Leon, Leslie Kanuk, and Joseph Wisenblit. 2010. Consumer Behavior. London: Pearson Prentice Hall. [Google Scholar]
- Shahbaznezhad, Hamidreza, Rebecca Dolan, and Mona Rashidirad. 2021. The role of social media content format and platform in users’ engagement behavior. Journal of Interactive Marketing 53: 47–55. [Google Scholar] [CrossRef]
- Shankar, Amit, and Bikramjit Rishi. 2020. Convenience matter in mobile banking adoption intention? Australasian Marketing Journal (AMJ) 28: 273–85. [Google Scholar] [CrossRef]
- Shareef, Mahmud Akhter, Yogesh K. Dwivedi, Vinod Kumar, and Uma Kumar. 2017. Content design of advertisement for consumer exposure: Mobile marketing through short messaging service. International Journal of Information Management 37: 257–68. [Google Scholar] [CrossRef]
- Sharma, Varinder M., and Andreas Klein. 2020. Consumer perceived value, involvement, trust, susceptibility to interpersonal influence, and intention to participate in online group buying. Journal of Retailing and Consumer Services 52. [Google Scholar] [CrossRef]
- Statista. 2021. Annual Global Marketing and Sales Costs of Facebook from 2010 to 2020. Available online: https://www.statista.com/statistics/506867/facebook-marketing-spending/ (accessed on 15 December 2021).
- Sullivan, Yulia W., and Dan J. Kim. 2018. Assessing the effects of consumers’ product evaluations and trust on repurchase intention in e-commerce environments. International Journal of Information Management 39: 199–219. [Google Scholar] [CrossRef]
- Tavakol, Mohsen, and Reg Dennick. 2011. Making sense of cronbach’s alpha. International journal of medical education 2: 53. [Google Scholar] [CrossRef]
- Taylor, David G., Jeffrey E. Lewin, and David Strutton. 2011. Friends, fans, and followers: Do ads work on social networks? How gender and age shape receptivity. Journal of Advertising Research 51: 258–75. [Google Scholar] [CrossRef]
- Taylor, Valerie, and William Bearden. 2002. The effects of price on brand extension evaluations: The moderating role of extension similarity. Journal of the Academy of Marketing Science 30: 131–140. [Google Scholar] [CrossRef]
- Thakur, Rakhi, and Mala Srivastava. 2013. Customer usage intention of mobile commerce India: An empirical study. Journal of Indian Business Research 5: 52–72. [Google Scholar] [CrossRef]
- Tsang, Melody M., Shu-Chun Ho, and Ting-Peng Liang. 2004. Consumer attitudes toward mobile advertising: An empirical study. International Journal of Electronic Commerce 8: 65–78. [Google Scholar] [CrossRef]
- Tsimonis, Georgios, and Sergios Dimitriadis. 2019. The conceptualization and measurement of perceived value in social media: The case of Facebook brand pages. Paper presented at Academy of Marketing Science Annual Conference, Vancouver, BC, Canada, May 1; pp. 557–67. Available online: https://dora.dmu.ac.uk/bitstream/handle/2086/17589/AMA_2019.pdf?sequence=1&isAllowed=n (accessed on 15 December 2021).
- Tsimonis, Georgios, Sergios Dimitriadis, and Suha Omar. 2020. An integrative typology of relational benefits and costs in social media brand pages. International Journal of Market Research 62: 216–33. [Google Scholar] [CrossRef]
- Wang, Chia-Nan, Thanh-Tuan Dang, and Hsien-Pin Hsu. 2021. Evaluating sustainable last-mile delivery (LMD) in B2C E-commerce using two-stage fuzzy MCDM approach: A case study from Vietnam. IEEE Access 9: 146050–67. [Google Scholar] [CrossRef]
- Wang, Chia-Nan, Thanh-Tuan Dang, Ngoc-Ai-Thy Nguyen, and Thi-Thu-Hong Le. 2020. Supporting better decision-making: A combined grey model and data envelopment analysis for efficiency evaluation in e-commerce marketplaces. Sustainability 12: 10385. [Google Scholar] [CrossRef]
- Warsame, Said Ali, Algeji Abdullah Faeq Mohammed, Mohammed Abdulsalam Elamir, Abdul Aziz, and Nur Azrina Izni Binti. 2021. The Influence of social media advertising values on consumers purchasing intention in Somalia. International Fellowship Journal of Interdisciplinary Research 1: 91–112. [Google Scholar] [CrossRef]
- Wei Yongchang, Can Wang, Song Zhu, Hailong Xue, and Fangyu Chen. 2018. Online purchase intention of fruits: Antecedents in an integrated model based on technology acceptance model and perceived risk theory. Frontiers in Psychology 9: 1521. [Google Scholar] [CrossRef]
- Wu, Chienhsing, Didi Sundiman, Shu-Chen Kao, and Cheng-Hua Chen. 2018. Emotion induction in click intention of picture advertisement: A field examination. Journal of Internet Commerce 17: 356–82. [Google Scholar] [CrossRef]
- Wu, Jen-Her, and Tzyh-Lih Hisa. 2008. Developing e-business dynamic capabilities: An analysis of e-commerce innovation from i-, m-, to u-Commerce. Journal of Organizational Computing and Electronic Commerce 18: 95–111. [Google Scholar] [CrossRef]
- Xin Teo, Li, Ho Keat Leng, and Yi Xian Philip Phua. 2019. Marketing on Instagram: Social influence and image quality on perception of quality and purchase intention. International Journal of Sports Marketing and Sponsorship 20: 321–32. [Google Scholar] [CrossRef]
- Yang, Keng Chieh, Chai Hui Huang, Conna Yang, and Su Yu Yang. 2017. Consumer attitudes toward online video advertisement: YouTube as a platform. Kybernetes 46: 840–853. [Google Scholar] [CrossRef]
- Zeithaml, Valarie A., Parsu A. Parasuraman, and Arvind Malhotra. 2002. Service quality delivery through web sites: A critical review of extant knowledge. Journal of the Academy of Marketing Science 30: 362–75. [Google Scholar] [CrossRef]
- Zhou, Tao, and Yaobin Lu. 2011. The effects of personality traits on user acceptance of mobile commerce. International Journal of Human-Computer Interaction 27: 545–61. [Google Scholar] [CrossRef]


| Variable Group | Scale Items | Cronbach’s Alpha | Reliability |
|---|---|---|---|
| Perceived Informativeness | 5 | 0.896 | Good |
| Perceived Entertainment | 4 | 0.893 | Good |
| Perceived Irritation | 5 | 0.843 | Good |
| Perceived Credibility | 5 | 0.828 | Good |
| Perceived Interactivity | 4 | 0.819 | Good |
| Perceived Personalization | 2 | 0.588 | Poor |
| Perceived Advertising Value | 3 | 0.893 | Good |
| Attitude Towards Facebook Ads | 4 | 0.944 | Excellent |
| Perceived Price | 3 | 0.573 | Poor |
| Delivery Terms and Conditions | 2 | 0.713 | Acceptable |
| Perceived Risk | 3 | 0.836 | Good |
| Perceived Shopping Platform’s Ease of Use | 3 | 0.762 | Acceptable |
| Subjective Norm | 3 | 0.856 | Good |
| Intention to Purchase | 3 | 0.823 | Good |
| Tests of Normality | ||||||
|---|---|---|---|---|---|---|
| Kolmogorov–Smirnov | Shapiro–Wilk | |||||
| Statistic | Degrees of Freedom | Significance Level | Statistic | Degrees of Freedom | Significance Level | |
| Perceived Informativeness | 0.077 | 408 | <0.001 | 0.960 | 408 | <0.001 |
| Perceived Entertainment | 0.062 | 408 | <0.001 | 0.966 | 408 | <0.001 |
| Perceived Irritation | 0.105 | 408 | <0.001 | 0.977 | 408 | <0.001 |
| Perceived Credibility | 0.084 | 408 | <0.001 | 0.982 | 408 | <0.001 |
| Perceived Interactivity | 0.108 | 408 | <0.001 | 0.978 | 408 | <0.001 |
| Perceived Advertising Value | 0.087 | 408 | <0.001 | 0.965 | 408 | <0.001 |
| Attitude Towards Facebook Ads | 0.081 | 408 | <0.001 | 0.953 | 408 | <0.001 |
| Delivery Terms and Conditions | 0.311 | 408 | <0.001 | 0.717 | 408 | <0.001 |
| Perceived Risk | 0.119 | 408 | <0.001 | 0.919 | 408 | <0.001 |
| Perceived Shopping Platform’s Ease of Use | 0.171 | 408 | <0.001 | 0.849 | 408 | <0.001 |
| Subjective Norm | 0.135 | 408 | <0.001 | 0.920 | 408 | <0.001 |
| Intention to Purchase | 0.116 | 408 | <0.001 | 0.941 | 408 | <0.001 |
| Gender | ||
|---|---|---|
| Gender | Frequency | Percent |
| Female | 359 | 88% |
| Male | 49 | 12% |
| Total | 408 | 100% |
| Age | ||
| Age | Frequency | Percent |
| 25 to 34 | 159 | 39% |
| 35 to 44 | 112 | 27% |
| 45 to 54 | 63 | 15% |
| Up to 24 | 50 | 12% |
| 55 to 64 | 21 | 5% |
| More than 65 | 3 | 1% |
| Total | 408 | 100% |
| Income | ||
| Monthly income | Frequency | Percent |
| Up to 499 EUR | 43 | 11% |
| 500–999 EUR | 133 | 33% |
| 1000–1499 EUR | 115 | 28% |
| 1500–1999 EUR | 56 | 14% |
| 2000–2499 EUR | 34 | 8% |
| More than 3000 EUR | 27 | 7% |
| Total | 408 | 100% |
| How Often Do You Use Facebook? | Frequency | Percent |
|---|---|---|
| 1–2 h per day | 133 | 33% |
| 2–3 h per day | 101 | 25% |
| More than 3 h per day | 100 | 25% |
| Up to 1 h per day | 74 | 18% |
| Total | 408 | 100% |
| How Often Do You Buy Clothes via Mobile? | Frequency | Percent |
|---|---|---|
| From once per month to once per half year | 163 | 40% |
| Less often than once per year | 81 | 20% |
| From once per week to once per month | 80 | 20% |
| From once per half year to once a year | 74 | 18% |
| More than once per week | 10 | 2% |
| Total | 408 | 100% |
| Your Experience Using Smartphones | Frequency | Percent |
|---|---|---|
| More than 10 years | 256 | 63% |
| 7–9 years | 106 | 26% |
| 4–6 years | 34 | 8% |
| Up to 3 years | 12 | 3% |
| Total | 408 | 100% |
| Constructs | Mean | Std. Deviation | Variance | Skewness | Kurtosis | ||
|---|---|---|---|---|---|---|---|
| Statistic | Statistic | Statistic | Statistic | Std. Error | Statistic | Std. Error | |
| Perceived Informativeness | 3.4897 | 1.00225 | 1.005 | −0.537 | 0.121 | −0.186 | 0.241 |
| Perceived Entertainment | 2.9369 | 1.11094 | 1.234 | −0.091 | 0.121 | −0.764 | 0.241 |
| Perceived Irritation | 2.8059 | 0.97797 | 0.956 | 0.097 | 0.121 | −0.730 | 0.241 |
| Perceived Credibility | 2.9265 | 0.85997 | 0.740 | −0.223 | 0.121 | −0.242 | 0.241 |
| Perceived Interactivity | 3.1011 | 0.96421 | 0.930 | −0.169 | 0.121 | −0.411 | 0.241 |
| Perceived Advertising Value | 2.7533 | 1.05700 | 1.117 | 0.099 | 0.121 | −0.606 | 0.241 |
| Attitude Towards Facebook Ads | 2.9032 | 1.19548 | 1.429 | −0.027 | 0.121 | −0.933 | 0.241 |
| Delivery Terms and Conditions | 4.4412 | 0.82808 | 0.686 | −1.768 | 0.121 | 3.215 | 0.241 |
| Perceived Risk | 3.7108 | 1.09061 | 1.189 | −0.602 | 0.121 | −0.381 | 0.241 |
| Perceived Shopping Platform’s Ease of Use | 4.2459 | 0.79325 | 0.629 | −1.346 | 0.121 | 2.153 | 0.241 |
| Subjective Norm | 2.3848 | 1.12758 | 1.271 | 0.340 | 0.121 | −0.801 | 0.241 |
| Intention to Purchase | 2.4877 | 1.12056 | 1.256 | 0.442 | 0.121 | −0.724 | 0.241 |
| Variables | PInf | PEnt | PIrr | PCre | PInt | PAdV | ATFAd | DTCo | PRis | PSPEUs | SNor | IPur |
|---|---|---|---|---|---|---|---|---|---|---|---|---|
| PInf | 1 | 0.696 | −0.501 | 0.671 | 0.428 | 0.619 | 0.672 | 0.153 | −0.032 | 0.234 | 0.288 | 0.457 |
| PEnt | 0.696 | 1 | −0.557 | 0.669 | 0.444 | 0.696 | 0.807 | 0.118 | −0.114 | 0.166 | 0.373 | 0.545 |
| PIrr | −0.501 | −0.557 | 1 | −0.48 | −0.243 | −0.488 | −0.594 | −0.072 | 0.306 | −0.177 | −0.117 | −0.298 |
| PCre | 0.671 | 0.669 | −0.48 | 1 | 0.486 | 0.72 | 0.707 | 0.097 | −0.159 | 0.144 | 0.41 | 0.559 |
| PInt | 0.428 | 0.444 | −0.243 | 0.486 | 1 | 0.518 | 0.512 | 0.188 | 0.011 | 0.159 | 0.272 | 0.343 |
| PAdV | 0.619 | 0.696 | −0.488 | 0.72 | 0.518 | 1 | 0.829 | 0.073 | −0.139 | 0.155 | 0.44 | 0.592 |
| ATFAd | 0.672 | 0.807 | −0.594 | 0.707 | 0.512 | 0.829 | 1 | 0.09 | −0.132 | 0.167 | 0.425 | 0.599 |
| DTCo | 0.153 | 0.118 | −0.072 | 0.097 | 0.188 | 0.073 | 0.09 | 1 | 0.165 | 0.42 | 0.073 | 0.073 |
| PRis | −0.032 | −0.114 | 0.306 | −0.159 | 0.011 | −0.139 | −0.132 | 0.165 | 1 | 0.123 | −0.02 | −0.14 |
| PSPEUs | 0.234 | 0.166 | −0.177 | 0.144 | 0.159 | 0.155 | 0.167 | 0.42 | 0.123 | 1 | 0.097 | 0.177 |
| SNor | 0.288 | 0.373 | −0.117 | 0.41 | 0.272 | 0.44 | 0.425 | 0.073 | −0.02 | 0.097 | 1 | 0.622 |
| IPur | 0.457 | 0.545 | −0.298 | 0.559 | 0.343 | 0.592 | 0.599 | 0.073 | −0.14 | 0.177 | 0.622 | 1 |
| Construct | Unstandardized Coefficients | Standardized Coefficients | t | Sig. | Collinearity Statistics | ||
|---|---|---|---|---|---|---|---|
| B | Std. Error | Beta | Tolerance | VIF | |||
| (Constant) | 0.258 | 0.236 | 1.092 | 0.275 | |||
| PInf | 0.128 | 0.051 | 0.121 | 2.497 | 0.013 | 0.411 | 2.436 |
| PEnt | 0.261 | 0.047 | 0.275 | 5.556 | <0.001 | 0.397 | 2.52 |
| PIrr | −0.082 | 0.042 | −0.076 | −1.953 | 0.052 | 0.648 | 1.544 |
| PCre | 0.516 | 0.057 | 0.42 | 9.06 | <0.001 | 0.452 | 2.215 |
| Construct | Unstandardized Coefficients | Standardized Coefficients | t | Sig. | Collinearity Statistics | ||
|---|---|---|---|---|---|---|---|
| B | Std. Error | Beta | Tolerance | VIF | |||
| (Constant) | −0.402 | 0.113 | −3.561 | <0.001 | |||
| PInf | 0.069 | 0.042 | 0.058 | 1.67 | 0.096 | 0.411 | 2.435 |
| PEnt | 0.417 | 0.038 | 0.388 | 10.876 | <0.001 | 0.391 | 2.557 |
| PCre | 0.067 | 0.051 | 0.048 | 1.311 | 0.191 | 0.37 | 2.701 |
| PInt | 0.062 | 0.034 | 0.05 | 1.835 | 0.067 | 0.673 | 1.485 |
| PAdV | 0.527 | 0.041 | 0.466 | 12.718 | <0.001 | 0.371 | 2.697 |
| Construct | Unstandardized Coefficients | Standardized Coefficients | t | Sig. | Collinearity Statistics | ||
|---|---|---|---|---|---|---|---|
| B | Std. Error | Beta | Tolerance | VIF | |||
| (Constant) | −0.117 | 0.244 | −0.481 | 0.631 | |||
| ATFAdCalc | 0.425 | 0.04 | 0.404 | 10.624 | <0.001 | 0.771 | 1.296 |
| DTCo | −0.04 | 0.052 | −0.03 | −0.782 | 0.435 | 0.767 | 1.304 |
| PSPEUs | 0.115 | 0.055 | 0.082 | 2.105 | 0.036 | 0.741 | 1.349 |
| SNor | 0.445 | 0.037 | 0.448 | 11.974 | <0.001 | 0.798 | 1.252 |
| H1 | The perceived informativeness of the mobile ad for m-commerce is positively associated with its perceived advertising value on Facebook. | Supported |
| H2 | The perceived informativeness of the mobile ad for m-commerce is positively associated with the attitude towards Facebook ads. | Not supported |
| H3 | The perceived entertainment of the mobile ad for m-commerce is positively associated with its perceived advertising value on Facebook. | Supported |
| H4 | The perceived entertainment of the mobile ad for m-commerce is positively associated with the attitude towards Facebook ads. | Supported |
| H5 | The perceived irritation of the mobile ad for m-commerce is negatively associated with its perceived advertising value on Facebook. | Not supported |
| H6 | The perceived credibility of the mobile ad for m-commerce is positively associated with its perceived advertising value on Facebook. | Supported |
| H7 | The perceived credibility of the mobile ad for m-commerce is positively associated with the attitude towards Facebook ads. | Not supported |
| H8 | The perceived interactivity of the mobile ad for m-commerce is positively associated with the attitude towards Facebook ads. | Not supported |
| H9 | The perceived personalization of the mobile ad for m-commerce is positively associated with the attitude towards Facebook ads. | Cannot be tested |
| H10 | The perceived advertising value of the mobile ad for m-commerce is positively associated with the attitude towards Facebook ads. | Supported |
| H11 | The perceived price of m-commerce products is negatively associated with the intention to buy. | Cannot be tested |
| H12 | Clear delivery terms and conditions are positively associated with the intention to buy via m-commerce. | Not supported |
| H13 | Perceived risk is negatively associated with the intention to buy via m-commerce. | Cannot be tested |
| H14 | Attitude towards Facebook ads is positively associated with the intention to buy via m-commerce. | Supported |
| H15 | Perceived shopping platform’s ease of use is positively associated with the intention to buy via m-commerce. | Supported |
| H16 | Subjective norm is positively associated with the intention to buy via m-commerce. | Supported |
Publisher’s Note: MDPI stays neutral with regard to jurisdictional claims in published maps and institutional affiliations. |
© 2022 by the authors. Licensee MDPI, Basel, Switzerland. This article is an open access article distributed under the terms and conditions of the Creative Commons Attribution (CC BY) license (https://creativecommons.org/licenses/by/4.0/).
Share and Cite
Cvirka, D.; Rudienė, E.; Morkūnas, M. Investigation of Attributes Influencing the Attractiveness of Mobile Commerce Advertisements on the Facebook Platform. Economies 2022, 10, 52. https://doi.org/10.3390/economies10020052
Cvirka D, Rudienė E, Morkūnas M. Investigation of Attributes Influencing the Attractiveness of Mobile Commerce Advertisements on the Facebook Platform. Economies. 2022; 10(2):52. https://doi.org/10.3390/economies10020052
Chicago/Turabian StyleCvirka, Donatas, Elzė Rudienė, and Mangirdas Morkūnas. 2022. "Investigation of Attributes Influencing the Attractiveness of Mobile Commerce Advertisements on the Facebook Platform" Economies 10, no. 2: 52. https://doi.org/10.3390/economies10020052
APA StyleCvirka, D., Rudienė, E., & Morkūnas, M. (2022). Investigation of Attributes Influencing the Attractiveness of Mobile Commerce Advertisements on the Facebook Platform. Economies, 10(2), 52. https://doi.org/10.3390/economies10020052