1. Introduction
The international wine market has displayed notable changes since the 20th century (
Anderson and Nelgen 2011;
Mariani et al. 2012). Although the most recent research introduces concepts such as “third world wines” (
Banks and Overton 2010) or “emerging regions” (
Lecat et al. 2019), both professionals and researchers from the sector continue to divide the world into two macro-areas: the “old world” and the “new world” (
Thorpe 2009;
Remaud and Couderc 2006;
Bernetti et al. 2006). The “old world” name would refer to the European countries with a long winemaking tradition. This area shares a common heritage, which is reflected in the varieties held in their territories, as well as the indigenous consumption habits. On the other hand, that known as the “new world” or the new winemaking countries gathers and groups those that have recently been appearing on the international scene throughout the 20th century. Their modern harvesting techniques, adapted to extreme climate conditions, as is the case in Chile or New Zealand, for example, differentiate these wines from those better known “old world” wines (
Sarturi et al. 2016;
Barker et al. 2001). A more aggressive and competitive pricing strategy, combined with the work performed by their promotion agencies (
Campbell and Guibert 2006;
Giovannucci 2004), grant a leading role to these countries and their business fabric, forcing the “old world” producers to pursue more agile and flexible entrepreneurial policies.
Foreign trade and exports to new markets have become priorities for wineries and for all the European productive fabric, due to the reduction of wine consumption in the internal market (
Gual and Colom 1997;
Castriota 2020) and the constant growth in sales in new world countries (
Medina-Albaladejo et al. 2014).
However, the European productive fabric is formed by small-scale businesses and/or family businesses who must face a dynamic and competitive environment (
Ayyagari et al. 2007;
Kusa et al. 2021;
Fuentes-García et al. 2019). As such, as stated by
Sellers and Alampi-Sottini (
2016), not only may the export and internationalization process towards new markets not be considered a simple task for the entrepreneurs and their small or medium organizations but for wineries as well.
In order to support their businesses, the European Union (EU) has put in place economic policies that look to increase the international competitiveness of its wineries (
Planas 2017;
Meloni and Swinnen 2013). The specific policy for the winemaking sector takes the name of the Common Markets Organization (CMO) and is framed in the first pillar of the famous Common Agricultural Policy (CAP).
The main goal of this study is to analyze the performance of the CMO grant for the wine sector in France, a country chosen due to being the most represented in terms of exports and aid from the CAP. At the same time and more specifically, we analyze the eight measures available to the sector in order to improve competitiveness by means of CMO funds, with particular reference to the measures of promotion.
The studies conducted regarding this topic acquire characteristics that are more focused on conclusions of a legal or professional nature and do not focus on the specific measure of promotion, analyzing the CMO as a whole (
ECA 2014;
Agrosynergie GEIE 2018). As such, a gap has been detected in the literature regarding this topic; in other words, it is considered timely to clarify the debate regarding the function and use of these tools, which consume large investments year after year.
The latest reform of the CAP from 2020 and its economic measures, including the promotion in third countries, are designed to provide the Member States (MS) with more flexibility and weight when it comes to defining their strategic plans (
Pomarici and Sardone 2020). Despite the impact on the European productive sector, there is no specific scientific research regarding the measure; this study intends to clarify the debate regarding it, analyzing the first decade of implementation (2009–2018).
As a result of all that mentioned above, the following questions have arisen:
- Q1.
Is there a relationship between exports and the policy for developing the wine sector?
- Q2.
Which factors may influence the more efficient use of resources?
The structure of this research is based on the evolution of French exports and CMO grants implementation. After a review of the literature and context introduction, the methodology of the study is presented, consisting of the development of a fs/QCA model. The results obtained it made possible to reveal specific findings about the importance of measure’s budget allocation and the relationship between wine exports and the implementation of the measure of promotion.
2. Theoretical Background
The agricultural sector has been and continues to be considered a primary sector for the interests of European member states (
Guth et al. 2020;
Van Zanten et al. 2014).
Zobbe (
2001) explained how the Second World War caused severe production problems in the old continent, which forced the group of countries to seek solutions for what was then held up as the main sector of the European economy.
The original idea of the CAP intended to support and guarantee a reasonable quality of life for the farmers and livestock farmers supporting themselves in the efforts of the MS “as intermediaries” and through a policy of prices decided by the European institutions at a central level. However, globalization and multi-lateral treaties for the liberalization of assets and services between states lead to a debate on the protectionist system that reined in Europe in those decades (
Kahler 1985), which is why the CAP has also been modifying its approach and strategy.
By means of the various reforms undertaken, a direct and specific action regarding the prices of products evolved towards a direct support to the productive fabric, that is to say, towards the farmers and their entrepreneurial activity, with the aim of improving their competitiveness in international markets (
García-García 2020).
Table 1 shows how the instruments used have evolved and adapted to the age (
Compés and García 2009;
Cejudo and Maroto 2010). Direct payments, more focused on maintaining producers’ income, have been reduced in favors of more active policies, which predict the commitment of the beneficiary. The formal introduction of the latest reform to follow is pending; the unexpected COVID-19 pandemic has forced the European Commission (EC) to postpone the entry of the new reform, originally expected for 2020.
These changes have been influenced by international pressures and repeated criticism of the CAP. From an external point of view, the members of the World Trade Organization (WTO) criticize the CAP because it is too protectionist and clashes with the principles of liberalization that they share (
Tamames 2012;
Heredero 2001). From an internal point of view, other sectors of the European economy criticize its heightened budget assignment and its real impact on the sustainability of the continent’s economy (
Volkov et al. 2019). Authors such as
Hart and Bas-Defossez (
2018) and
Recanati et al. (
2019) considered it to be a policy too focused on the socio-economic situation of the first post-war decades, obsolete and isolated from reality.
In order to carry out the goals of the CAP in each primary European sub-sector, the CMO was created.
Gaeta and Corsinovi (
2014) defined it as a group of EU regulations, grants and agreements that intend to homogenize the agricultural production of the old continent, integrating a series of mechanisms and guarantees that regulate the production and competitiveness of European agricultural products.
The current system of budget distribution appears in 2009 and is divided into cycles of five financial years, defined as the National Support Program (NSP); the winemaking sector is one of the most relevant sectors in terms of the CMO and the CAP in general. As explained by
Pomarici and Sardone (
2020), there are three ideas around which its support for the sector is articulated:
- (a)
Since 2013, all the producers with vineyards may benefit from direct payments (optional in terms of the decision adopted by each MS).
- (b)
Similar to other sub-sectors, the actors of the winemaking sector may also benefit from the resources assigned to rural development policies, implementing co-financed projects that look to increase the competitiveness of specific geographic areas.
- (c)
The winemaking sector is linked to the line of financing known as “market measures”, by which there are tools to strengthen the marketing campaigns and support the sector in case of disturbances on the markets.
The measures for the resolution of the European productive fabric are framed within this last idea. In the first NSP (2009–2013), the petitioners could choose from 11 different measures; however, after the second NSP (2014–2018), the new regulation n° 1308/2013 reduces the measures to 8, progressively removing the sole payment measure as well. In addition to this, each MS has the obligation to select the measures that shall be adopted in its own national plan, forcing it, as such, to define the budget for each one.
The measure for the promotion in third country markets is aimed at the wineries and sector stakeholders (
Pomarici and Sardone 2020); the General Directorate of Agriculture (DG AGRI) intends to support the productive tissue in order to increase its promotion activity by means of a return of up to 50% of the costs sustained. This measure was introduced in 2009 representing 12% of the budget in the NPS for 2009–2013 and experiencing a growth up to 18% in the second NPS (2014–2018), with the third NPS (2019–2023) not having finished yet at the date of writing this paper (
Table A1 and
Table A2). Despite its importance at European level, no scientific work has been detected that only focuses on the measure for promotion and its impact.
The Measure of Promotion to Third Countries in France
The leadership of France as a wine exporter on a global level has been widely described in the literature (
Ayuda et al. 2020;
Ugaglia et al. 2019;
Candau et al. 2017). However, despite being the main European exporter and the main beneficiary of the CAP, France is not the main beneficiary of the measure for the promotion to third countries.
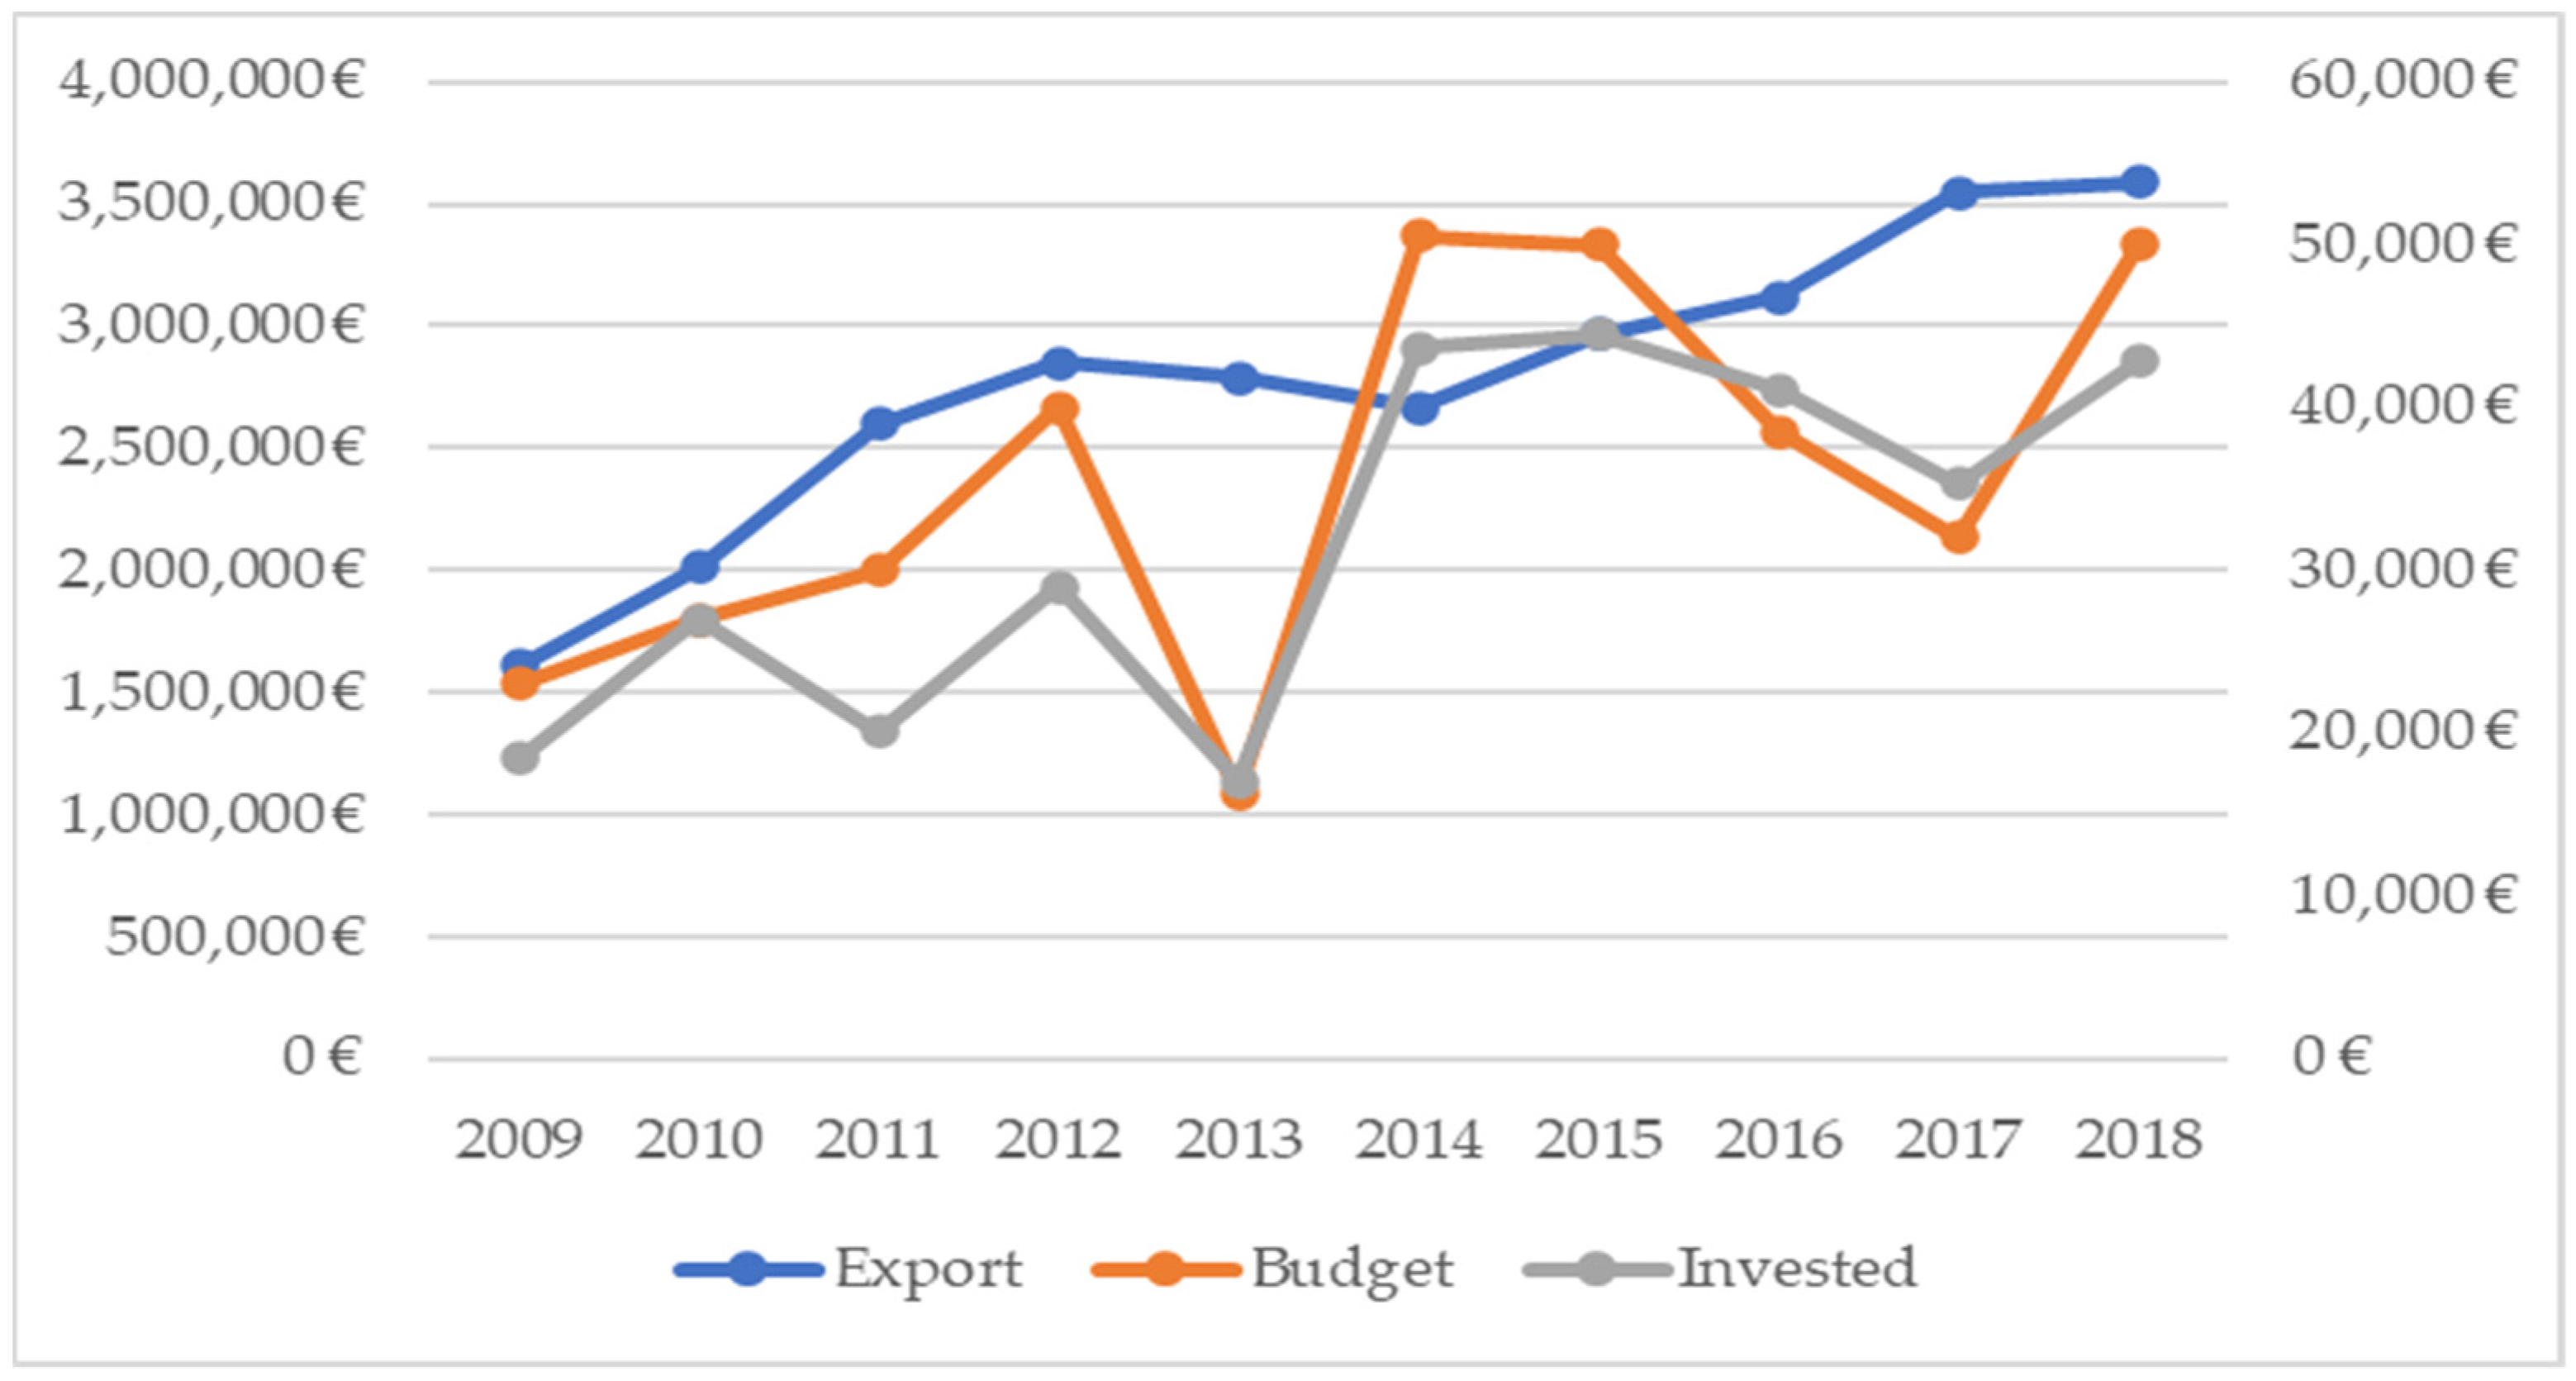
Figure 1 shows how the value of French bottled wine exports to third countries (blue line) displays a growing trend in the 2009–2018 period, with a 123% increase. However, although notable increases have also been registered for the budget and spending level during the period described (117% and 132%, respectively), strong ups and downs in the evolution are also observed.
With a total of €357,345,000 during the first ten years, France is in third place with 20.80% of the budget, behind Spain (24.15%) and Italy, which is the main beneficiary of this specific measure with 41.36% of the budget (
Table 2).
With an increase of 62% in the budget aimed for this measure, between the first and second NSP, the French productive fabric has not managed to execute 100% of the funds. At the end of the first two NPS, €318,951,000 has been granted, with 90% of the budgets assigned, leaving more than €38 million without being used and forcing the public administration to relocate these funds into other CMO measures.
The budget management of the public funds is related to three important functions: redistribution, allocation and stabilization (
Musgrave 1969;
Oates 1972).
Lindner and Tordoir (
2021) defined the allocation as the possibility of using legal instruments for the most efficient management of the resources. Within each period with a duration of 7 years, defined as the Multiannual Financial Framework (MFF), each MS has precisely the possibility of adapting their own budget in terms of the needs and priorities agreed. The same criteria are followed for the distribution of the budget in the frameworks of the NSP in each MS.
Table 3 shows the effects of the budget adaptation in France for measures of promotion. With the exception of the first year that the grant was put in place (2009), France has managed to implement almost the entirety of the CMO funds for the sector every year, showing its interest through the group of measures and its great ability for management within the CMO, reaching an average execution of 99.06%.
Table 3 shows how, on average, France has assigned 13.73% of its CMO wine budget to the measure for promotion; however, calculating the same ratio with amounts that were really executed, this ratio is lowered to 12.29%. The authors define, as such, the Execution Budget Gap (EBG) as the difference between the two quotas, highlighting that France has assigned, on average, 1.44% more of the budget than the productive fabric has shown to really need throughout the first two NSPs.
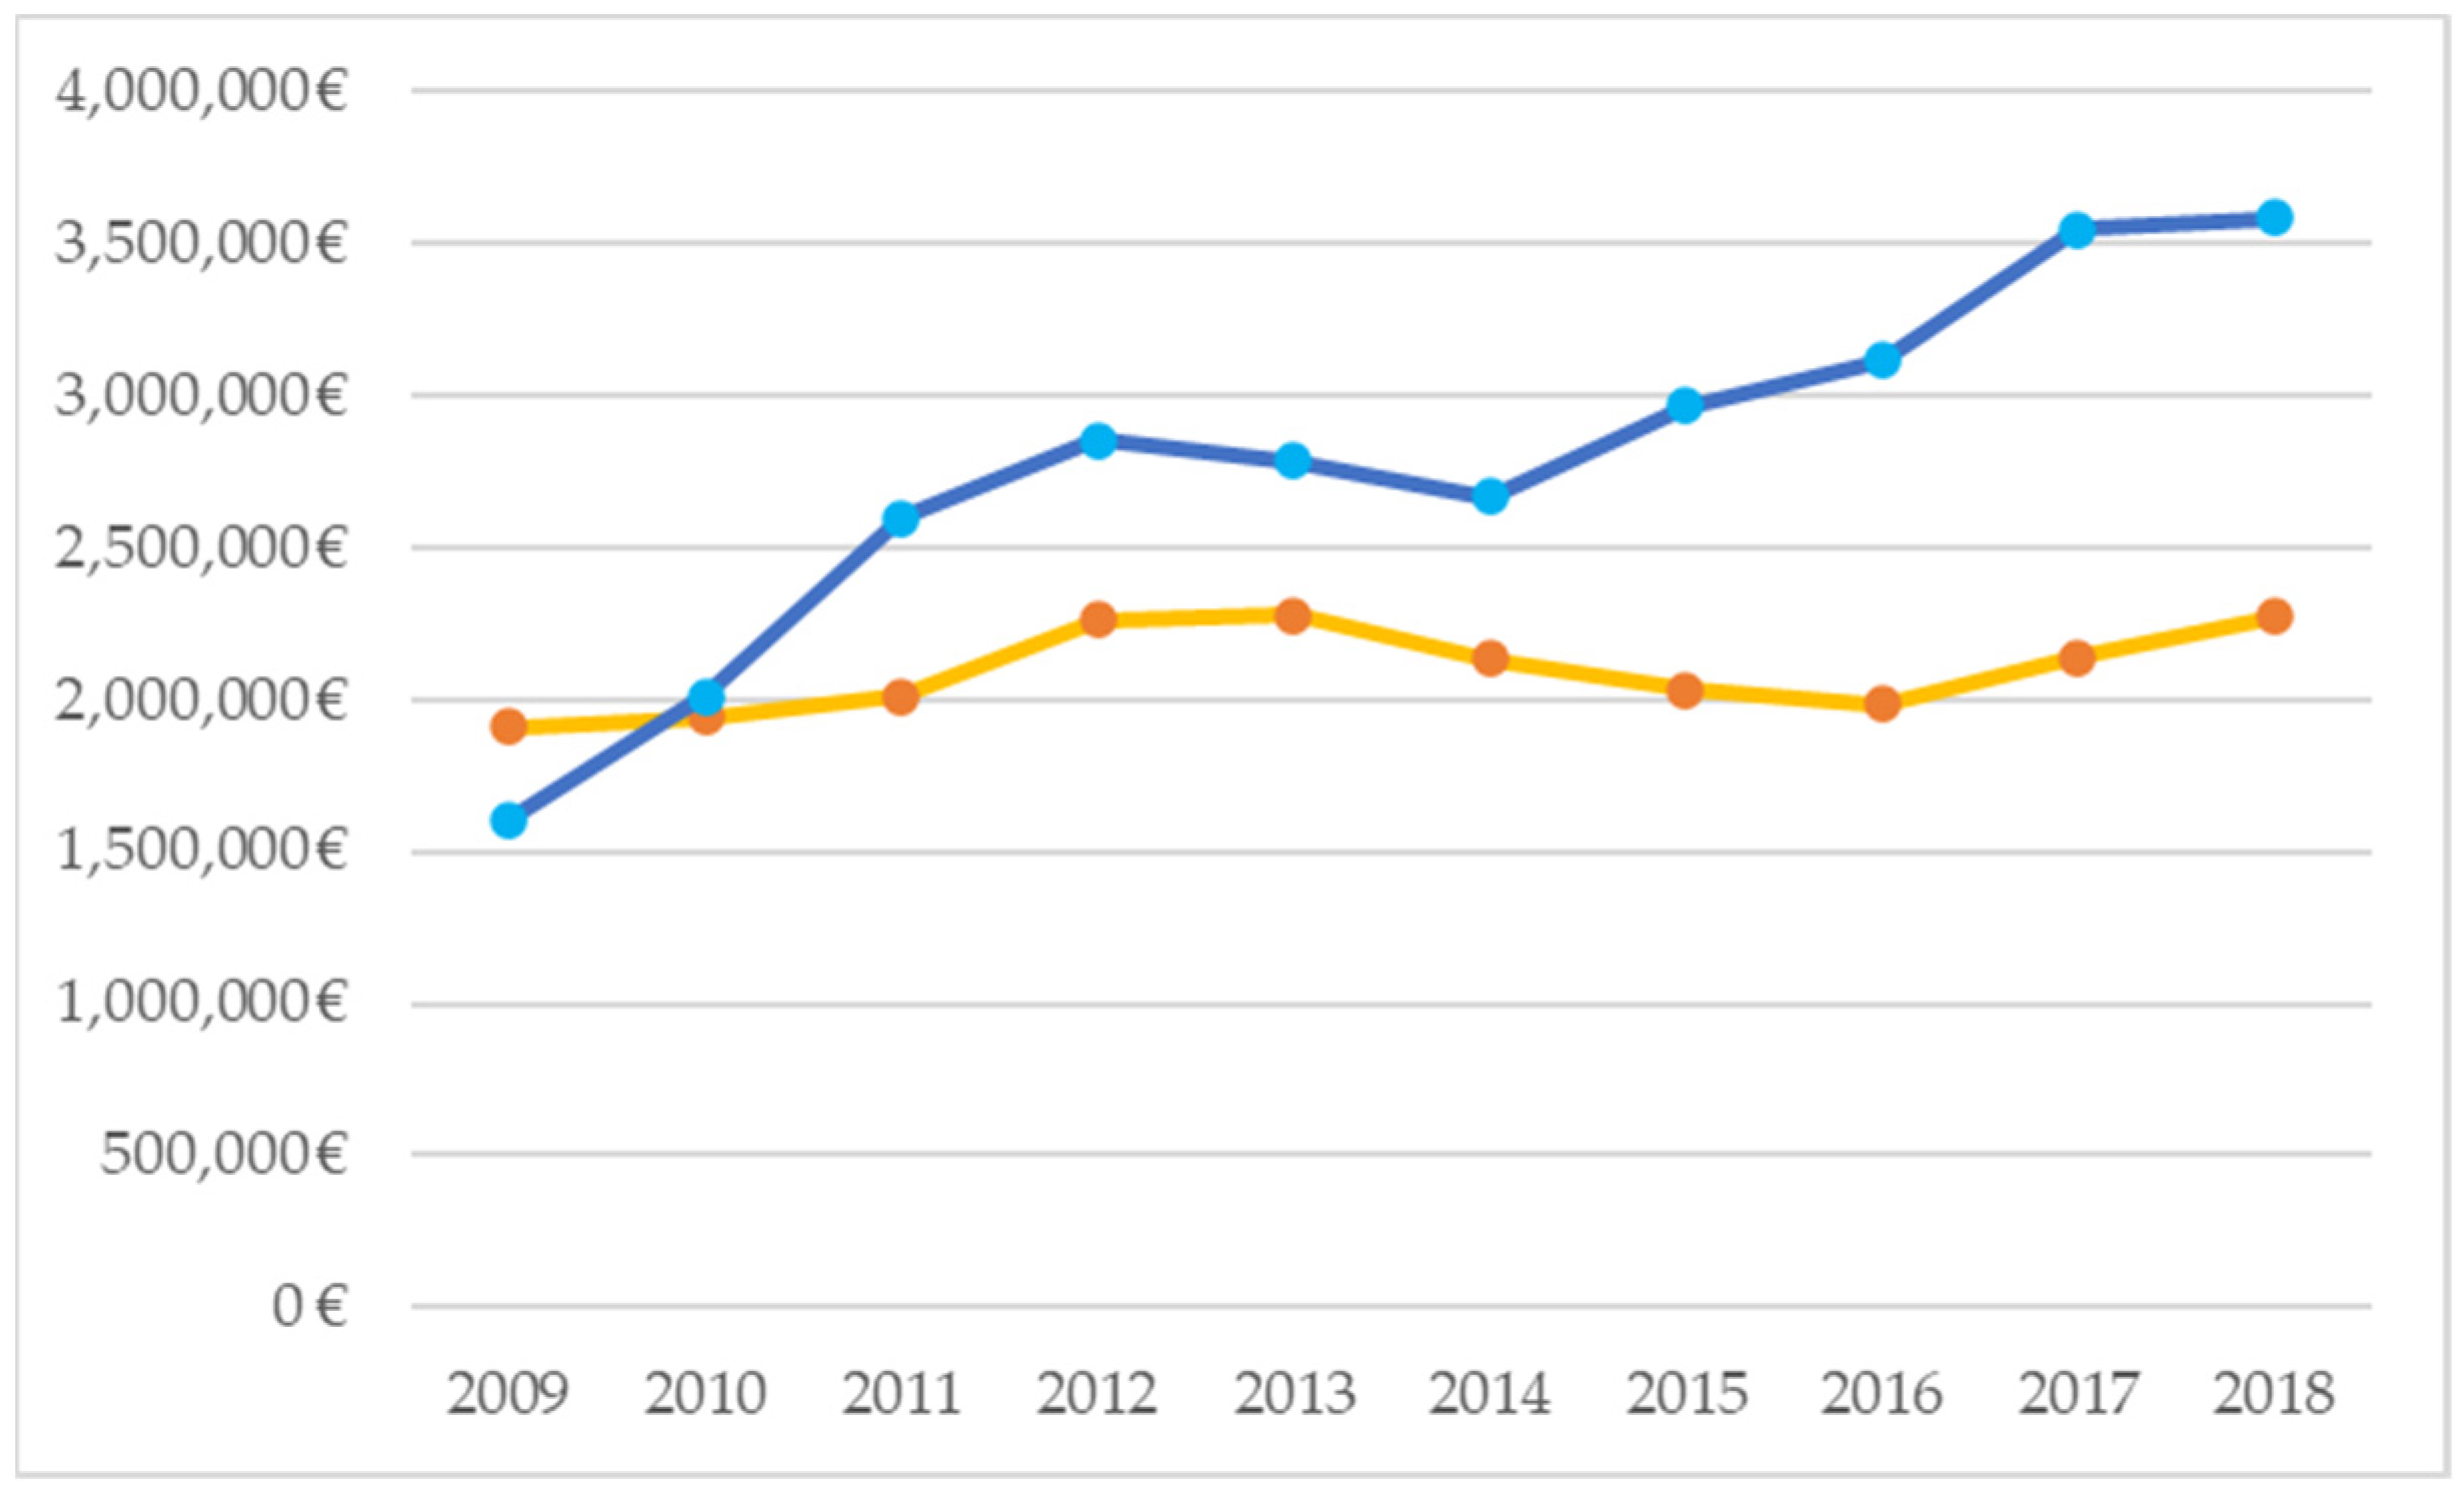
Despite this important deviation in the execution of the measure of promotion, the exports of bottled wine to third countries have increased considerably.
Figure 2 shows and compares the evolution of the exports of bottled wine both in Europe as well as third countries.
Historically, the internal market has been the main destination for exports of bottled French wine. In
Figure 2 and in
Table 4, it is possible to appreciate how, since 2010 and during the first decade of implementation, the extra-community exports have increased in value (+90.4%) compared to those of the internal market and have preserved a growing trend in spite of the decrease of the subsidies for the increase of promotion in these markets.
These data, in addition to a lack of recent and specific literature regarding the topic, additionally encourage a scientific analysis to verify if the budget assignment is coherent with the need of the productive fabric and which factors may influence a better assignment and execution of the same.
3. Materials and Method
3.1. Sample and Data Collection
This research intends to study the influencing factor in an implementation of the measure of promotion with the final aim of reaching greater efficiency. Among the 15 MS that have activated this measure, France has been the country with the best execution ratio; even so, a large sum of money (€38 million) has been unused, and for the already explained reasons, we choose this country.
Due to the third NSP not having finished by the time of this study, and due to avoiding bias derived from the change of the subsidy percentage granted during the years of the COVID-19 pandemic, the study is focused on the decade 2009–2018, this being the complete period of two NSPs.
The data have been obtained from the official reports of the DG AGRI; specifically, for the export data, the Trademap database was consulted, considering the tariff entry HS 21.04.21. The measure allows the grant for activities destined for the promotion of finished products (bottled wines); because of this, this entry has been selected to verify the impact on the exports.
3.2. Definition of the Variables
For the development of this study, four conditions have been selected (Variables -V-) with the aim of explaining or justifying a large ratio of execution of the measure of promotion in France (Result -R-).
V1: Budget available for the measure of promotion.
This value expressed in euros indicates the monetary amount that France has available—and that the administration of the country has assigned—for the measure of promotion.
Justification: With the analysis of this variable, it intends to objectify whether the budget performance and distribution of the measure is appropriate.
V2: Amount spend on all the CMO wine, as a sum of all the measures
This amount, expressed in euros, is the sum of all the grants that France has executed for the beneficiaries of their own country throughout the financial year.
Justification: The study of this variable allows for the understanding of the volume and function of the wine CMO in its entirety to be able to contextualize the results obtained from the specific measure of promotion.
V3: EBG: Execution Budget Gap of the measure of promotion
This value, expressed as a percentage, is the difference between the budget quota assigned to the measure of promotion at the beginning of every financial year and the quota effectively spent from the total of the wine CMO for this member state.
Justification: These data help to understand the consideration of the country when it comes to assigning the budget to the measure. When the EB is closer to zero, the management and assignment of the resources shall be more coherent with an appropriate execution of its own productive fabric.
V4: Value of the export in value of bottled wine in the year n − 1 regarding the implementation of the measure.
This value, expressed in euros, indicates the value, registered in the year n − 1 (previous year) of the exports of bottled wine (22 April 2021) sold by French vineyards in third countries.
Justification: It is necessary to have a reference for the evolution of the sales of bottled wine and analyze them with the commercial activities and the promotion performed in the previous year. The study of the value in exports, different from the data in volume, is considered to be timelier when it comes to analyzing the causes of a promotion campaign.
R: Execution ratio for the measure of promotion
This value, expressed as a percentage, indicates which quota of the grant destined for this measure has been effectively implemented at the end of each financial year. It is the quotient between the amount paid to the beneficiaries and the budget available for the measure of promotion.
Justification: This value is of utmost importance for understanding the relationship between efficient execution and the rest of variables used. The analysis to perform intends to explain a heightened ratio of execution with the aim of improving the use of the resources.
The first three variables may be observed in
Table 3, while we can observe the last variable, V4, and the R ratio in
Table 4.
3.3. Data Analysis Method
The Fuzzy Set/Quality Comparative analysis (fs/QCA) model is a method of a theory of groups that considers the cases as configurations of causes and conditions, instead of trying each independent variable as analytically different and isolated from the rest. This empirical method examines the relationships between the result of interest (R) and all the possible combinations (high/low or absent) of their predictors or conditions (V1, V2, V3 and V4).
In order to understand the fuzzy-QCA, the theory of groups must be addressed. This allows for a detailed analysis of how the causal conditions contribute to a particular result. Instead of estimating the purposes of the individual variables, fs/QCA uses Boolean logic to examine the relationship between a result and all the possible preceding multiple combinations, allowing for the researchers to find different combinations of causal variables that suggest different theoretical paths to specific results (
Longest and Vaisey 2008). According to
Ragin (
2008), instead of researching which factors are the most important, fs/QCA seeks to know which factors should be combined and in which combinations.
The measure of the consistency—similar to the correlation—is the proportion of the cases compatible with the result; that is to say, the number of cases that a specific configuration of attributes and the result divided by the number of cases that present the same configuration of attributes. The underlying idea is that there is a diffuse sub-group relationship when the scores of belonging to a group (Xi) are consistently less or equal to the scores of membership in the other (Yi) (Xi ≤ Yi).
The measure of coverage—similar to the determination co-efficient—assesses the empirical relevance of a consistent sub-group. In other words, which proportion of the result is explained by the variables of the model, in this case, by the solution. The coverage is based on a causal combination, which guarantees that the cases which comply cover a large part of the result by being empirically important.
3.4. Calibration
A diffuse group may be seen as a continuous variable that has been calibrated in a useful manner to indicate the degree of belonging to a well-defined and specific group. This calibration is possible only through the use of theoretical knowledge and which is essential for the specification of the three cut-off or threshold qualitative points (complete member, incomplete member and maximum ambiguity).
Table 5 shows the calibration step. In this research it indicates that the measure of promotion in the years 2009–2018 may be considered members of groups that vary in accordance with their specific attributes. As a result, each one of these quantitative variables has to be calibrated to grant degrees of membership or belonging to previously defined groups.
The values of the medians mark the degree of membership. These values, which coincide with the median, are considered to be ambiguous; low values are incomplete members (in other words “low value”) and those which are high are considered to be complete members (in other words “high value”).
3.5. Analysis of Sufficiency
Once the results and all the conditions are calibrated (the
fz suffix indicates a calibrated variable), the true table is extracted (
Table 6), which lists all the possible configurations. The value 1 in each configuration indicates a score of the calibrated variable greater than or equal than 0.5 (that is to say, closer to the category of complete member) and 0 indicates values of the calibrated variable less than 0.5 (closer to the category of no member).
Those configurations without cases (reminders) are removed and, given the sample size, in spite of analyzing two whole financial cycles of the measure, there are few of them; they also remove those configurations with a single case.
The following step is the selection of a limit of consistency to distinguish causal combinations that are sub-groups of the result of those which are not. In general, values below 0.80 in this column indicate substantial inconsistency. As a consistency threshold, 0.95 is chosen, and we assign the value 1 to the variable result (Rfz) when the consistency of this configuration passes the 0.95 threshold, establishing 0 otherwise.
In the true table, there are 2K settings or ranks, where “k” is the number of conditions or variables. There is an empirical rule which states that 2K < number of cases; as such, by having 10 cases (years), it was not possible to introduce a greater number of conditions. This empirical rule is a recommendation and is non-binding. By being a pioneering study with this model for the measure of promotion, only four conditions are selected, which is still an acceptable limit to ensure that the results obtained are reliable and robust. In order to apply the fuzzy QCA methodology in this research, the FS/QCA 3.0 (Fuzzy-Set/Qualitative-Comparative Analysis Version 3.0, sourced by COMPASS—Claude Rubinso: Irvine, California; Department of Sociology, University of California) software has been used.
4. Results
The final solution for the prediction and explanation of a high implementation ratio (above 87.70%) is as follows:
Three common operations in different groups are the negation (~), the intersection (“logic and”, which is represented by a multiplier operator ∗) and the Union (“logic or”, which is represented by a sum operator +):
Logic negation (~): (belonging to the group ~M) = 1.0 − (belonging to the M group)
And logic (∗) shall be performed taking the minimum score belonging to each case in the groups that are combined
Or logic (+) is performed taking the maximum score of belonging to each case in the groups that are combined
The combination shown in
Table 7 sufficiently increases the execution ratio of the measure (R) in 100% of the cases and covers 56.91% of the cases: a high V
4 together with a high V
3 and a low V
1 leads to sufficiently increasing the R level or even a high V
4 together with a high V
3 and a high V
2 leads to sufficiently increasing the R level.
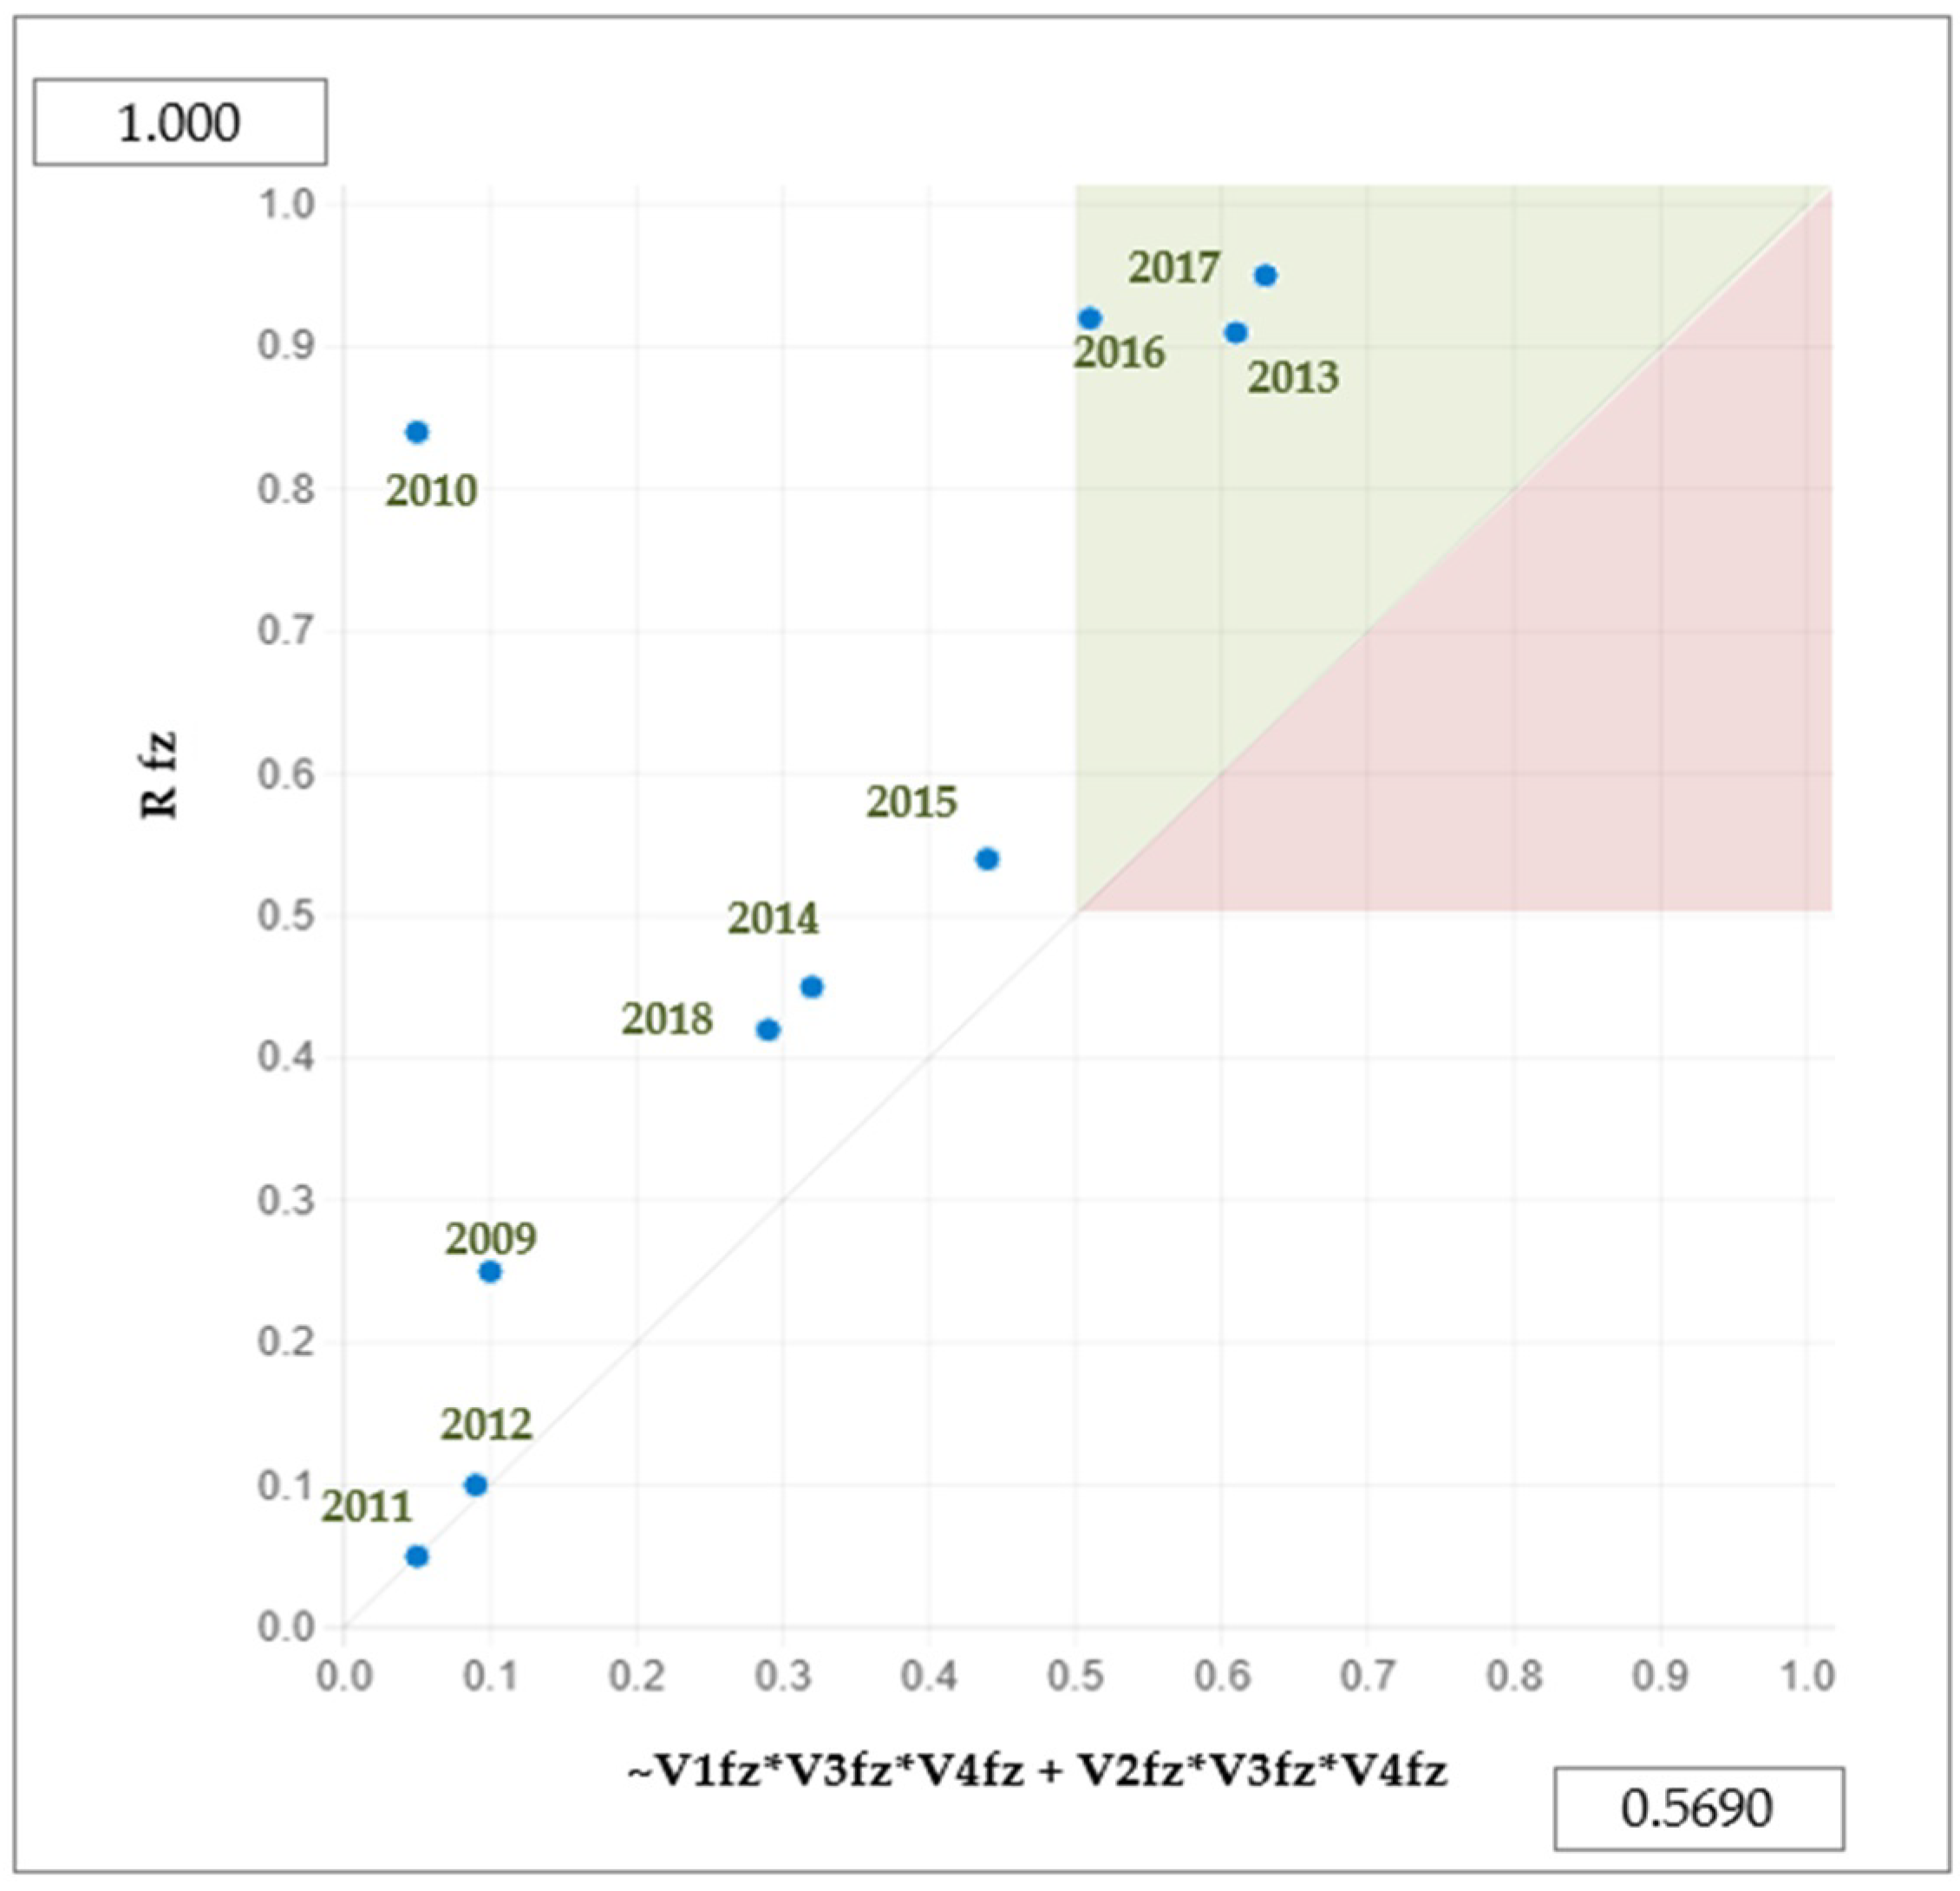
In order to represent the consistency and coverage of a solution, they may use scatter plot graphs that face the solution with the result: a combination -group- that systematically has all the scores (calibrated) less or equal to the scores of the result (upper triangle). It is said that this is a sub-group of the result and that the consistency is high. The years that are beneath the diagonal are inconsistent with the result and those that are above are consistent. However, within each group, there are degrees of relevance in relation to the score of the combination being less or more than 0.5 (upper right quadrant): it is more serious than an inconsistency in the red triangle (Yi ≥ 0.5, Xi > Yi) and it is more relevant than a consistency in the green triangle (Xi ≥ 0.5, Xi ≤ Yi).
Figure 3 explains with a graph how the predictive combinations obtained using the fs/QCA model have been consistent throughout all the years studied, placing all of them above the diagonal. Additionally, three specific financial years (2013, 2016 and 2017) are very consistent, concluding that it is likely that there is a common pattern in these three years as the combination of factors obtained is particularly consistent.
5. Discussion and Conclusions
5.1. Theoretical Implicaciones and Managerial Implications
This study intends to enrich the debate regarding the CMO for the wine sector, focusing on the measure of promotion during the first decade of its implementation. The topic addressed is pioneering, given that the literature review undertaken has shown that until now, no similar studies had been considered in this context. As a result of this, it is not possible to establish a comparison between the results obtained in this study and other prior analysis. The results offer various combinations of factors which, based on the first decade of implementation in France, would explain how to maximize the implementation ratio of the measure of promotion®, for a more effective management of the same.
The correction and redistribution of the budget, expressed with the EBG (V3) coefficient, should remain greater than the reference value (−1.76%). This would explain why in France the management of the public administration plays a particularly relevant role in the results of the measure of promotion. The planning of the resources among the different measures of the CMO is, as such, key for the country, evidenced by the co-responsibility of the functions between the private sector and the public sector in the management of international promotion by means of EU funds.
Similarly, a high value for bottled wine exported to third countries in the previous year (V4) is present in both groups of combinations. This result may explain how the French productive fabric has a quite evident interconnection between the commercial results (exports) and the marketing functions of winemaking businesses (promotion campaigns). Greater income derived from the sales of bottled wines in third countries during the previous year shall be followed by a more effective management of the promotion campaigns with the European Union funds, according to the model analyzed.
A budget contribution for the low measure of promotion, according to the model, would also explain a better ratio of execution. This conclusion coincides with the trend that is registered by analyzing the five-year periods of implementation of the measure. France has managed to comply with 100% of the execution, and even surpassed this threshold by making the most of the flexibility that exists in the management of the CMO wine, solely in those financial years in which the budget has been considerably reduced in comparison to the previous year. For example, 104% of the execution was seen in 2013 (−59% of the budget in relation to the previous year), 106% in 2016 (−23%) and 110% in 2017 (−17%), as can be verified in
Table 3.
Finally, the condition of an investment of high CMO wine (V2) supports the conclusion that the different measures of CMO for the wine sector have a close connection between them. The possibility of making the most of different subsidies or grants for the productive process would generate economies for the organization that may benefit the rest of the functional processes, such as, for example, marketing and promotion activities.
The study shows predictive combination factors based on the situation of France in these ten years (2009–2018). These results intend to support the work of strategic planning made by the French national authorities, as well as serving as a reference for other MS and the EU technicians in their difficult task of assigning the budgets to the different CMO measures. A correct assignment of the resources needed for the measure of promotion could release other funds for other beneficiaries or other measures related to the production stage of the process, and not because of this, of less importance for creating value.
5.2. Limitations
Due to being a pioneering analysis on the topic, the study uncovers some limitations. First of all, despite considering two complete financial cycles, the size of the sample is a limit for reaching conclusions of a more generic nature regarding the sector and the CMO. Increasing the number of intervals in some of the variables has been considered, such as, for example, registering the exports per trimester and not annually. Notwithstanding, the execution data of the measure of promotion are published every 12 months, which limits the sample size in its consideration for years and, as indicated previously, the number of conditions to study according to the fs/QCA model. The method used is associated with the “learning by doing” technique, which for future studies, with a greater number of years, may provide more precise conclusions.
Second of all, the reports published by DG AGRI do not detail the market goals chosen by the group of French beneficiaries; because of this, it is impossible to offer an analysis that considers other factors beyond the measure mentioned, such as, for example, the market conditions, characteristics of the distribution channels, factors related to the harvest or the level of market penetration, among others.
Finally, the relationship between the measure of promotion and the commercial aspect (exports) is incomplete. In this study, because of the limitations of the fs/QCA model, only the results of the previous year’s sales are considered (V4) as proof of a greater or lesser investment in the promotion for the following year, when these commercial results may affect the strategic decisions of various coming years.
5.3. Future Lines of Research
The authors, with the aim of considering the results and conclusions obtained in this first approach to the measure of promotion, suggest future lines of research. Firstly, to explore additional, different scientific models other than fs/QCA, both qualitative and quantitative, which, with a greater number of cases (years of implementation), may offer more specific results and, perhaps, to other MS with similar characteristics. Secondly, on the basis of these results, it is recommended to analyze in detail the role of the public administration and its specific impact on the execution ratio, detecting potential structural improvements in the system that executes the grant.
Additionally, the authors detect a need to perform other studies at the beneficiary organization level, in order to measure the efficiency of each one of them and their link with the rest of the measures in the same financial year; similarly, a study focused on the behavior of wineries would help to understand whether the measure of promotion is truly an incentive for increasing campaigns or, on the other hand, is it considered a financial management tool for the structural cost saving that has already been considered.


