
The COVID-19 Era—Influencers of Uneven Sector Performance: A Canadian Perspective


Abstract
:1. Introduction
2. Literature Review
3. Methodology
4. Results
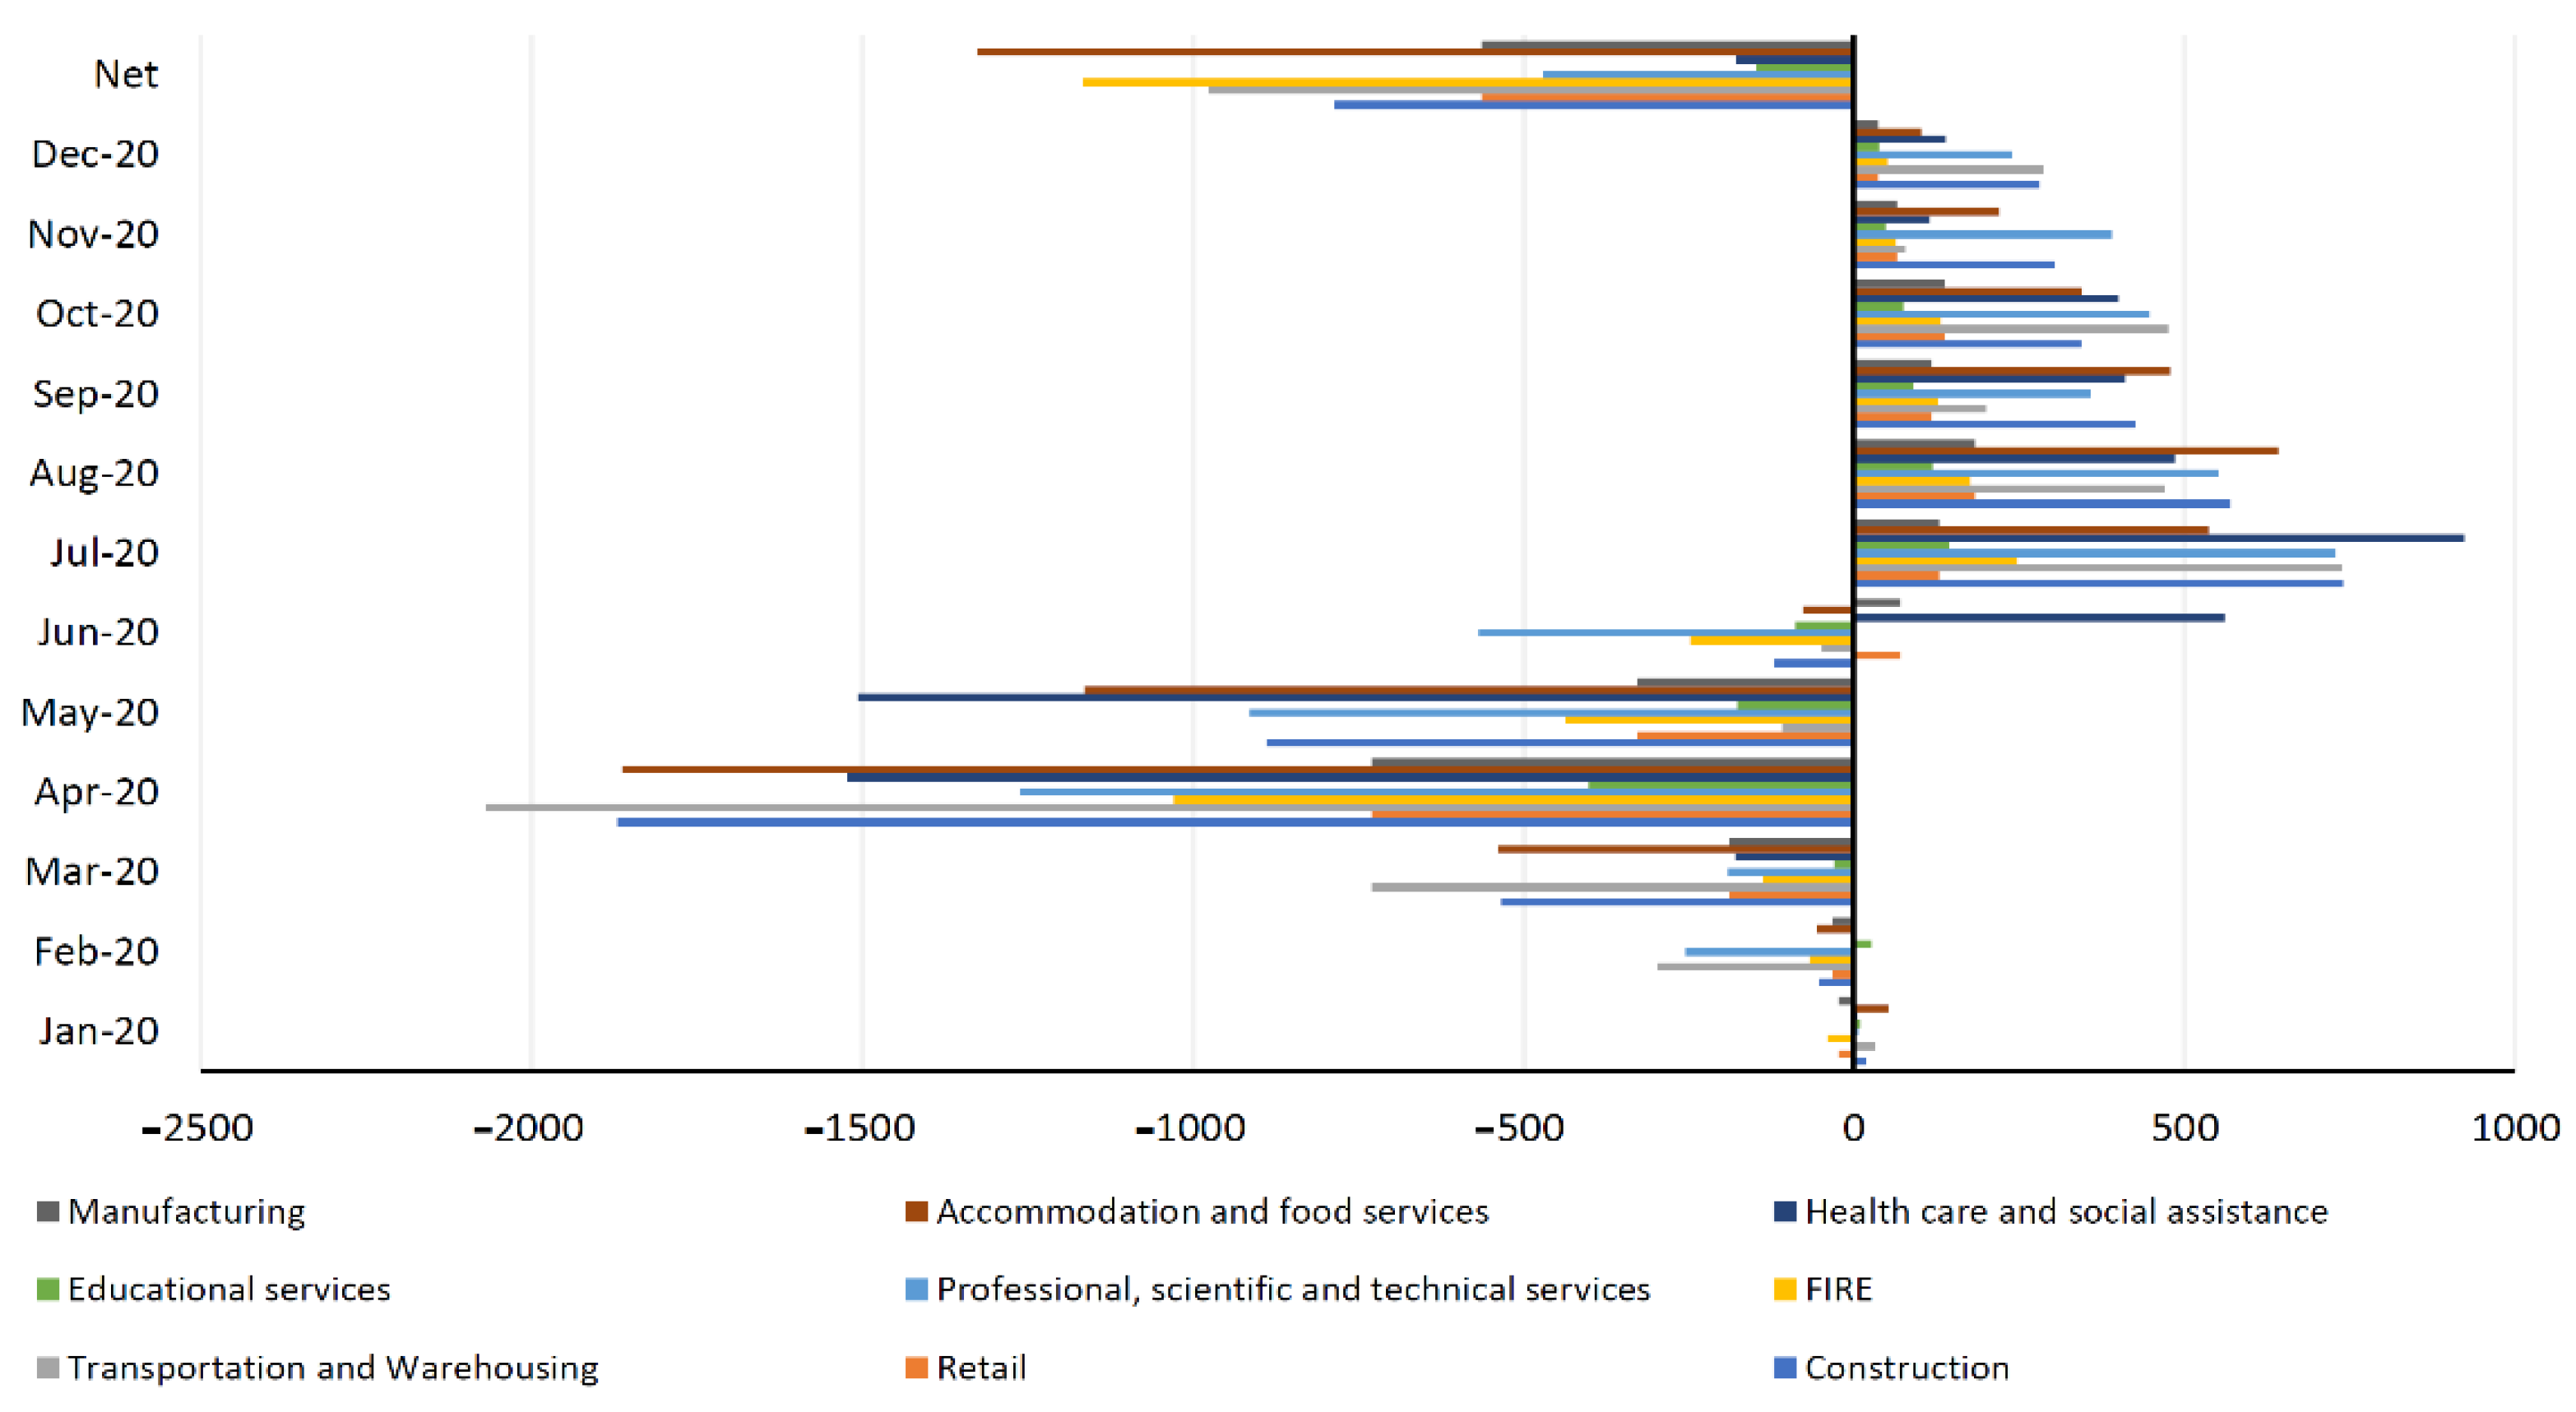
4.1. Distressed Sectors
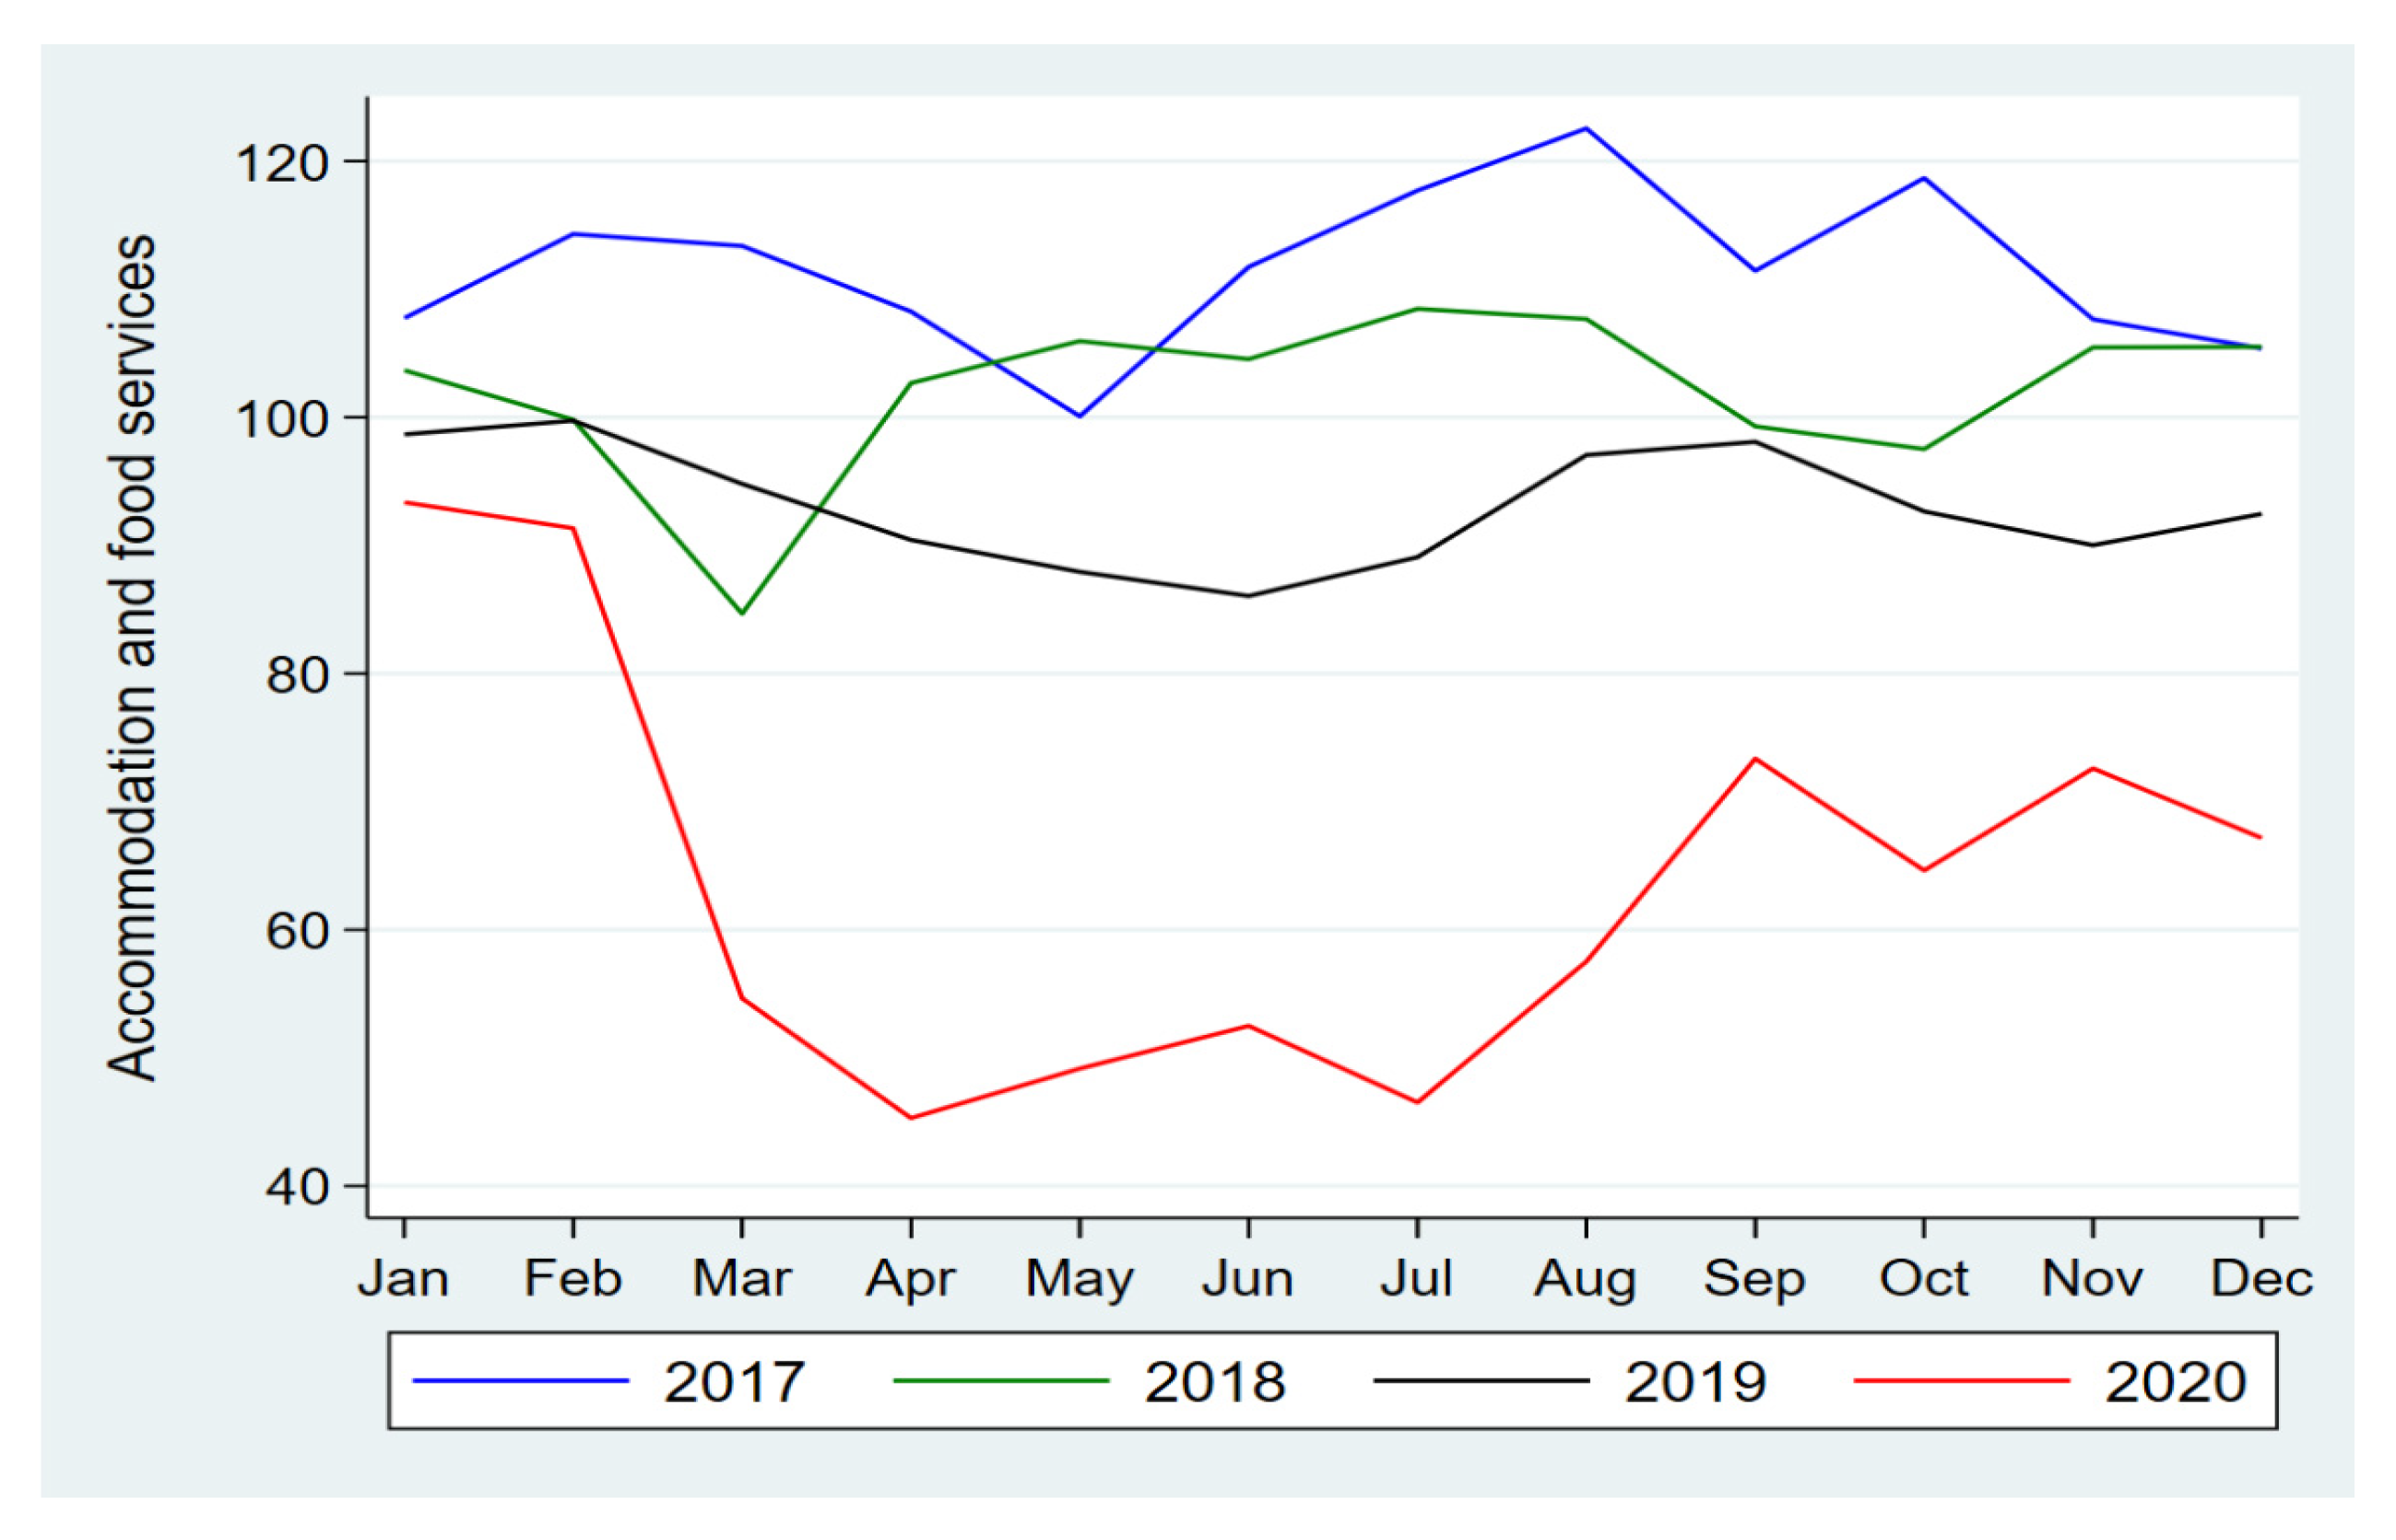
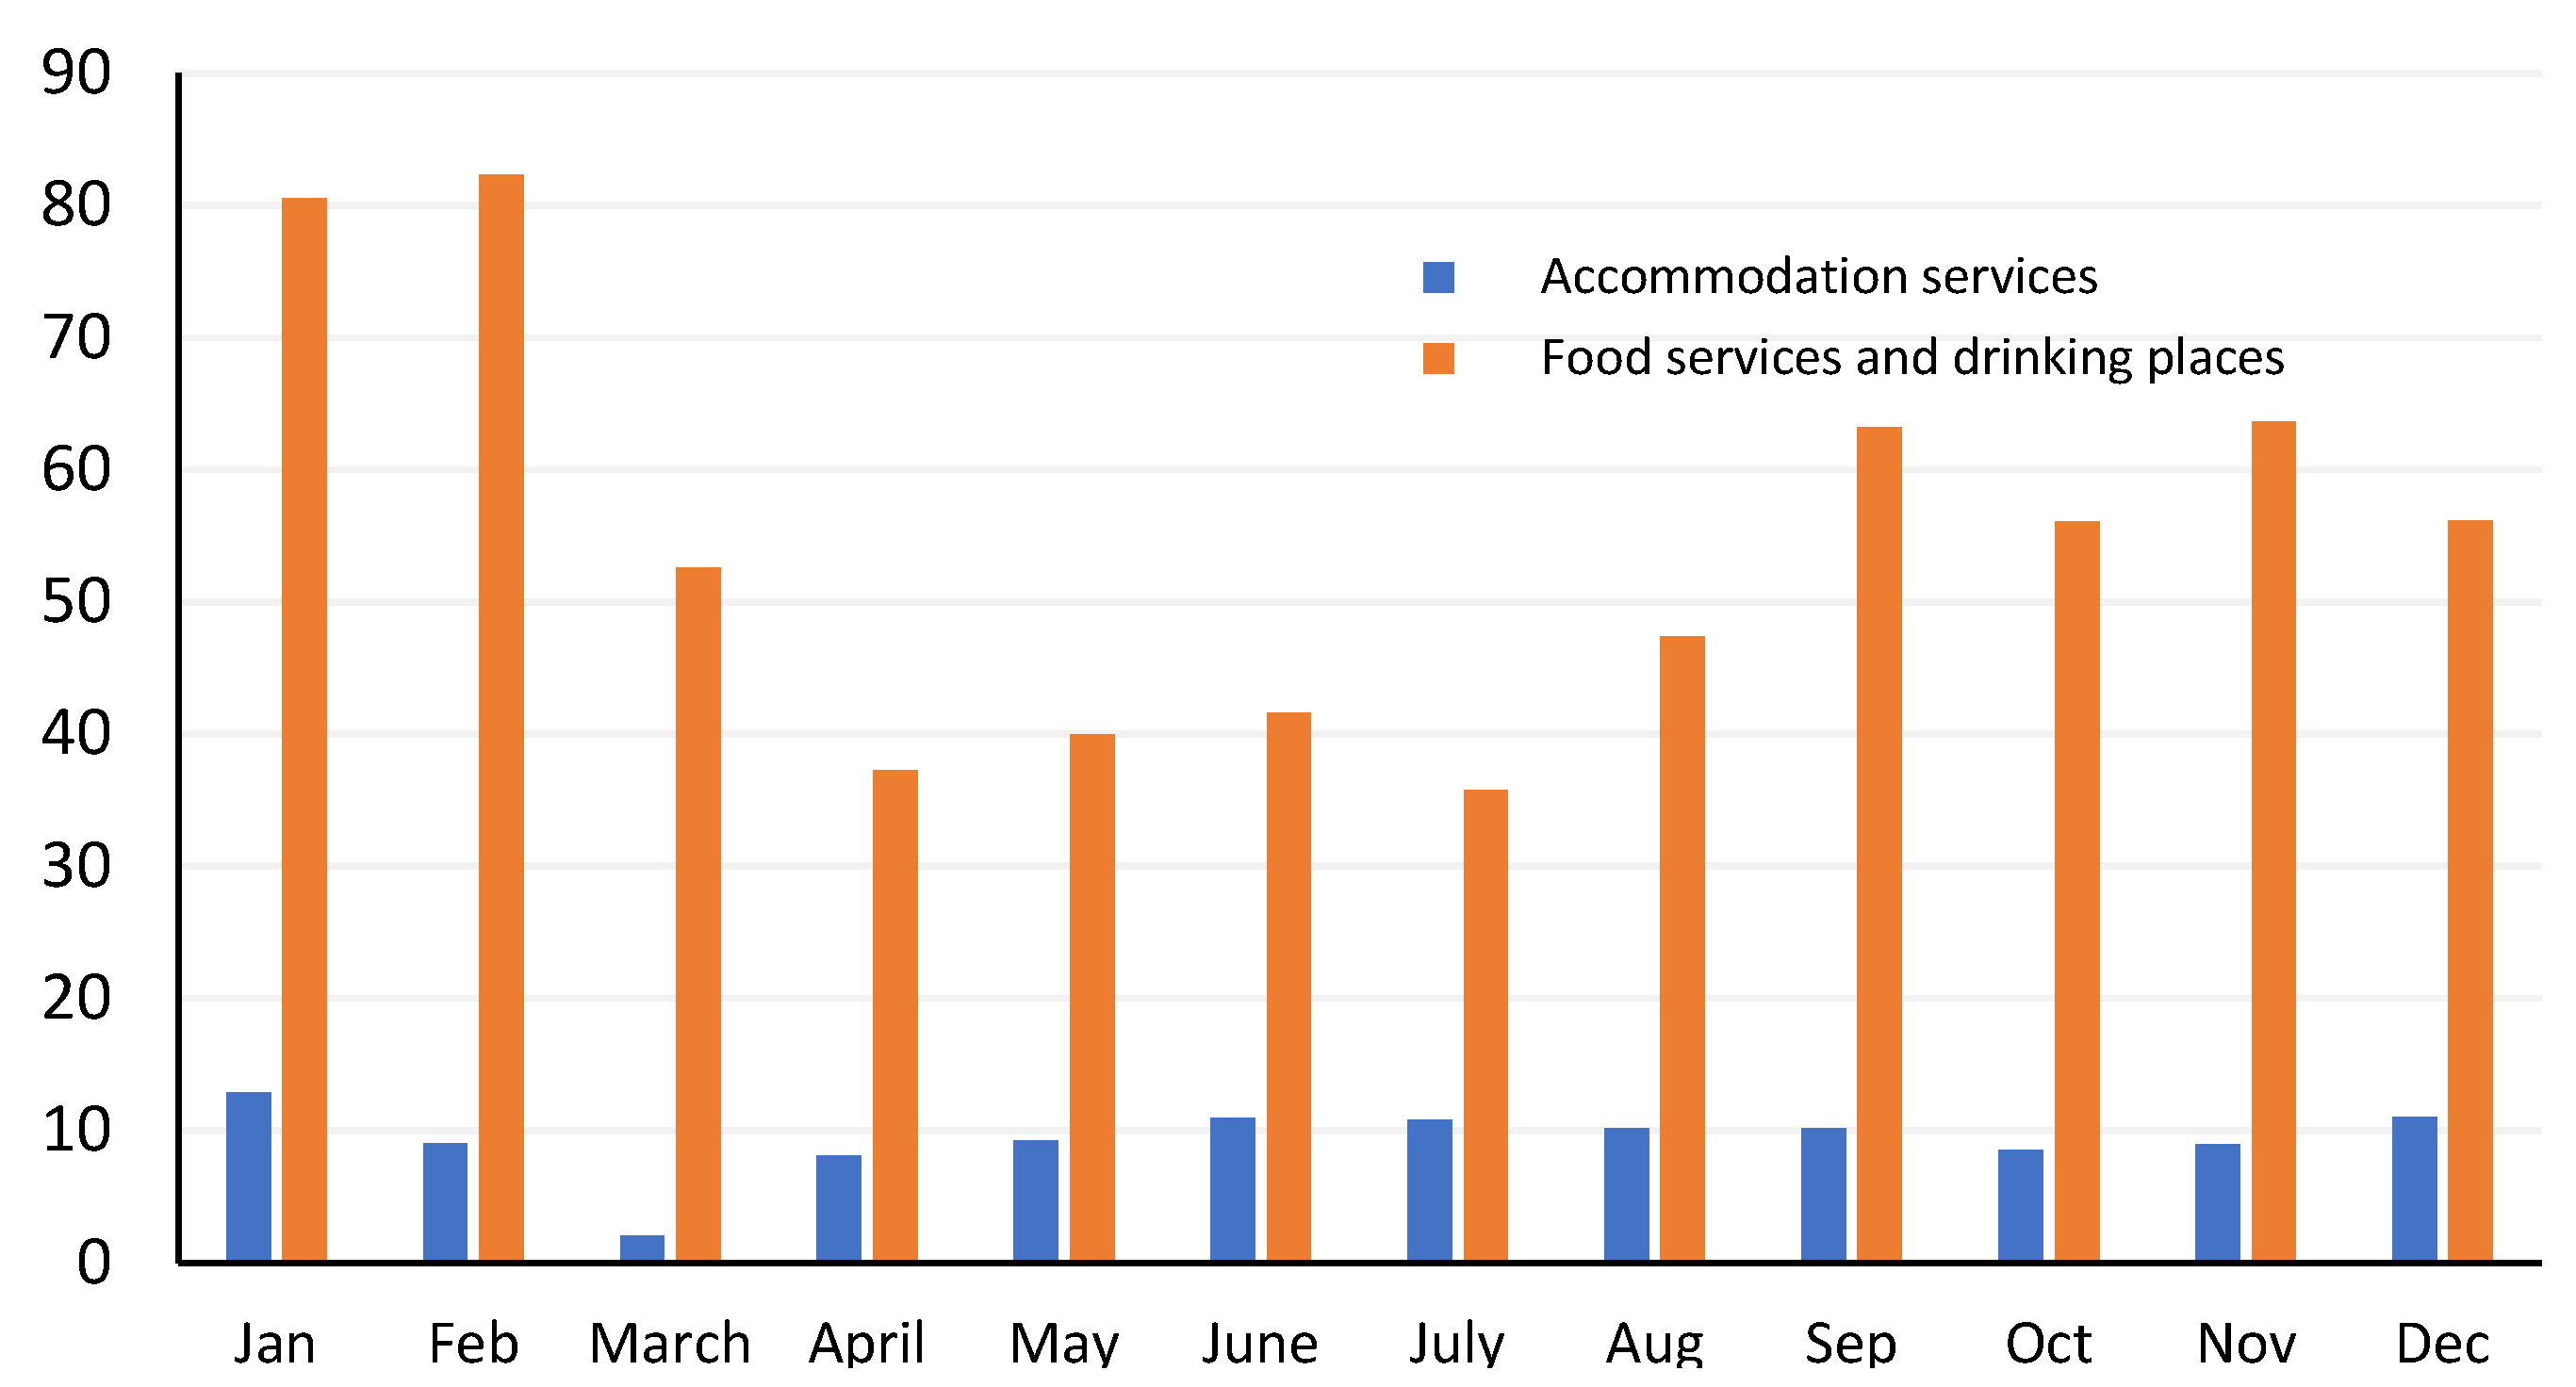
4.1.1. Accommodation & Food Services
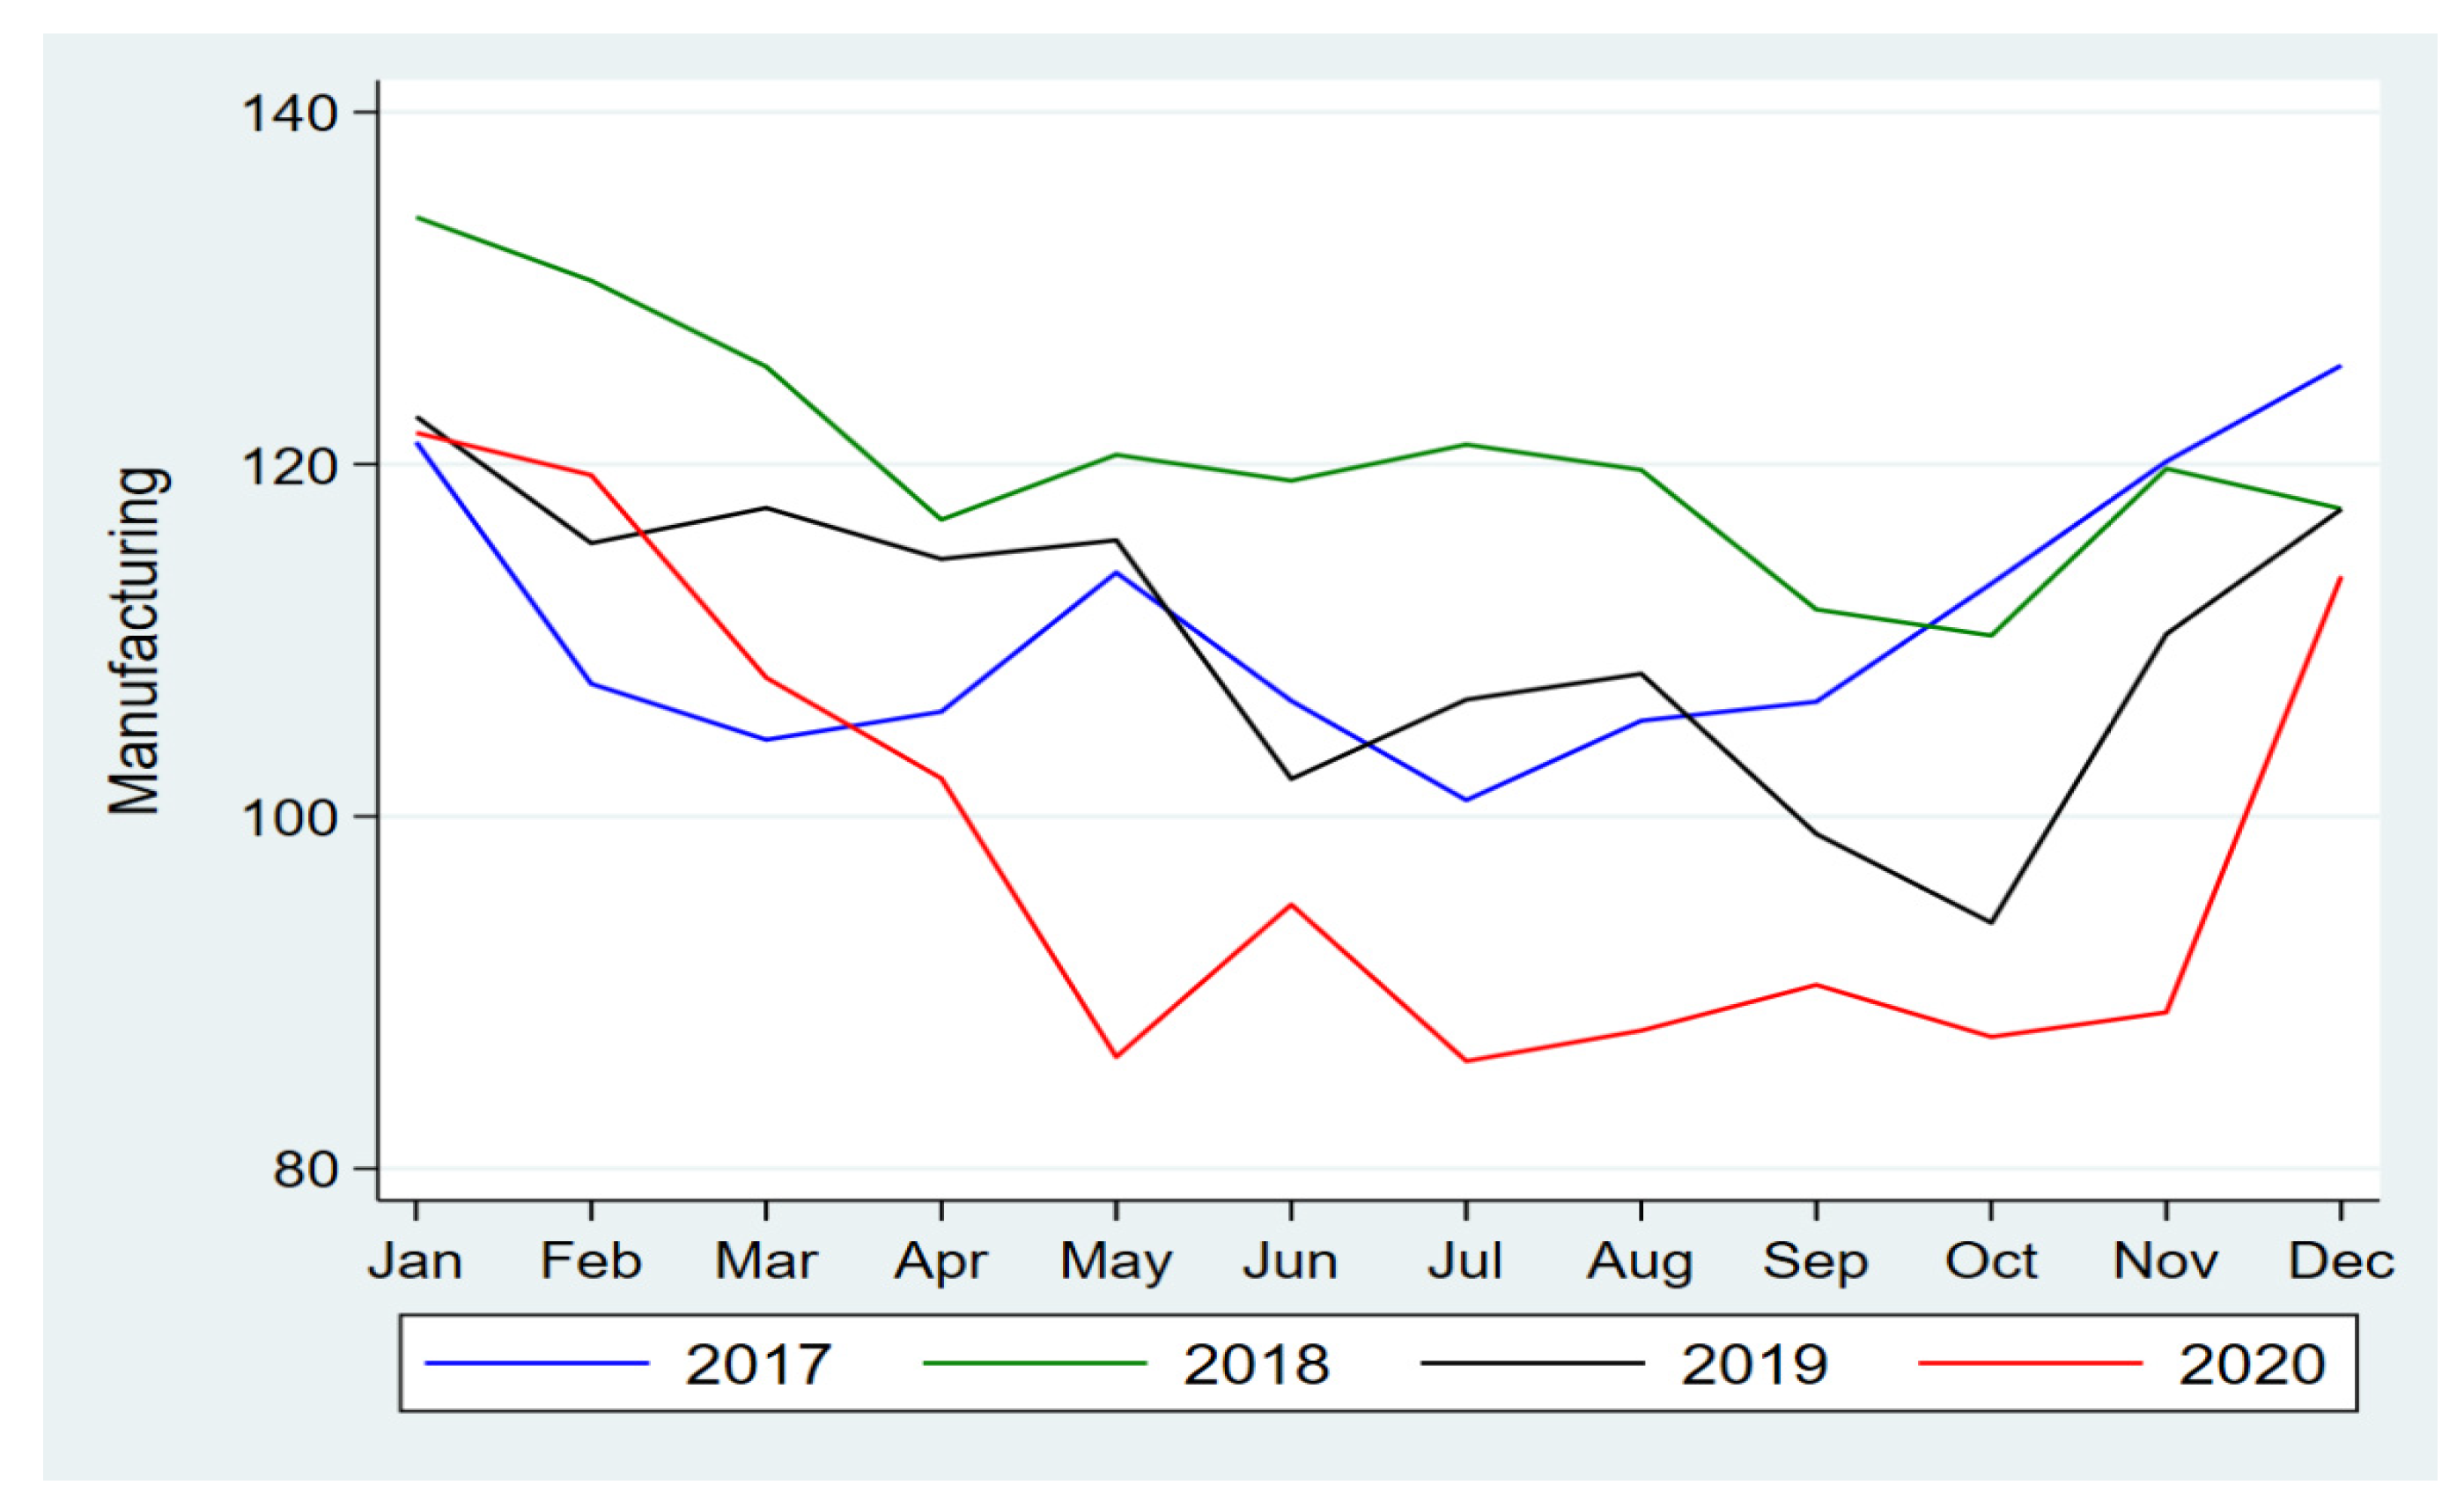
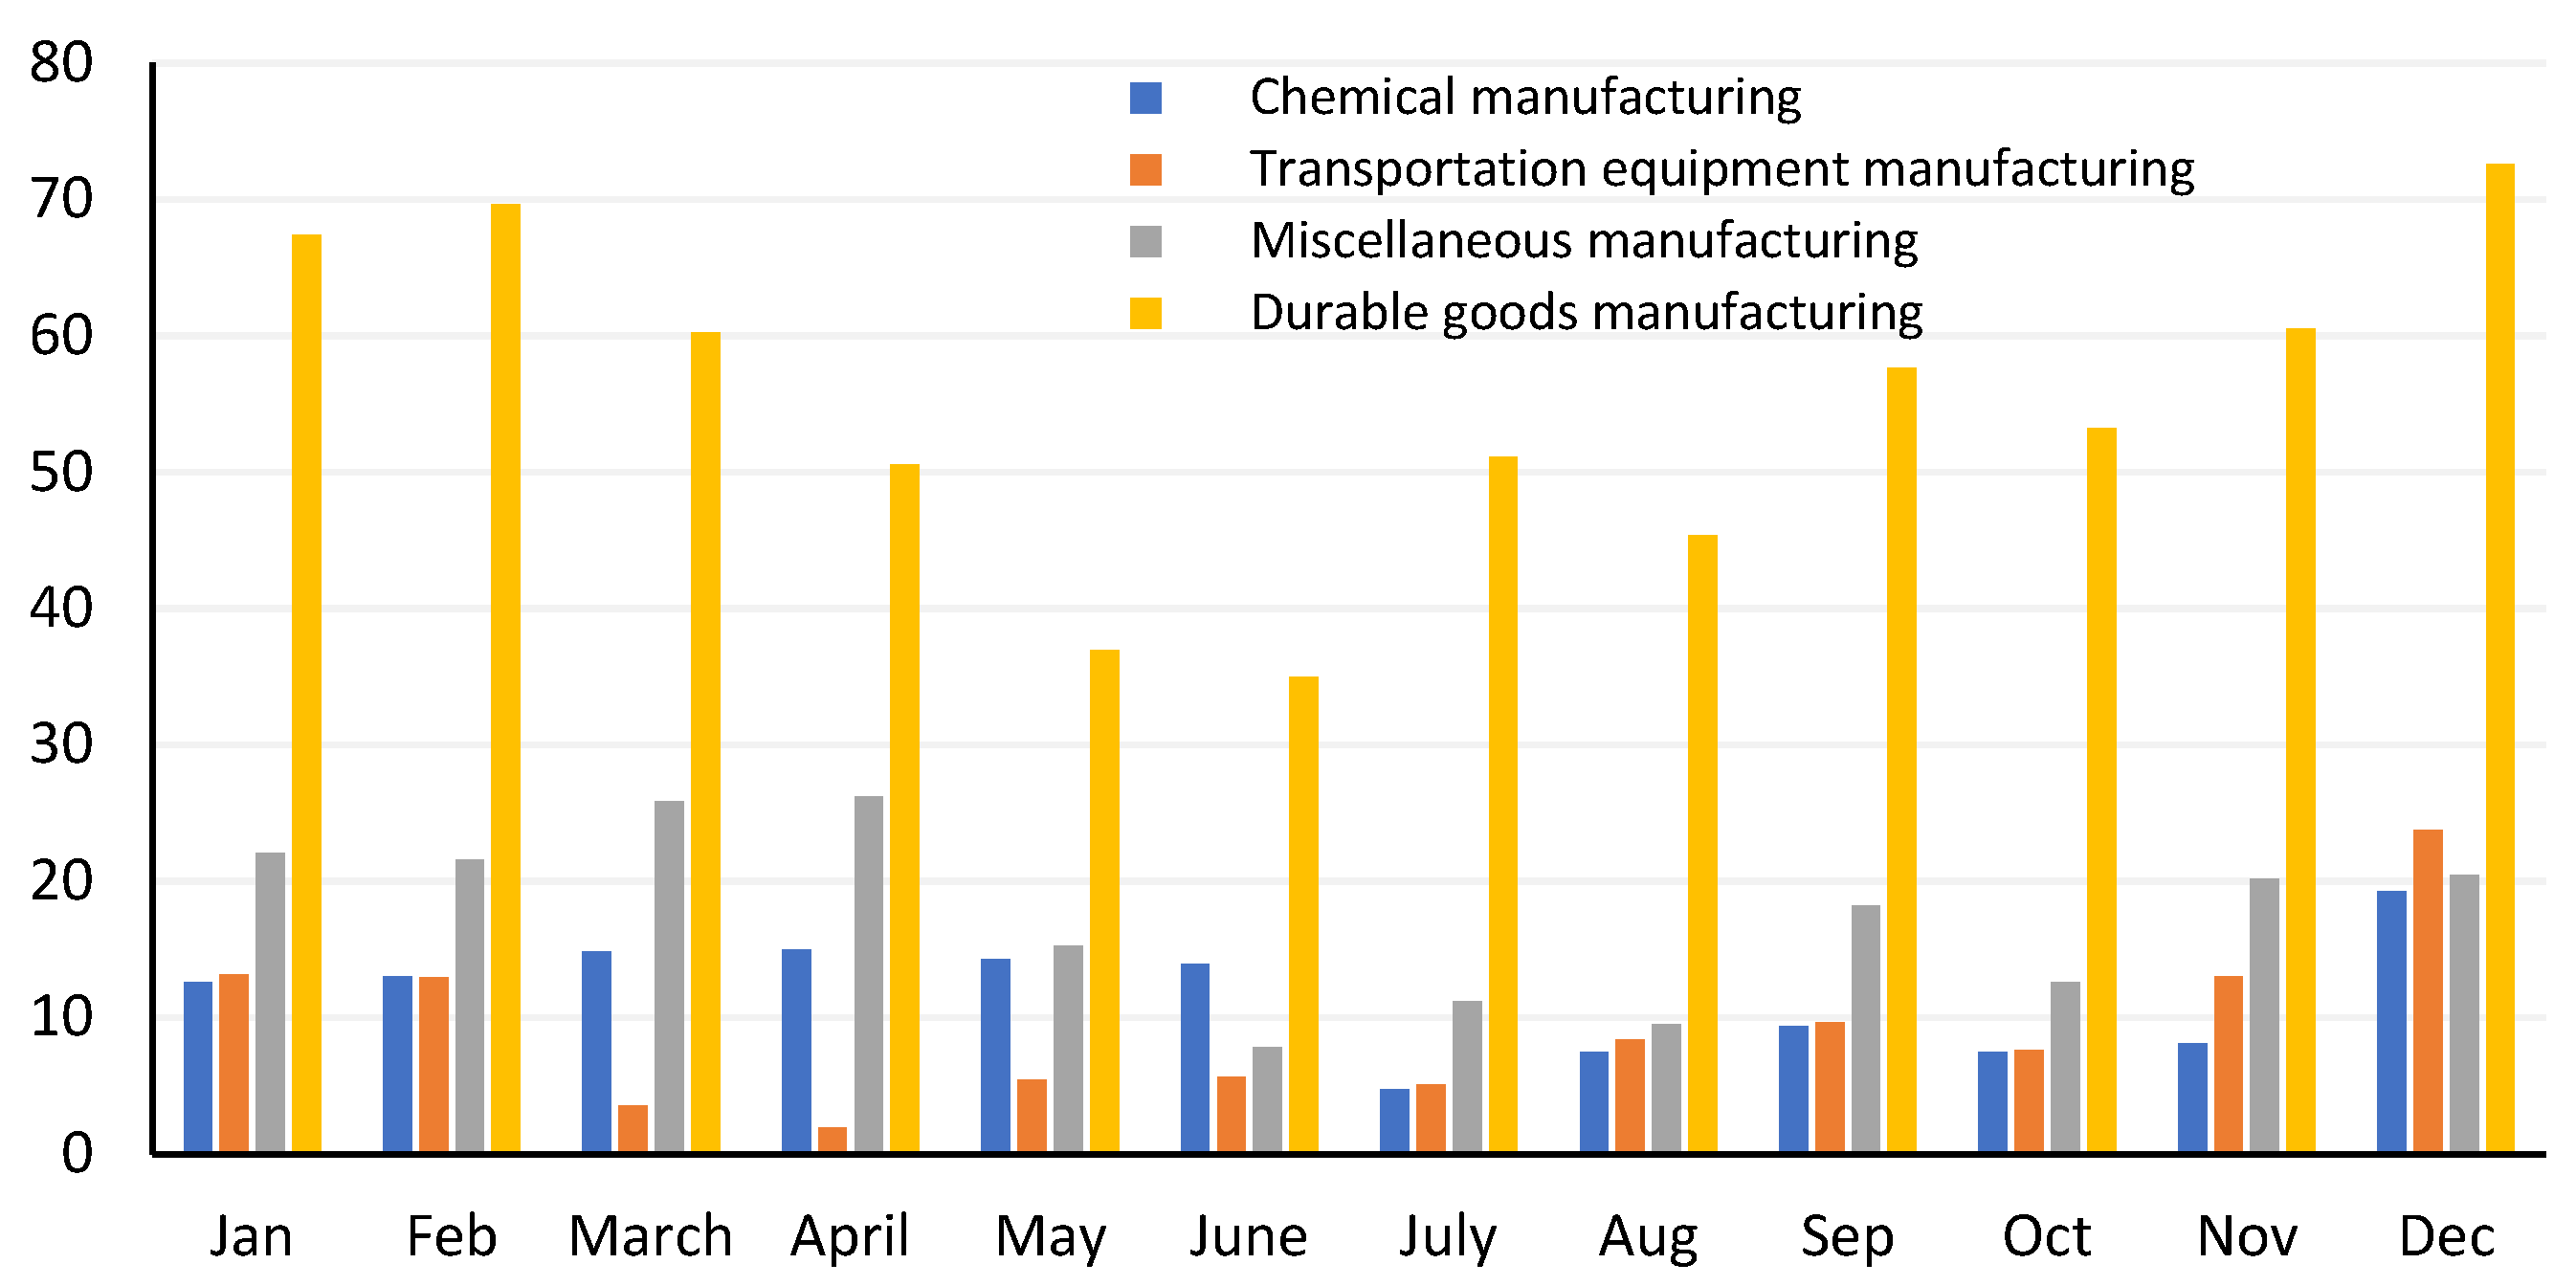
4.1.2. Manufacturing
4.2. Must Be Monitored Sectors
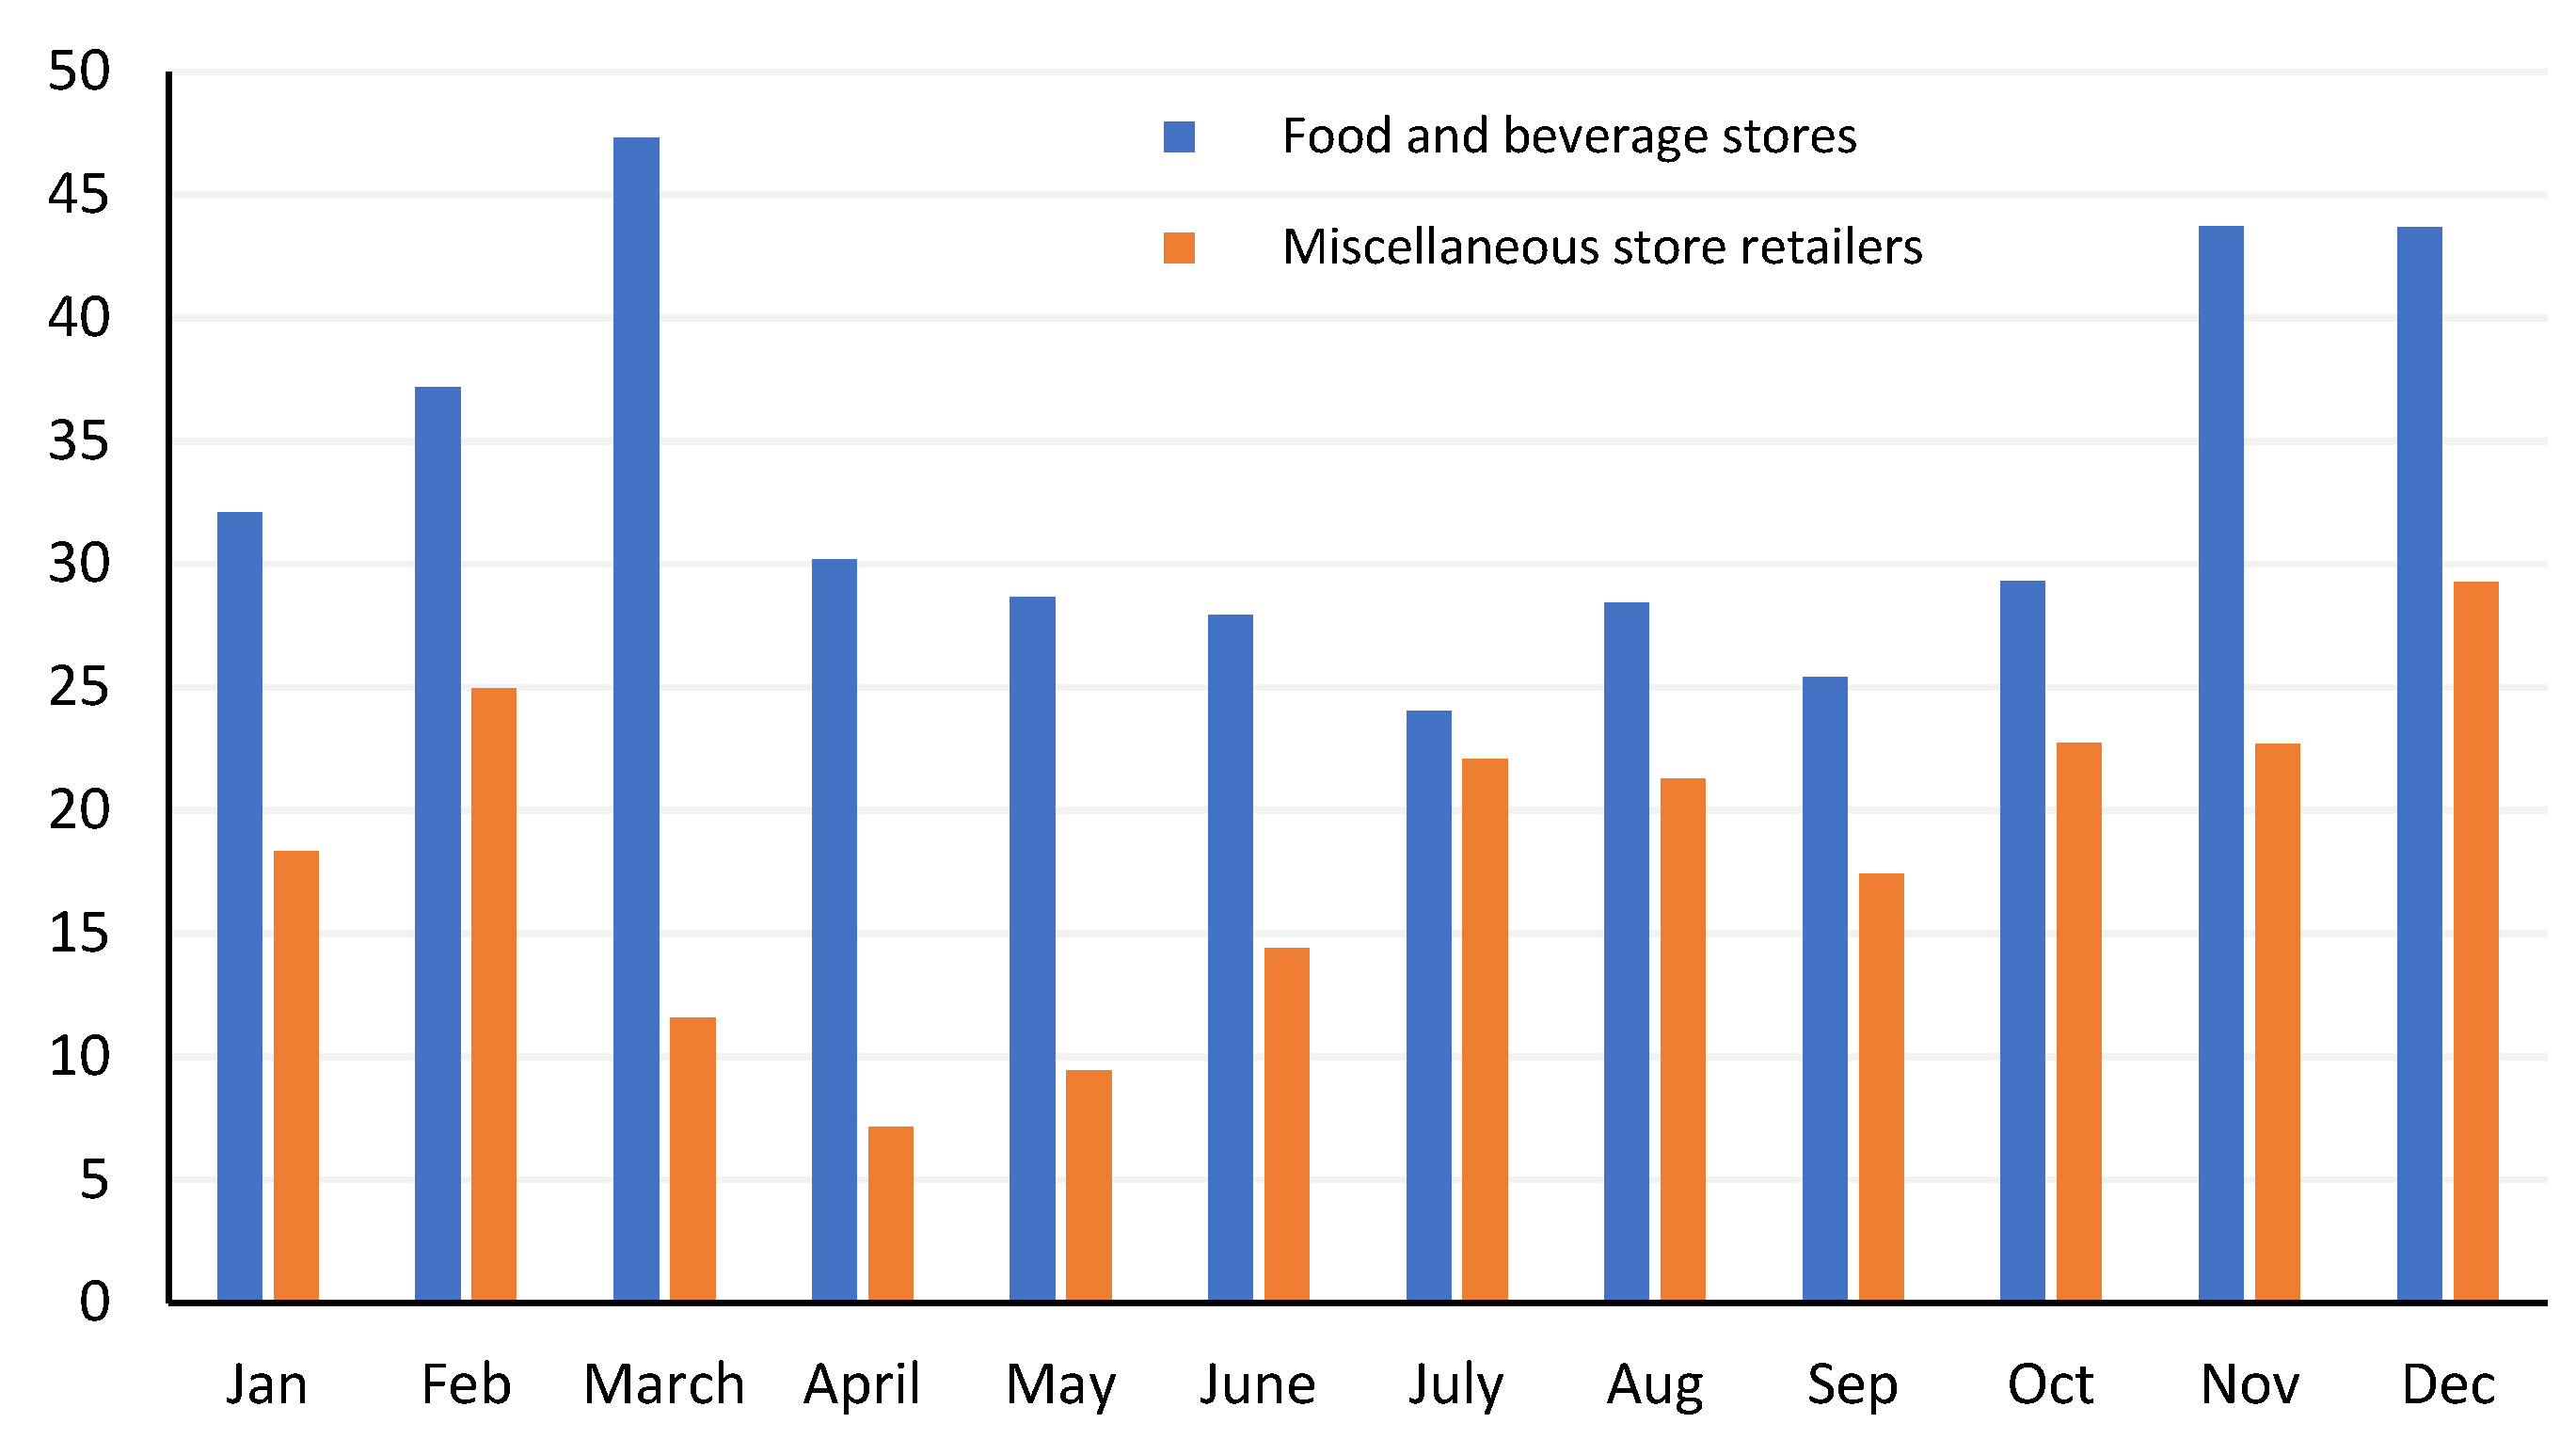
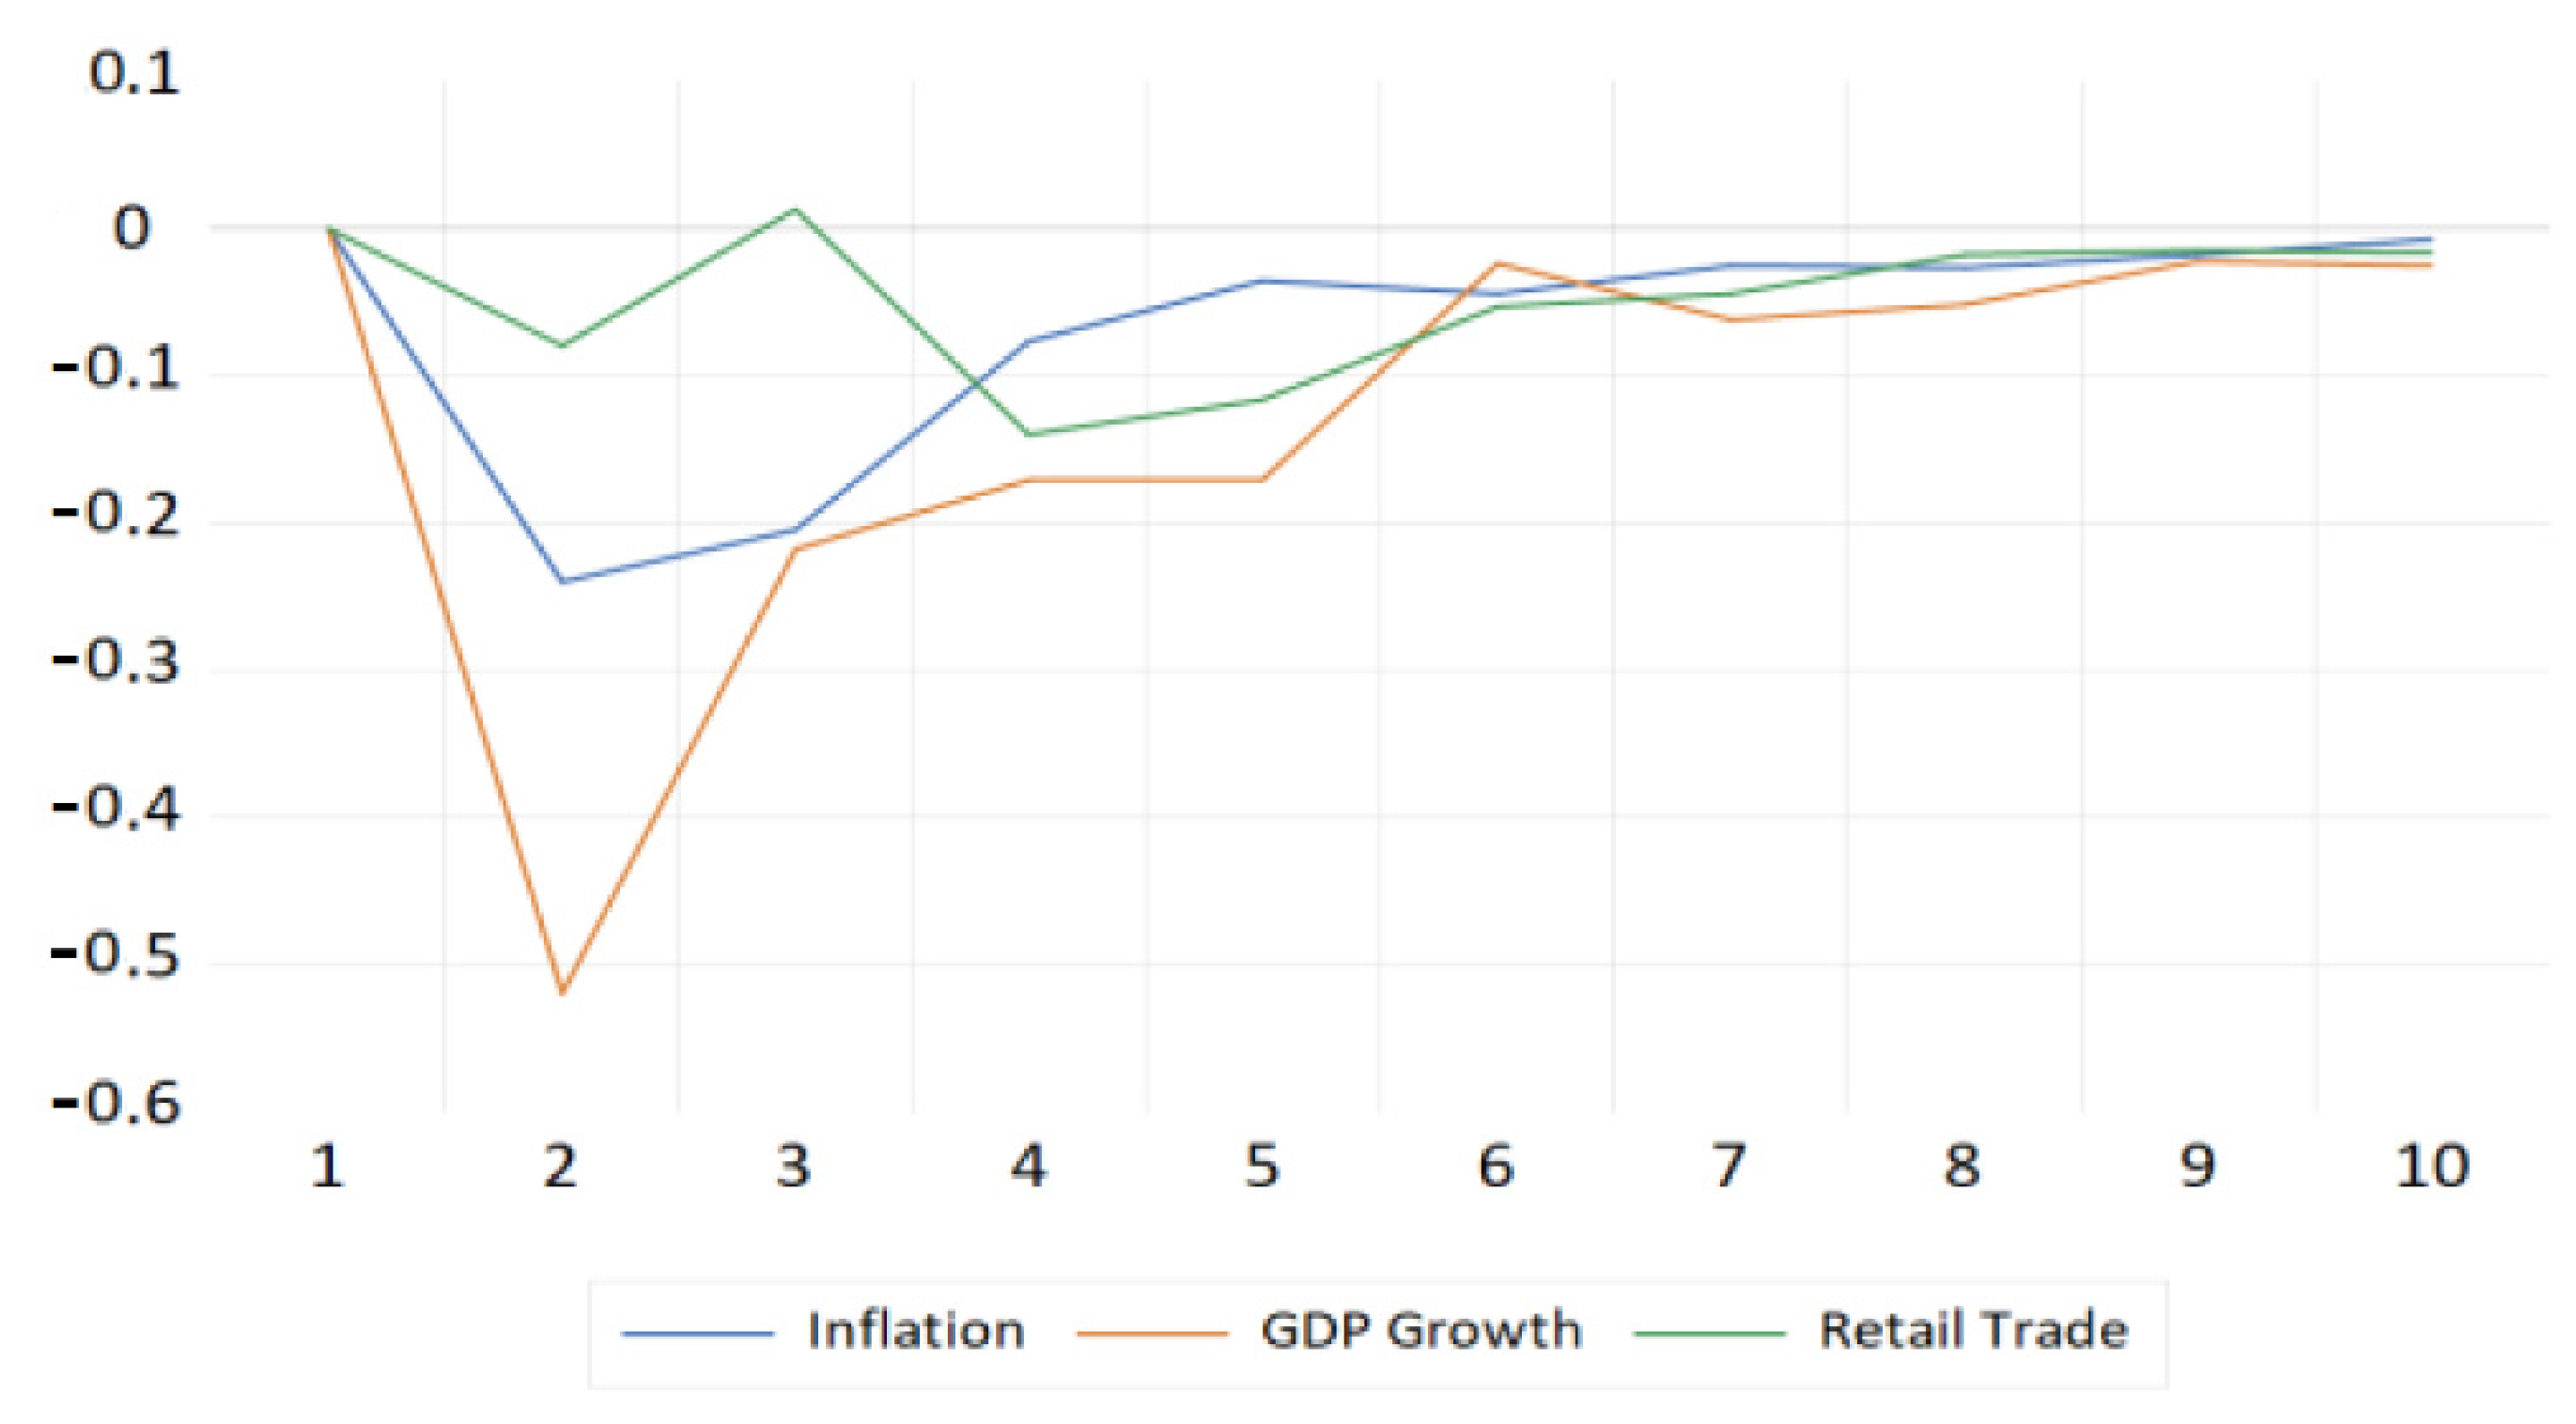
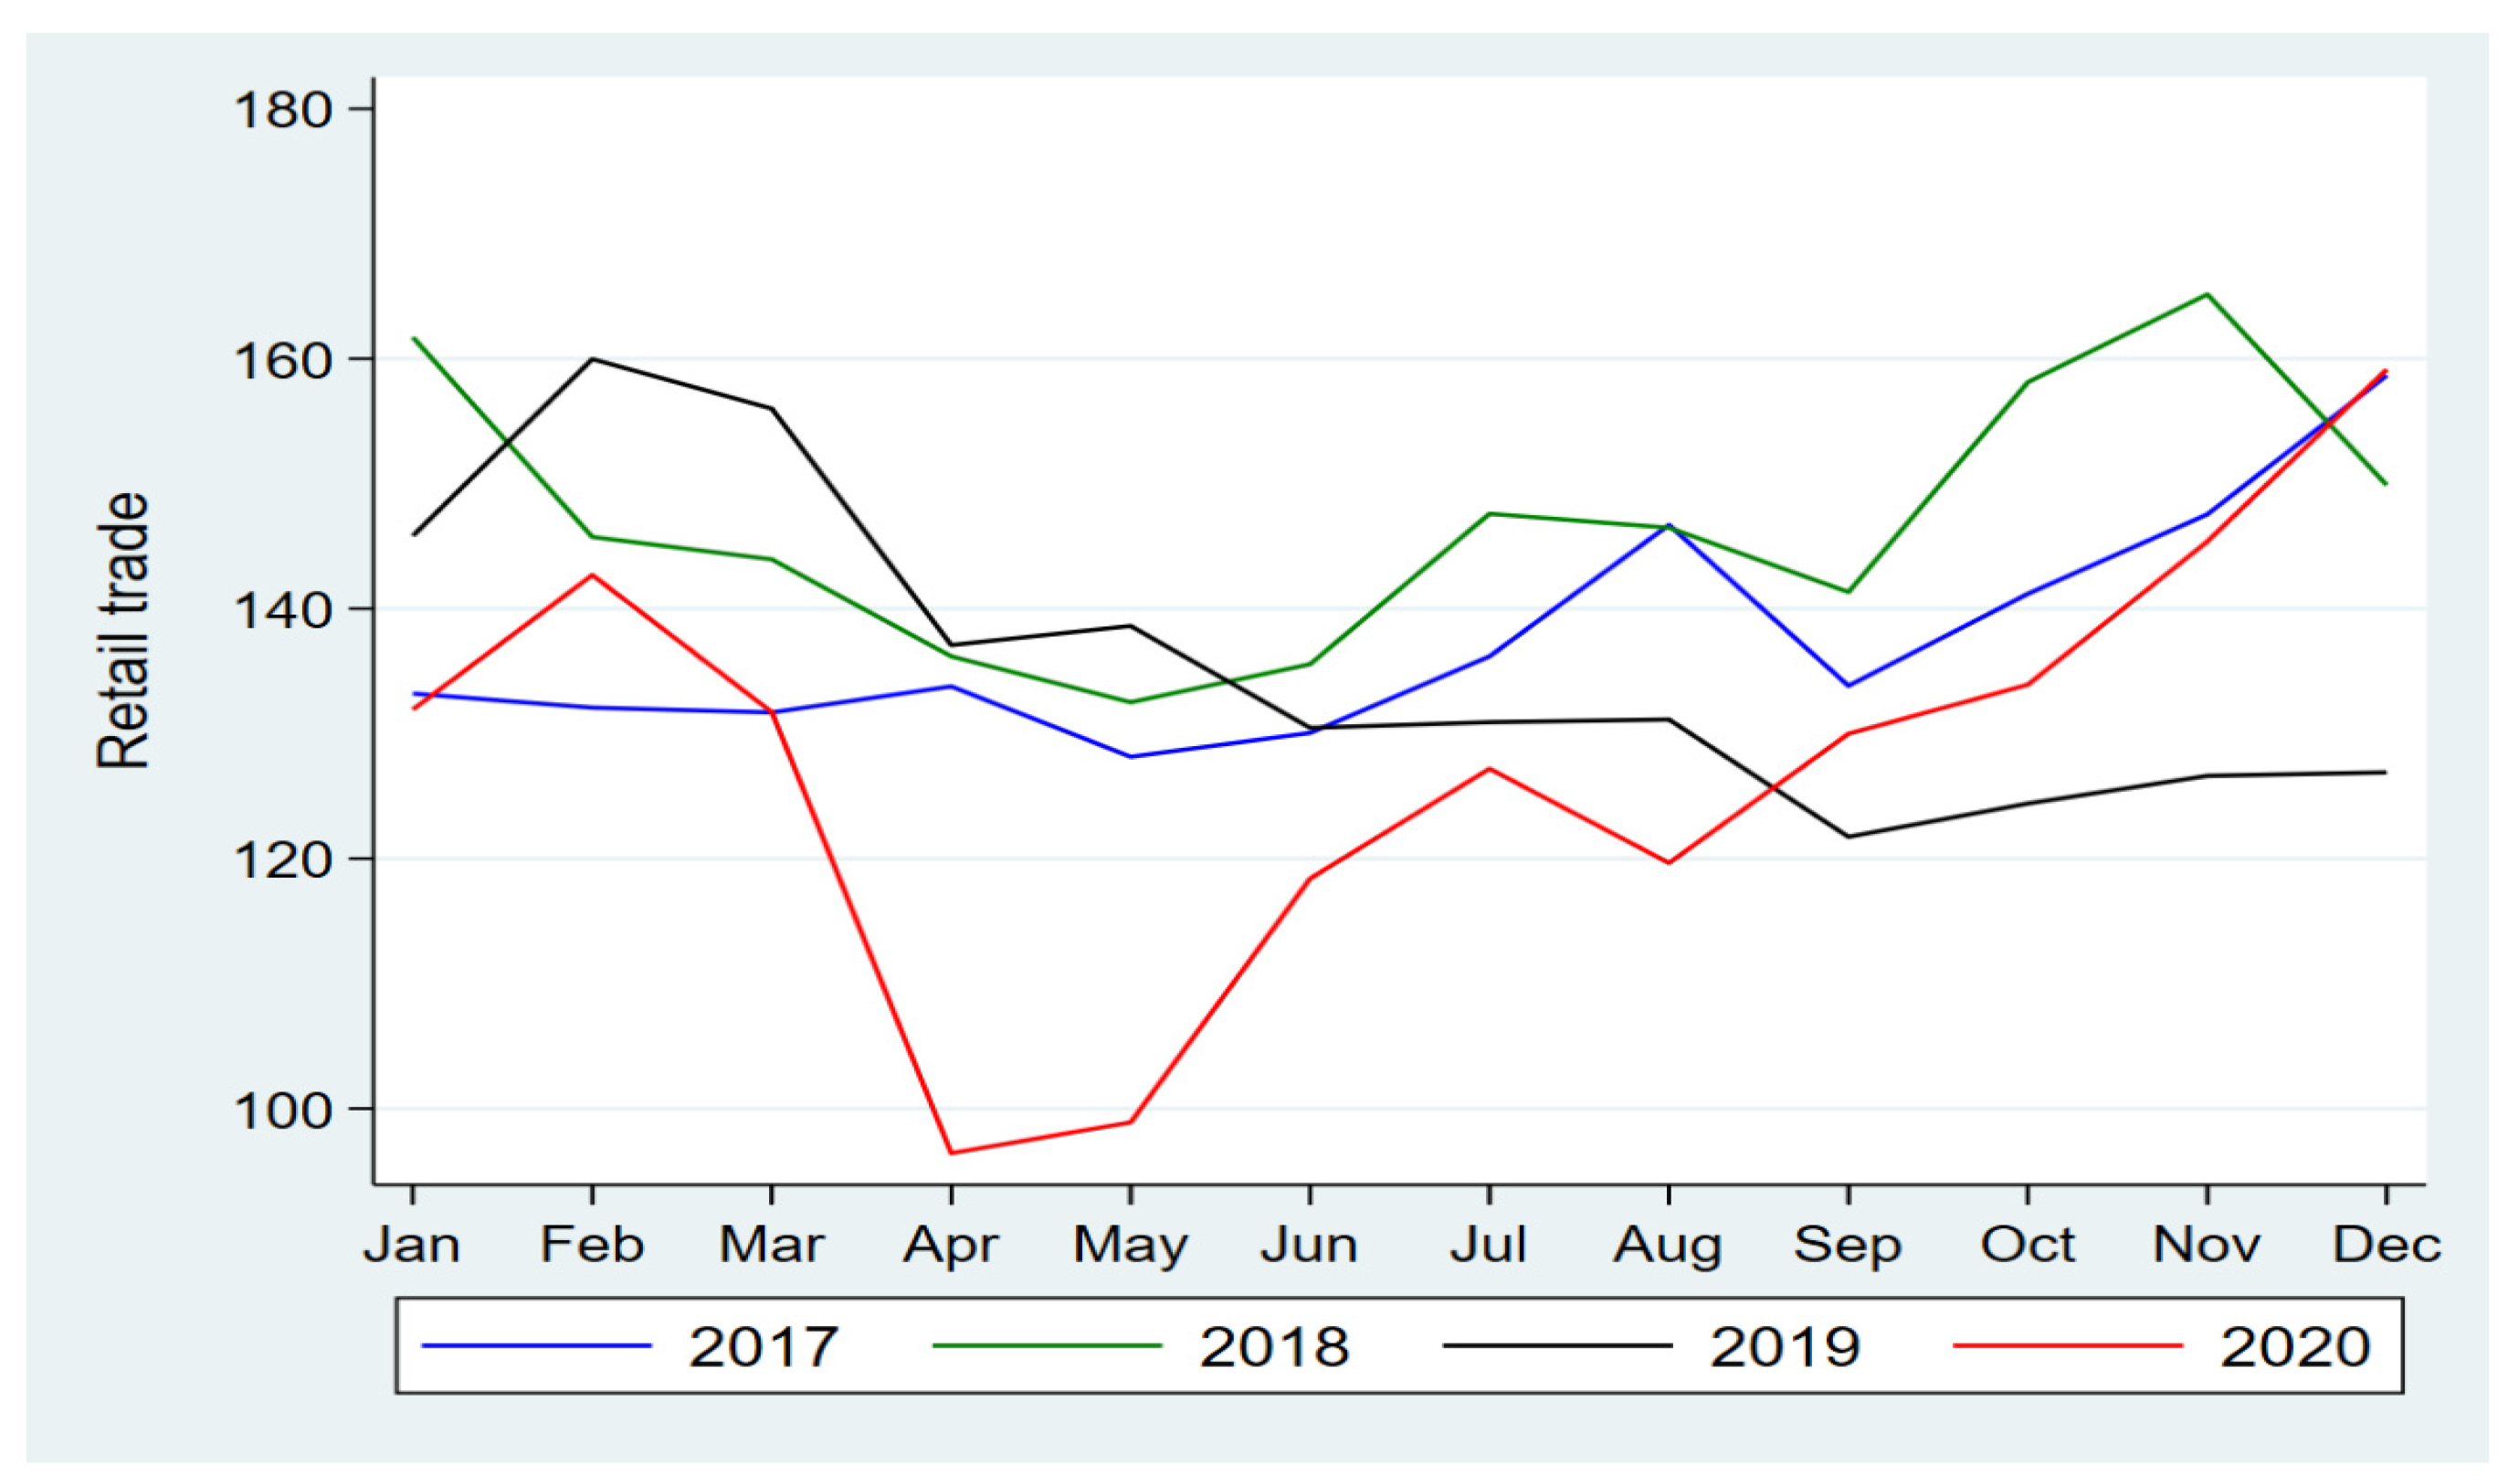
4.2.1. Retail Trade
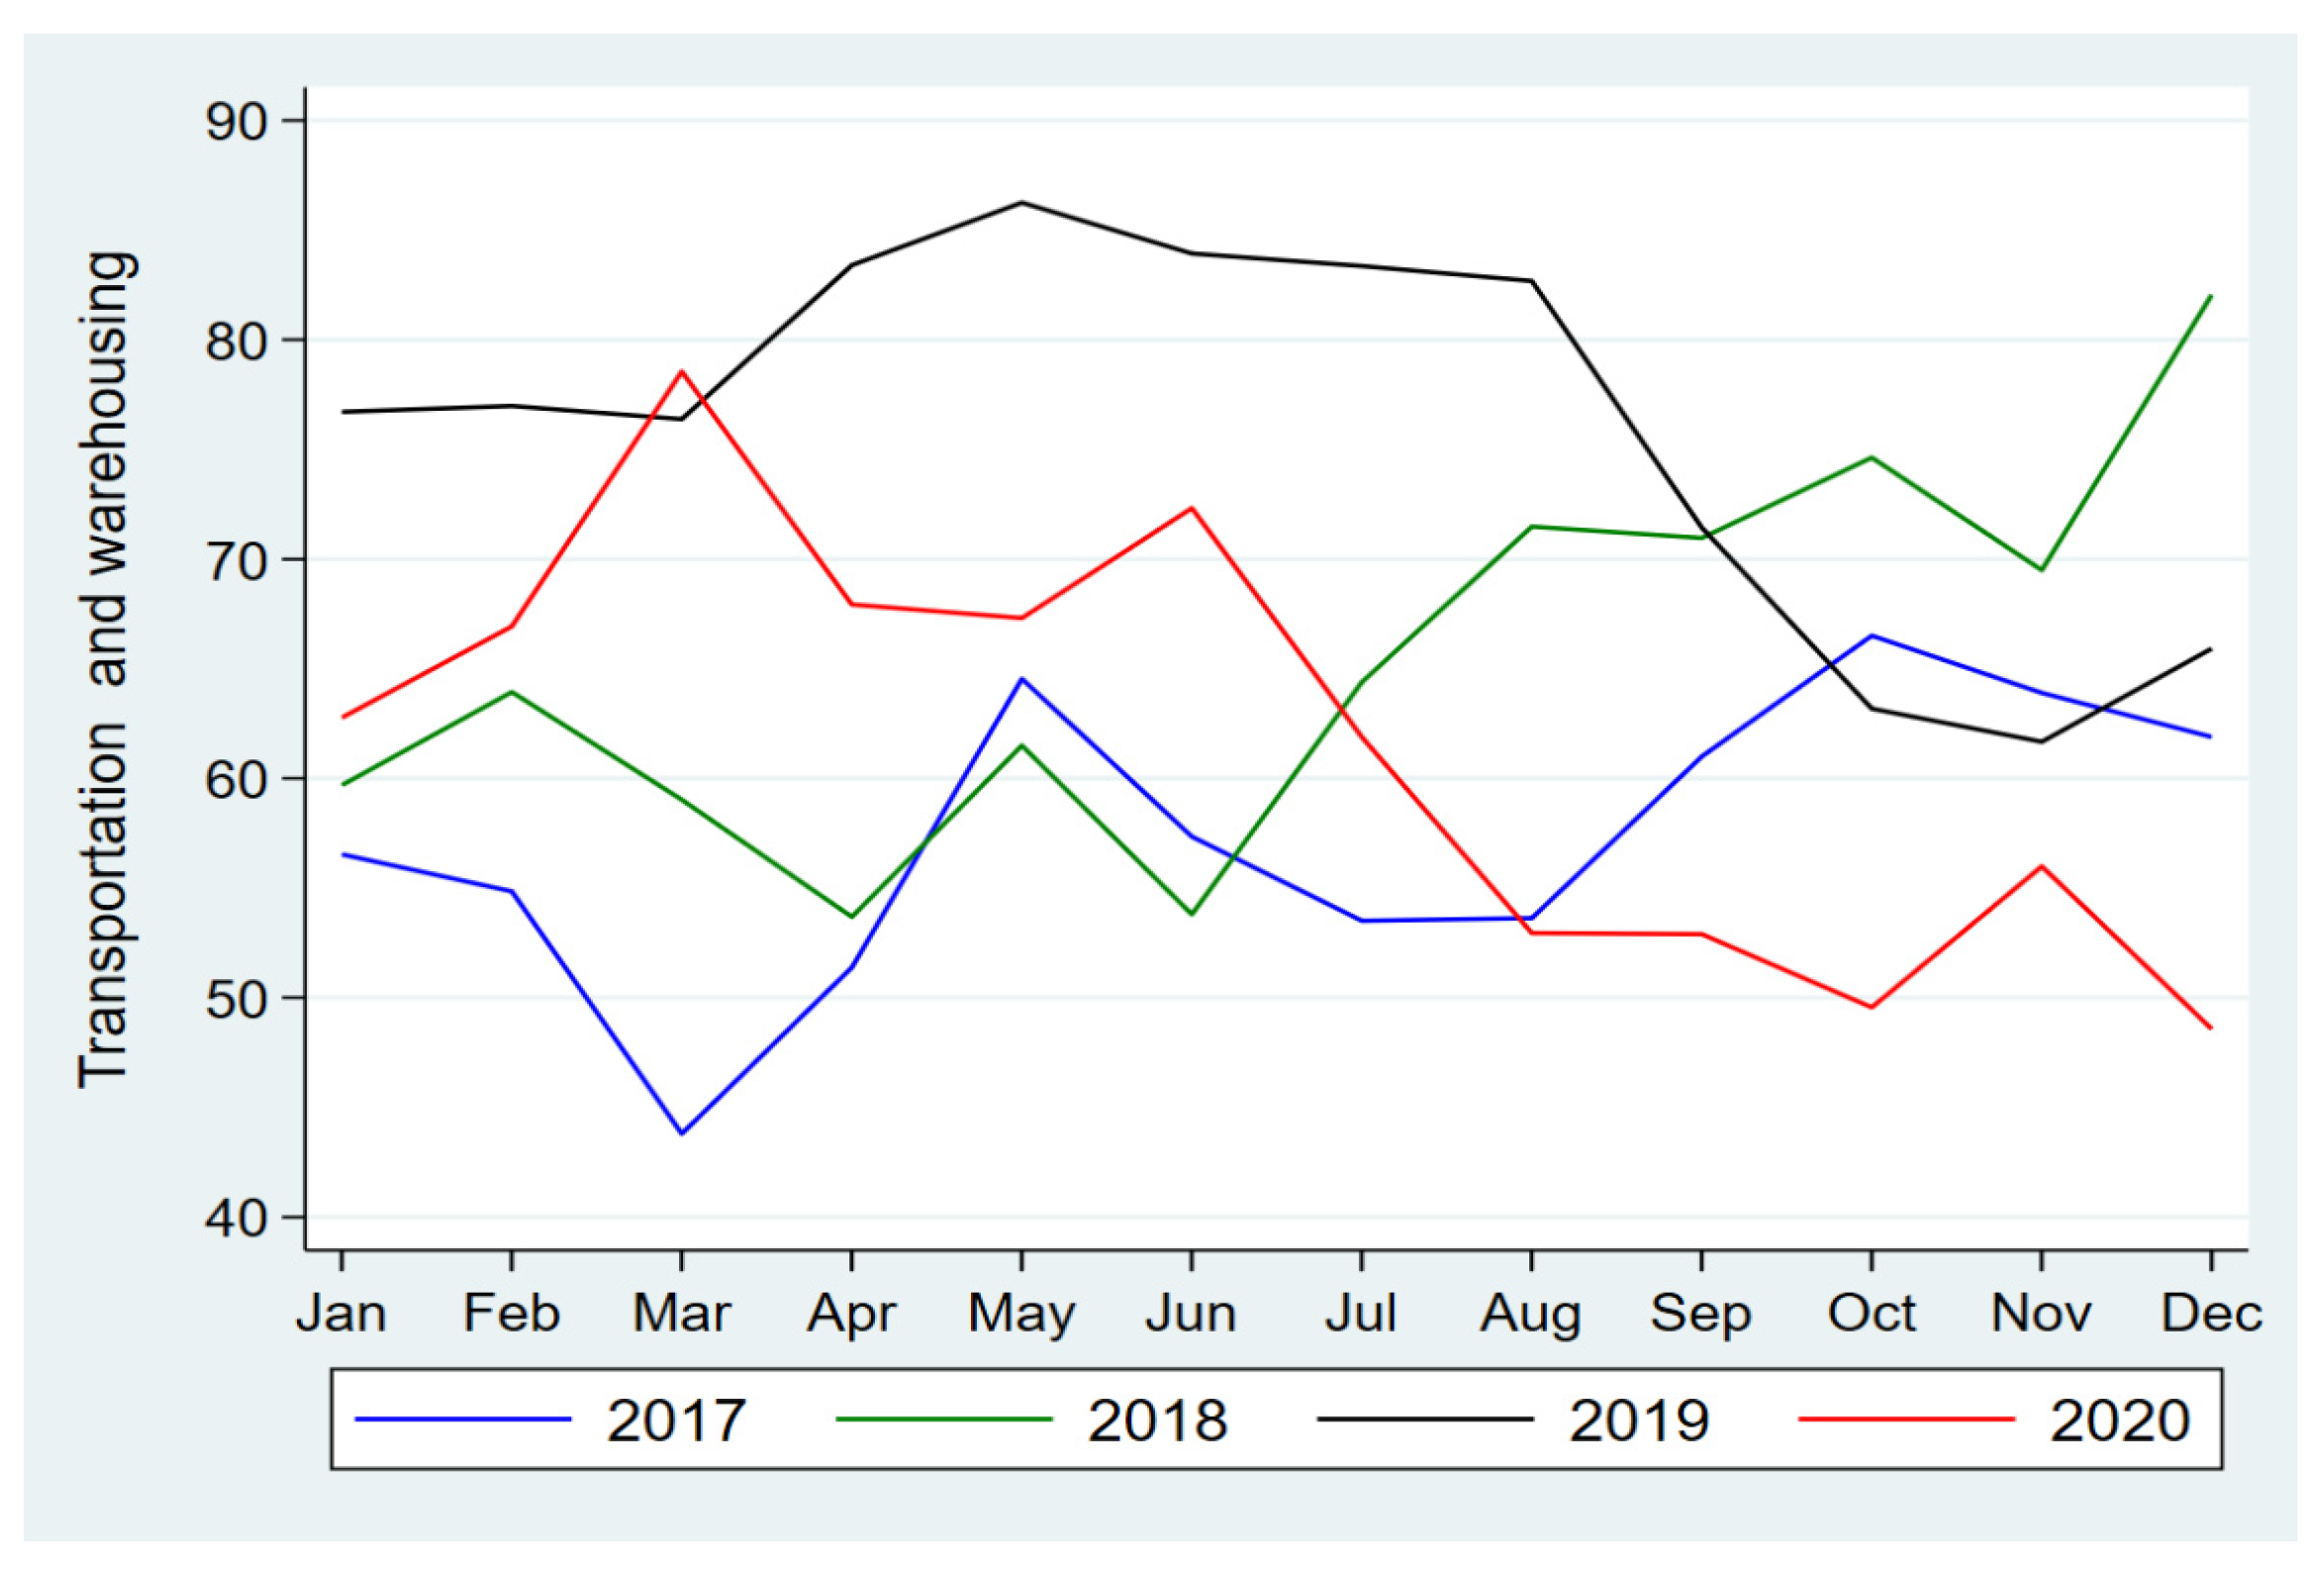
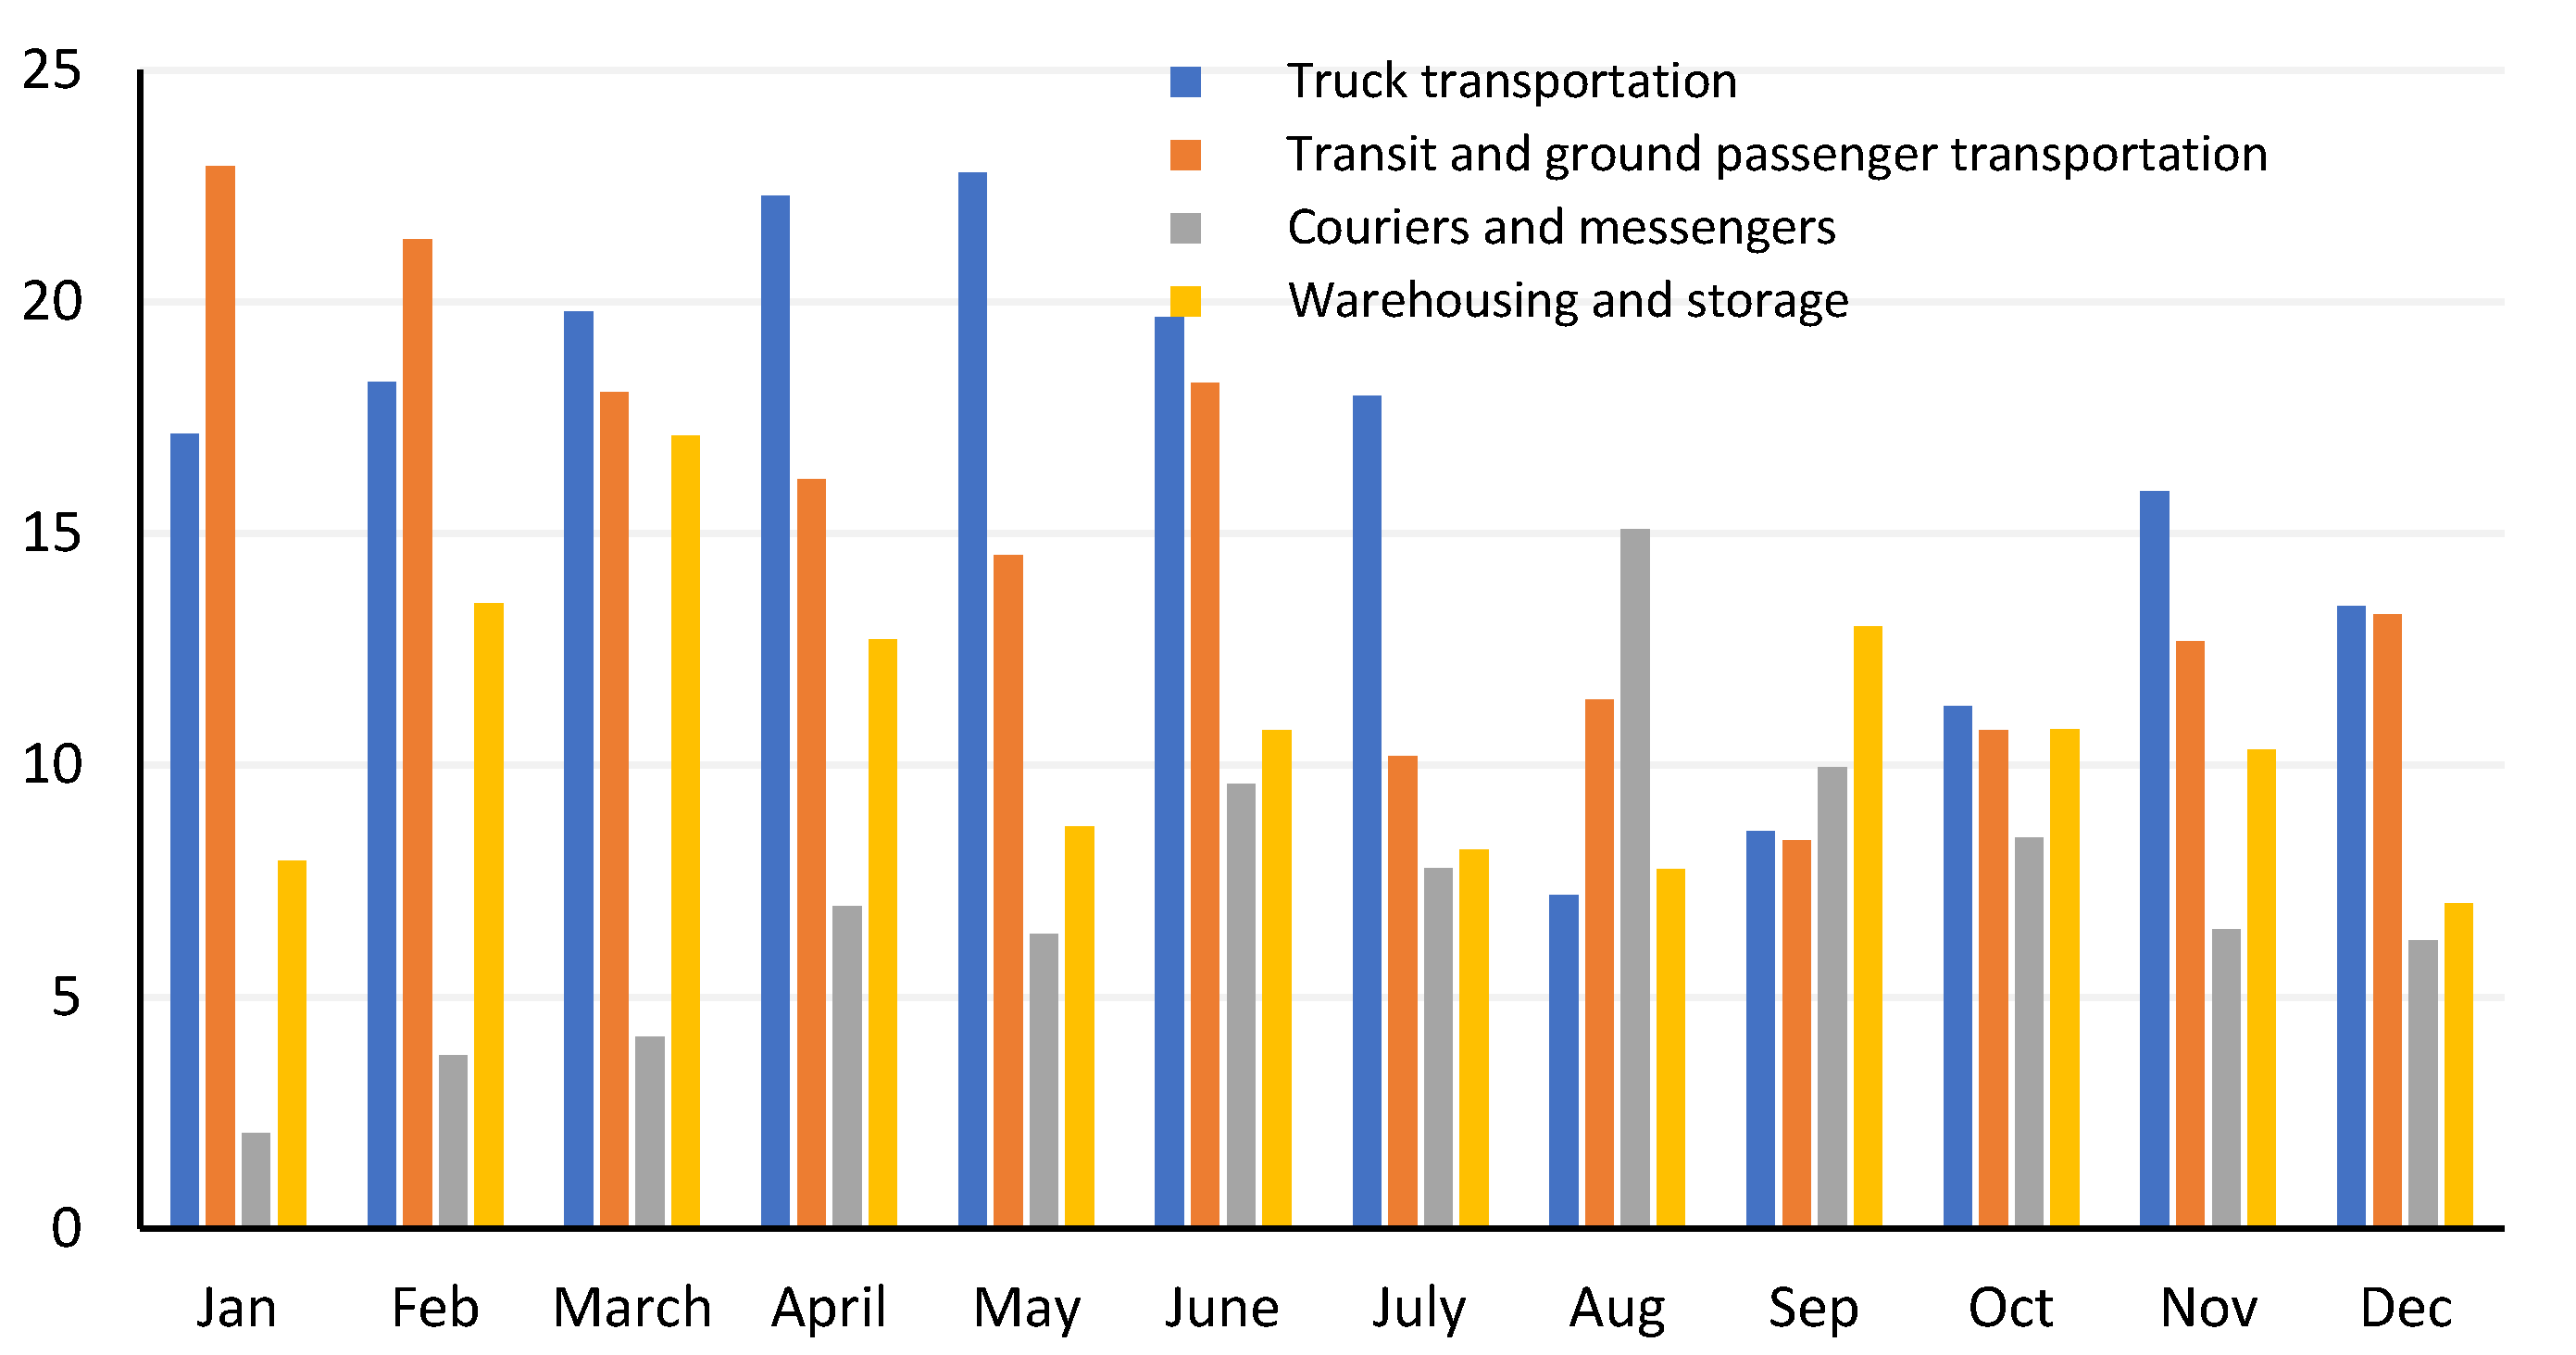
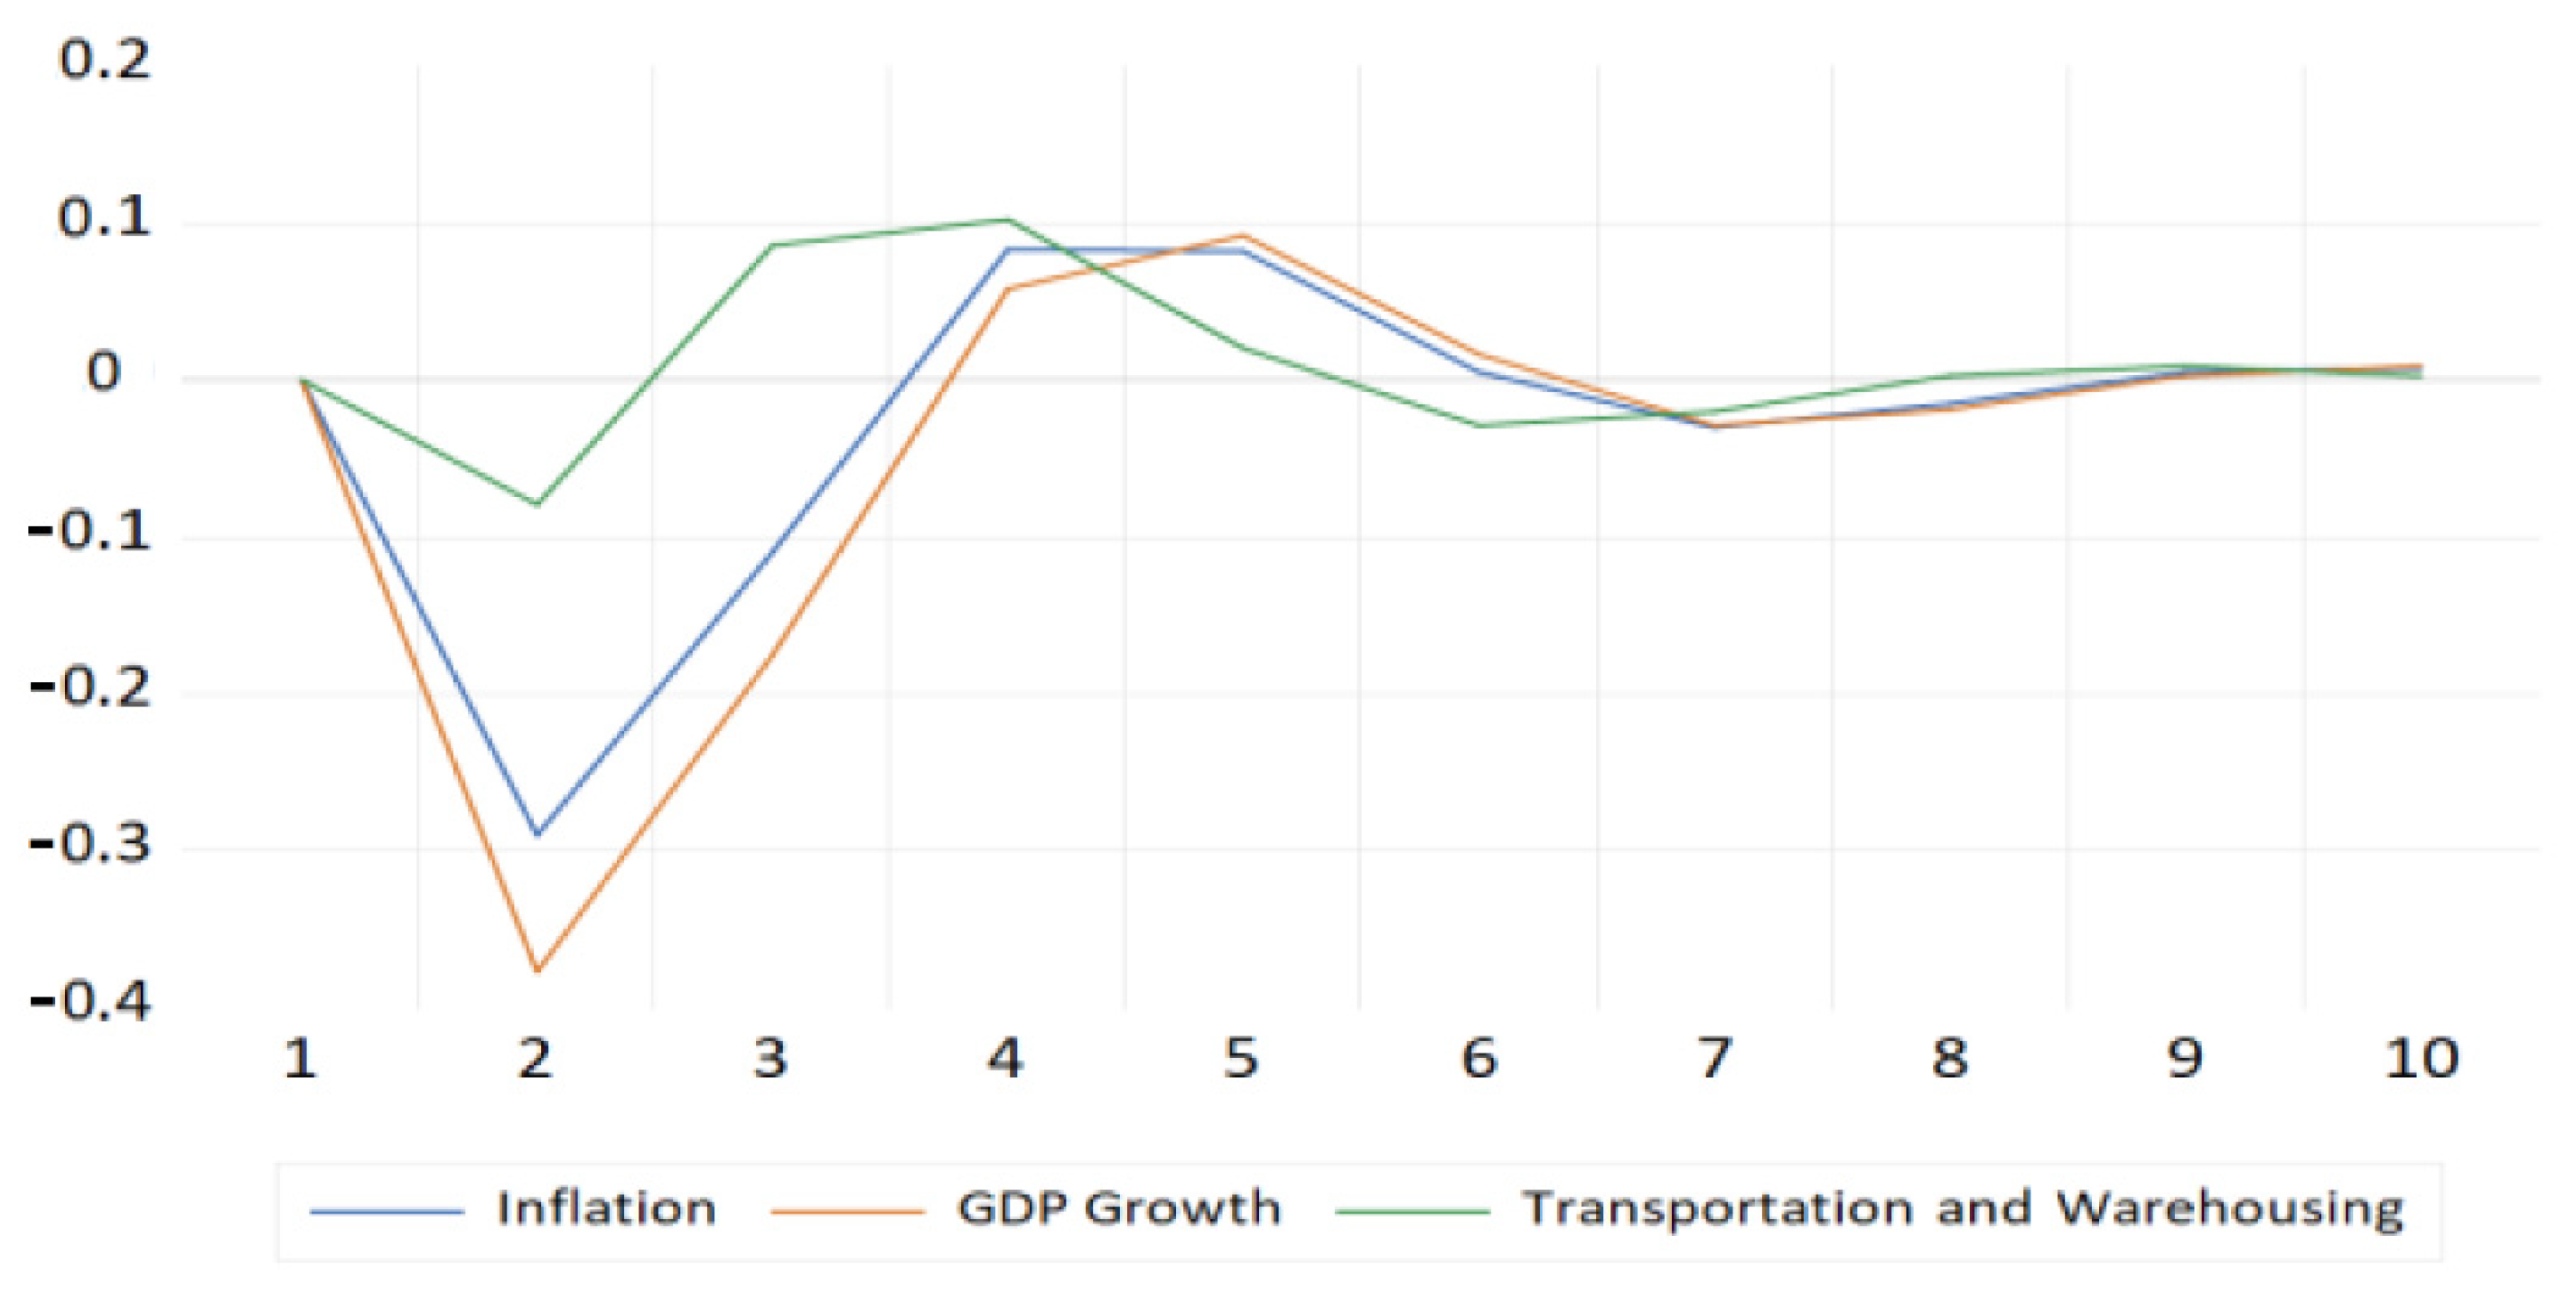
4.2.2. Transportation and Warehousing
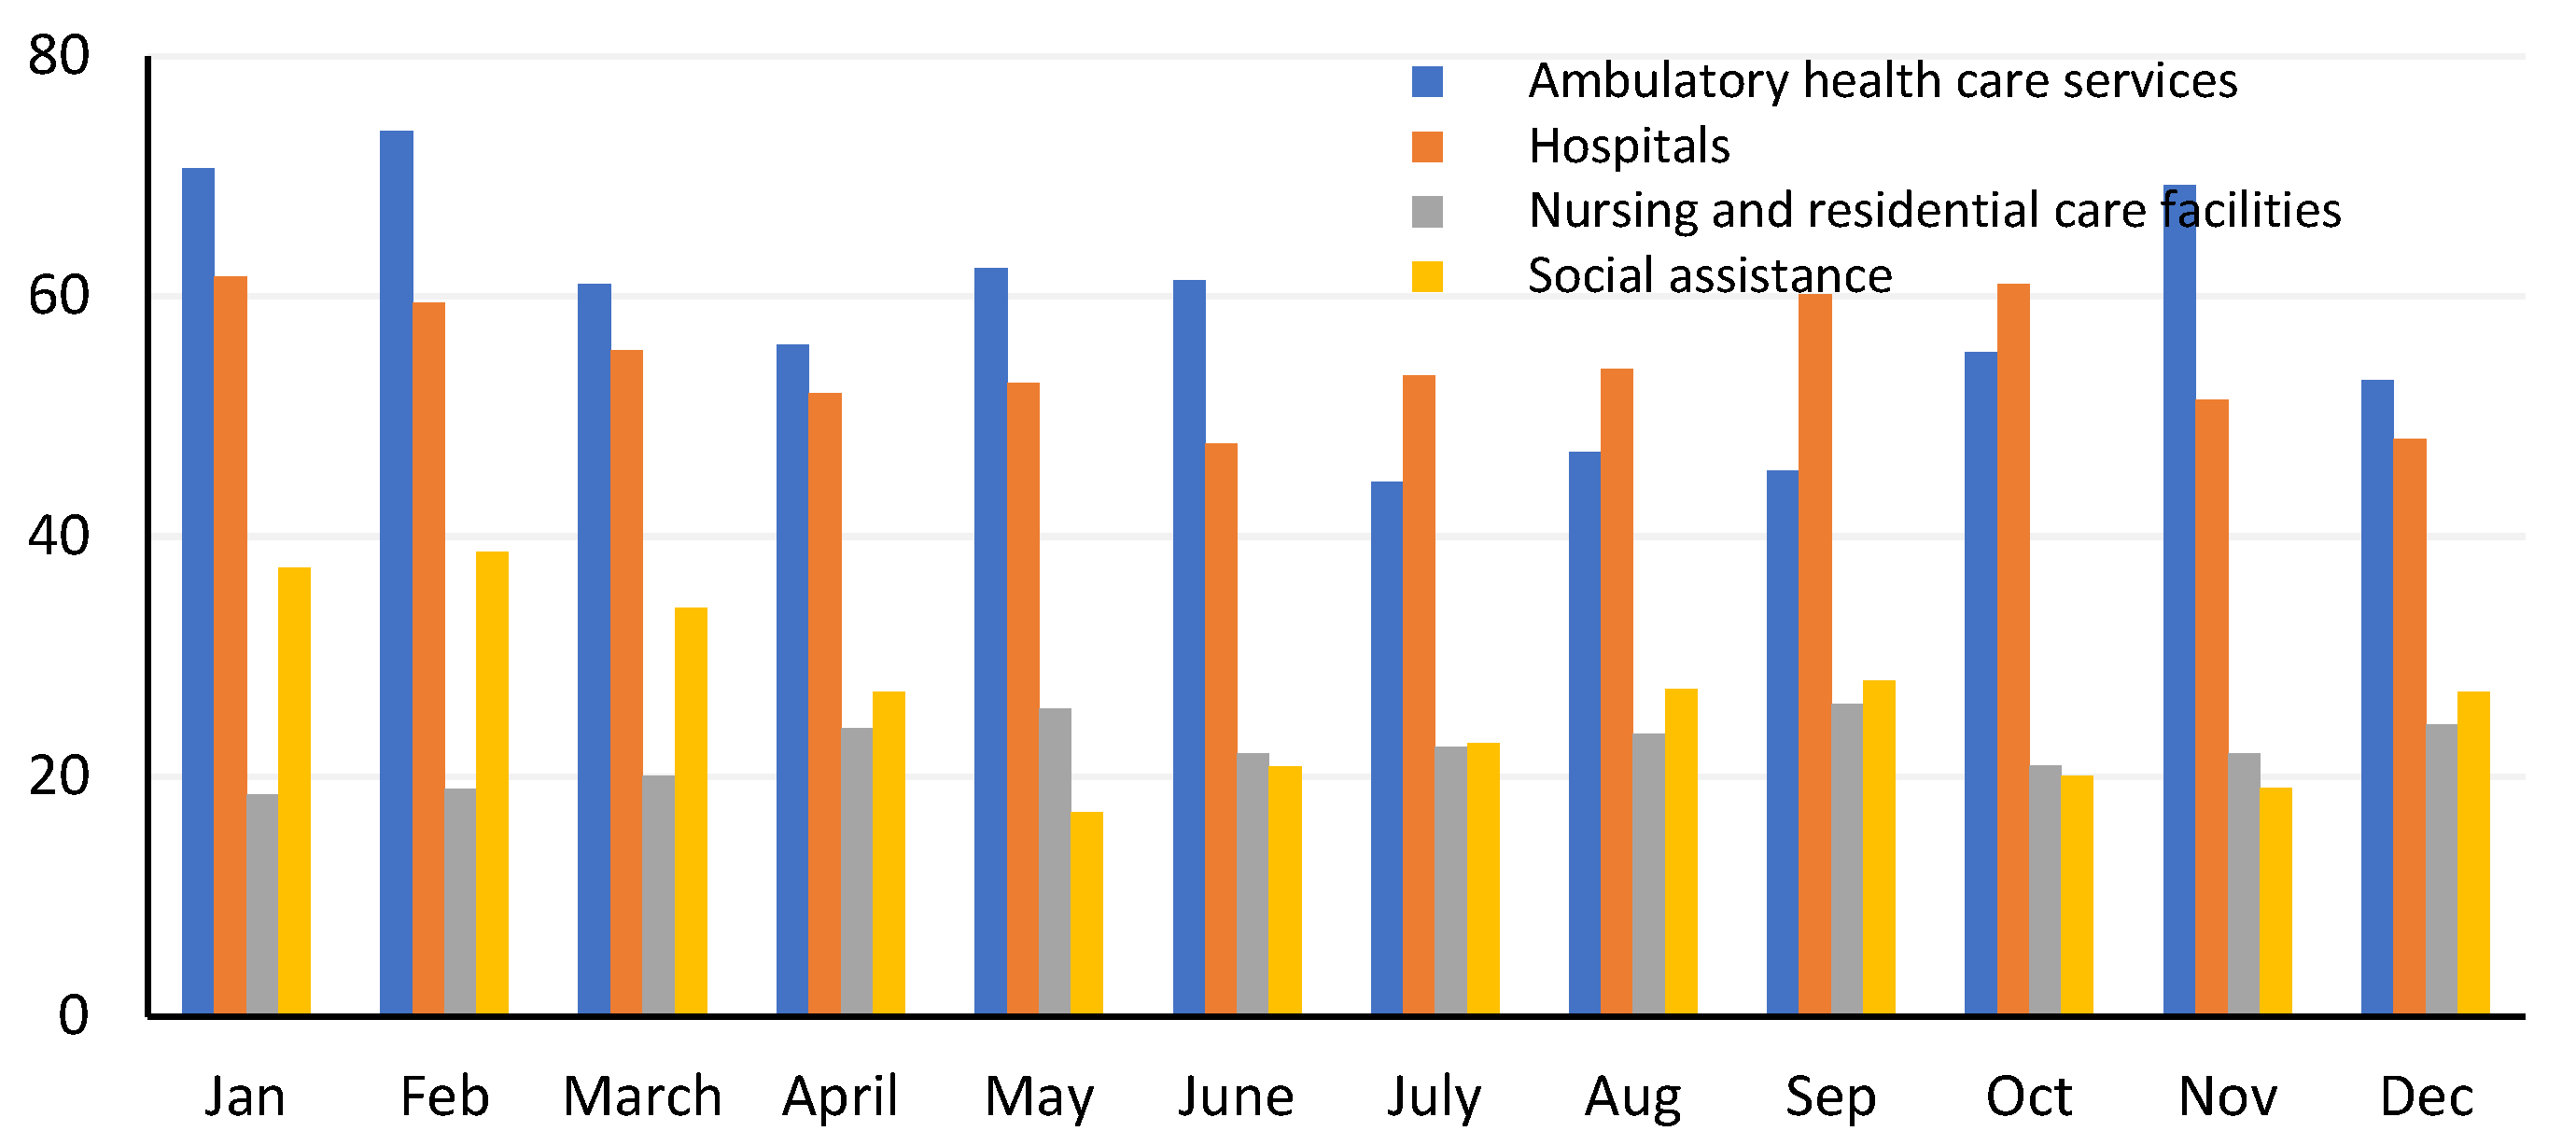
4.2.3. Healthcare and Social Assistance
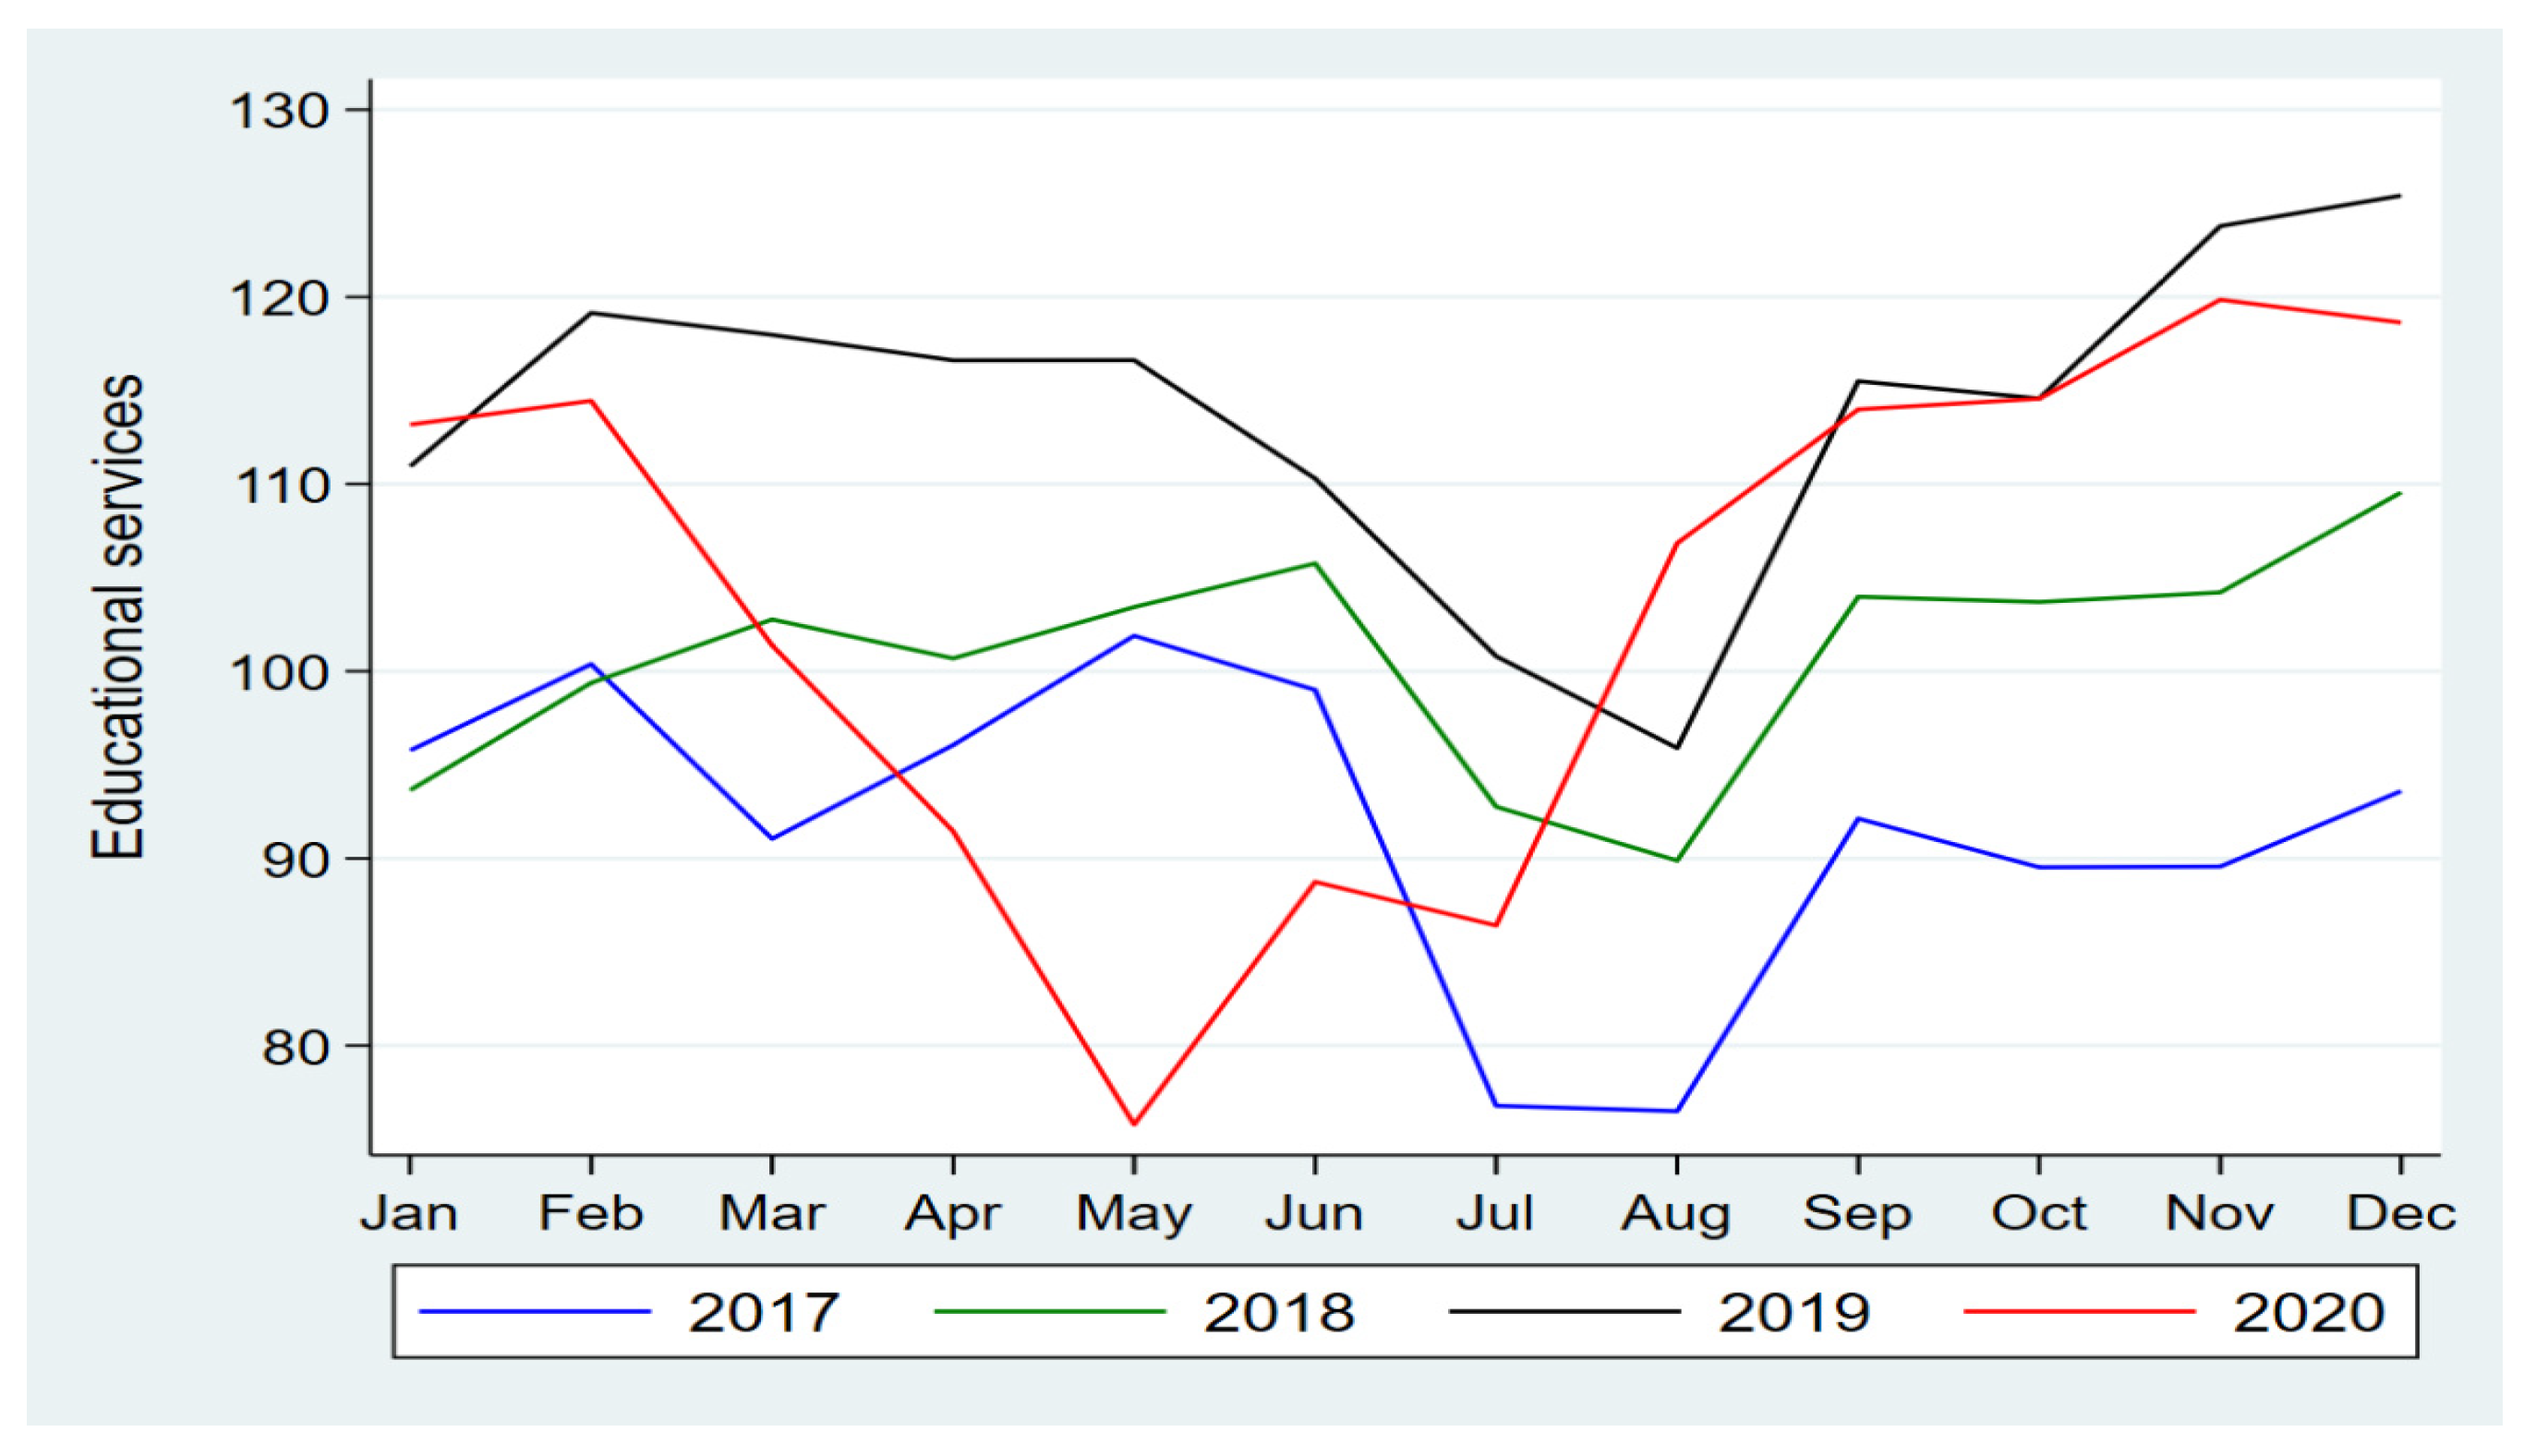
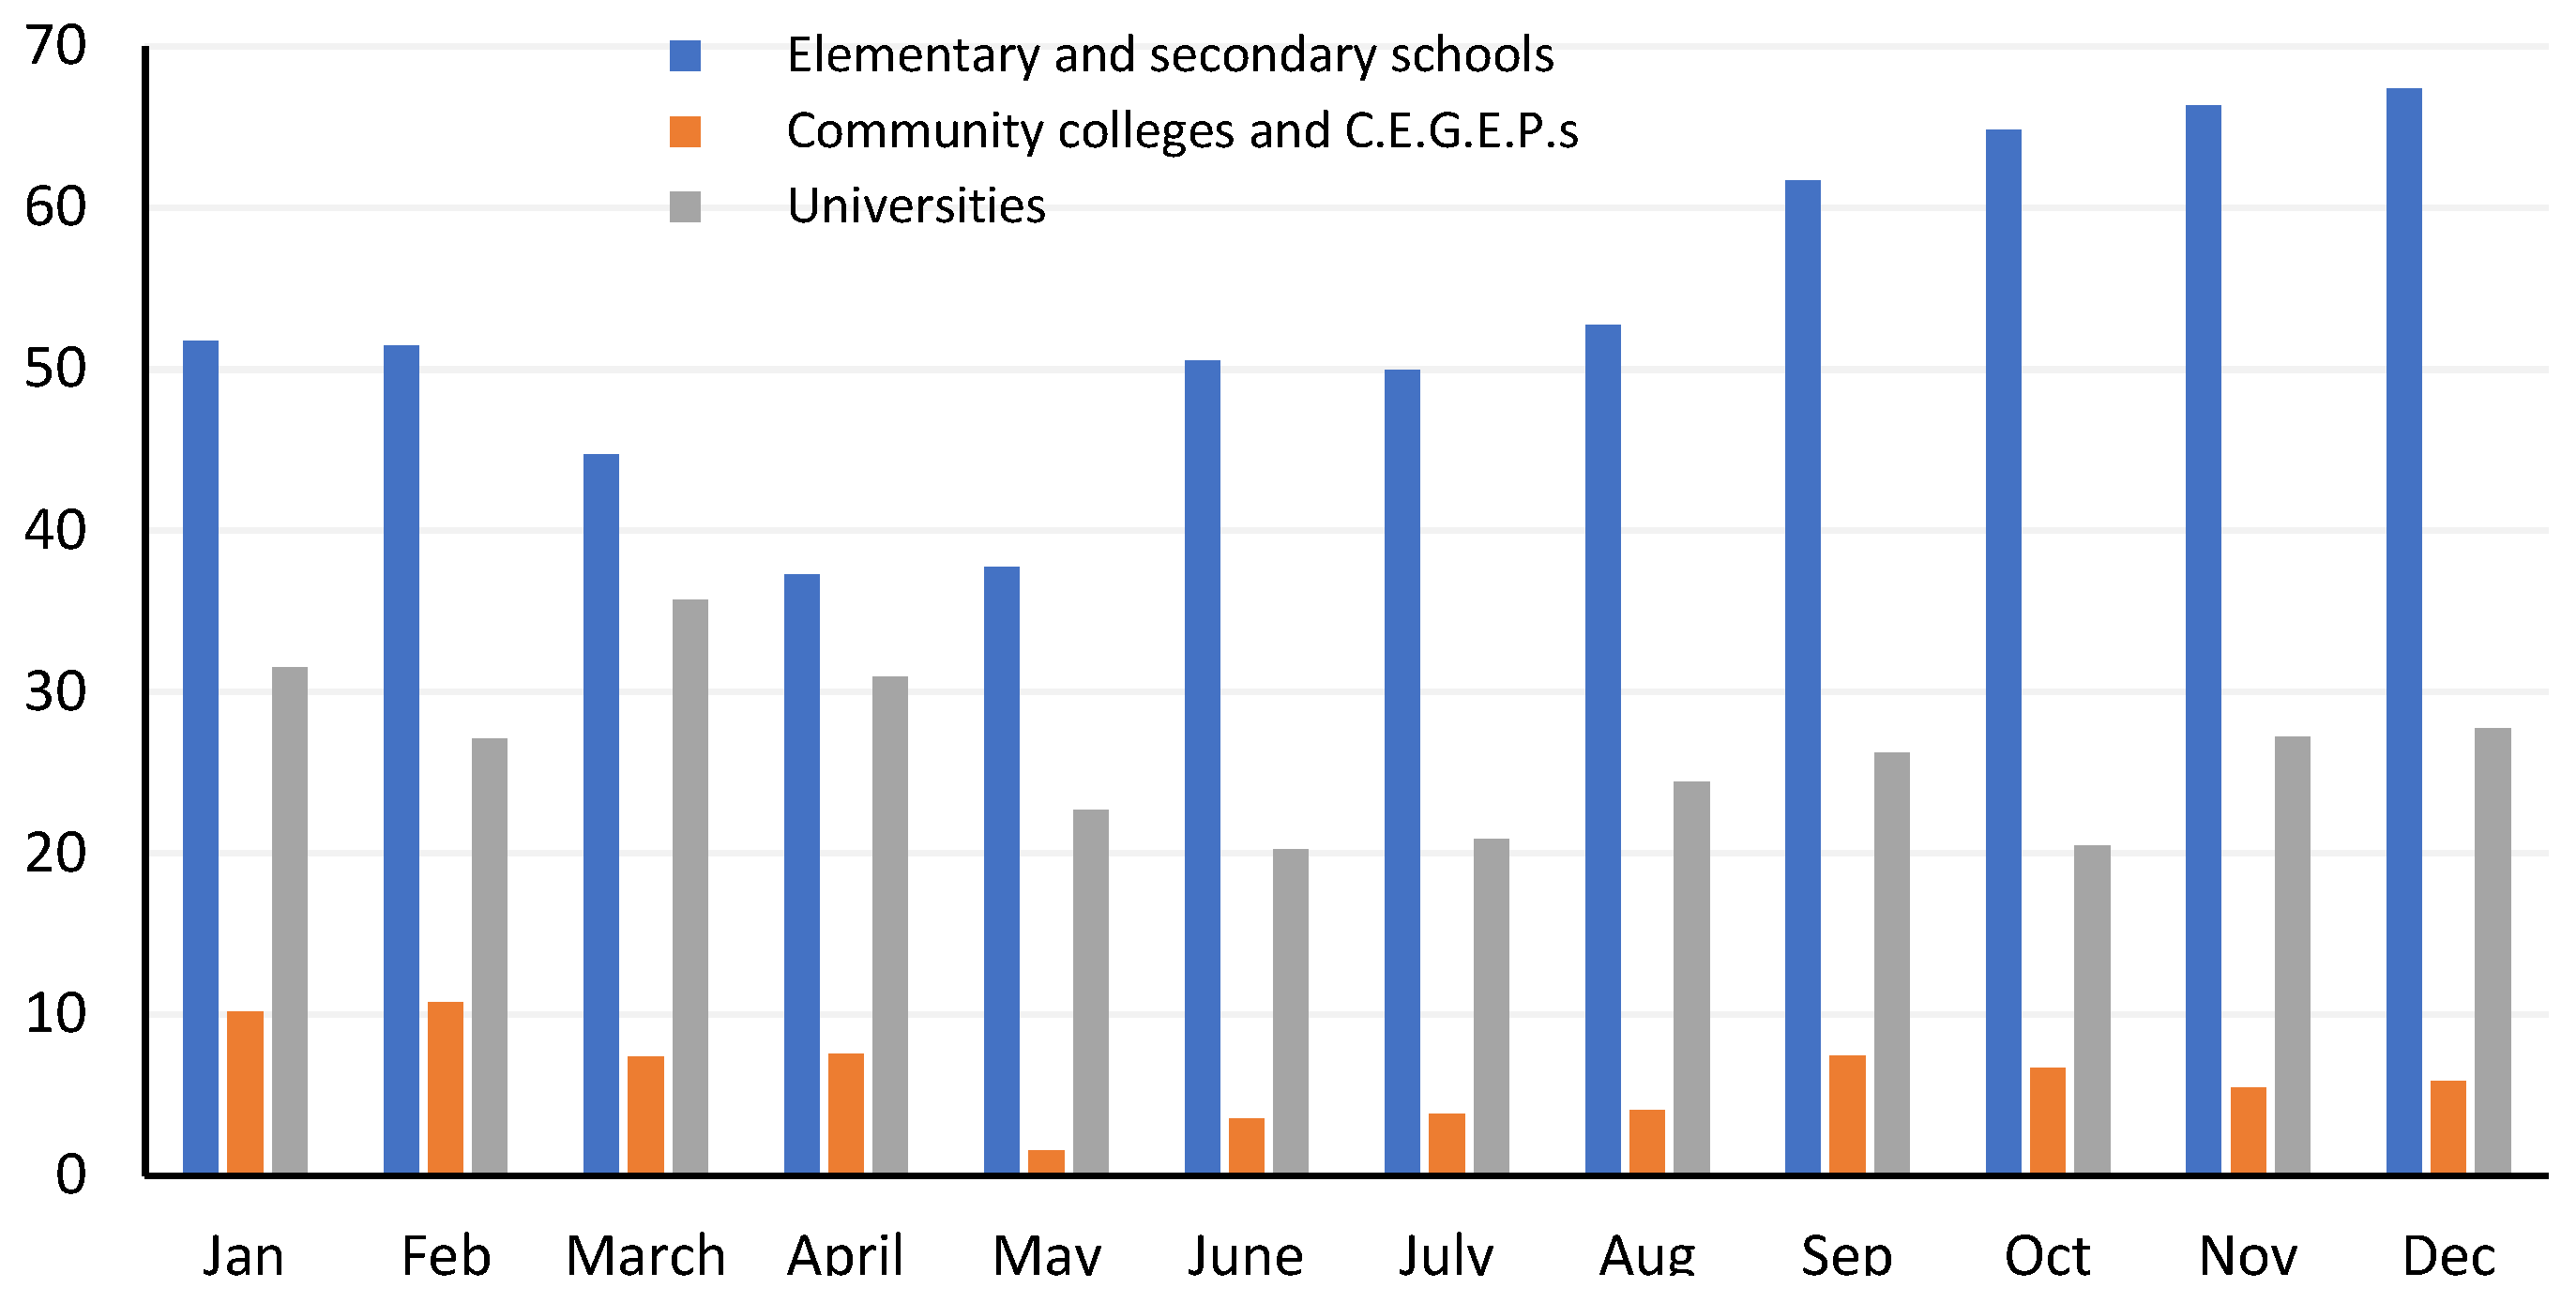
4.2.4. Educational Services
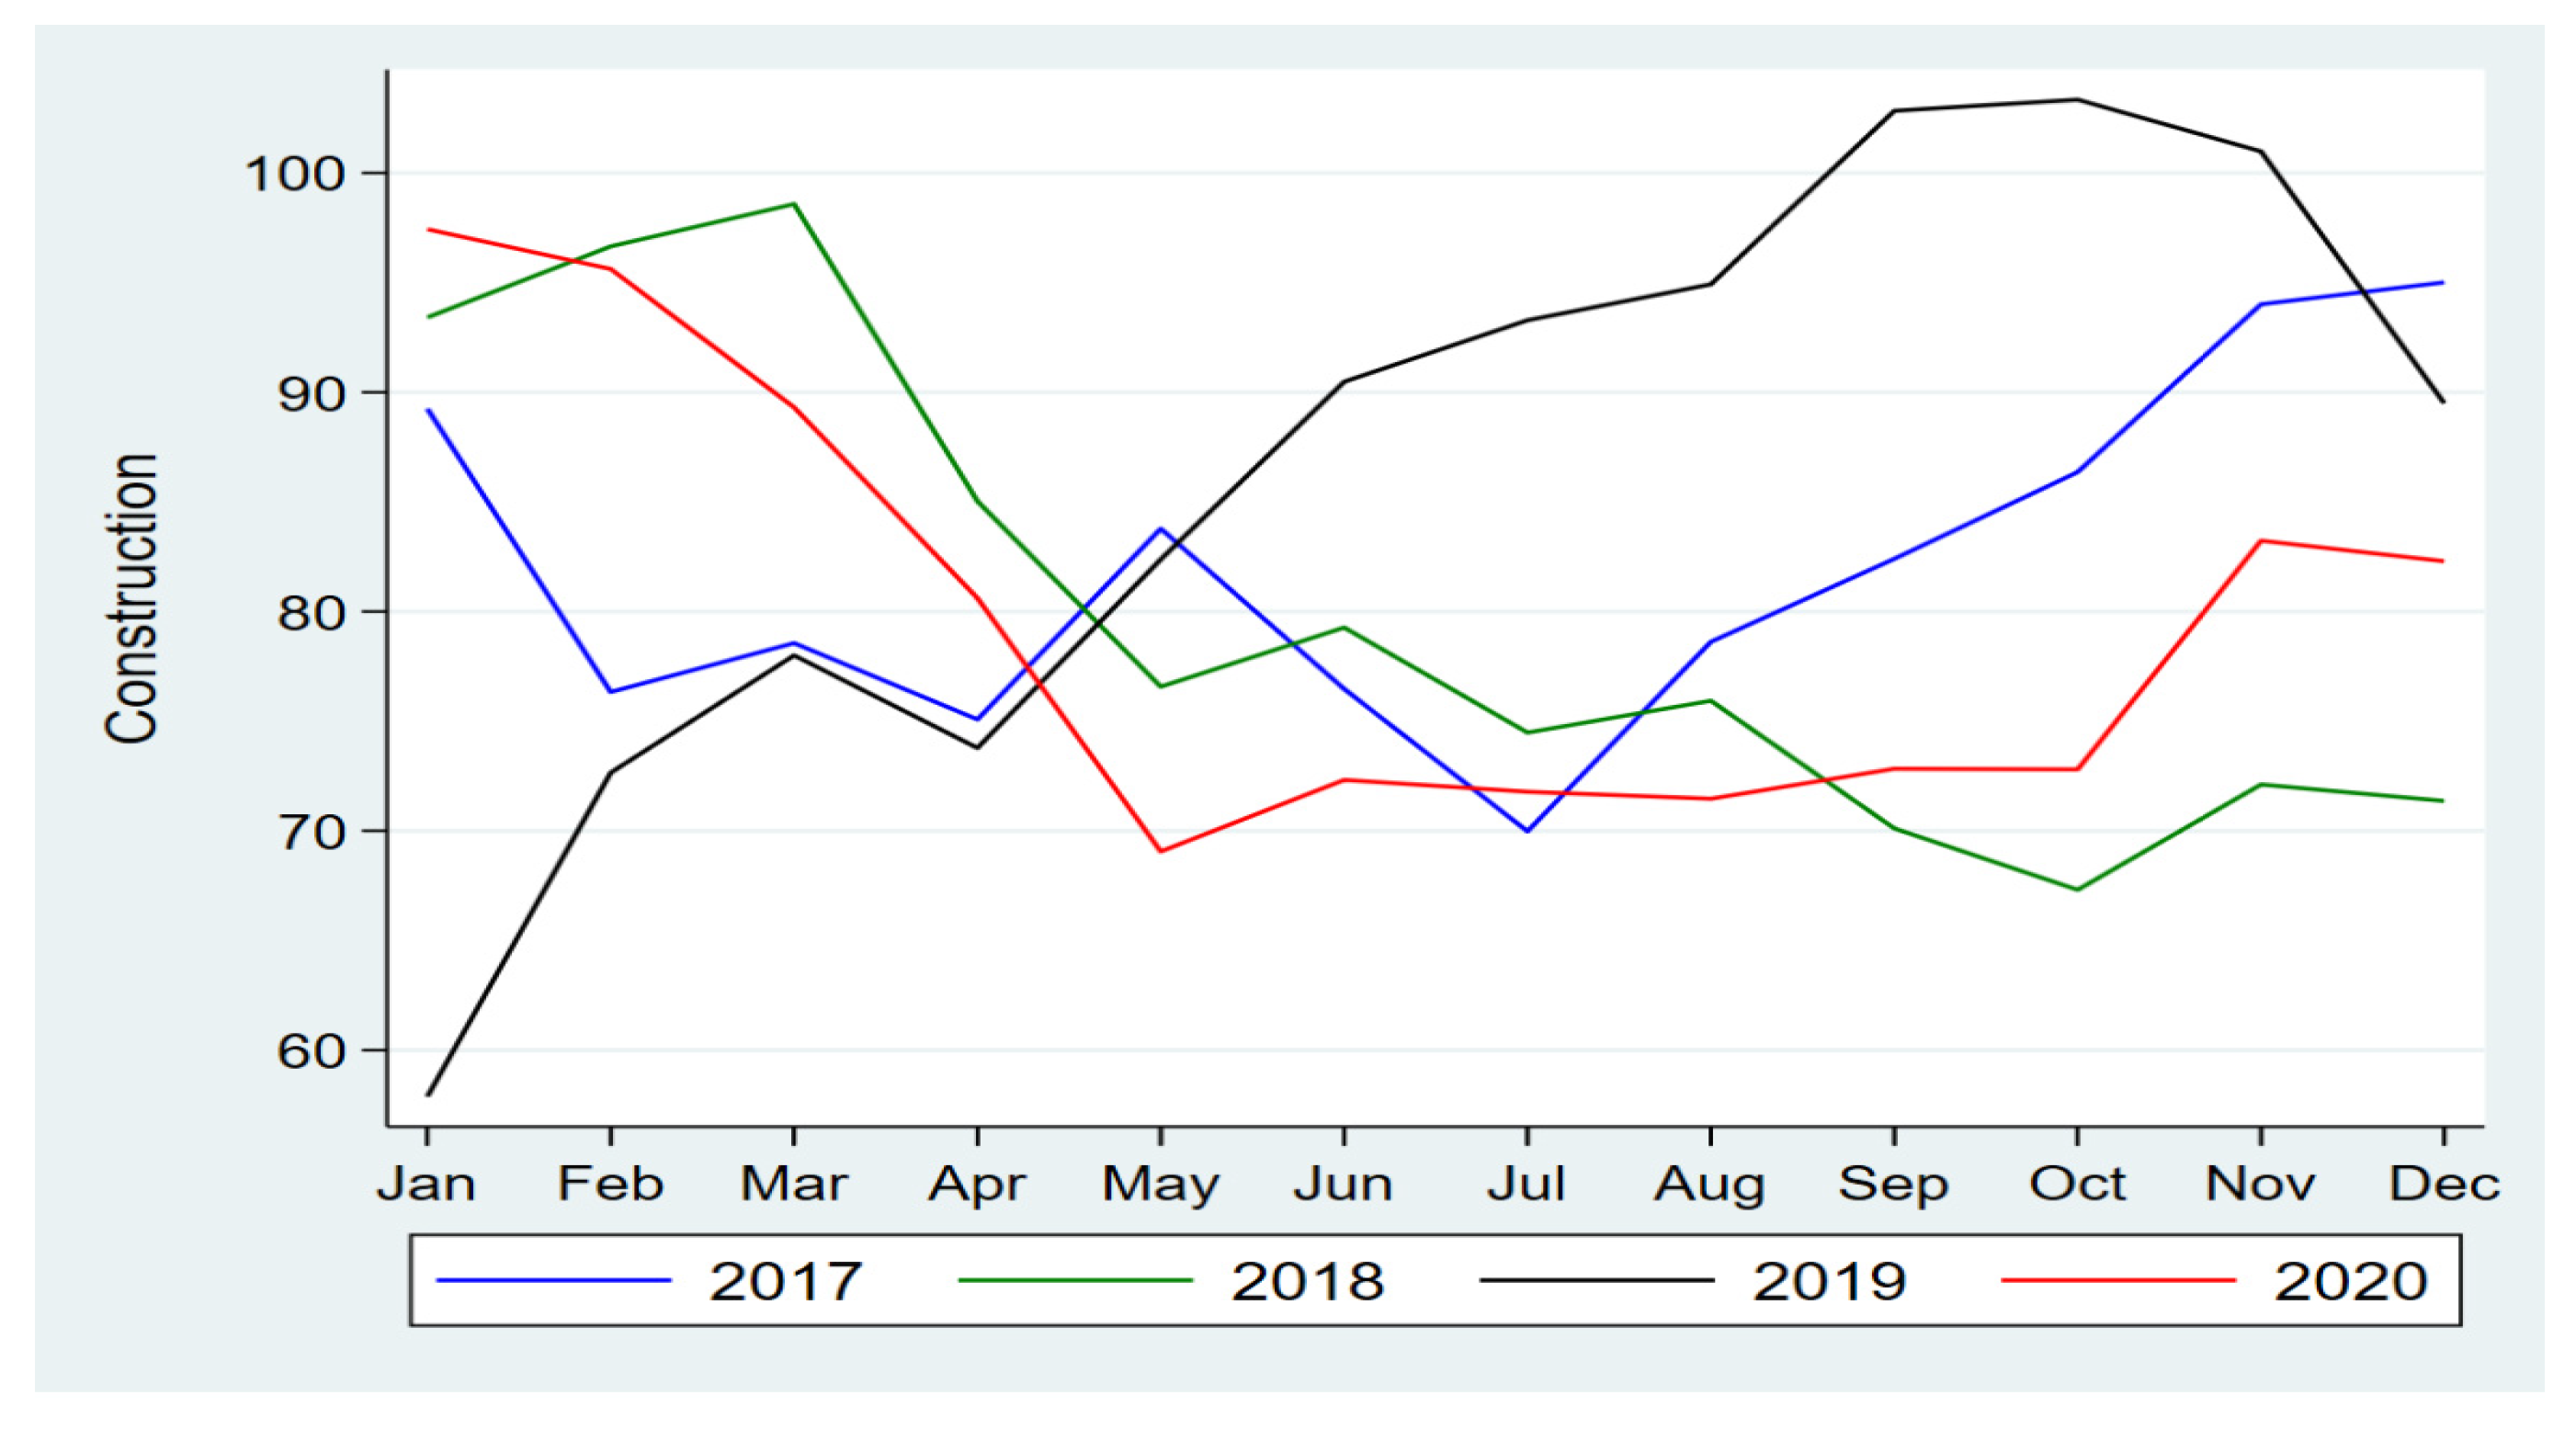
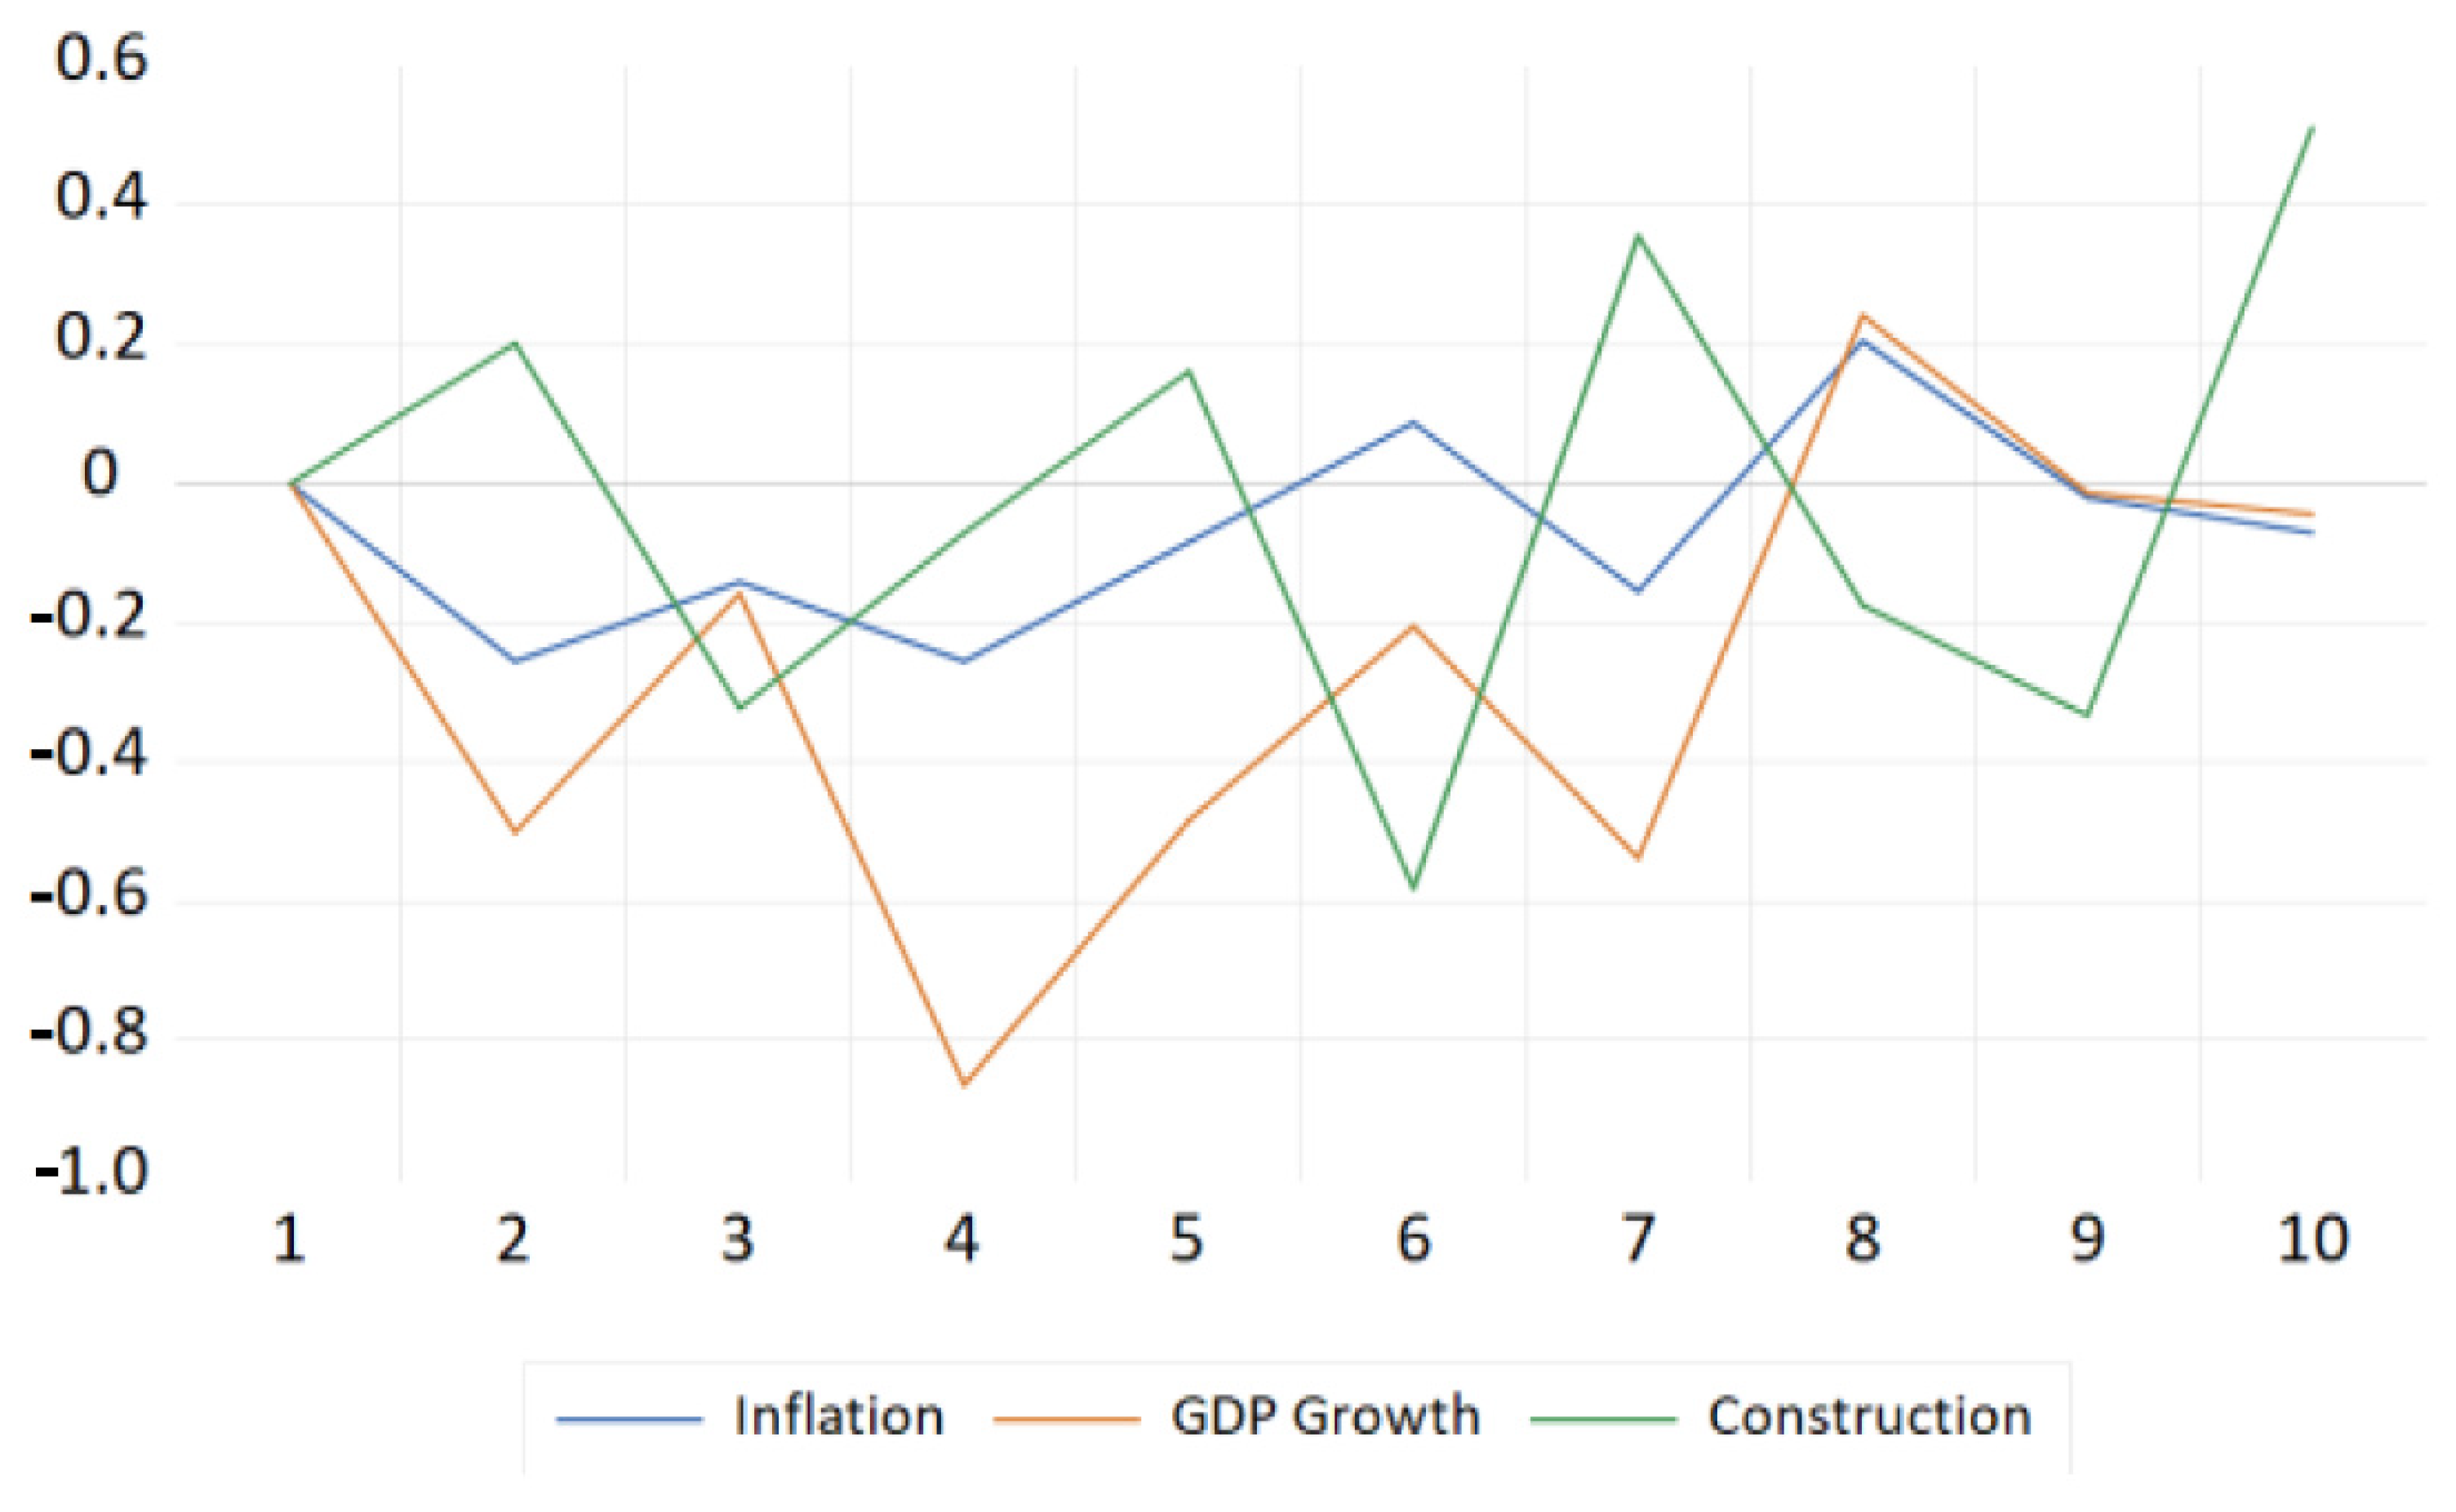
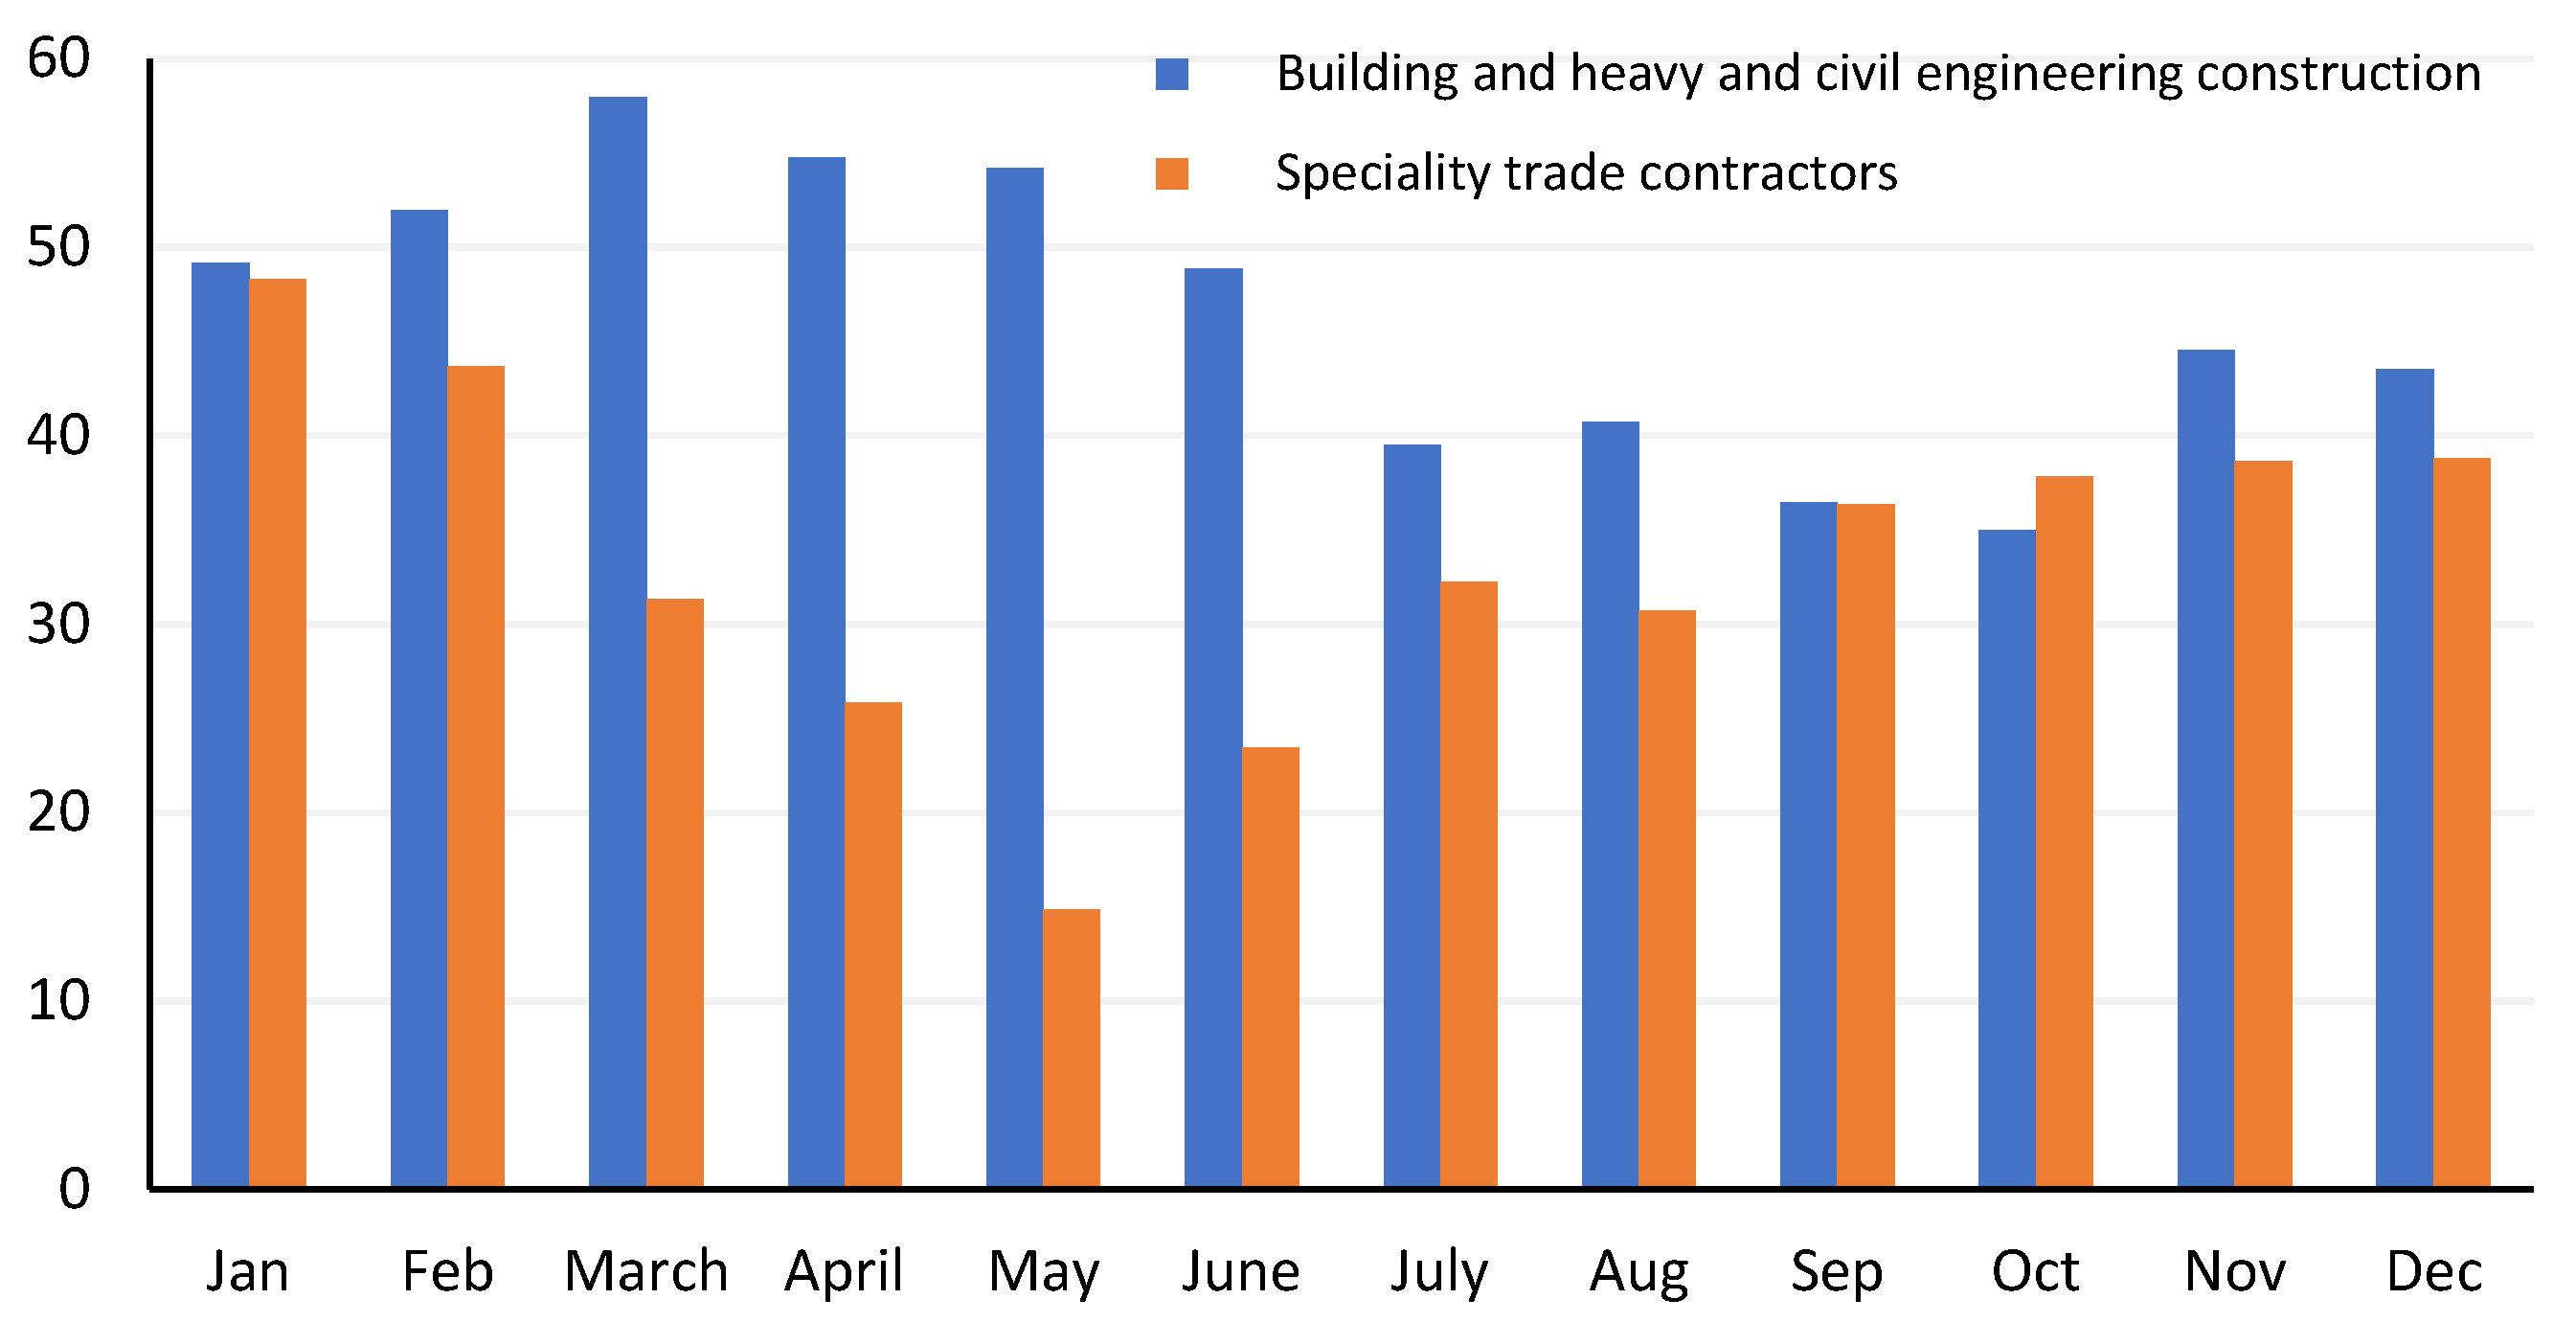
4.2.5. Construction
4.3. Stable Sectors
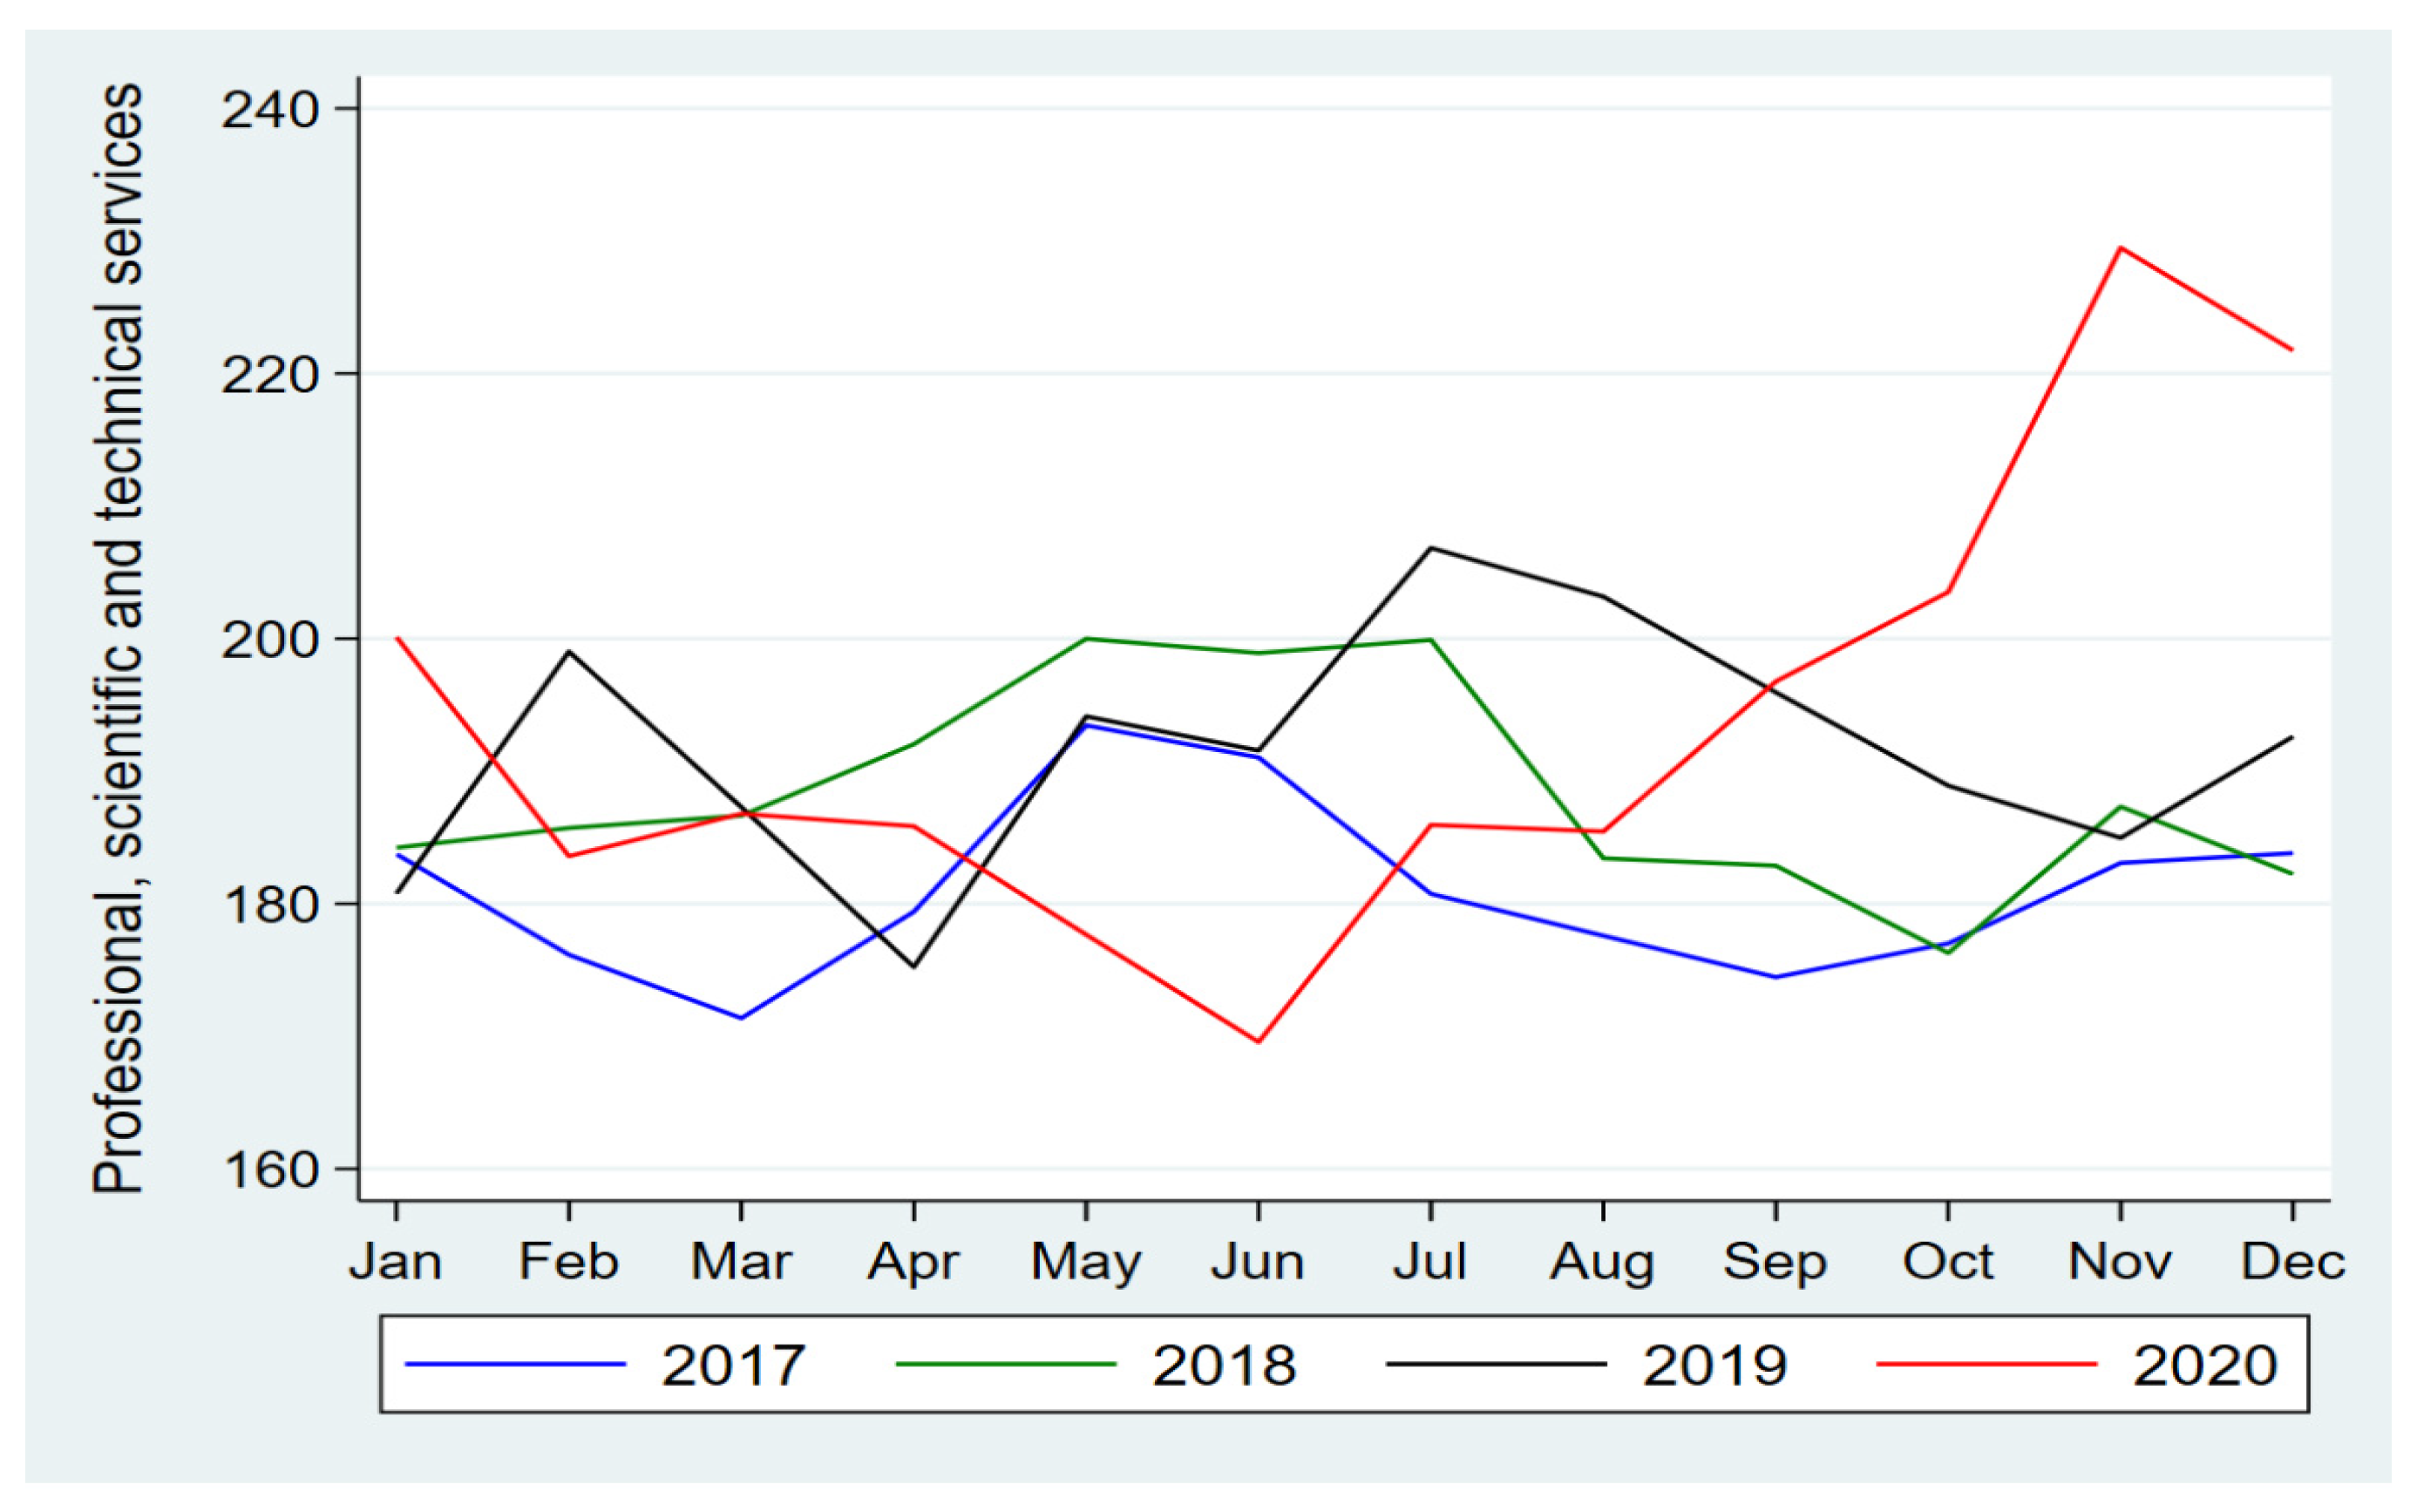
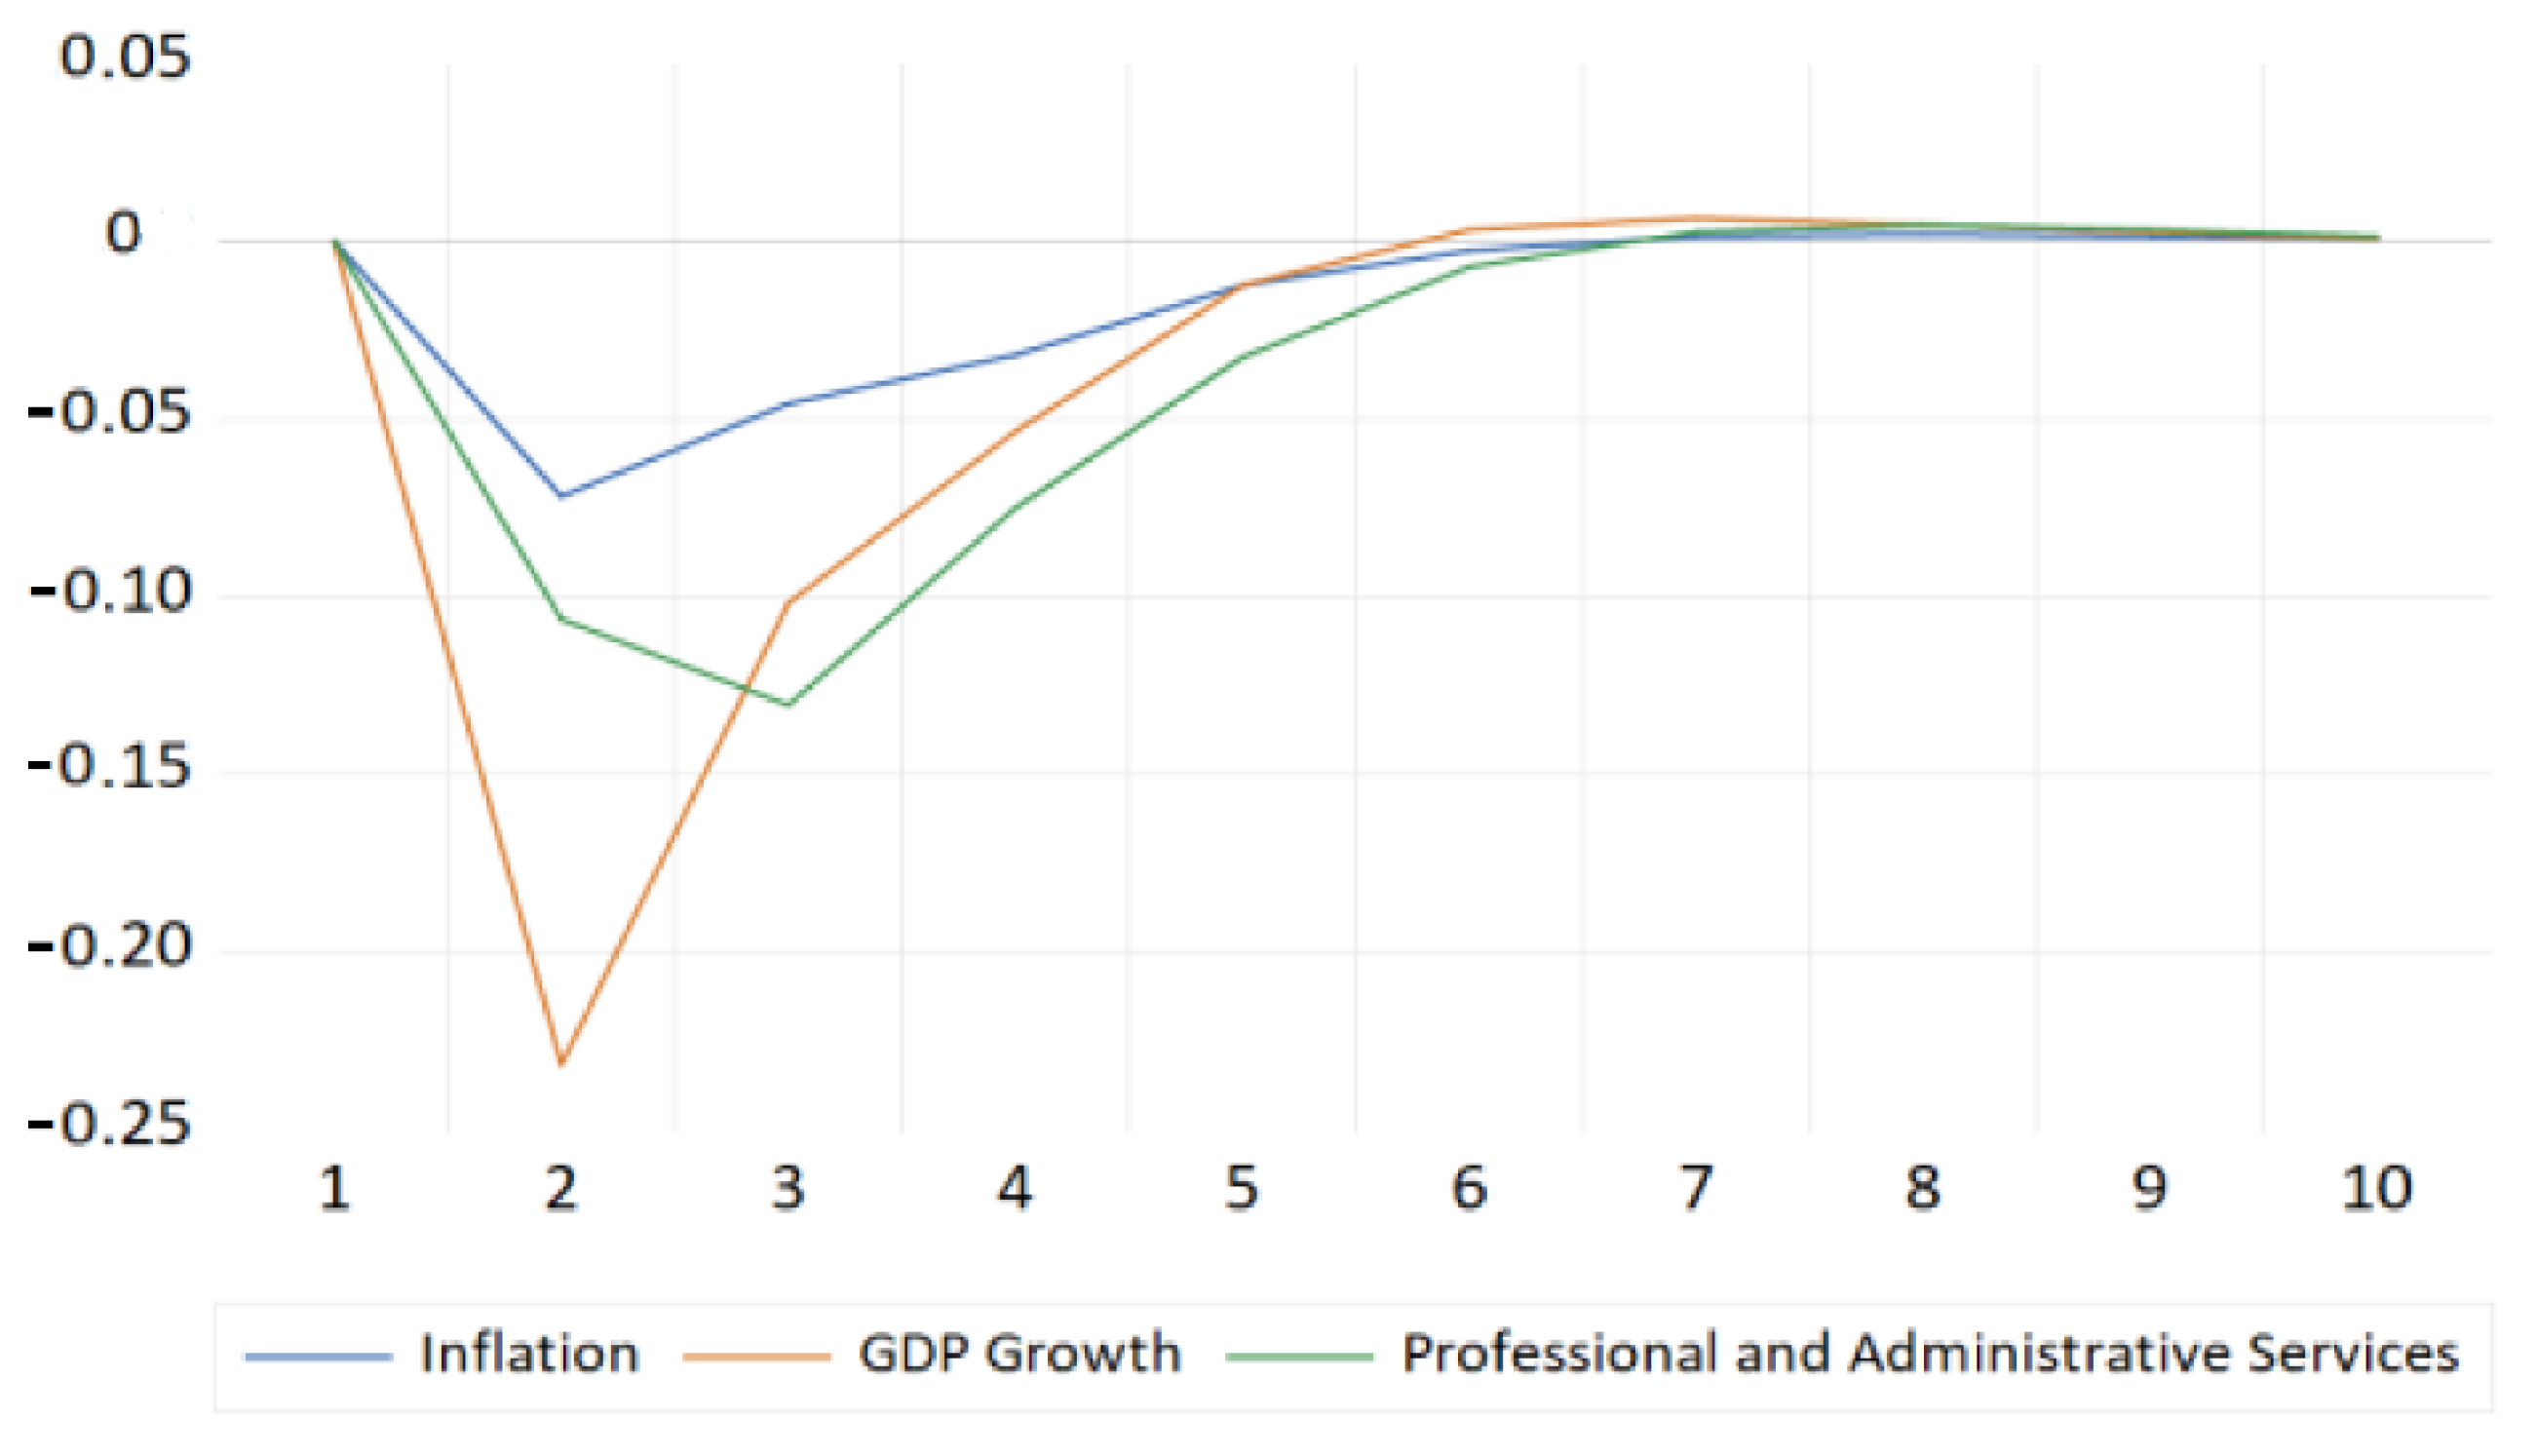
4.3.1. Professional, Scientific and Technical Services
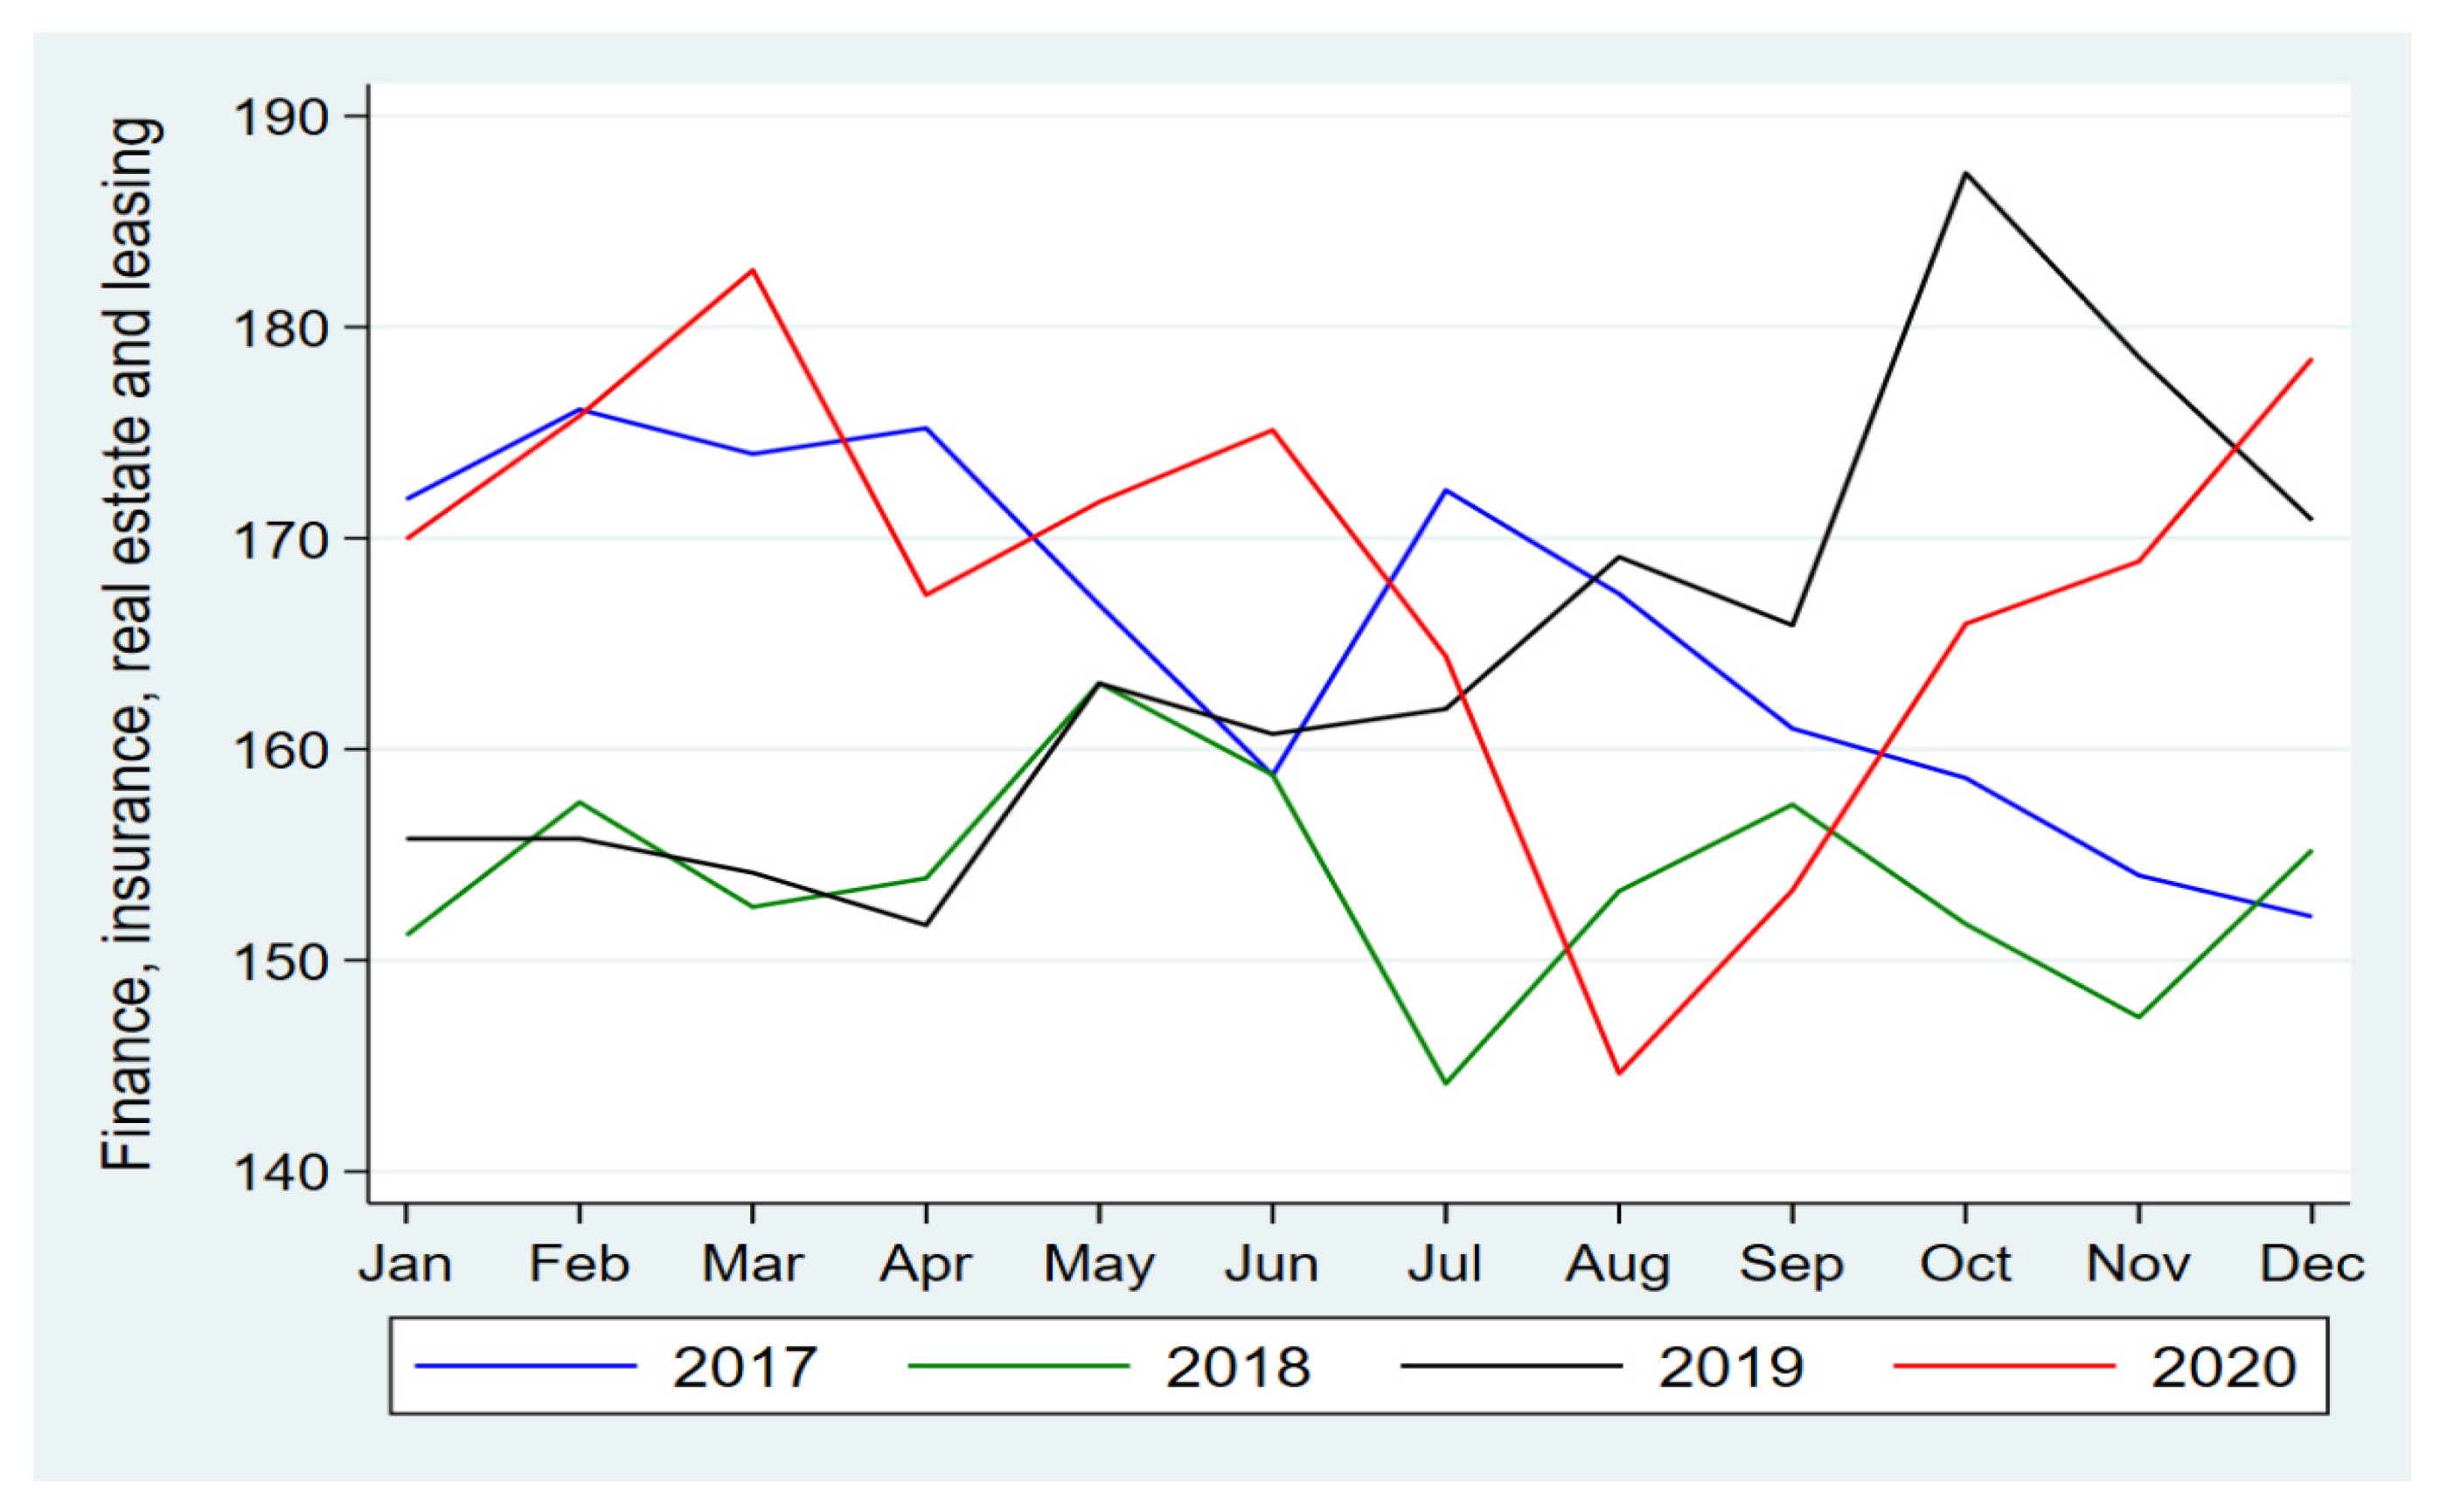
4.3.2. Finance, Insurance, Real Estate, Rental and Leasing (FIRE)
5. Conclusions
Author Contributions
Funding
Institutional Review Board Statement
Informed Consent Statement
Data Availability Statement
Conflicts of Interest
Appendix A


| January-2020 | February-2020 | March-2020 | April-2020 | May-2020 | June-2020 | July-2020 | August-2020 | September-2020 | October-2020 | November-2020 | December-2020 | Avg. 2019 | Avg. 2019 | Avg. 2020 | |
|---|---|---|---|---|---|---|---|---|---|---|---|---|---|---|---|
| Construction | 5% | 5% | 8% | 18% | 13% | 9% | 4% | 4% | 4% | 5% | 5% | 5% | 5% | 5% | 7% |
| Manufacturing | 3% | 3% | 4% | 12% | 8% | 5% | 4% | 2% | 2% | 2% | 3% | 3% | 3% | 3% | 4% |
| Retail | 4% | 3% | 6% | 22% | 15% | 10% | 3% | 3% | 3% | 3% | 4% | 4% | 4% | 4% | 7% |
| Transportation & warehousing | 8% | 8% | 11% | 24% | 10% | 10% | 7% | 7% | 7% | 7% | 7% | 7% | 8% | 8% | 9% |
| Finance and insurance and management of companies and enterprises | 5% | 5% | 5% | 11% | 7% | 6% | 5% | 5% | 5% | 5% | 5% | 5% | 5% | 5% | 6% |
| Real estate and rental and leasing | 5% | 5% | 6% | 14% | 11% | 10% | 4% | 5% | 5% | 6% | 6% | 6% | 5% | 5% | 7% |
| Professional, scientific and technical services | 6% | 6% | 6% | 11% | 9% | 8% | 5% | 5% | 5% | 5% | 5% | 6% | 6% | 6% | 7% |
| Educational services | 4% | 3% | 5% | 25% | 15% | 11% | 4% | 3% | 3% | 3% | 3% | 4% | 5% | 4% | 7% |
| Health care and social assistance | 3% | 3% | 4% | 13% | 14% | 7% | 3% | 2% | 2% | 3% | 3% | 3% | 3% | 3% | 5% |
| Accommodation & food services | 3% | 4% | 9% | 27% | 22% | 13% | 5% | 2% | 3% | 3% | 4% | 5% | 4% | 4% | 8% |
| Period | Accommodation & Food Services | Manufacturing | Retail Trade | Transportation & Warehousing | Educational Services | Construction | FIRE | Professional Scientific & Technical |
|---|---|---|---|---|---|---|---|---|
| 1 | 0 | 0 | 0 | 0 | 0 | 0 | 0 | 0 |
| 2 | −0.212 | −0.1068 | −0.0808 | −0.0792 | −0.0148 | 0.2006 | −0.0782 | −0.1062 |
| 3 | −0.0439 | −0.0689 | 0.0124 | 0.0863 | −0.0419 | −0.3233 | −0.0574 | −0.1303 |
| 4 | 0.1257 | −0.0554 | −0.1407 | 0.1026 | −0.0022 | −0.0718 | −0.028 | −0.0748 |
| 5 | 0.0937 | −0.0413 | −0.1163 | 0.0205 | 0.1889 | 0.1625 | −0.0122 | −0.0327 |
| 6 | −0.1261 | −0.0312 | −0.0532 | −0.0285 | −0.1248 | −0.5813 | −0.0048 | −0.0072 |
| 7 | −0.2412 | −0.0235 | −0.0456 | −0.0199 | −0.0178 | 0.357 | −0.0018 | 0.0029 |
| 8 | −0.1028 | −0.0178 | −0.0188 | 0.0025 | 0.0789 | −0.1734 | −0.0006 | 0.0047 |
| 9 | 0.1039 | −0.0134 | −0.0149 | 0.0089 | −0.0678 | −0.334 | −0.0002 | 0.0034 |
| 10 | 0.1133 | −0.0101 | −0.0174 | 0.0029 | 0.0161 | 0.5125 | −0.0001 | 0.0017 |
| 1 | Source: https://www.forbes.com/sites/bernardmarr/2018/09/02/what-is-industry-4-0-heres-a-super-easy-explanation-for-anyone/?sh=5b5d8a599788 (accessed on 15 September 2021). |
| 2 | Source: https://www.weforum.org/agenda/2021/11/how-tech-4-0-helped-companies-survive-covid-19/ (accessed on 11 December 2021). |
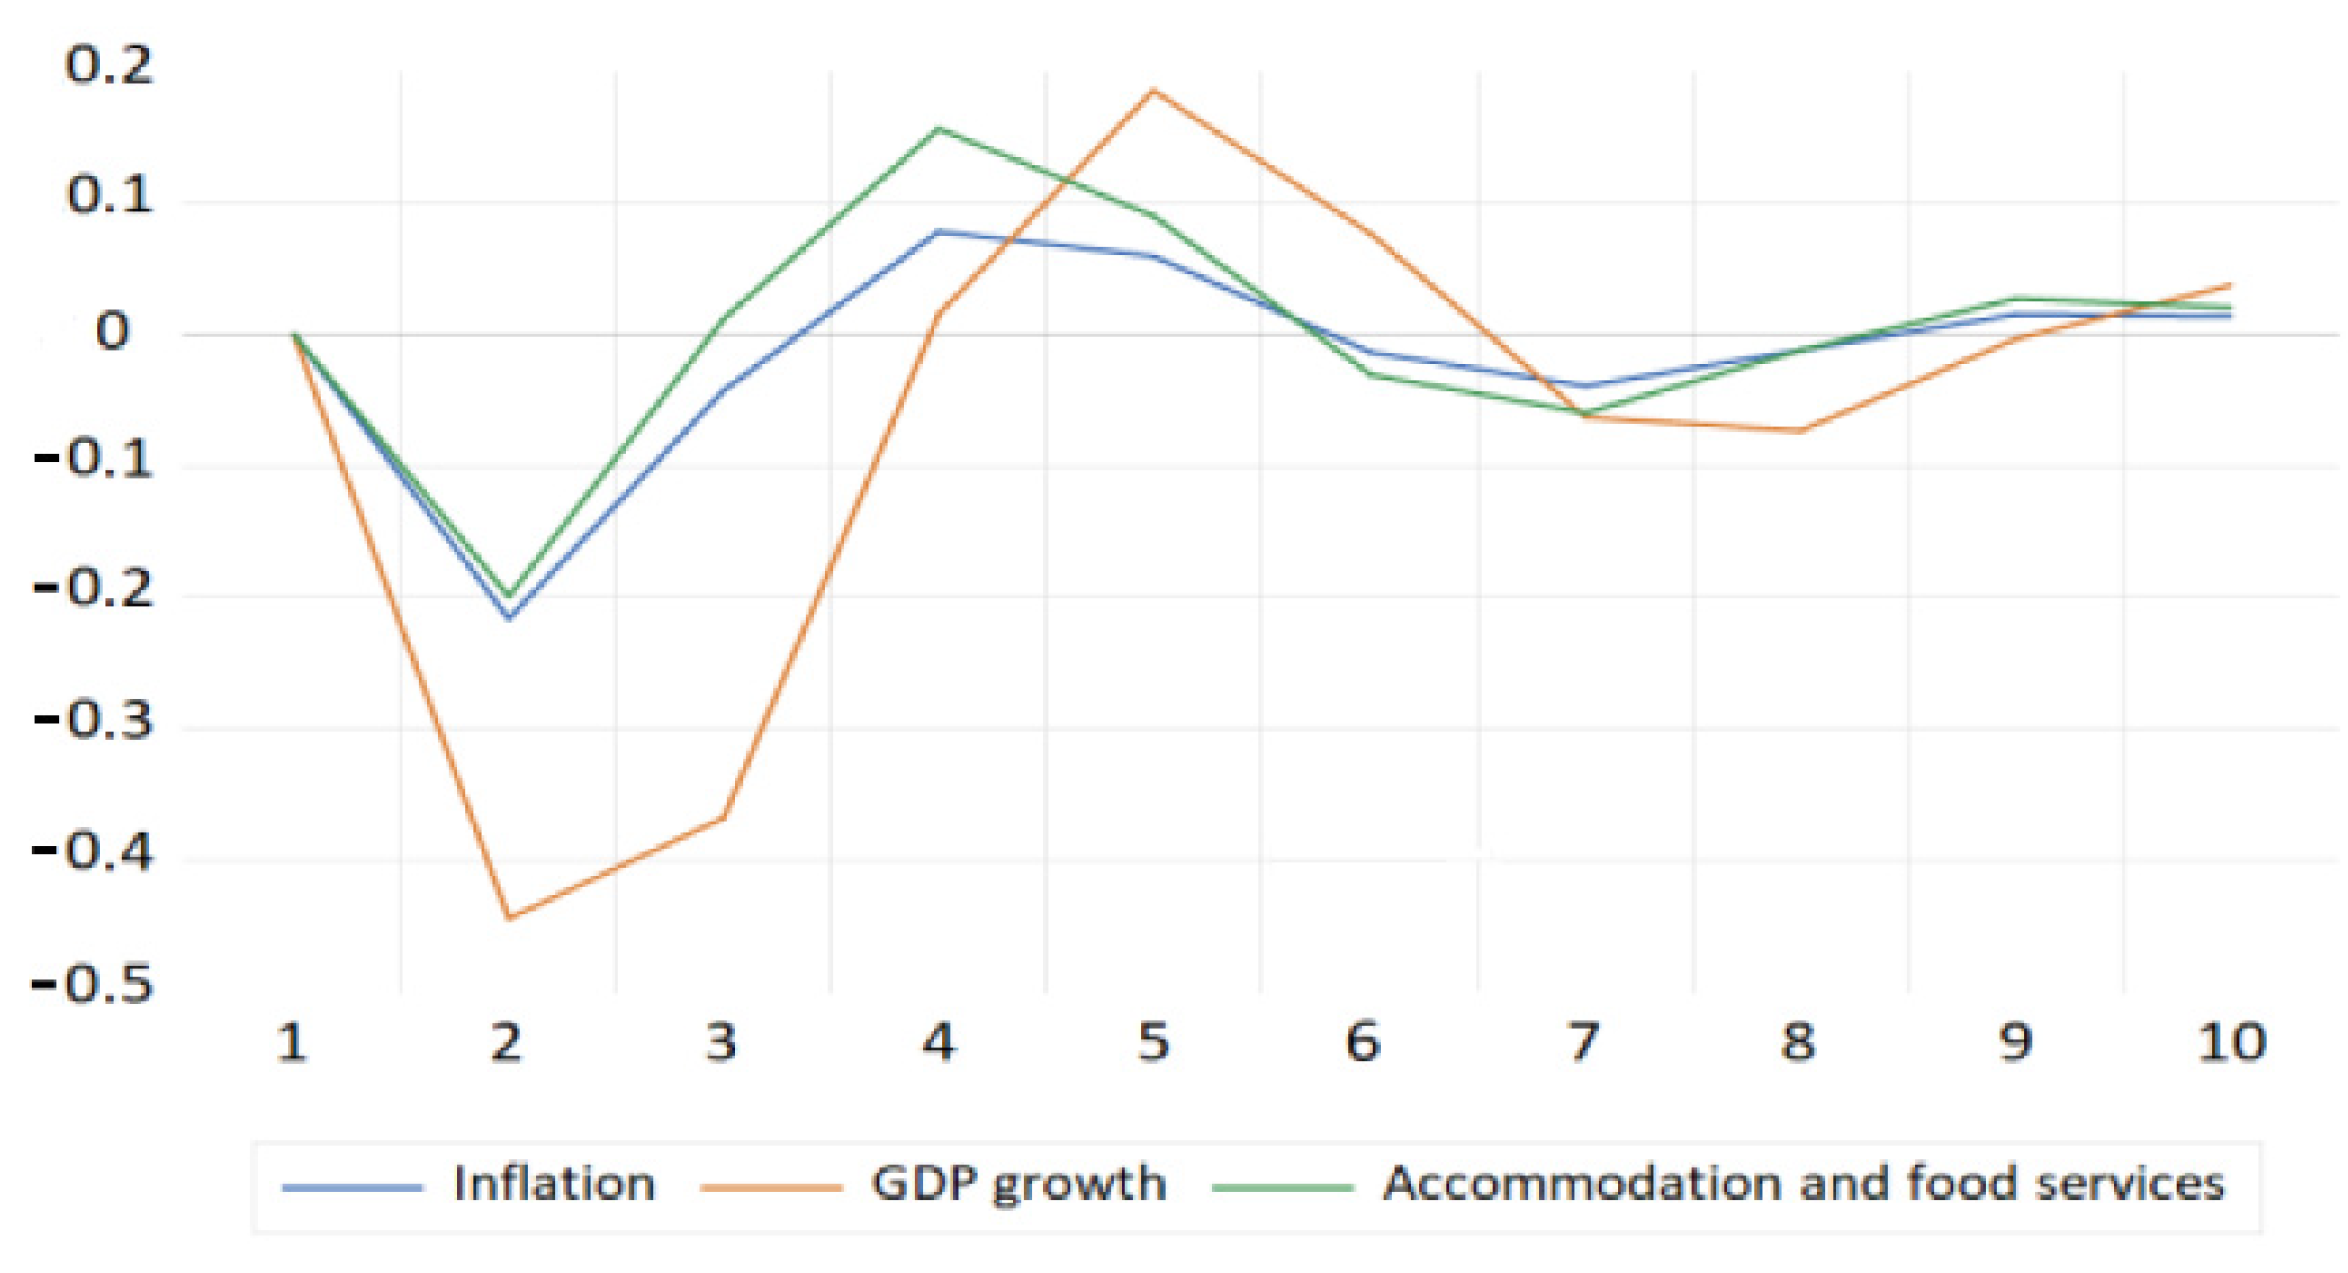
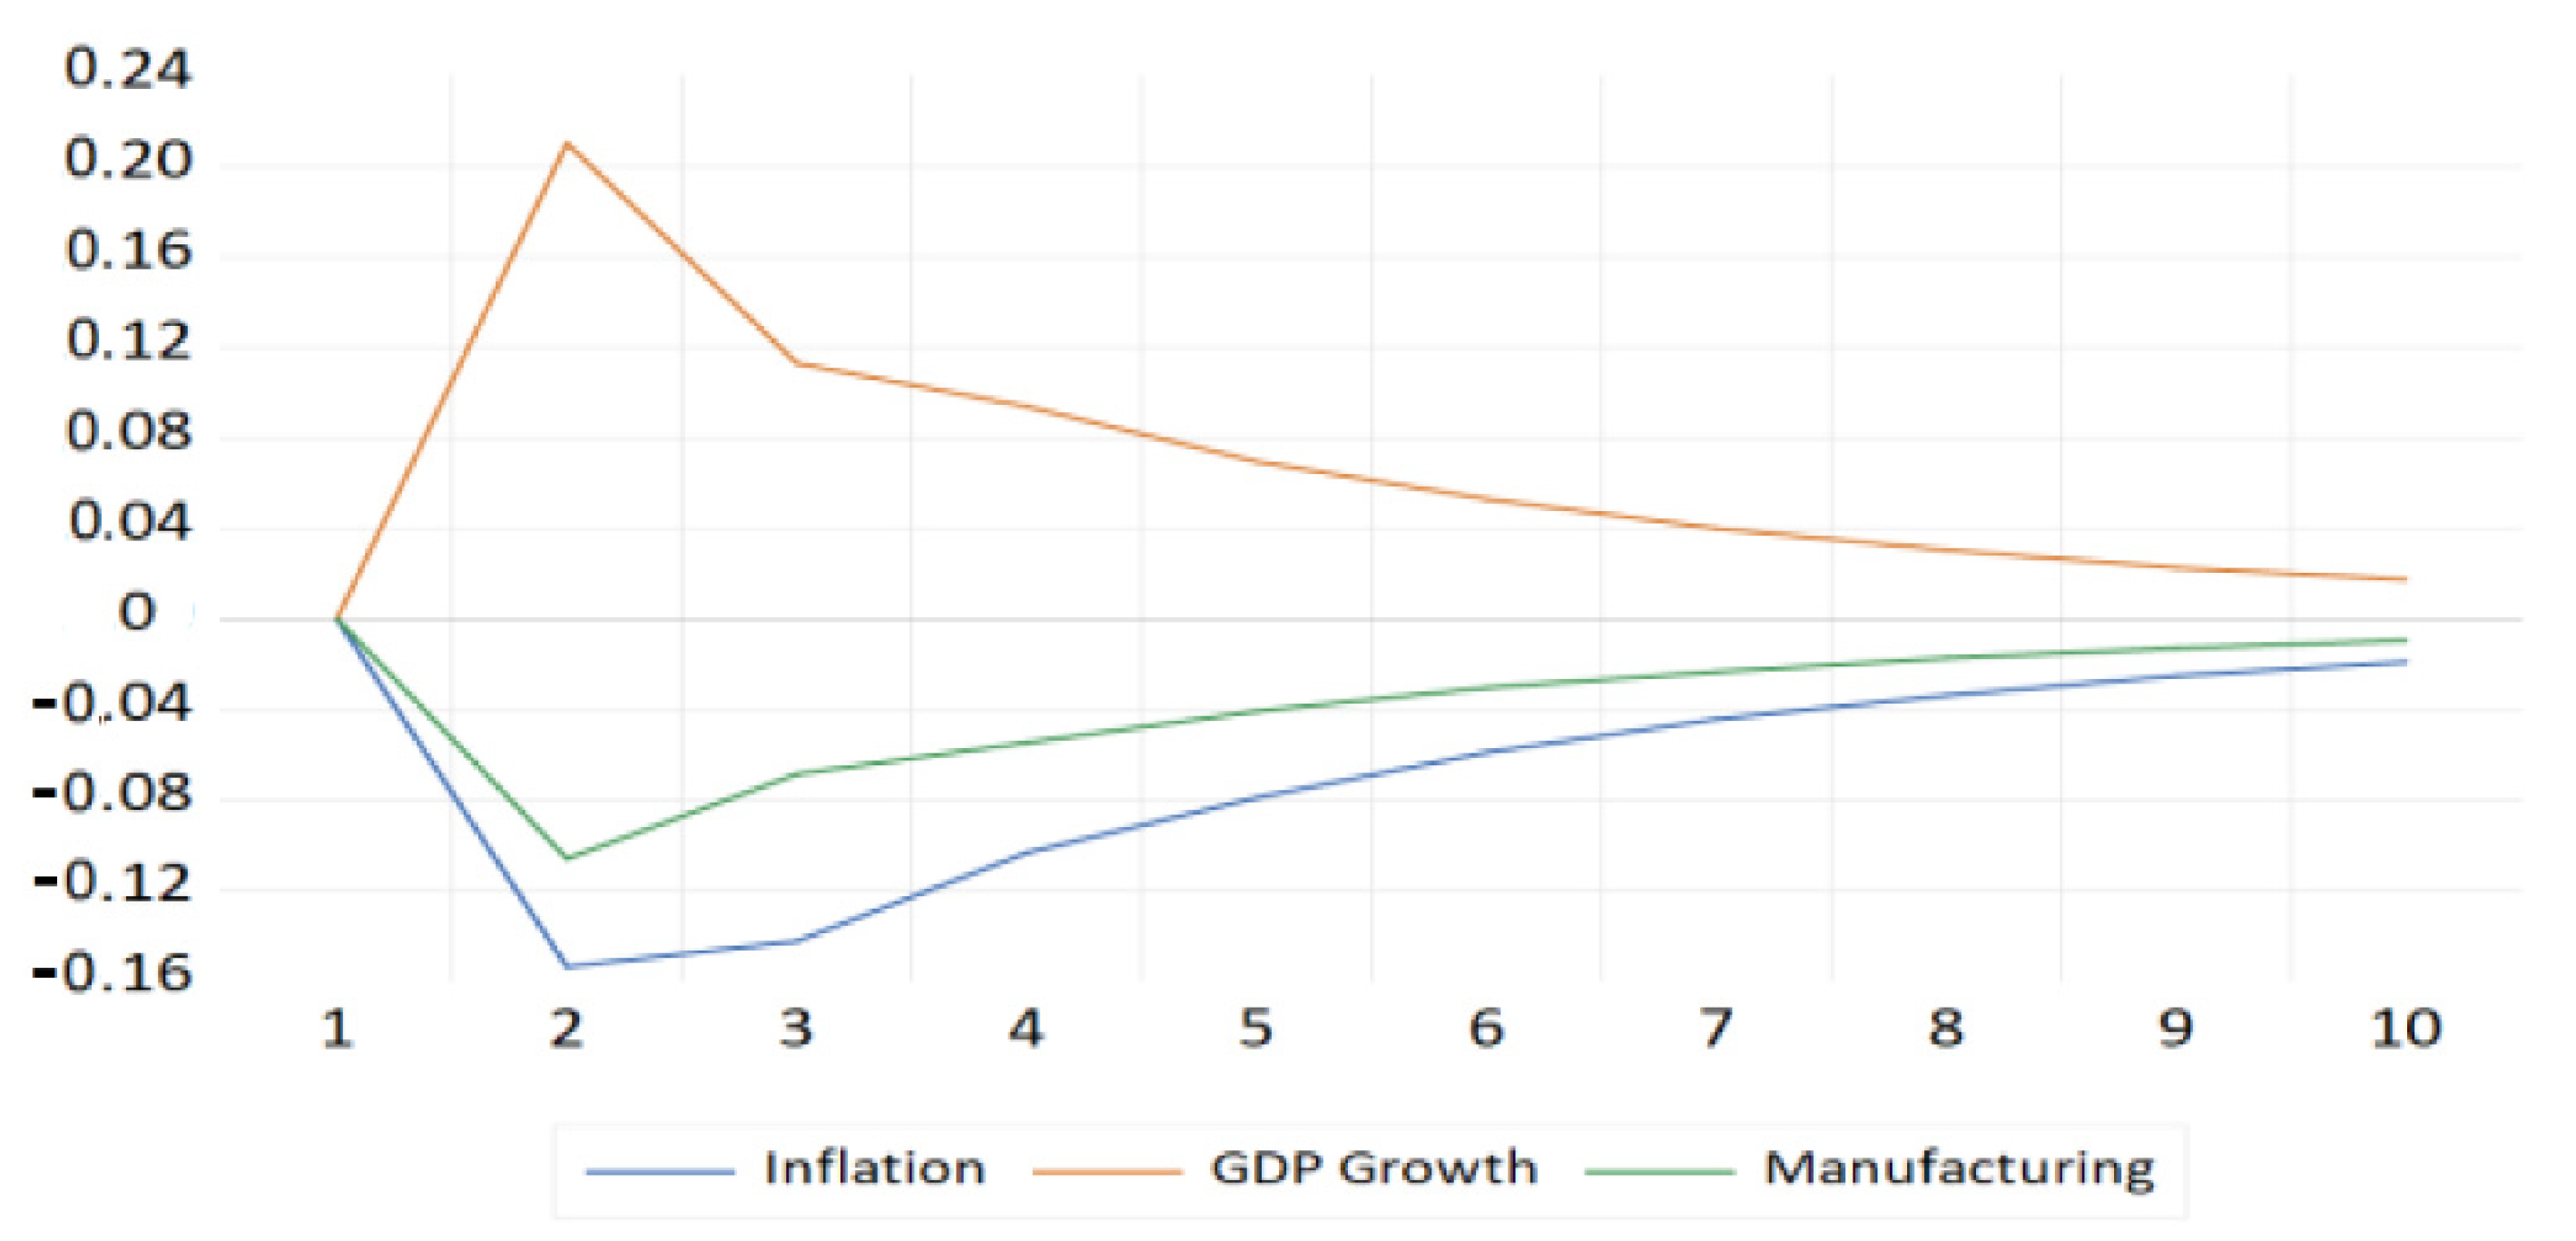
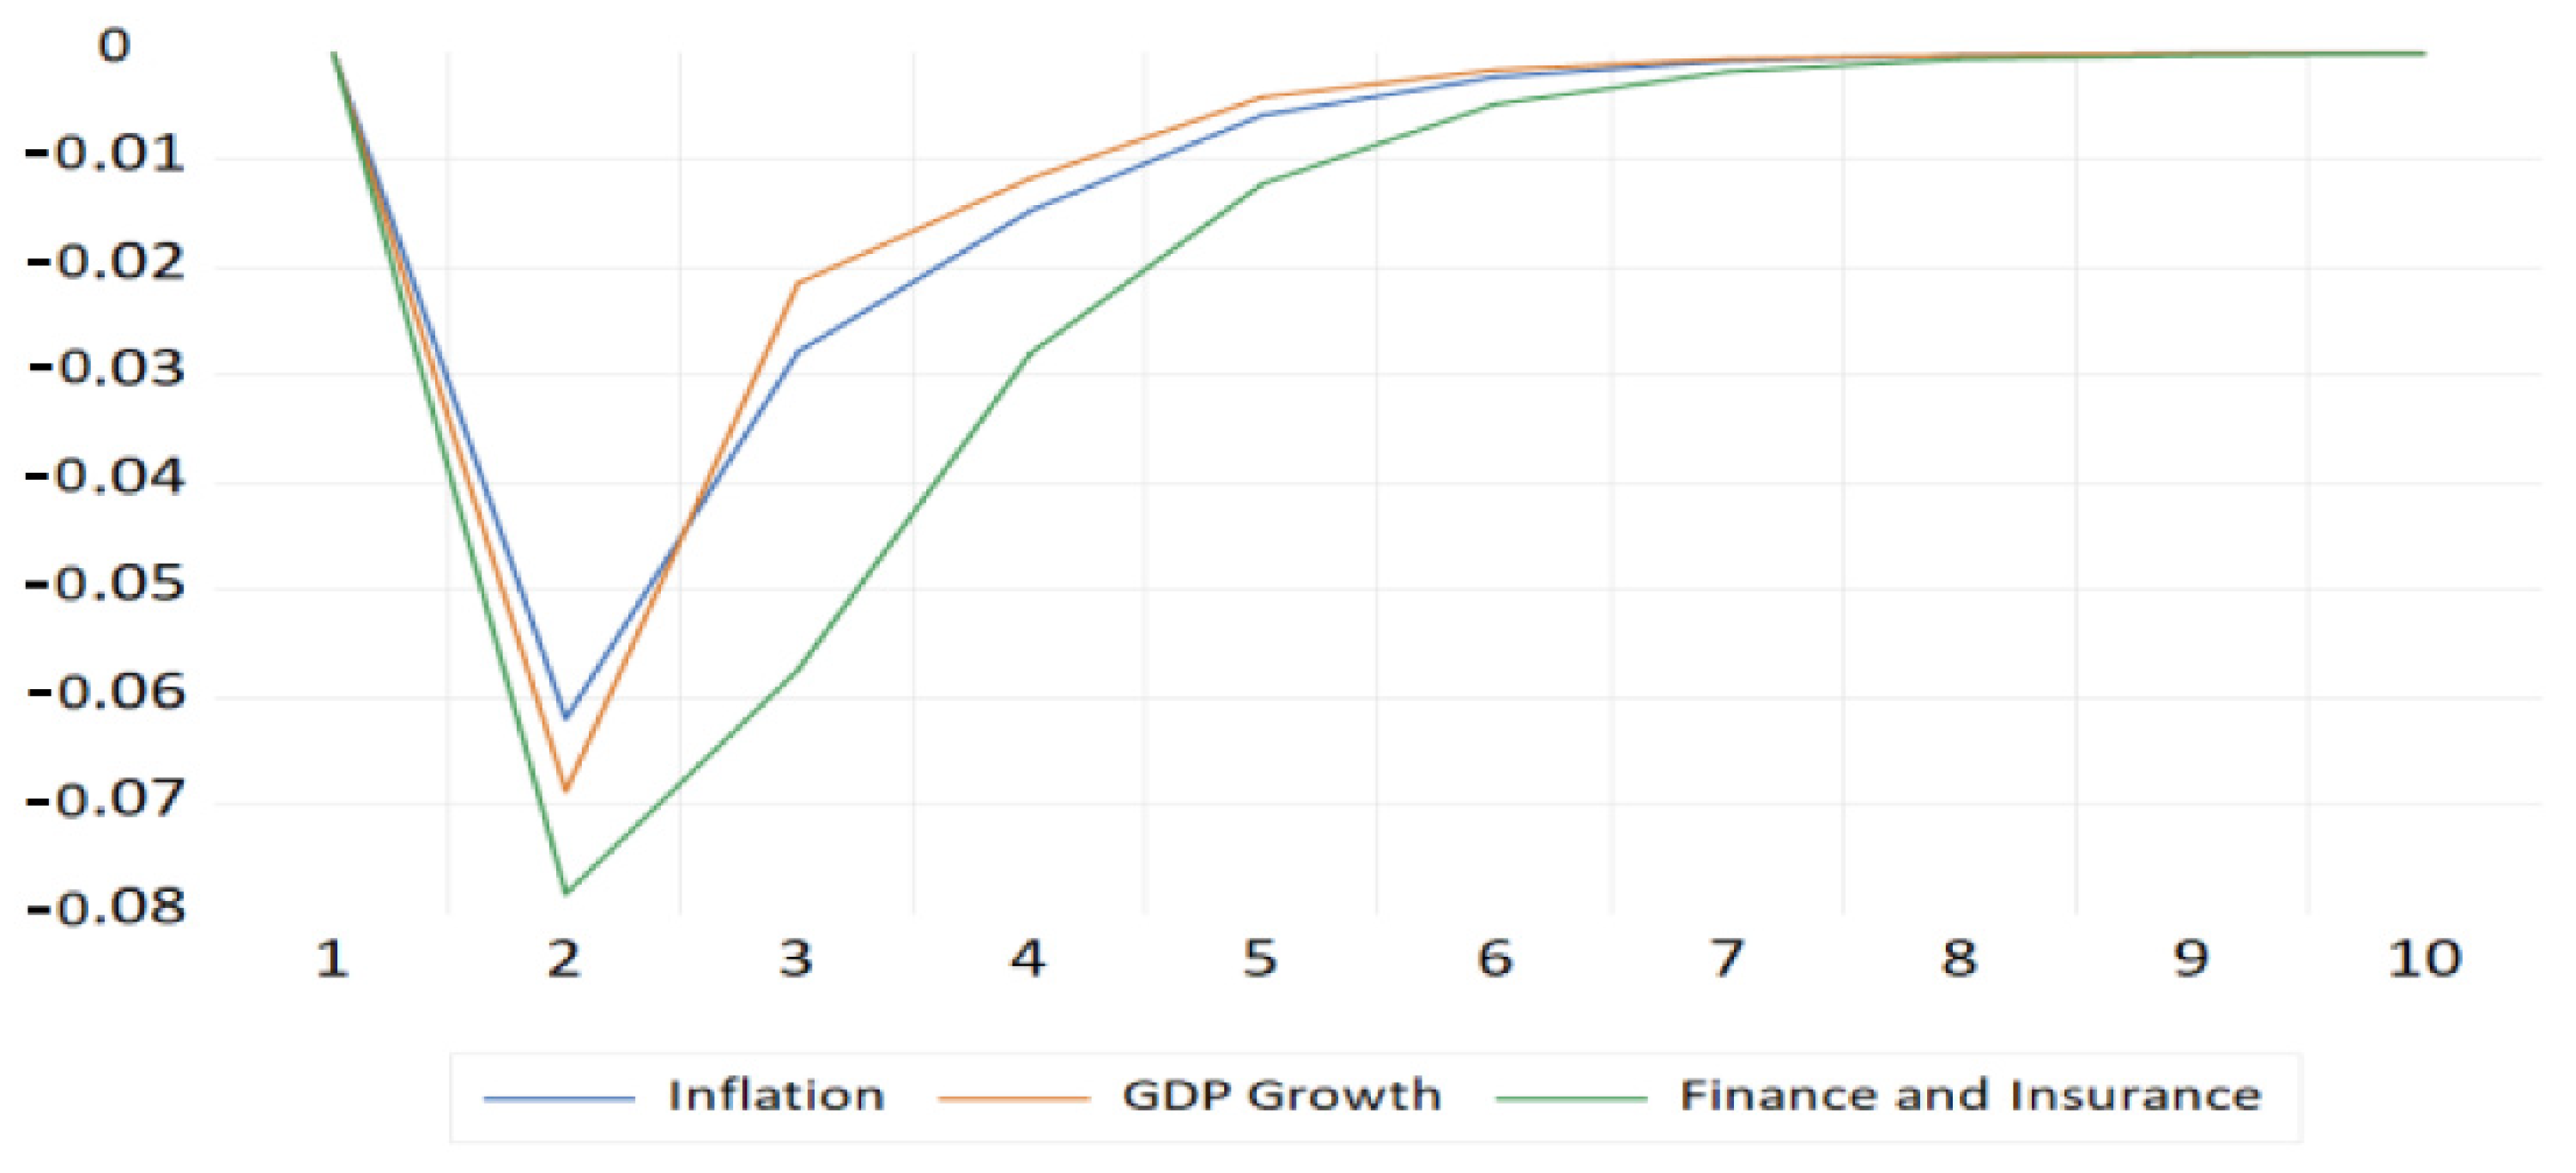
| 3 | The forcast from the VAR model for each sector starts from the fourth quarter of 2020 and lasts for 10 periods. The use of 10 period allows us to measure a reasonable future response to the shock. It should be noted that the use of such time horizon corresponds to standard practice in the literature, for example, see Darolles and Gourieroux (2015); Oscar Jordà (2005) and Koop et al. (1996). |
| 4 | We chose optimal lag of 1 according to AIC and SC information criteria for Accommodation & food services, Manufacturing, Retail trade, Transportation & warehousing, Educational services, Professional scientific & technical, and Finance, insurance, real estate and leasing sectors. For the Construction sector, the optimal lag is 2. |
| 5 | The same VAR model was estimated for each sector to obtain the Impulse Response Functions (IRFs). |
| 6 | We use monthly data from 2017 to 2020. |
| 7 | A cutoff criterion of 5% of total employment is used to identify the top sectors. |
| 8 | Source: https://www23.statcan.gc.ca/imdb/p3VD.pl?Function=getVD&TVD=118464&CVD=118465&CPV=72&CST=01012012&CLV=1&MLV=5 (accessed on 15 March 2021). |
| 9 | Source: https://www.jobbank.gc.ca/content_pieces-eng.do?cid=12204 (accessed on 15 March 2021). |
| 10 | Ibid. |
| 11 | The responses of unemployment to Cholesky One S.D (d. f. adjusted) Innovations ± 2 S. E. |
| 12 | Source: https://www23.statcan.gc.ca/imdb/p3 VD.pl?Function=getVD&TVD=118464&CVD=118465&CPV=31-33&CST=01012012&CLV=1&MLV=5 (accessed on 15 March 2021). |
| 13 | Source: https://www150.statcan.gc.ca/n1/daily-quotidien/200715/dq200715a-eng.htm (accessed on 17 March 2021). |
| 14 | The responses of unemployment to Cholesky One S.D (d. f. adjusted) Innovations ± 2 S. E. |
| 15 | Source: https://www23.statcan.gc.ca/imdb/p3VD.pl?Function=getVD&TVD=118464&CVD=118465&CPV=44-45&CST=01012012&CLV=1&MLV=5 (accessed on 15 March 2021). |
| 16 | Retail e-commerce sales in Canada increased from 2.9 billion in July 2020 to 4.3 billion in November 2020. Source: https://www150.statcan.gc.ca/t1/tbl1/en/tv.action?pid=2010007201 (accessed on 15 March 2021). |
| 17 | Source: https://www15.0.statcan.gc.ca/t1/tbl1/en/tv.action?pid=2010007401 (accessed on 17 March 2021). |
| 18 | The responses of unemployment to Cholesky One S.D (d. f. adjusted) Innovations ± 2 S. E. |
| 19 | Source: https://www23.statcan.gc.ca/imdb/pD.pl?Function=getVD&TVD=118464&CVD=118465&CPV=48-49&CST=01012012&CLV=1&MLV=5 (accessed on 15 March 2021). |
| 20 | Source: https://www.jobbank.gc.ca/content_pieces-eng.do?cid=14662 (accessed on 15 March 2021). |
| 21 | |
| 22 | Source: http://www.ttc.ca/Coupler/Editorial/Notices/index.jsp (accessed on 20 March 2021). |
| 23 | Source: https://travel.gc.ca/travel-covid/travel-restrictions/border (accessed on 20 March 2021). |
| 24 | The responses of unemployment to Cholesky One S.D (d. f. adjusted) Innovations ± 2 S. E. |
| 25 | Source: https://www23.statcan.gc.ca/imdb/p3VD.pl?Function=getVD&TVD=118464&CVD=118465&CPV=62&CST=01012012&CLV=1&MLV=5 (accessed on 15 March 2021). |
| 26 | Source: https://www23.statcan.gc.ca/imdb/p3VD.pl?Function=getVD&TVD=118464&CVD=118465&CPV=61&CST=01012012&CLV=1&MLV=5 (accessed on 15 March 2021). |
| 27 | Source: https://www.jobbank.gc.ca/content_pieces-eng.do?cid=15197 (accessed on 15 March 2021). |
| 28 | Source: https://www150.statcan.gc.ca/n1/daily-quotidien/201009/dq201009a-eng.htm (accessed on 17 March 2021). |
| 29 | The responses of unemployment to Cholesky One S.D (d. f. adjusted) Innovations ± 2 S. E. |
| 30 | Source: https://www23.statcan.gc.ca/imdb/pD.pl?Function=getVD&TVD=118464&CVD=118465&CPV=23&CST=01012012&CLV=1&MLV=5 (accessed on 15 March 2021). |
| 31 | The responses of unemployment to Cholesky One S.D (d. f. adjusted) Innovations ± 2 S. E. |
| 32 | Source: https://www23.statcan.gc.ca/imdb/p3VD.pl?Function=getVD&TVD=118464&CVD=118465&CPV=54&CST=01012012&CLV=1&MLV=5 (accessed on 15 March 2021). |
| 33 | The responses of unemployment to Cholesky One S.D (d. f. adjusted) Innovations ± 2 S. E. |
| 34 | Source: https://www23.statcan.gc.ca/imdb/p3VD.pl?Function=getVD&TVD=118464&CVD=118465&CPV=52&CST=01012012&CLV=1&MLV=5 (accessed on 15 March 2021). |
| 35 | Source: https://www.jobbank.gc.ca/content_pieces-eng.do?cid=14525 (accessed on 15 March 2021. |
| 36 | Source: https://www.osfi-bsif.gc.ca/Eng/Pages/COVID-19.aspx (accessed on 19 March 2021). |
| 37 | Source: https://www.bankofcanada.ca/2020/05/financial-system-review-2020/ (accessed on 17 March 2021). |
| 38 | The responses of unemployment to Cholesky One S.D (d. f. adjusted) Innovations ± 2 S. E. |
References
- Adams-Prassl, Abi, Teodora Boneva, Marta Golin, and Christopher Rauh. 2020. Work That Can Be Done from Home: Evidence on Variation within and across Occupations and Industries. Discussion Paper Series. Bonn: IZA Institute of Labor Economics. [Google Scholar]
- Almeida, Fernando, and José Duarte Santos. 2020. The effects of COVID-19 on job security and unemployment in Portugal. International Journal of Sociology and Social Policy 40: 995–1003. [Google Scholar] [CrossRef]
- Andersen, Asger Lau, Emil Toft Hansen, Niels Johannesen, and Adam Sheridan. 2020. Consumer Responses to the COVID-19 Crisis: Evidence from Bank Account Transaction Data. CEBI Working Paper, No. 18/20. Copenhagen: Center for Economic Behaviour and Inequality, University of Copenhagen. [Google Scholar] [CrossRef]
- Barrero, Jose Maria, Nicholas Bloom, and Steven J. Davis. 2020. COVID-19 Is Also a Reallocation Shock. NBER Working Paper Series, 27137. Cambridge: National Bureau of Economic Research. [Google Scholar]
- Bartik, Alexander W., Marianne Bertrand, Feng Lin, Jesse Rothstein, and Matt Unrath. 2020. Measuring the Labor Market at the Onset of the COVID-19 Crisis. NBER Working Paper, w27613. Cambridge: National Bureau of Economic Research. [Google Scholar]
- Béland, Louis-Philippe, Abel Brodeur, and Taylor Wright. 2020. The Short-Term Economic Consequences of Covid-19: Exposure to Disease, Remote Work and Government Response. Discussion Paper Series, 13197. Bonn: IZA Institute of Labour Economics. [Google Scholar]
- Blundell, Richard, Monica Costa Dias, Robert Joyce, and Xiaowei Xu. 2020. COVID-19 and Inequalities. Fiscal Studies 41: 291–319. [Google Scholar] [CrossRef] [PubMed]
- Byrne, Stephen, Dermot Coates, Enda Keenan, and Tara McIndoe-Calder. 2020. The initial labour market impact of COVID-19. Central Bank Economic Letter 4: 25. [Google Scholar]
- Ceylan, Rahmiye Figen, Burhan Ozkan, and Esra Mulazimogullari. 2020. Historical evidence for economic effects of COVID-19. The European Journal of Health Economics 21: 817–23. [Google Scholar] [CrossRef]
- Churchill, Brendan. 2021. COVID-19 and the immediate impact on young people and employment in Australia: A gendered analysis. Gender, Work & Organisation 28: 783–94. [Google Scholar]
- Darolles, Serge, and Christian Gourieroux. 2015. Contagion Phenomena with Applications in Finance. Amsterdam: Elsevier. [Google Scholar]
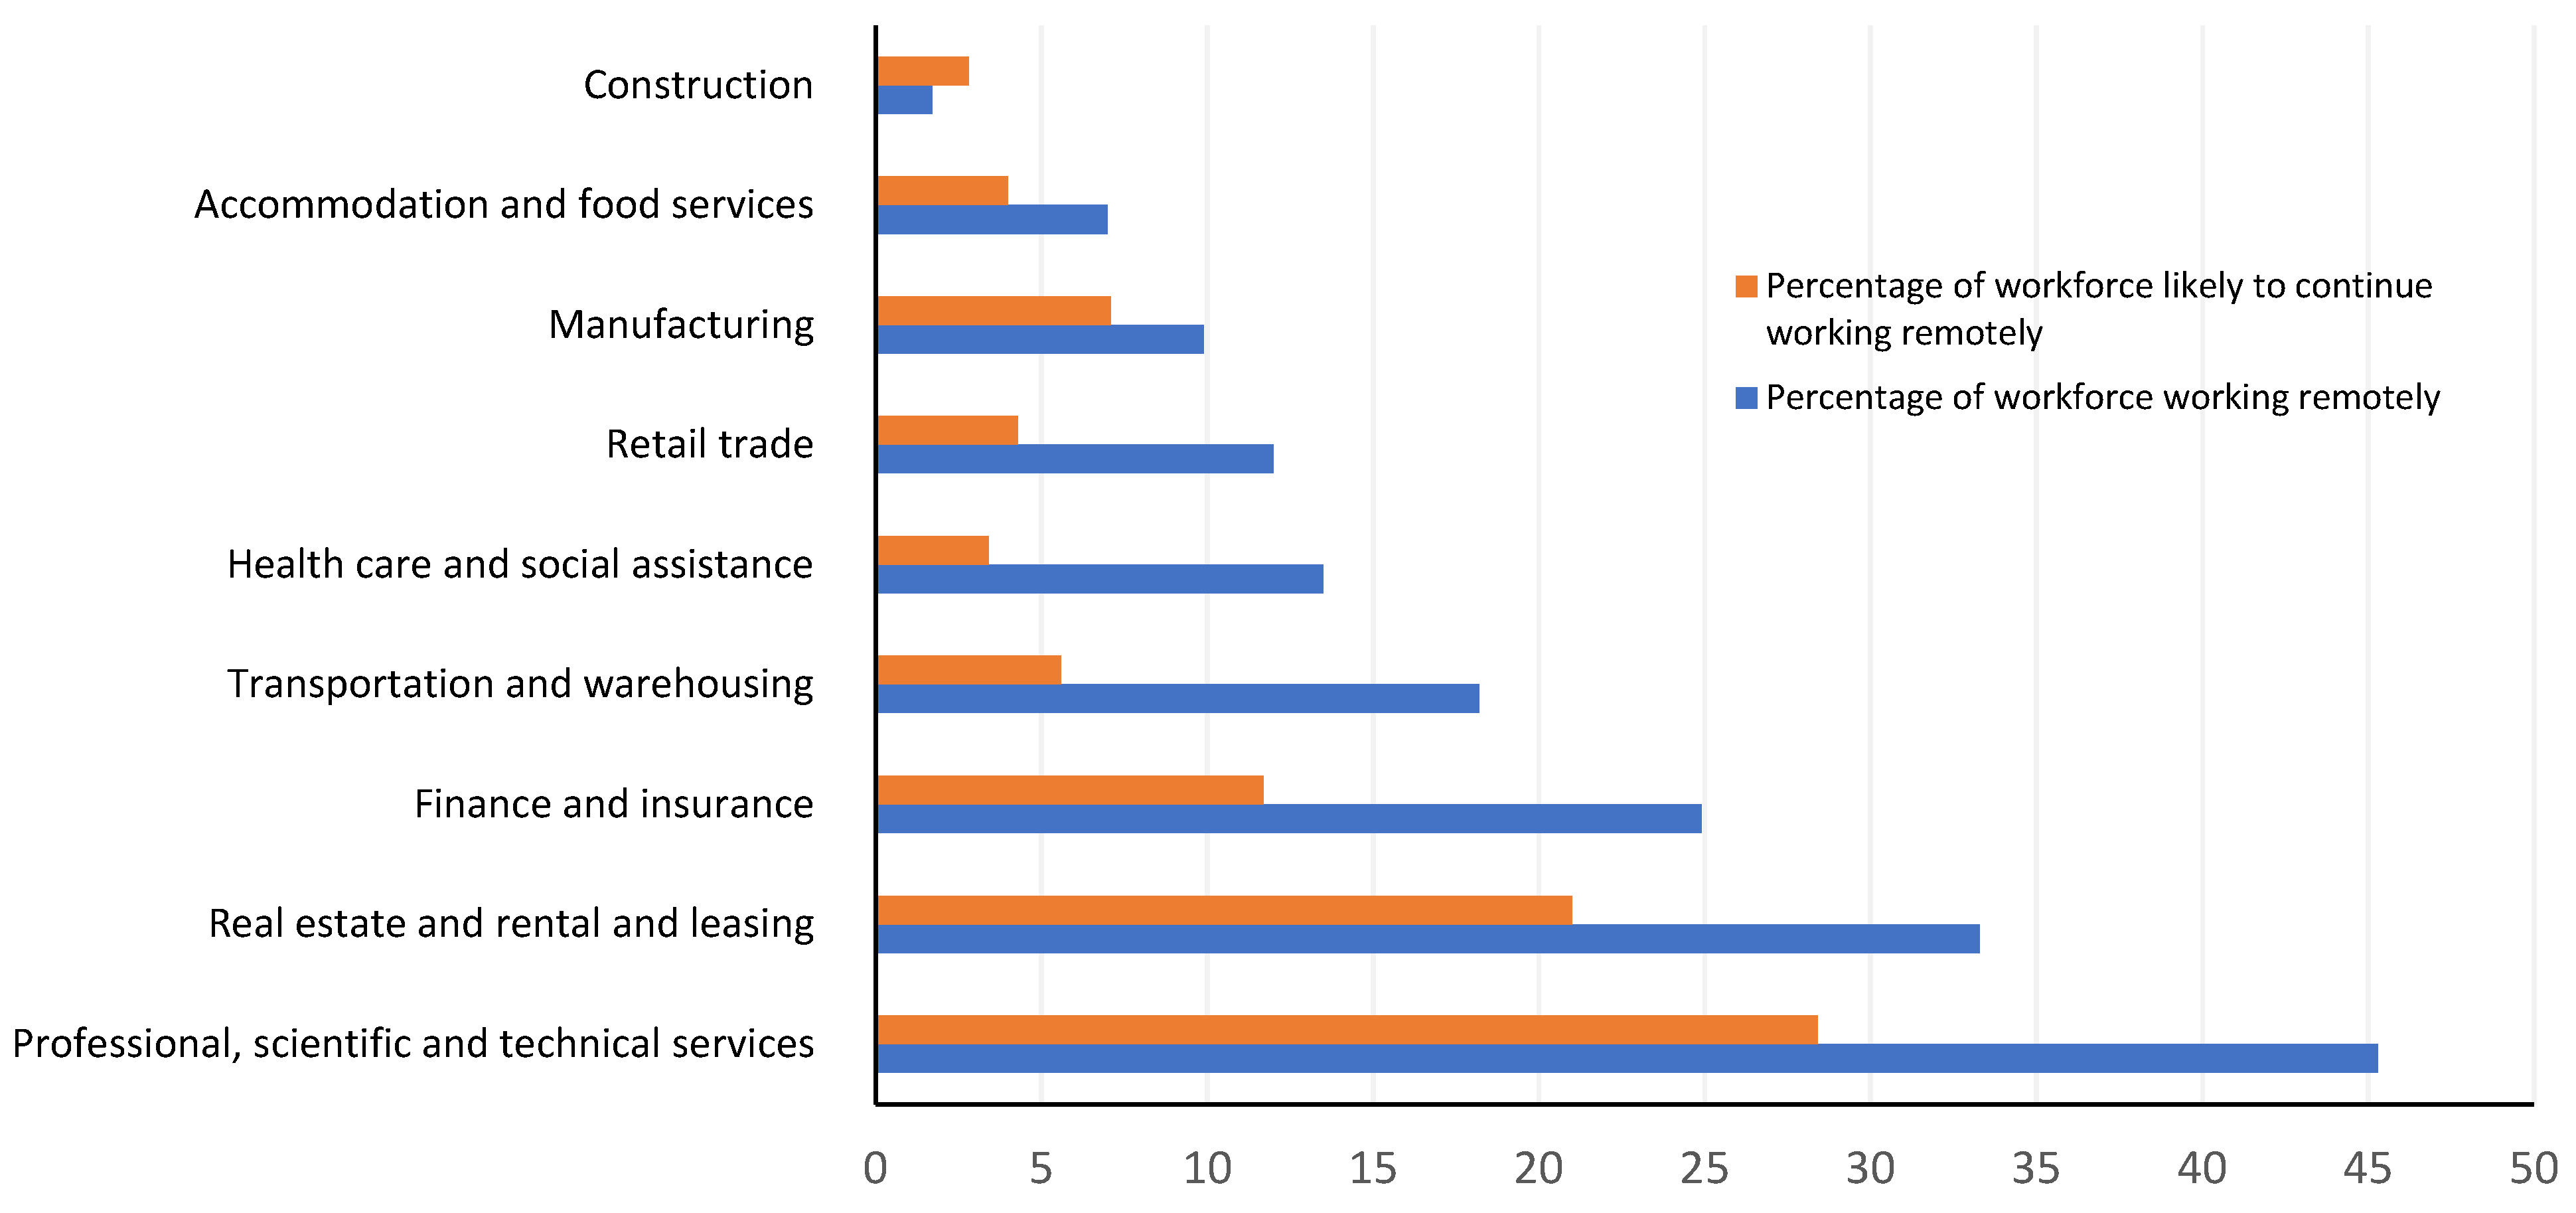
- Deng, Zechuan, René Morissette, and Derek Messacar. 2020. Running the Economy Remotely: Potential for Working from Home during and after COVID-19. In Statcan COVID-19: Data to Insights for a Better Canada. Ottawa: Statistics Canada. [Google Scholar]
- Goddard, Ellen. 2020. The impact of COVID-19 on food retail and food service in Canada: Preliminary assessment. Canadian Journal of Agricultural Economics/Revue Canadienne D’agroeconomie 68: 157–61. [Google Scholar] [CrossRef]
- Goolsbee, Austan, and Chad Syverson. 2020. Fear, Lockdown, and Diversion: Comparing Drivers of Pandemic Economic Decline 2020. NBER Working Paper, 27432. Cambridge: National Bureau of Economic Research. [Google Scholar] [CrossRef]
- Gormsen, Niels Joachim, and Ralph S. J. Koijen. 2020. Coronavirus: Impact on stock prices and growth expectations. The Review of Asset Pricing Studies 10: 574–97. [Google Scholar] [CrossRef]
- Grzadkowska, Alicja. 2020. Short and Long-Term Impacts of the Coronavirus on Canadian Insurers. Insurance Business Canada. Available online: https://www.insurancebusinessmag.com/ca/news/breaking-news/short-and-longterm-impacts-of-the-coronavirus-on-canadian-insurers-225115.aspx (accessed on 18 March 2021).
- Gupta, Sumedha, Laura Montenovo, Thuy Dieu Nguyen, Felipe Lozano-Rojas, Ian M. Schmutte, Kosali Ilayperuma Simon, Bruce A. Weinberg, and Coady Wing. 2020. Effects of Social Distancing Policy on Labor Market Outcomes. NBER Working Paper, 27280. Cambridge: National Bureau of Economic Research. [Google Scholar]
- Habib, Khandker Nurul, Jason Hawkins, Saeed Shakib, Patrick Loa, Sk Mashrur, Alireza Dianat, Kaili Wang, Sanjana Hossain, and Yicong Liu. 2021. Assessing the impacts of COVID-19 on urban passenger travel demand in the Greater Toronto Area: Description of a multi-pronged and multi-staged study with initial results. Transportation Letters 13: 353–66. [Google Scholar] [CrossRef]
- Harris, Jack L., Peter Sunley, Emil Evenhuis, Ron Martin, Andy Pike, and Richard Harris. 2020. The Covid-19 crisis and manufacturing: How should national and local industrial strategies respond? Local Economy 35: 403–15. [Google Scholar] [CrossRef]
- Ingravallo, Francesca. 2020. Death in the era of the COVID-19 pandemic. The Lancet Public Health 5: e258. [Google Scholar] [CrossRef]
- Jordà, Òscar. 2005. Estimation and inference of impulse responses by local projections. The American Economic Review 95: 161–82. [Google Scholar] [CrossRef]
- Keefe, Blair W., and Eli Monas. 2020. Canada’s Financial Sector: An Industry in Transformation. Torys Quarterly: The Race to Transform: Canada’s Financial Services. Available online: https://www.torys.com/insights/publications/2020/10/canadas-financial-sector-an-industry-in-transformation (accessed on 15 July 2021).
- Kerr, Kathy. 2020. Commercial Real Estate: Trends to Watch in 2021. The Globe and Mail. December 1. Available online: https://www.theglobeandmail.com/featured-reports/article-commercial-real-estate-trends-to-watch-in-2021/ (accessed on 15 June 2021).
- Koop, Gary, M. Hashem Pesaran, and Simon M. Potter. 1996. Impulse response analysis in nonlinear multivariate models. Journal of Econometrics 74: 119–47. [Google Scholar] [CrossRef]
- Lemieux, Thomas, Kevin Milligan, Tammy Schirle, and Mikal Skuterud. 2020. Initial impacts of the COVID-19 pandemic on the Canadian labour market. Canadian Public Policy 46: S55–S65. [Google Scholar] [CrossRef]
- Lichtenthaler, Philipp, and Andrea Fischbach. 2019. A meta-analysis on promotion-and prevention-focused job crafting. European Journal of Work and Organizational Psychology 28: 30–50. [Google Scholar] [CrossRef]
- Lundy, Matt. 2021. A Devastatingly Poor Year: Why the Outlook for Business Travel Remains Bleak. The Globe and Mail. Available online: https://www.theglobeandmail.com/business/article-will-corporate-travel-rebound-in-2021-dont-count-on-it/ (accessed on 18 March 2021).
- Macdonell, Beth. 2020. Once in a Lifetime Rental Market Price Drop Leads to Crazy Incentives. CTV News. October 24. Available online: https://toronto.ctvnews.ca/once-in-a-lifetime-rental-market-price-drop-leads-to-crazy-incentives-1.5159306 (accessed on 15 March 2021).
- Milani, Fabio. 2021. COVID-19 outbreak, social response, and early economic effects: A global VAR analysis of cross-country interdependencies. Journal of Population Economics 34: 223–52. [Google Scholar] [CrossRef]
- Nanowski, Natalie. 2020. A Year in Real Estate Review: Toronto’s Biggest Trends of 2020. CBC News. December 20. Available online: https://www.cbc.ca/news/canada/toronto/toronto-realestate-ontario-homes-condo-pandemic-1.5847995 (accessed on 15 March 2021).
- Ozili, Peterson K., and Thankom Arun. 2020. Spillover of COVID-19: Impact on the Global Economy. Available online: https://papers.ssrn.com/sol3/papers.cfm?abstract_id=3562570 (accessed on 10 June 2021).
- Rapaccini, Mario, Nicola Saccani, Christian Kowalkowski, Marco Paiola, and Federico Adrodegari. 2020. Navigating disruptive crises through service-led growth: The impact of COVID-19 on Italian manufacturing firms. Industrial Marketing Management 88: 225–37. [Google Scholar] [CrossRef]
- Rojas, Felipe Lozano, Xuan Jiang, Laura Montenovo, Kosali I. Simon, Bruce A. Weinberg, and Coady Wing. 2020. Is the Cure Worse than the Problem Itself? Immediate Labor Market Effects of COVID-19 Case Rates and School Closures in the U.S. NBER Working Paper, 27127. Cambridge: National Bureau of Economic Research. [Google Scholar] [CrossRef]
- Roy, Hiran, Vikas Gupta, Anisur R. Faroque, and Alpa Patel. 2021. The impact of COVID-19 on the foodservice industry in Vancouver, British Columbia, Canada. Anatolia 32: 157–60. [Google Scholar] [CrossRef]
- Rymarczyk, Jan. 2020. Technologies, opportunities and challenges of the industrial revolution 4.0: Theoretical considerations. Entrepreneurial Business and Economics Review 8: 185–98. [Google Scholar] [CrossRef]
- Shestakofsky, Benjamin. 2017. Working algorithms: Software automation and the future of work. Work and Occupations 44: 376–423. [Google Scholar] [CrossRef]
- Svabova, Lucia, and Barbora Gabrikova. 2021. The rise in youth employment? Impact evaluation of COVID-19 consequences. Journal of Eastern European and Central Asian Research 8: 511–26. [Google Scholar] [CrossRef]
- Svabova, Lucia, and Katarína Kramarova. 2021. An analysis of participation factors and effects of the active labour market measure Graduate practice in Slovakia—Counterfactual approach. Evaluation and Program Planning 86: 101917. [Google Scholar] [CrossRef] [PubMed]
- Svabova, Lucia, Zdenko Metzker, and Tomasz Pisula. 2020. Development of unemployment in Slovakia in the context of the COVID-19 pandemic. Ekonomicko-Manazerske Spektrum 14: 114–23. [Google Scholar] [CrossRef]
- Tal, Benjamin. 2021. Canadian labour market dichotomy—Deeper than perceived. In Focus. Toronto: CIBC Economics, Available online: https://economics.cibccm.com/economicsweb/cds?ID=12030&TYPE=EC_PDF (accessed on 24 January 2022).
- UN. 2020. The Impact of COVID-19 on Women. Policy Brief. Available online: https://www.unwomen.org/-/media/headquarters/attachments/sections/library/publications/2020/policy-brief-the-impact-of-covid-19-on-women-en.pdf?la=en&vs=1406 (accessed on 10 June 2021).
- Yasenov, Vasil. 2020. Who Can Work from Home? Discussion Paper Series, 13197. Bonn: IZA Institute of Labour Economics. [Google Scholar]
- Zivitz, Noah. 2020. Toronto Home Prices Fall from Record as Condo Market Goes Cold. Toronto: BNN Bloomberg, Available online: https://www.bnnbloomberg.ca/toronto-home-prices-fall-from-record-high-as-condo-market-goes-cold-1.1530951 (accessed on 24 January 2022).


| 2016 | 2017 | 2018 | 2019 | 2020 | |
|---|---|---|---|---|---|
| Professional, scientific and technical services | 12% | 13% | 13% | 13% | 14% |
| Finance, insurance, real estate & leasing | 12% | 12% | 11% | 11% | 12% |
| Healthcare & social assistance | 11% | 11% | 11% | 12% | 12% |
| Retail trade | 9% | 10% | 10% | 9% | 10% |
| Educational services | 7% | 6% | 7% | 8% | 8% |
| Manufacturing | 9% | 8% | 8% | 8% | 7% |
| Construction | 6% | 6% | 6% | 6% | 6% |
| Accommodation & food services | 7% | 8% | 7% | 6% | 5% |
| Transportation & warehousing | 3% | 4% | 5% | 5% | 5% |
| Category | Criteria |
|---|---|
| Distressed | Negative change in the year over year employment levels (2020–2019) and 8 or more negative monthly year over year (2020–2019) decline in employment |
| Must be monitored | Negative change in the year over year employment levels (2020–2019) and 3–8 negative monthly year over year (2020–2019) change in employment |
| Stable | Positive change in the year over year employment levels (2020–2019) |
| 2016–2017 | 2017–2018 | 2018–2019 | 2019–2020 | # of Months of Negative Change | Category | Negative IRF Periods (Quarters) | Is the Impulse Persistent? | |
|---|---|---|---|---|---|---|---|---|
| (1) | (2) | (3) | (4) | (5) | (6) | (7) | (8) | |
| Accommodation & food services | 14% | −8% | −9% | −31% | 12 | Distressed | 5 | No |
| Manufacturing | −8% | 9% | −8% | −10% | 8 | Distressed | 9 | No |
| Retail trade | 4% | 7% | −8% | −6% | 5 | Must be monitored | 8 | No |
| Transportation & warehousing | 20% | 14% | 16% | −19% | 4 | Must be monitored | 3 | No |
| Healthcare & social assistance | −1% | −0.4% | 11% | −8% | 4 | Must be monitored | N/A | No |
| Construction | −1% | −3% | 8% | −8% | 3 | Must be monitored | 4 | No |
| Educational services | −8% | 10% | 13% | −9% | 3 | Must be monitored | 6 | No |
| Finance, insurance, real estate & leasing | −4% | −7% | 7% | 2% | 1 | Stable | 9 | No |
| Professional, scientific & technical services | 5% | 4% | 2% | 1% | 1 | Stable | 5 | No |
| January | February | March | April | May | June | July | August | September | October | November | December | |
|---|---|---|---|---|---|---|---|---|---|---|---|---|
| Month to month change | −2% | 4% | 0% | −40% | 19% | 41% | 1% | 0% | 8% | −1% | 0% | −9% |
| Year over year change | −7% | 1% | −11% | −43% | −39% | −9% | 1% | −7% | 2% | −5% | −1% | 1% |
Publisher’s Note: MDPI stays neutral with regard to jurisdictional claims in published maps and institutional affiliations. |
© 2022 by the authors. Licensee MDPI, Basel, Switzerland. This article is an open access article distributed under the terms and conditions of the Creative Commons Attribution (CC BY) license (https://creativecommons.org/licenses/by/4.0/).
Share and Cite
Singh, V.; Shirazi, H.; Turetken, J. The COVID-19 Era—Influencers of Uneven Sector Performance: A Canadian Perspective. Economies 2022, 10, 40. https://doi.org/10.3390/economies10020040
Singh V, Shirazi H, Turetken J. The COVID-19 Era—Influencers of Uneven Sector Performance: A Canadian Perspective. Economies. 2022; 10(2):40. https://doi.org/10.3390/economies10020040
Chicago/Turabian StyleSingh, Vikkram, Homayoun Shirazi, and Jessica Turetken. 2022. "The COVID-19 Era—Influencers of Uneven Sector Performance: A Canadian Perspective" Economies 10, no. 2: 40. https://doi.org/10.3390/economies10020040
APA StyleSingh, V., Shirazi, H., & Turetken, J. (2022). The COVID-19 Era—Influencers of Uneven Sector Performance: A Canadian Perspective. Economies, 10(2), 40. https://doi.org/10.3390/economies10020040