Article

Comparing Push and Pull Factors Affecting Migration

by
Mariusz Urbański
Road and Bridge Research Institute, ul. Instytutowa 1, 03-302 Warszawa, Poland
Economies 2022, 10(1), 21; https://doi.org/10.3390/economies10010021
Submission received: 4 December 2021 / Revised: 1 January 2022 / Accepted: 4 January 2022 / Published: 10 January 2022

Abstract

:
The purpose of this research was to conduct a comparison of the push and pull factors affecting migration between Poland and Romania. The study aimed to find out which among the push and pull factors have a greater effect overall and individually on the migration activities. The study was conducted using primary data collected from migrants in both countries using a structured questionnaire. There were data from 298 and 288 surveys for Poland and Romania, respectively. The push and pull migration framework was applied to guide the study. The model suitability was confirmed satisfactory on validity, reliability and factor analysis. The hypothesis was analyzed and evaluated using multiple regression analysis. The findings of the study indicated that pull factors have a greater influence on migration in these two countries as compared to the push factors. Five out of six (economic, political and social in Poland and economic and political in Romania) pull factors were found significant as compared to two (social in Poland and in Romania) out of six push factors. Pull economic factors were significant determinants of migration in all the countries. Pull political factors were found to have the highest effect in both countries, because they influenced migrants in Romania. Economic factors are the major factors that influence migration, including the hope of finding better jobs and better life in the foreign countries, and these factors should be addressed in the effort to reduce migration. In addition, political issues such as unfair legal system, violent conflicts, underdevelopment, poverty, political instability and corruption should be addressed to control the issue of migration.

1. Introduction

The concept of migration involves the process whereby individuals leave their own countries and become permanent residents of other countries. Annually, millions of people from around the world immigrate to other countries to become citizens. Trends on migration rates continue to increase over time. In 2012, the Gallup survey estimated that there were an approximated 640 million individuals willing to migrate to other countries. Many of the migrants preferred the US (up to 23%) as their desired residence. Other destinations of choice for global immigrants included countries such as the UK, UAE, Romania, Germany, Spain, Italy and other European countries (Nghia 2019).
The phenomenon of migration has been in existence for centuries and is driven by aspects of economics, natural disasters, social-political factors, demographic increase and urbanization, wars and family reunification factors. Zanabazar et al. (2021) clarify that there are various pull and push factors that influence migration. The pull factors refer to the aspects that attract migrants to a region or country. For instance, the pull factors influencing migration include economic factors such as employment opportunities, better shelter and higher standards of living.
Pull factors also include social and political factors such as better healthcare facilities, religious tolerance and freedom from persecution. The push factors influencing migration around the world also include economic factors such as lack of employment, low standards of living and lack of food and shelter (Carbajal and Calvo 2021; Khalid and Urbański 2021). The social factors influencing push migration include lack of healthcare and lack of religious tolerance, among other social factors. Political push factors influencing migration also include aspects of war and terrorism, unfair legal systems and lack of governmental tolerance. Research by Parkins (2010) indicates that the global migration has been on the rise in the last two decades by an estimated 35% overall. The continued increases in global migration are driven by the increasing push and pull migration factors.
Poland is one of the European countries that experience low levels of migrants. Despite the already high number of migrants to Poland, the number has been on a steady increase since the 2000s (Alscher 2017). Many of the migrants to Poland are from neighboring European countries including Germany, Russia, Belarus and Turkey. Other migrants are from non-European countries, including Vietnam and China. According to knoema.com (2020), immigrants in Poland made up about 5% of the country’s population in 2020, amounting to an estimated 2 million individuals.
Migrants to Poland are influenced by economic factors, including employment opportunities. In 2019, the labor ministry in Poland indicated that there was a 35% increase in work permits issued to the migrants from outside the EU. Kaczmarczyk et al. (2014) avers that the number of migrants in Poland continues to remain stable with the scale of migration peaking in 2006. Many of the migrants to Poland consisted of refuge and asylum seekers from war conflict areas such as Chechnya (Ambroziak and Schwabe 2016). Other migrants to the country came from countries outside the EU, such as India, influenced by the need for employment opportunities (Strzelecki et al. 2021).
For Romania, migration has resulted from the need to have a balanced labor market. The lack of Romanian specialists has resulted in attracting highly qualified migrants to the country. Migration policies have also been developed and enhanced to encourage and facilitate access to the Romanian internal labor market. It is important to note that, as compared to other countries in the European Union, Romania is a less common country for migration.
The statistics indicate that 1.2% of Romania’s population is foreign, among whom 0.9% originate from its EU members. However, in the recent past, Romania has experienced an increase in migration, especially of people from Turkey, Italy, Southeast Asia and East Asia (Baas et al. 2014). From this literature, we can infer some salient information in the migration pattern between Poland and Romania, while economic reasons are still integral to migration, there is more migration towards Poland compared to Romania. The latter uses migration to achieve a balance labor market while for Poland, it is more about economic reasons.

2. Literature Review

2.1. Theory on Push and Pull Factors of Migration

The phenomenon of human migration has been in existence since the beginning of human existence. Migration is understood as the permanent change in residence for individuals. Everett Lee theorized that the migration is selective and is influenced by pull and push factors (Faridi 2018). According to Lee, the decisions to migrate can be categorized into factors associated with areas of origin, factors associated with the destination area, intervening obstacles and personal factors (Bean and Brown 2014). Migration thus can be considered as a shrewd decision by individuals to benefit from opportunities not sufficient in their homeland.
The push factors influencing migration involve conditions that force individuals to leave their homes. The push factors influencing migration can be categorized into economic, social and political factors. The economic factors influencing migration include lack of employment. Ibrahim et al. (2019) states that few jobs and overpopulation of developing countries contribute to push migration to developed countries (Hatch 2016). Low living standards are another factor that drives migration. Migrants make decisions to migrate to other countries in search of opportunities to improve their lives and those of their families. Migration to developed countries offers opportunities for migrants to improve their incomes and ease their market participation (Llull 2017). The other economic factors driving migration include natural disasters such as floods that devastate the means of income and create a scarcity of food and shelter arising from the wreckage.
Various social factors also drive push migration. For instance, the lack of established health care systems also contributes to individuals’ hopes to seek better healthcare in other countries (Novotná 2010). For instance, in the UK, hospital treatment is free for individuals who are residents in the country. Other social factors pushing migration include the lack of educational opportunities and lack of religious tolerance. Political factors also contribute to migration (Doerschler 2006). For instance, aspects of unfair legal systems, war and terrorism and bad governance contribute to individuals seeking better political environments in other countries (Doerschler 2006; Dustmann and Frattini 2014; Wadsworth 2011).
The pull factors to migration are the opposite of push factors, and they involve the various aspects that attract people to certain location. Similar the push factors, pull factors can also be categorized into economic, social and political migration pull factors. According to Zoelle (2011), economic factors that pull migrants include indices such as hope for better employment, better shelter, more income and food, and higher living standards. For example, based on the better life index, the UK performs well in most measures relative to many developing countries, thus making it a destination of choice for many migrants seeking better economic standards.
Similarly, various social and political factors contribute to the pulling of migrants to other regions or countries. Social factors such as religious tolerance and better educational opportunities in some countries contribute to the pull of migrants. Some of the social factors that pull migrants to developed countries such as the US and other European countries include better health care and increased religious tolerance. Some of the political pull factors influencing migration also include factors such as the right to vote and freedom from persecution and improved protection under the law and safety.

2.2. Empirical Literature
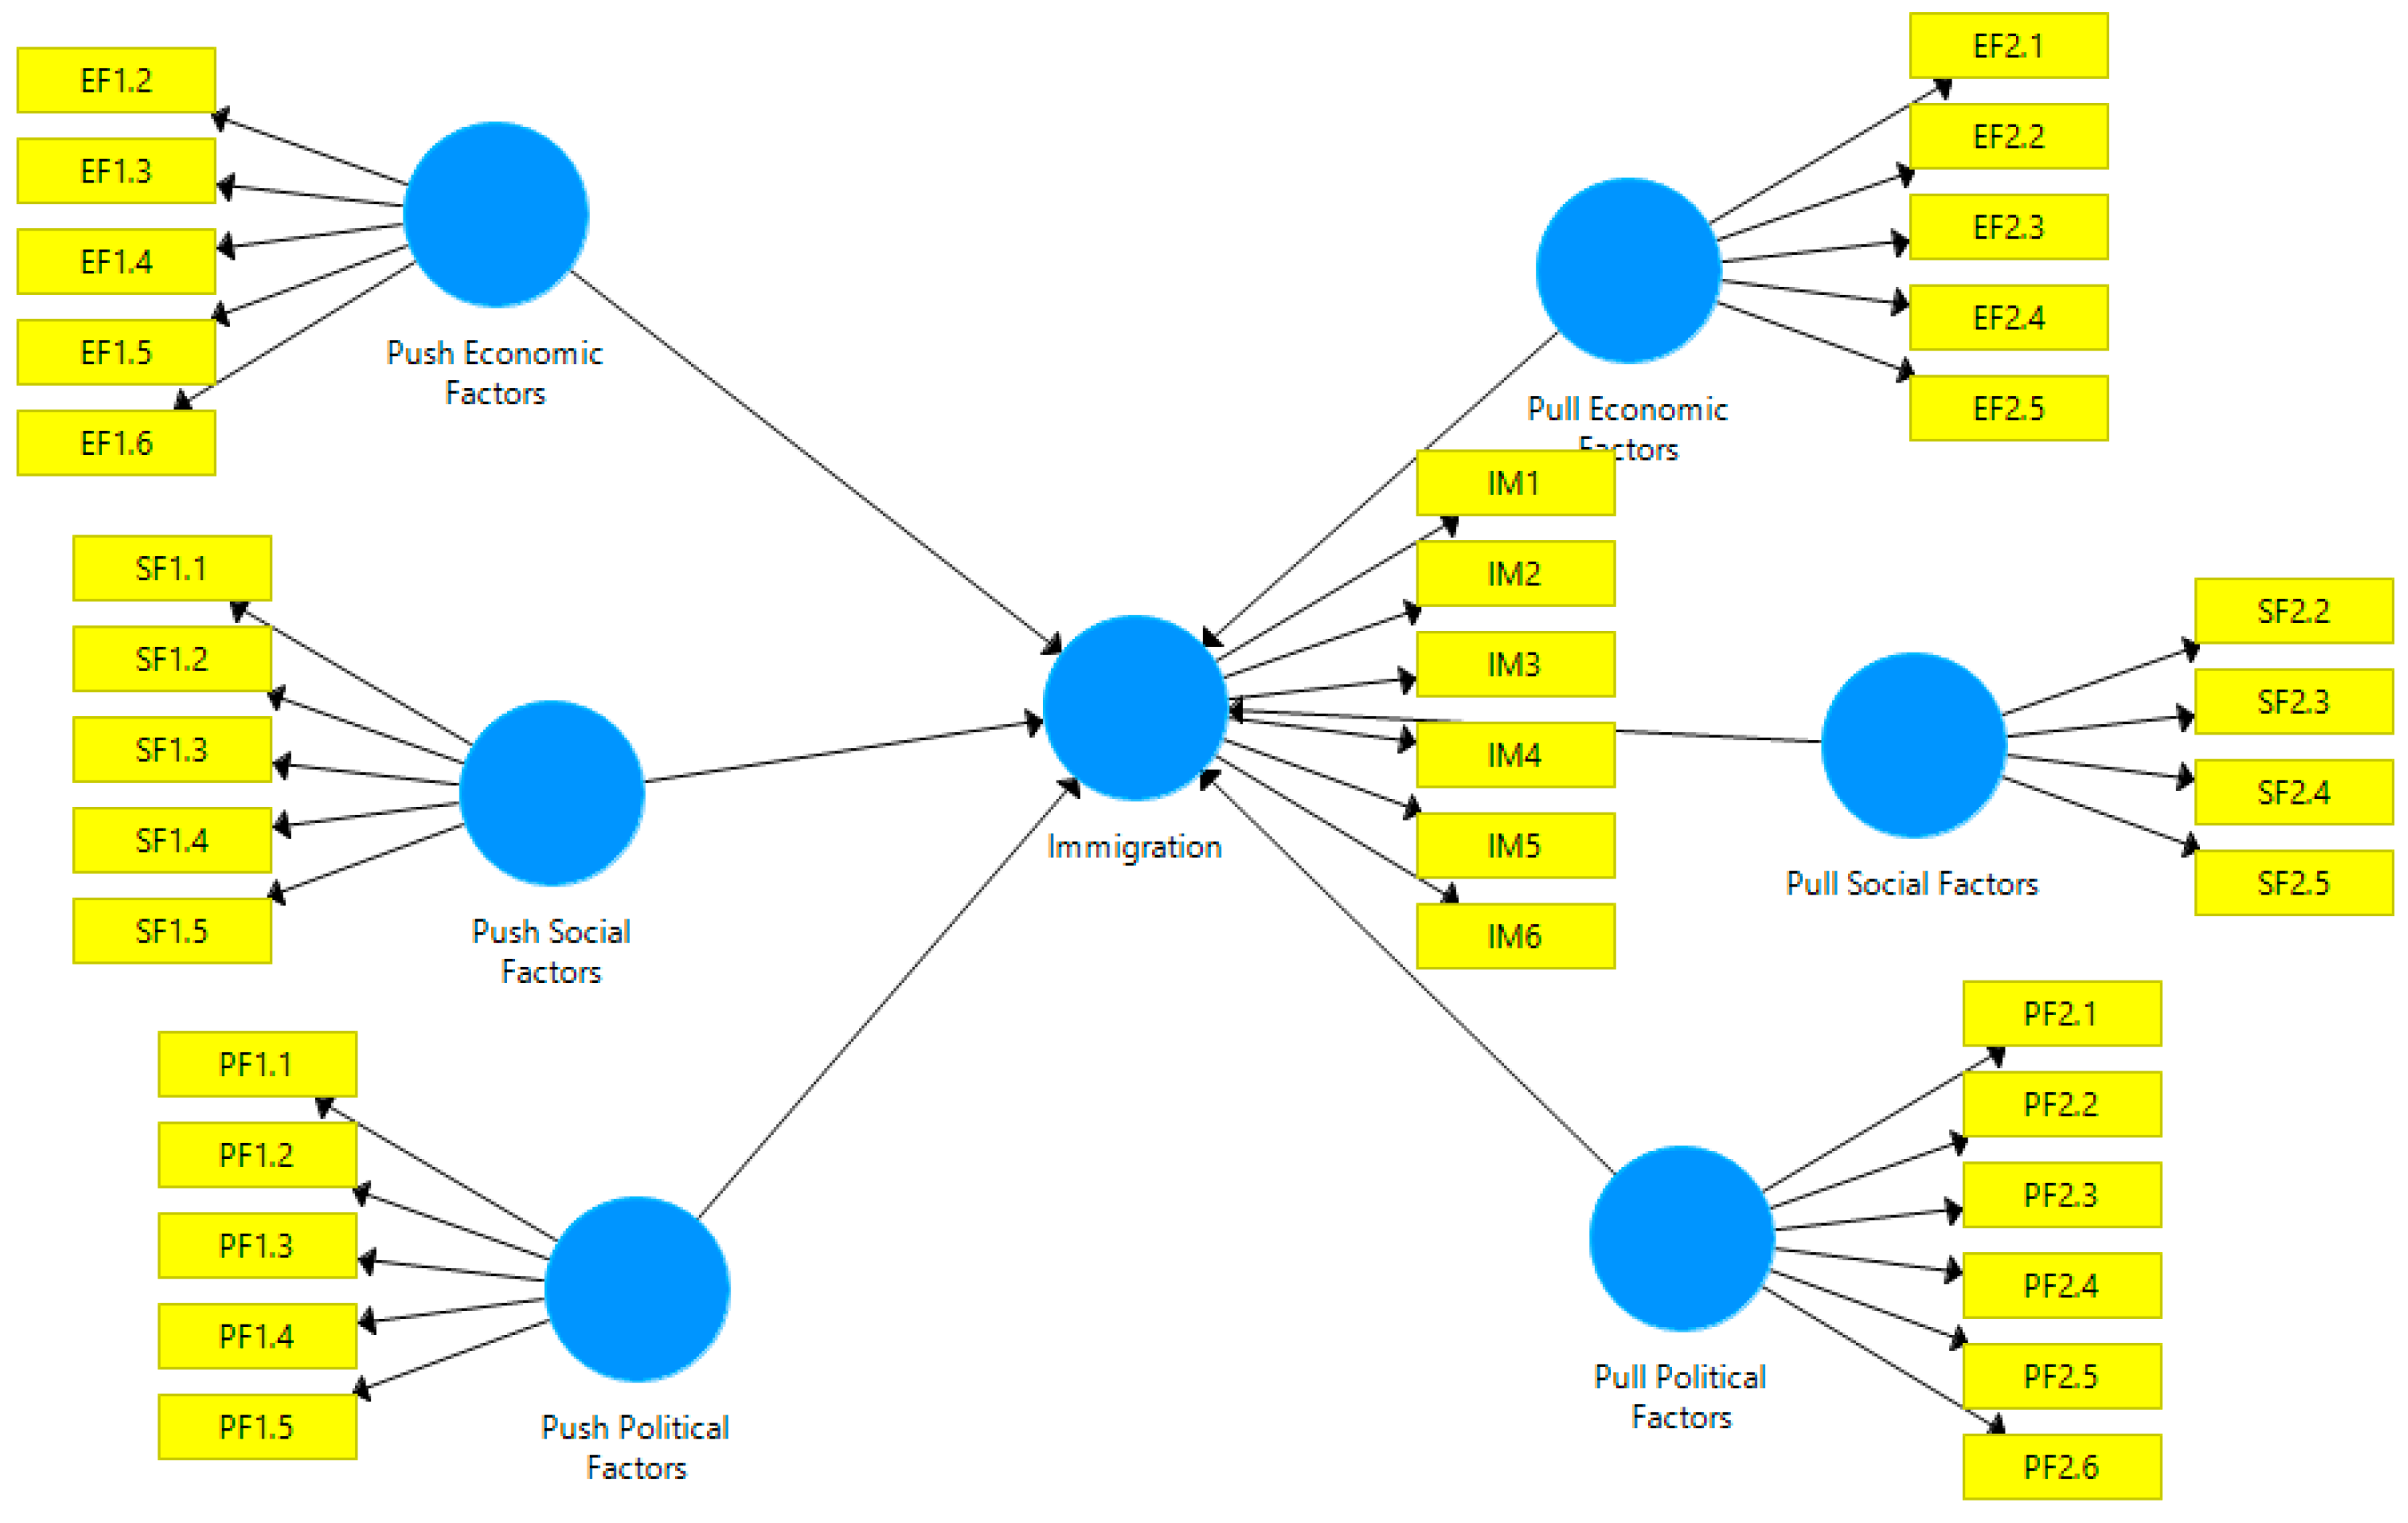
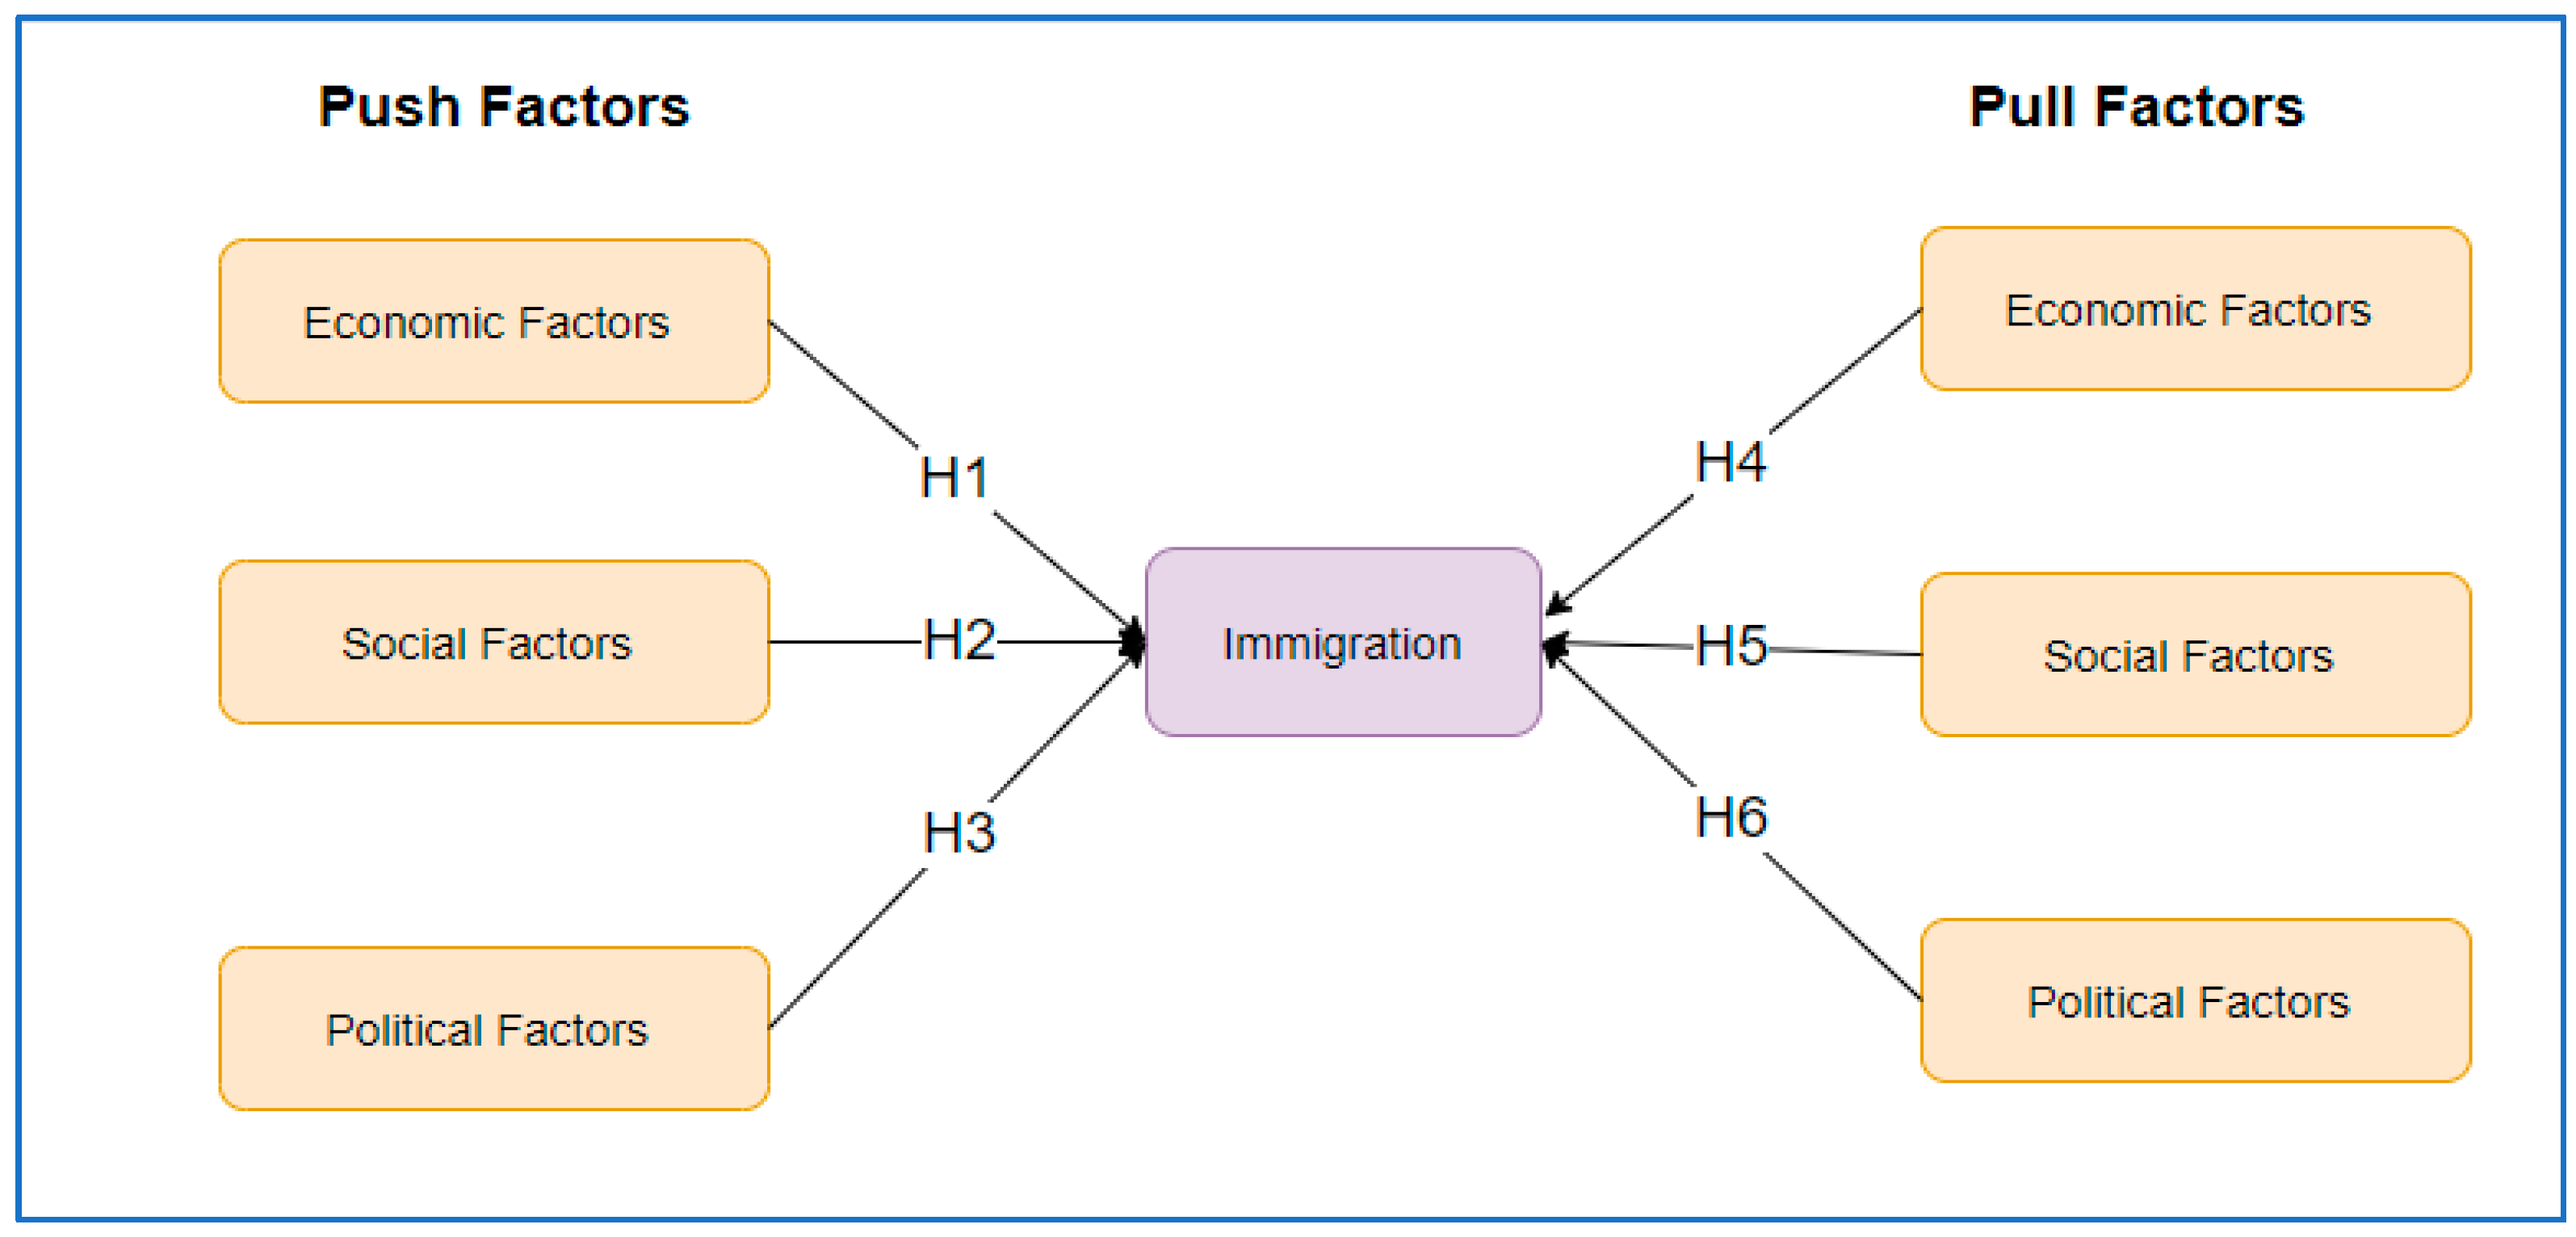
Various studies have been conducted in the past on the factors affecting migration. In the study by Oltman and Renshon (2017), the authors state that socio-political, economic and ecological factors are the main driving factors behind migration. The economic disparity between developed and developing countries is of the contributing factors that push migrants from poor countries to migrate to developed countries. On the other hand, economic aspects in developed countries such as need for labor also lure migrants seeking better employment opportunities.
Arenas (2021) investigated human capital portability and international student migration. The study was geared to evaluate the reforms that lifted the requirements to take the Spanish end-of-high school exams for foreign students from a subset of countries. The research indicated that multilateral diploma recognition can significantly increase international student migration without large costs in student migrant quality and with positive effects on average student quality. Shih (2016) elucidates that international students have historically been an important dynamic in the discourse about international student enrollment in US universities. Friedberg (2000) adds that the national origin of an individual’s human capital is a crucial determinant of its value. Thus, the education and job experiences attained abroad are substantially valued less than domestically acquired human capital. This is why migrants earn less than natives in many instances. Migrants minimize this impact by acquiring additional education experience in the country of migration to boost their earning appeal.
Nejad and Young (2016) investigated migrants’ self-selection according to the institutional quality. These were based on political and economic differences. The study found that economic freedoms have a significant pull factor for potential migrants. The article also indicated that potential migrants are highly pulled by improvements in legal systems and property rights. Gautam (2021) explored the impact of regional and global trade integration on international migration and its effects on the home country and found evidence of the negative effect of migration on the home country’s economic institutions, especially those with fragile political institutions. To buttress the relevance of a working social system, Schulzek (2012) inferred that the availability of better welfare benefits is one of the major factors that drives migration. From another dimension, Charsley and Shaw (2006) elaborated on the role of encouragement by family members seeking to reunite with migrated relatives has been quoted as a major reason for migration.
Dail (1988) suggests that social factors play a role in individuals’ decisions to migrate to other countries. Migrants from developing countries such as South American countries are often pushed by social factors such as poverty, lack of employment opportunities, education and housing to migrate to countries such as the US. Carbajal and Calvo (2021) also explains that the social factors pushing migration are based on the human desire to achieve better quality of life. Migrants are pushed by social factors such as the need for better education for themselves and their families. For instance, the US offers graduate programs that attract young migrants from around the world (justiceforimmigrants.org 2017).
Various political factors contribute to the increased migration around the world. According to Chandler and Tsai (2001), political incidents such as economic stagnation, civil wars and political revolutions often push individuals to migrate to regions with safe political environments (Hadj Abdou 2020). Safety concerns contribute to the decisions to migrate to other countries. Often, persecution based on individuals’ beliefs also contributes to migrants’ decisions to migrate. In 2016, for instance, the increased criminal activities in the South American countries of Guatemala, Honduras and El Salvador contributed to pushing up to 10% of the population from this region to migrate to safer countries such as the US and Mexico.

2.3. Proposed Model

The push and pull factors are summarized on Table 1, and Figure 1 presents the diagram of the proposed model, showing the relationship of the independent and dependent variables. Table 1 lists the inherent observed variable of the latent variables.
Hypotheses of the study
The following were the hypothesis formulated within the framework of the study:
Hypothesis 1 (H1).
Economic factors are significant push factors for migration.
Hypothesis 2 (H2).
Social factors are significant push factors for migration.
Hypothesis 3 (H3).
Political factors are significant push factors for migration.
Hypothesis 4 (H4).
Economic factors are significant pull factors for migration.
Hypothesis 5 (H5).
Social factors are significant pull factors for migration.
Hypothesis 6 (H6).
Political factors are significant pull factors for migration.

3. Methodology

Migration refers to the action of a foreigner moving to live in another country permanently. For this study, the focus was on those people who have migrated to live in Poland and Romania for various reasons. Additionally, the research intended to find out what the push and pull factors are that drive migration activity. Therefore, this research adopted a descriptive research model, where the primary data were collected from the people who had migrated into these countries.
The data were collected using a structured questionnaire among the migrants living and working in Poland and Romania. A similar questionnaire was distributed in both the countries to ensure congruence in the data that were collected. The questionnaire contained two major sections: The first section had questions to collect the demographic characteristics of the respondents. The second section contained questions regarding the push and pull factors of migration. The questions were framed using 5-Point Likert scale where 1 = strongly disagree and 5 = strongly agree. The data were collected between 1 June 2021 to 24 August 2021. For each country, there were 600 questionnaires distributed, and 298 and 288 were returned for Poland and Romania, respectively, that were considered suitable for conducting the analysis.
Several techniques were used to conduct data analysis. The first analysis was descriptive statistics of the respondents to understand their demographic characteristics. The second analysis was to check the suitability of the data for the model analysis. The prior analysis included reliability tests, validity tests and correlation analysis. The actual analysis was the hypothesis test, which was carried out using multiple regression analysis. The analysis was conducted using the SPSS version 20, manufactured by IBM, headquartered in New York City, NY, USA.

3.1. Descriptive Statistics of the Data

We first evaluated the demographic characteristics of the respondents. Four demographic characteristics of the respondents were evaluated, which included the age, gender, time stayed in the foreign country and the status of the migrants. The results are presented and discussed below for each of the countries.

3.2. Demographic Characteristics for Romania

This section evaluated the demographic characteristics for Romania. The gender variables indicated that males were the majority of migrants to Romania, representing 67%, and females were the least, with 33%. For the age variable, the majority of the migrants were 40–50 years (42%) followed by above 50 years (29.2%) and then 20–30 years (18.8%). The other variable evaluated was the time of settling in Romania, where the majority have lived there for 1–2 years (34%) followed by those who have lived in Romania for 3–5 years (33.7%). The last variable evaluated was the status of the migrants, where the majority were employed (33.3%) followed by students (30.2%) and then those who were permanent residents in Romania (25.3%). The data are presented in Table 2.

3.3. Demographic Characteristics of Poland

The gender variables indicated that the majority migrants in Poland were males, representing 61.1%, and females were the least, with 38.9%. For the age variable, the majority of migrants were 30–40 years (36.2%), followed by above 20–30 years (28.9%) and then 40–50 years (28.2%). The other variable evaluated was the time of settling in Poland, where the majority was those stayed there for 3–5 years (29.2%) followed by those who have stayed in Poland for 1–2 years (24.8%). The last variable evaluated was the status of the migrants, where the majority were employed (30.9%) followed by students (29.5%) and then those who were permanent residents as tourists (24.8%). The data are presented in Table 3.
Table 4 presents the correlation analysis of the pull and push factors for both Romania and Poland, while Figure 2 shows the constructs applied in analyzing the push and pull variables in the study. The results indicate that Romania observed a significant and positive correlation among the push and pull factors. In addition, for Poland, the statistics indicate that there was a significant and positive correlation among all push and pull factors.

4. Results

The reliability and validity analyses were evaluated using Cronbach’s alpha, Composite reliability (CR), Rho A, and average variance extracted (AVE). These results were evaluated differently for each country, including the discriminant validity of the study data. Results for Romania and Poland are presented in Table 5, Table 6, Table 7 and Table 8.
According to the threshold proposed by Fornell and Larcker (1981) and Hair et al. (2014), AVE should be greater than 5.0, and factor loadings, Cronbach’s alpha and CR should be greater than 7.0. From the results presented in table above, all factor loadings, Cronbach’s alpha, Rho A and composite reliability (CR) were above 0.7, while the average variance extracted was above 0.5. The results show that all the thresholds were met, confirming the suitability of the model’s validity and reliability. In addition, the discriminant validity of the data was also determined. Its purpose was to evaluate whether the concepts or measures that were considered to be unrelated were indeed unrelated. The Fornell–Larcker criterion (Fornell and Larcker 1981) suggests that the square root value of AVE should be greater than the corresponding correlation values with other variables. Evaluating the discriminant validity variables presented in Table 6 above, this criterion was satisfied for the data Romania data used the analysis.
For the Poland data, validity and reliability analysis was carried out using identical thresholds proposed by Fornell and Larcker (1981), and Hair et al. (2014), AVE should be greater than 5.0, factor loadings, Cronbach’s alpha and CR should be greater than 7.0. From the results presented in table above all factor loadings, Cronbach’s alpha, Rho A, and composite reliability (CR) was above 0.7, while the average variance extracted was above 0.5. The results shows that all the thresholds were met, confirming the suitability of the model’s validity and reliability. In addition, the discriminant validity of the data was also conducted (see Table 8). Its purpose was to evaluate whether the concepts or measures which were supposed to be unrelated were unrelated. The Fornell–Larcker criterion (Fornell and Larcker 1981) suggests that the square root value of AVE should be greater than the corresponding correlation values with other variables. Evaluating the discriminant validity variables presented in Table 8 shows that this criterion was satisfied for the data used in the analysis.
Evaluation of the study hypotheses
The major goal of this research was to evaluate the study hypothesis. The hypotheses were to evaluate which among push and pull factors influenced the migration activities to the nations of Poland and Romania. The analysis of the hypotheses was conducted and is discussed individually using the SPSS version 20, manufactured by IBM, headquartered in New York City, NY, USA. The results are discussed in the following section.
Hypotheses Analysis for Poland
The regression analysis for Poland was used to find out which push and pull factors have a significant and positive effect on migrations to Poland. In this analysis, the dependent variable was migration, while the independent variables were push political factor, push social factor, push economic factor, pull political factor, pull social factor and pull economic factor. The results indicated that R-squared was 0.644, while the adjusted R-squared was 0.636, which indicated that 63.6% of the variation in migration to Poland was explained by the push and push variables included in the model. The remaining 36.4% was explained by the factors not included in the model. The analysis of variance (ANOVA) results indicated that there was a significant effect of pull and push factors on migrations to Poland F(6, 291) = 87.615, p = 0.000. The individual effects for pull and push factors are summarized in Table 9.
The regression analysis indicated that for the push factors, migration was positively and significantly influenced by push social factors (β = 0.158, p = 0.017), supporting Hypothesis 2 (H2). However, migration was not significantly influenced by economic and political factors, so we can reject H1 and H3. For the pull factors, migration in Poland is influenced by economic factors (β = 0.188, p = 0.005), supporting Hypothesis 4 (H4); social factors (β = 0.1762, p = 0.001), supporting Hypothesis 5 (H5); and political factors (β = 0.312, p = 0.000), supporting Hypothesis 6 (H6).
Hypothesis Analysis for Romania
In this analysis, the dependent variable was migration, while the independent variables were push political factor, push social factor, push economic factor, pull political factor, pull social factor and pull economic factor. The results for Romania indicated that R-squared was 0.879, while adjusted R-squared was 0.769, which indicated that 76.9% of the variation in Romanian migration was explained by the push and push variables included in the model. The remaining 23.1% was explained by the factors not included in the model. The analysis of variance (ANOVA) results indicate that there was a significant effect of pull and push factors on Poland migration F(6, 281) = 151.930, p = 0.000. The individual effects for pull and push factors are summarized in Table 10.
The regression analysis indicates that for the push factors, migration was positively and significantly influenced by push political factors (β = 0.128, p = 0.000), supporting Hypothesis 3 (H3). However, economic and social factors were found to have insignificant factors, which led to the rejection of H1 and H2. For the pull factors, migration in Romania was found to be influenced by economic factors (β = 0.137, p = 0.001), which led to confirmation of Hypothesis 4 (H4), and political factors (β = 0.612, p = 0.000), which led to confirmation of Hypothesis 6 (H6). However, social factors were found to have an insignificant effect on migration, which led to rejecting Hypothesis 5.

5. Discussion

The purpose of this research was twofold—to find out which factors among the push and pull factors had significant effects on migration and to compare these factors between Poland and Romania. The results of the findings are summarized in Table 11.
From the summary of the hypothesis presented in Table 10, interesting observations can be highlighted. The first observation is in the comparison of which was found to have more effects on migration: push factors (factors that make you want to leave) and pull factors (factors that draws you to live in a place). From the findings, it was found that pull factors have a greater influence on migration in the two countries compared to the pull factors. The reason for this observation is that five out of six (economic, political and social in Poland and economic and political in Romania) pull factors were found to be significant as compared to two (social in Poland and in Romania) out of six push factors. This implies that, migration is a result of being attracted to a foreign country compared to being forced out of a country. Within this factor, aspects such as “hope for better shelter”, “hope for better employment”, “safety” and “hope for better healthcare” attract people to foreign countries resulting in migration.
The next aspect to consider is which factors had the highest drive to migration in each of the push and pull factors. For the pull factors, the results indicate that pull economic factors were significant determinants of migration in the two countries. In this case, the specific economic factors included “hope for better employment”, “more money and food” and “better shelter” and “hope for family to have a higher standard of living”. These findings are in line with Dzvimbo (2003), which indicated that the hope for a better employment and better life are the major reasons that trigger migration to more developed countries. In addition, pull social and pull political factors were found to have a significant influence on migration. Push social factors were significant in Poland (Urbański 2021). The social factors included “encouragement from family and friends”, “better health care” and “better educational opportunities”. These findings are in line with the findings of Schulzek (2012) who indicated that availability of better welfare benefits is the major reasons that drives migration. Similarly, encouragement by family members for reuniting has been quoted as a major reason for migration by Charsley and Shaw (2006).
Considering the push factors, the push political factors were found to have the highest effect in both countries, and they especially influenced migrants in Romania. The specific political factors included “war and terrorism”, “unfair and bad government” and “unfair legal system”. These findings are in line with previous studies showing that violent conflicts, underdevelopment, poverty, political instability and corruption have forced many people to move from their countries, especially from Middle Eastern and African countries (Dinbabo and Carciotto 2015; Paddon and Lacaille 2011). It is also important to note that push social factors influenced migration in Poland.

6. Conclusions

This research was focused on comparing push and pull factors affecting migration to Poland and Romania. The data were collected from each of the two countries and analyzed using multiple regression analysis. The research was guided by the hypothesis that evaluated the effects of each push and pull factor to migration in the countries. Evaluation of the suitability of the data confirmed that their validity and reliability were satisfactory. From evaluating the hypothesis of the study, several conclusions can be made. The research found out that, between push factors (factors that make you want to leave) and pull factors (factors that draws you to live in a place), pull factors have a greater influence on migration in the two countries as compared to the push factors. Another finding is that among the pull factors considered, economic factors (prospects for higher wages, improved living standards, personal development, job opportunities, good welfare standards and labor demands) were found to have the highest influence on migration in both countries. For push factors, political factors (conflicts, corruptions, poor governance, human rights abuse, bad governance and terrorism) had the highest effect on migration as compared to other factors. The research also conclude that pull social and pull political factors has greater influence in two countries studied. Overall, the economic and political factors were found to be the major factors that influence migration in all the countries considered. The research was limited by the availability of the data collected, as some sample sizes were considered small. The research was carried out in two countries, and it is expected that the reason for migration is quite variant. Therefore, this should be considered when generalizing the findings of the study.

Practical and Theoretical Implications

Considering the theoretical implications, this study is considered to have contributed significantly towards existing theoretical content regarding the push and pull effects of migration. The study cultivated the aspect of push and pulls effects of migration and compared two different countries of Poland and Romania. This is considered an expounded theoretical evaluation on which future studies could expand. This study established that economic factors are the major factors that influence migration, including limited job opportunities, and especially among those with skills in developing countries and the hope of finding better jobs and better life in the foreign countries. Therefore, these are the factors that should be addressed in the effort to reduce migration. Another practical implication is that political factors, both pull and push, have greater influence on migration. It is therefore recommended that addressing political issues such as war and terrorism, unfair and bad government, unfair legal system, violent conflicts, underdevelopment, poverty, political instability and corruption would help to address the issues that lead to migration.

Funding

This research received no external funding.

Conflicts of Interest

The authors declare no conflict of interest.

References

  1. Ambroziak, Adam A., and Schwabe Michal. 2016. Factors influencing immigration to Poland as an EU member state. Yearbook of Polish European Studies 19: 151–85. [Google Scholar]
  2. Alscher, Stefan. 2017. Knocking at the Doors of “Fortress EUROPE”: Migration and Border Control in Southern Spain and Eastern Poland. Working Paper 126. Available online: http://ccis.ucsd.edu/_files/wp126.pdf (accessed on 13 February 2021).
  3. Arenas, Andreu. 2021. Human capital portability and international student migration. Journal of Economic Geography 21: 195–229. [Google Scholar] [CrossRef]
  4. Baas, Timo, Mikkel Barslund, Matthias Busse, Béla Galgóczi, Mario Izquierdo Peinado, Juan F. Jimeno, Pawel Kaczmarczyk, Aitor Lacuesta, Janine Leschke, and Carlos Vargas-Silva. 2014. Labour Mobility in the EU: Dynamics, Patterns and Policies. Intereconomics 49: 116–58. [Google Scholar]
  5. Bean, Frank, and Susan Brown. 2014. Demographic analyses of immigration. In Migration Theory: Talking across Disciplines. Edited by Caroline B. Brettell and James F. Hollifield. Singapore: Taylor and Francis, pp. 79–101. [Google Scholar]
  6. Carbajal, Maria Jose, and Jesus Maria de Miguel Calvo. 2021. Factors that influence immigration to OECD member States. Cuadernos de Trabajo Social 34: 417–30. Available online: link.gale.com/apps/doc/A669165126/IFME?u=anon~fda4c11c&sid=googleScholar&xid=78f62dea (accessed on 17 August 2021). [CrossRef]
  7. Chandler, Charles, and Yung-mei Tsai. 2001. Social factors influencing immigration attitudes: An analysis of data from the General Social Survey. The Social Science Journal 38: 177–88. [Google Scholar] [CrossRef]
  8. Charsley, Katharine, and Alison Shaw. 2006. South Asian transnational marriages in comparative perspective. Global Networks 6: 331–44. [Google Scholar] [CrossRef]
  9. Dail, Paula. 1988. Immigration and migration in America: Social impact and social response. International Migration 26: 441–52. [Google Scholar] [CrossRef] [PubMed]
  10. Dinbabo, Mulugeta, and Sergio Carciotto. 2015. International migration in Sub-Saharan Africa (SSA): A call for a global research agenda. African Human Mobility Review 1: 154–77. [Google Scholar] [CrossRef]
  11. Doerschler, Peter. 2006. Push-pull factors and immigrant political integration in Germany. Social Science Quarterly 87: 1100–16. [Google Scholar] [CrossRef]
  12. Dustmann, Christian, and Tommaso Frattini. 2014. The fiscal effects of immigration to the UK. The Economic Journal 124: F593–F643. [Google Scholar] [CrossRef]
  13. Dzvimbo, Kuzvinetsa Peter. 2003. The International Migration of Skilled Human Capital from Developing Countries. Available online: http://www.geocities.ws/iaclaca/PushAndPullFactorsWorldBankReport.pdf (accessed on 23 May 2021).
  14. Faridi, Rashid. 2018. Migration Theories: Lee’s Push Pull Theory. Available online: https://rashidfaridi.com/2018/04/05/migration-theories-lees-push-pull-theory/ (accessed on 13 February 2021).
  15. Fornell, Claes, and David F. Larcker. 1981. Evaluating structural equation models with unobservable variables and measurement error. Journal of Marketing Research 18: 39–50. [Google Scholar] [CrossRef]
  16. Friedberg, Rachel Miriam. 2000. You can’t take it with you? Immigrant assimilation and the portability of human capital. Journal of Labor Economics 18: 221–51. [Google Scholar] [CrossRef] [Green Version]
  17. Gautam, Durga. 2021. Does international migration impact economic institutions at home? European Journal of Political Economy 69: 102007. [Google Scholar] [CrossRef]
  18. Hadj Abdou, Leila. 2020. Push or pull’? Framing immigration in times of crisis in the European Union and the United States. Journal of European Integration 42: 643–58. [Google Scholar] [CrossRef]
  19. Hair, Joseph F., William C. Black, Barry J. Babin, and Rudolph E. Anderson. 2014. Multivariate Data Analysis, 7th ed. Upper Saddle River: Prentice-Hall, Inc. [Google Scholar]
  20. Hatch, Patricia. 2016. What motivates immigration to America? The League of Women Voters. Available online: https://docplayer.net/20795057-What-motivates-immigration-to-america-by-patricia-hatch.html (accessed on 23 May 2021).
  21. Ibrahim, Halah, Fatema Zain Al Sharif, Karthyayani Priya Satish, Lina Hassen, and Satish Chandrasekhar Nair. 2019. Should I stay or should I go now? The impact of “pull” factors on physician decisions to remain in a destination country. The International Journal of Health Planning and Management 34: e1909–20. [Google Scholar] [CrossRef]
  22. justiceforimmigrants.org. 2017. Root Causes of Migration. Available online: https://justiceforimmigrants.org/what-we-are-working-on/immigration/root-causes-of-migration/ (accessed on 12 May 2021).
  23. Kaczmarczyk, Paweł, Paweł Dąbrowski, Agnieszka Fihel, and Renata Stefańska. 2014. Recent Trends in International Migration in Poland: The 2012 SOPEMI Report (No. 71/129). CMR Working Papers. Available online: https://www.econstor.eu/bitstream/10419/140854/1/788000845.pdf (accessed on 9 May 2021).
  24. Khalid, Bilal, and Mariusz Urbański. 2021. Approaches to understanding migration: A multi-country analysis of the push and pull migration trend. Economics and Sociology 14: 249–74. [Google Scholar] [CrossRef]
  25. knoema.com. 2020. Poland-Net Migration Rate. Available online: https://knoema.com/atlas/Poland/topics/Demographics/Population/Net-migration-rate (accessed on 11 May 2021).
  26. Llull, Joan. 2017. The effect of immigration on wages: Exploiting exogenous variation at the national level. Journal of Human Resources 53: 608–22. [Google Scholar] [CrossRef] [Green Version]
  27. Nejad, Maryam Naghsh, and Andrew Young. 2016. Want freedom, will travel: Emigrant self-selection according to institutional quality. European Journal of Political Economy 45: 71–84. [Google Scholar] [CrossRef] [Green Version]
  28. Nghia, Tran Le Huu. 2019. Motivations for studying abroad and immigration intentions: The case of Vietnamese students. Journal of International Students 9: 758–76. [Google Scholar] [CrossRef] [Green Version]
  29. Novotná, Tereza. 2010. Immigration to the US through the Mexican Perspective: Examining the Push Factors before and after Nafta. Bachelor thesis, Charles University, Faculty of Social Sciences, Department of North American Studies, Prague, Czechia. [Google Scholar]
  30. Oltman, Anna, and Jonathan Renshon. 2017. Immigration and foreign policy. In Oxford Research Encyclopedia of Politics. Oxford: Oxford University Press. [Google Scholar] [CrossRef]
  31. Paddon, Emily, and Guillaume Lacaille. 2011. Stabilising the Congo. Briefing Paper, No. 8. Oxford: The Refugee Studies Centre, Oxford Department of International Development, University of Oxford, Available online: https://www.rsc.ox.ac.uk/files/files-1/pb8-stabilising-congo-2011.pdf (accessed on 15 April 2021).
  32. Parkins, Natasha C. 2010. Push and pull factors of migration. American Review of Political Economy 8: 6. [Google Scholar] [CrossRef]
  33. Schulzek, Nina. 2012. The Impact of Welfare Systems on Immigration: An Analysis of Welfare Magnets as a Pull-Factor for Asylum Seekers and Labour Migrants. Working Paper, 2. London: London School of Economics and Political Science, Available online: http://www.lse.ac.uk/government/Assets/Documents/pdf/research-groups/msu/WP-2012-02.pdf (accessed on 19 February 2021).
  34. Shih, Kevin Yang. 2016. Labor market openness, H-1B visa policy, and the scale of international student enrollment in the United States. Economic Inquiry 54: 121–38. [Google Scholar] [CrossRef]
  35. Strzelecki, Pawel, Jakub Growiec, and Robert Wyszyński. 2021. The contribution of immigration from Ukraine to economic growth in Poland. Review of World Economics. pp. 1–35. Available online: https://www.nbp.pl/publikacje/materialy_i_studia/322_en.pdf (accessed on 13 February 2021).
  36. Urbański, Mariusz. 2021. Immigrant Employees’ Management in the Enterprises – Evidence From Poland. Polish Journal of Management Studies 24: 449–67. [Google Scholar] [CrossRef]
  37. Wadsworth, Jonathan. 2011. Immigration and the UK Labour Market: The Evidence from Economic Research. LSE Research Online Documents on Economics 57982. London: London School of Economics and Political Science, LSE Library. [Google Scholar]
  38. Zanabazar, Altanchimeg, Nam Son Kho, and Sarantuya Jigjiddorj. 2021. The push and pull factors affecting the migration of Mongolians to the Republic of South Korea. Paper presented at the SHS Web of Conferences, České Budějovice, Czech Republic, 19 November 2021; vol. 90, p. 01023. [Google Scholar]
  39. Zoelle, Diana. 2011. Push Factors: Immigration as a Consequence of Development Lending. In Western Political Science Association 2011 Annual Meeting Paper. Sacramento: WPSA. [Google Scholar]
Figure 1. Proposed study model.
Economies 10 00021 g001
Figure 2. Applied study model showing constructs.
Economies 10 00021 g002
Table 1. Push and pull factors.
AreaPush FactorsPull Factors
EconomicPoverty
Unemployment
Low wages
Lack of basic health
High fertility rates
Lack of basic education
Prospects for higher wages
Improved living standards
Personal development
Job opportunities
Good welfare standards
Labor demands
Social Discrimination
Poor medical care
Social insecurity
Inadequate education systems
Population growth
Family reunification
Ethnic homeland
Freedom from discrimination
Better Medicare
Welfare state benefits
PoliticalConflicts
Corruptions
Poor governance
Human rights abuse
Bad governance
Terrorism
Safety and security
Political freedom
Democracy
Political stability
Human civil rights
Table 2. Demographic information of Romanian respondents.
VariableDemographicsn%
GenderMale19367
Female9533
Age20–30 years5418.8
31–40 years2910.1
41–50 years12142
above 50 years8429.2
Time of Stay0–6 moths113.8
6 months–1 year2910.1
1–2 years9834
3–5 years9733.7
Above 5 years5318.4
StatusTourist 3211.1
Permanent resident7325.3
Employed9633.3
Student 8730.2
Table 3. Demographic information of Polish respondents.
VariableDemographicsFrequencyPercent
GenMale18261.1
Female11638.9
Age20–30 years8628.9
31–40 years10836.2
41–50 years8428.2
above 50 years206.7
Time of stay0–6 moths227.4
6 months–1 years4314.4
1–2 years7424.8
3–5 years8729.2
above 5 years7224.2
StatusStudent8829.5
Employed9230.9
Permanent residents4414.8
Tourist7424.8
Table 4. Correlation analysis of the pull and push factors.
Romania
PF1SF1EF1PF2SF2EF2
PF11
SF10.745 **1
EF10.675 **0.807 **1
PF20.695 **0.689 **0.718 **1
SF20.695 **0.687 **0.643 **0.679 **1
EF20.661 **0.666 **0.625 **0.751 **0.674 **1
Poland
PF1SF1EF1PF2SF2EF2
PF11
SF10.695 **1
EF10.690 **0.772 **1
PF20.705 **0.576 **0.583 **1
SF20.590 **0.648 **0.618 **0.602 **1
EF20.674 **0.717 **0.638 **0.677 **0.710 **1
Note: ** = significant at 0.05; Dependent Variable: M; EF1 = push economic factor, PF1 = push political factor, SF1 = push social factor, EF2 = pull economic factor, PF2 = pull political factor, SF2 = pull social factor.
Table 5. Evaluation of Romania data.
Latent Variables Observed VariablesFactor LoadingsCronbach’s AlphaRho AComposite ReliabilityAverage Variance Extracted (AVE)
Push Factors
Economic FactorsEF1.20.860.880.880.910.67
EF1.30.81
EF1.40.83
EF1.50.79
EF1.60.82
Political FactorsPF1.10.830.860.860.900.63
PF1.20.78
PF1.30.81
PF1.40.78
PF1.50.78
Social FactorsSF1.10.790.870.870.900.65
SF1.20.79
SF1.30.83
SF1.40.84
SF1.50.79
Pull Factors
Economic FactorsEF2.10.730.840.840.890.62
EF2.20.75
EF2.30.80
EF2.40.82
EF2.50.83
Political FactorsPF2.10.840.900.900.930.67
PF2.20.82
PF2.30.82
PF2.40.82
PF2.50.77
PF2.60.84
Social FactorsSF2.20.820.860.860.900.70
SF2.30.87
SF2.40.85
SF2.50.81
MigrationIM10.810.890.890.910.64
IM20.84
IM30.73
IM40.83
IM50.81
IM60.77
Table 6. Discriminant validity of Romania data.
Latent VariablesMigrationPull Economic FactorsPull Political FactorsPull Social FactorsPush Economic FactorsPush Political FactorsPush Social Factors
Migration0.80
Pull Economic Factors0.720.79
Pull Political Factors0.860.730.82
Pull Social Factors0.680.700.680.84
Push Economic Factors0.620.570.630.630.82
Push Political Factors0.680.640.680.680.690.80
Push Social Factors0.620.680.630.670.770.750.81
Table 7. Evaluation of Poland data.
Latent Variables Observant VariablesFactor Loadings Cronbach’s AlphaRho_AComposite ReliabilityAverage Variance Extracted (AVE)
Push Factors
Push Economic FactorsEF1.20.830.900.900.930.71
EF1.30.89
EF1.40.85
EF1.60.80
EF1.50.86
Push Political FactorsPF1.10.810.880.880.910.67
PF1.20.87
PF1.30.79
PF1.40.83
PF1.50.79
Push Social FactorsSF1.10.830.890.900.920.70
SF1.20.82
SF1.30.83
SF1.40.87
SF1.50.82
Pull Factors
Pull Economic FactorsEF2.10.770.840.850.890.62
EF2.20.77
EF2.30.78
EF2.40.81
EF2.50.80
Pull Political FactorsPF2.10.800.920.920.930.70
PF2.20.87
PF2.30.86
PF2.40.85
PF2.50.85
PF2.60.79
Pull Social FactorsSF2.20.790.860.870.900.70
SF2.30.89
SF2.40.88
SF2.50.79
MigrationIM10.830.910.910.930.69
IM20.81
IM30.88
IM40.78
IM50.84
IM60.85
Table 8. Discriminant validity of Poland data.
Latent VariablesMigrationPull Economic FactorsPull Political FactorsPull Social FactorsPush Economic FactorsPush Political FactorsPush Social Factors
Migration0.83
Pull Economic Factors0.710.79
Pull Political Factors0.850.750.84
Pull Social Factors0.640.680.690.84
Push Economic Factors0.670.630.720.640.84
Push Political Factors0.630.670.700.710.680.82
Push Social Factors0.640.670.700.690.810.750.84
Table 9. Regression analysis for Poland.
Observant VariablesUnstandardized CoefficientsStandardized CoefficientstSig.
BStd. ErrorBeta
(Constant)0.2640.157 1.6760.095
EF1−0.0520.065−0.052−0.8020.423
PF10.1120.0620.1061.7960.073
SF10.1580.0660.1642.4060.017
EF20.1880.0670.1882.8050.005
PF20.3120.0750.3134.1580.000
SF20.1760.0500.1903.4840.001
Dependent Variable: M; EF1 = push economic factor, PF1 = push political factor, SF1 = push social factor, EF2 = pull economic factor, PF2 = pull political factor, SF2 = pull social factor.
Table 10. Regression analyses for Romania.
Observant VariablesUnstandardized CoefficientsStandardized CoefficientstSig.
BStd. ErrorBeta
(Constant)0.2700.126 2.1500.032
EF10.0510.0480.0521.0640.288
PF10.1280.0500.1242.5700.011
SF1−0.0620.051−0.065−1.2090.228
EF20.1370.0420.1533.2560.001
PF20.6120.0450.63013.5880.000
SF20.0590.0390.0691.5240.129
Dependent Variable: M, EF1 = push economic factor, PF1 = push political factor, SF1 = push social factor, EF2 = pull economic factor, PF2 = pull political factor, SF2 = pull social factor.
Table 11. Summary of findings.
VariablesHypotheses Poland Romania
(Constant)0.2640.27
Push Factors H1EF1−0.0520.051
H2SF10.158 ***−0.062
H3PF10.1120.128 ***
Pull Factors H4EF20.188 ***0.137 ***
H5SF20.176 ***0.059
H6PF20.312 ***0.612 ***
Note: *** = significant at 0.01; M = Migration; EF1 = push economic factor, SF1 = push social factor, PF1 = push political factor, EF2 = pull economic factor, SF2 = pull social factor, PF2 = pull political factor.
Publisher’s Note: MDPI stays neutral with regard to jurisdictional claims in published maps and institutional affiliations.

