Article

The Impact of COVID-19 on the US Economy: The Multiplier Effects of Tourism

by
Nikolaos Rodousakis
1 and
George Soklis
2,*
1
Centre of Planning and Economic Research (KEPE), 10672 Athens, Greece
2
Department of Public Administration, School of Economy and Public Administration, Panteion University, 17671 Athens, Greece
*
Author to whom correspondence should be addressed.
Economies 2022, 10(1), 2; https://doi.org/10.3390/economies10010002
Submission received: 25 November 2021 / Revised: 15 December 2021 / Accepted: 17 December 2021 / Published: 22 December 2021
(This article belongs to the Special Issue The Impact of COVID-19 on Financial Markets and the Real Economy)

Abstract

:
This article explores the multiplier effects on domestic product, employment, and the external sector of the US economy due to the decline of tourism activities during the pandemic. For this purpose, we use an input-output model and the latest available input-output data from the Organisation for Economic Co-operation and Development (OECD’s) database. It was found that for every USD million decrease in tourism receipts, the net output decreases about USD 1.53 million, the level of employment decreases about 16.86 persons, imports decrease about USD 0.20 million, while the comparative analysis of these results with the economy’s average multipliers indicates that tourism constitutes a key sector of the US economy. From the evaluation of the results, it is deduced that the decline of tourism activities recorded in the year 2020 accounts for about one-fourth of the observed recession in the US economy.

1. Introduction

The coronavirus shock to the growth dynamics of all the major economies in the world marked the year 2020. The economy of the United States (US), the largest economy in the world in terms of nominal gross domestic product (GDP), recorded a reduction in GDP of about 3.4% for the year 2020.1 The recession of the US economy was close to the global average recession, but quite below the average recession amongst advanced economies (–4.7%), and the Euro area (–6.6%). These relatively good results for the US economy can be attributed to its structural characteristics.
Undoubtedly, tourism is one of the most vulnerable economic sectors in the pandemic. For example, according to World Tourism Organization (UNWTO), international tourism arrivals declined by 73% in the year 2020. Since tourism has become one of the major contributors to growth and employment worldwide in the last decades, it is important to study the effects on national economies caused by the decline of tourism activities during the pandemic. For example, the World Travel & Tourism Council (WTTC 2021) estimates that before the pandemic, tourism accounted for 10.4% of global GDP and 10.6% of employment, while international travel expenditures accounted for 6.8% of world’s total exports and 27.4% of services exports.
Recently, a number of research studies have focused on the impact on the economic systems related to the decline of tourism activities (see, e.g., Farzanegan et al. 2020; Lee and Chen 2020; Mariolis et al. 2020; Qiu et al. 2020; Rodousakis and Soklis 2021; Tsionas 2020; Yang et al. 2020). In this article we explore the multiplier effects on domestic product, employment, and the external sector of the US economy due to the decline of tourism activities during the pandemic. For this purpose, we use (a) an extension of Kurz’s (1985) matrix multiplier framework; and (b) the latest available input-output data from OECD’s (Organisation for Economic Co-operation and Development) database, https://stats.oecd.org (accessed on 30 September 2021).
The remainder is structured as follows. Section 2 presents the analytic framework. Section 3 presents the empirical results. Finally, Section 4 concludes.

2. Methods and Materials

To assess the multiplier effects of tourism on the US economy, we use a Sraffian multiplier framework inspired by the contribution of Kurz (1985) and the further generalisations provided by Metcalfe and Steedman (1981) and Mariolis (2008). More specifically, we consider an open economy with n products produced by n single-product activities, only circulating capital, fixed input-output coefficients, “stationary prices”, two types of income (i.e., wages and profits), no pass-through from tax rates to prices, and heterogeneous labour. By combining the price and quantity system of the above economy, we may derive the following equation2
y T = Π d T
where y T denotes the net output vector with dimensions n × 1 , d T is the autonomous demand vector, which includes government consumption, investments and exports, Π [ I C + M ] 1 represents the multipliers matrix of the economy, linking autonomous demand with net output, C [ p ( s w w Λ + s p p H ) ] ( p c T   ) 1 c T represents the consumption demand of the economy, c T represents the consumption pattern (which is assumed to be uniform among wage and profit earners), s w is the saving ratio associated with wage earners, s p is the saving ratio associated with profit earners, Λ l ^ [ I A ] 1 is the “vertically integrated labour coefficients” matrix, A   ( 0 ) is the matrix of technical coefficients, H A r ^ [ I A ] 1 is the “ r ^ vertically integrated technical coefficients matrix”, r ^ the diagonal matrix of sectoral profit rates, M m ^ [ I A ] 1 represents the total import demand matrix, and finally, m ^ the diagonal matrix of imports per unit of output. On the basis of the above, we may easily derive the matrix of employment multipliers linking autonomous demand to the levels of sectoral employment from L T = Λ Π d T , where L T gives the vector of employment per sector of the economy, and the matrix of import multiplier from i m T = m ^ [ I A ] 1   Π d T , where i m T denotes the import demand vector.
The necessary input-output data of the US economy for the empirical application of the multiplier analysis were retrieved from OECD’s database, https://stats.oecd.org (accessed on 30 September 2021). The OECD’s Input-Output Tables (IOTs) describe the production of 36 products by 36 corresponding sectors. The classification of the 36 sectors of the US economy is reported in Table 1 below.
Now, to assess the multiplier effects of tourism receipts on the economic system we need to set the autonomous demand vector, d , equal to the pattern of international travel receipts that corresponds to the 36 sectors classified in the IOTs of the US economy.3 Moreover, we divide all the elements of d by the total tourism receipts of the economy and, therefore, it holds i = 1 36 d i = 1 . The distribution of tourism receipts to the commodities of the different sectors of the US economy is represented in Figure 1: about 77.7% of the international travel receipts of the US economy are directed to the sectors “Accommodation and food services” (31.6%), “Transportation and storage” (14.3%), “Education” (13.8%), “Arts, entertainment, recreation and other service activities” (6.8%), “Wholesale and retail trade” (5.8%), and “Real estate activities” (5.4%), while about 22.3% of the travel receipts are directed to the rest of the 30 sectors.

3. Empirical Results and Discussion

We apply the previous analysis to the IOTs of the US economy for the case where s w = 0 and s p = 1 . According to our estimates, each USD million decrease in tourism receipts caused a direct and indirect:4
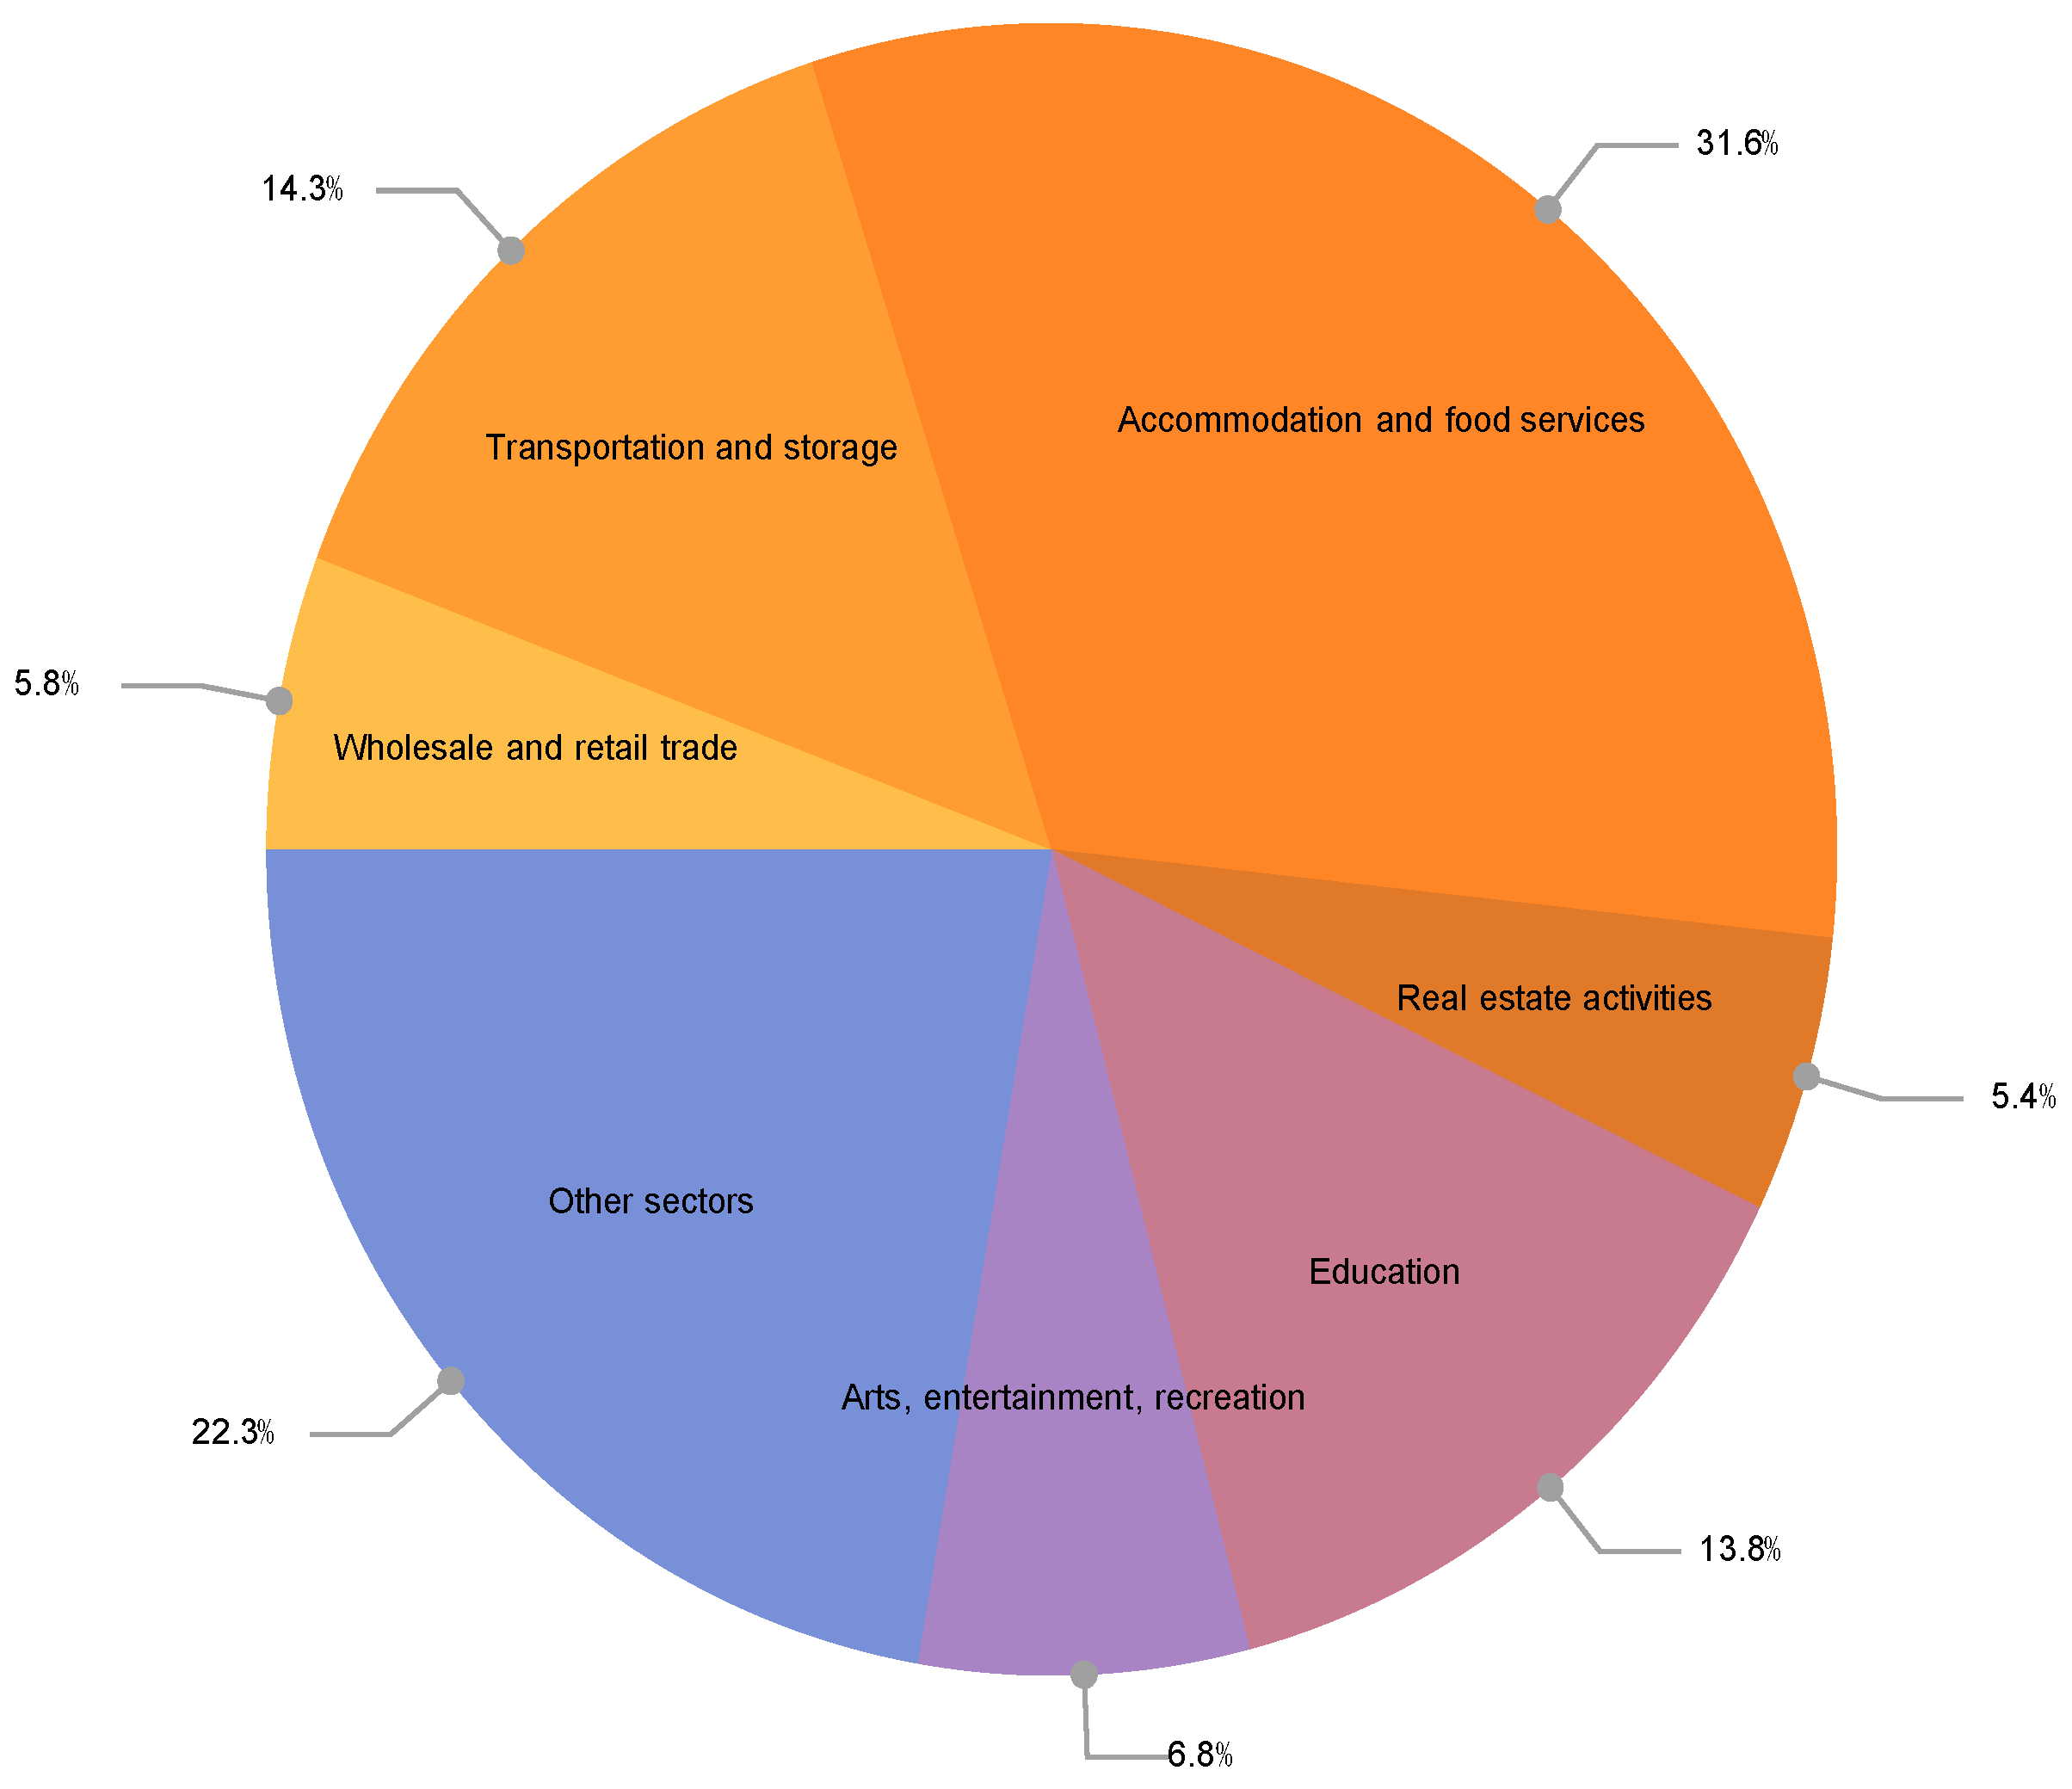
  • Decrease in domestic product of about USD 1.53 million;
  • Decrease in the level of employment of about 16.86 persons;
  • Decrease in imports of about USD 0.20 million.
The decomposition of the multiplier effects on net output, employment, and imports, to each of the 36 sectors of the US economy is depicted in Figure 2, Figure 3 and Figure 4, respectively.
From Figure 2 and Figure 3, it follows that the output and employment multiplier effects in the US economy mainly affect the services, while, from Figure 4, it follows that the import multiplier effects are distributed to all the sectors of the US economy.
Now, to assess the relative significance of the tourism multiplier effects on the US economy, we compare the tourism multipliers with the average multipliers of the economy. Table 2 reports the average output, employment and import multipliers of the US economy. The third column of Table 2 reports the estimated tourism multipliers.5
From the multipliers reported in Table 2, it follows that the US economy demonstrates relatively favorable tourism multipliers and, therefore, the tourism sector constitutes one of the key sectors of the US economy.
The US GDP reached USD 21,433,224.7 million, while the total level of employment was 157,538,100 persons.6 Furthermore, UNWTO reports that the US’s tourism receipts accounted for USD 193.3 billion in the year 2019, and USD 76.1 billion in the year 2020, recording a decline of about 61% in comparison to the previous year. Thus, from the previous analysis of the tourism multiplier effect on the US economy, it is deduced that the decline of tourism receipts in the year 2020 is associated with a decrease in gross domestic output by 0.84%, a decrease in the employment level by 1.25%, and a decrease in the surplus of the balance of the external sector by USD 93.8 billion. It is interesting to note that if we make the extreme assumption that all tourism receipts of the US economy are lost (193.3 billion US dollars), then, according to our estimates, the gross domestic product would decrease by 1.38%, the employment level would decrease by 2.07%, and the surplus of the external sector would decrease by USD 154.6 billion. Now, if we take into account that the gross domestic product of the US economy declined by about 3.4% in the previous year, it then follows that the decrease of international travel receipts accounted for 24.7% of the actual recession in the US economy. Finally, to delve into the intersectoral dimensions of the multiplier effects of international travel receipts on the US economy, in Figure 5 we depict the decrease in domestic output per sector.
From Figure 5, it follows that 73.4% of the losses in domestic output of the US economy correspond to “Accommodation and food services” (22.3%), “Education” (11.3%), “Human health” (10.0%), “Transportation and storage” (9.8%), “Real estate services” (9.7%), “Wholesale and retail trade” (8.1%), and “Arts” (6.2%).
It is interesting to note that, using the same framework, Rodousakis and Soklis (2021) concluded that the decline in tourism receipts accounted for 11.8% of the actual recession in the German economy for the year 2020 and for 41.3% of the actual recession in the Spanish economy, while the sectoral decomposition of the output losses found in the current paper are more similar to those of the German than those of the Spanish economy. Thus, we may say that the relative impact of the decrease in tourism receipts in the US economy during the pandemic lies between those of the German and Spanish economies. These findings indicate that any travel restrictions imposed by the US authorities should carefully consider the economic impact of these restrictions. For example, before the pandemic, about one-fifth of the international visitors to the US came from Europe. Thus, the recent measures of the US government to lift travel restrictions from a number of countries while limiting the spread of COVID-19 will have a significant positive impact on the recovery of the economy.

4. Concluding Remarks

Using an input-output model and data from OECD’s input-output database, this article explored the multiplier effects on domestic product, employment, and the external sector of the US economy due to the decline of tourism activities during the pandemic. It was estimated that each USD million decrease in tourism receipts caused a direct and indirect decrease in domestic product of about USD 1.53 million, a decrease in the level of employment of about 16.86 persons, and a decrease in imports of about USD 0.20 million. These multiplier effects indicate that the tourism sector constitutes one of the key sectors of the US economy, while its sectoral decomposition reveals that the most affected activities belong to service sector and, more specifically, to the sectors “Accommodation and food services”, “Education”, “Human health”, “Transportation and storage”, “Real estate services”, “Wholesale and retail trade”, and “Arts”. Moreover, it was estimated that the decline in travel receipts accounts for about one-fourth of the actual recession in the US economy for the year 2020. Thus, even for a technological advanced economy such as that of the US, the significance of tourism activities for the economic system cannot be underestimated.

Author Contributions

The authors have equally contributed to all the stages of the research. All authors have read and agreed to the published version of the manuscript.

Funding

This research received no external funding.

Institutional Review Board Statement

Not applicable.

Informed Consent Statement

Not applicable.

Data Availability Statement

The input-output data used in the research were retrieved from OECD’s database, https://stats.oecd.org (accessed on 30 September 2021).

Acknowledgments

We are indebted to four anonymous referees and the academic editor of this journal for helpful hints and comments. The usual disclaimer applies.

Conflicts of Interest

The authors declare no conflict of interest.

Notes

1
After the longest recovery in its history, which started in June 2009, the US economy fell into recession in February 2020. For a detailed analysis of the developments of the US economy, see Papadimitriou et al. (2021).
2
For a detailed exposition, see, e.g., Mariolis et al. (2021); Rodousakis and Soklis (2021). For corresponding applications in a joint production framework, see Mariolis and Soklis (2018); Mariolis et al. (2018, 2020).
3
This data is given by “Direct purchases by non-residents (exports)”, which is included in the IOTs of the OECD’s database.
4
The analytical results are available on request from the authors. The variables necessary for the empirical analysis were constructed using information from IOTs and following the standard procedure in the relevant literature (see, e.g., Mariolis et al. 2018, Appendix 1).
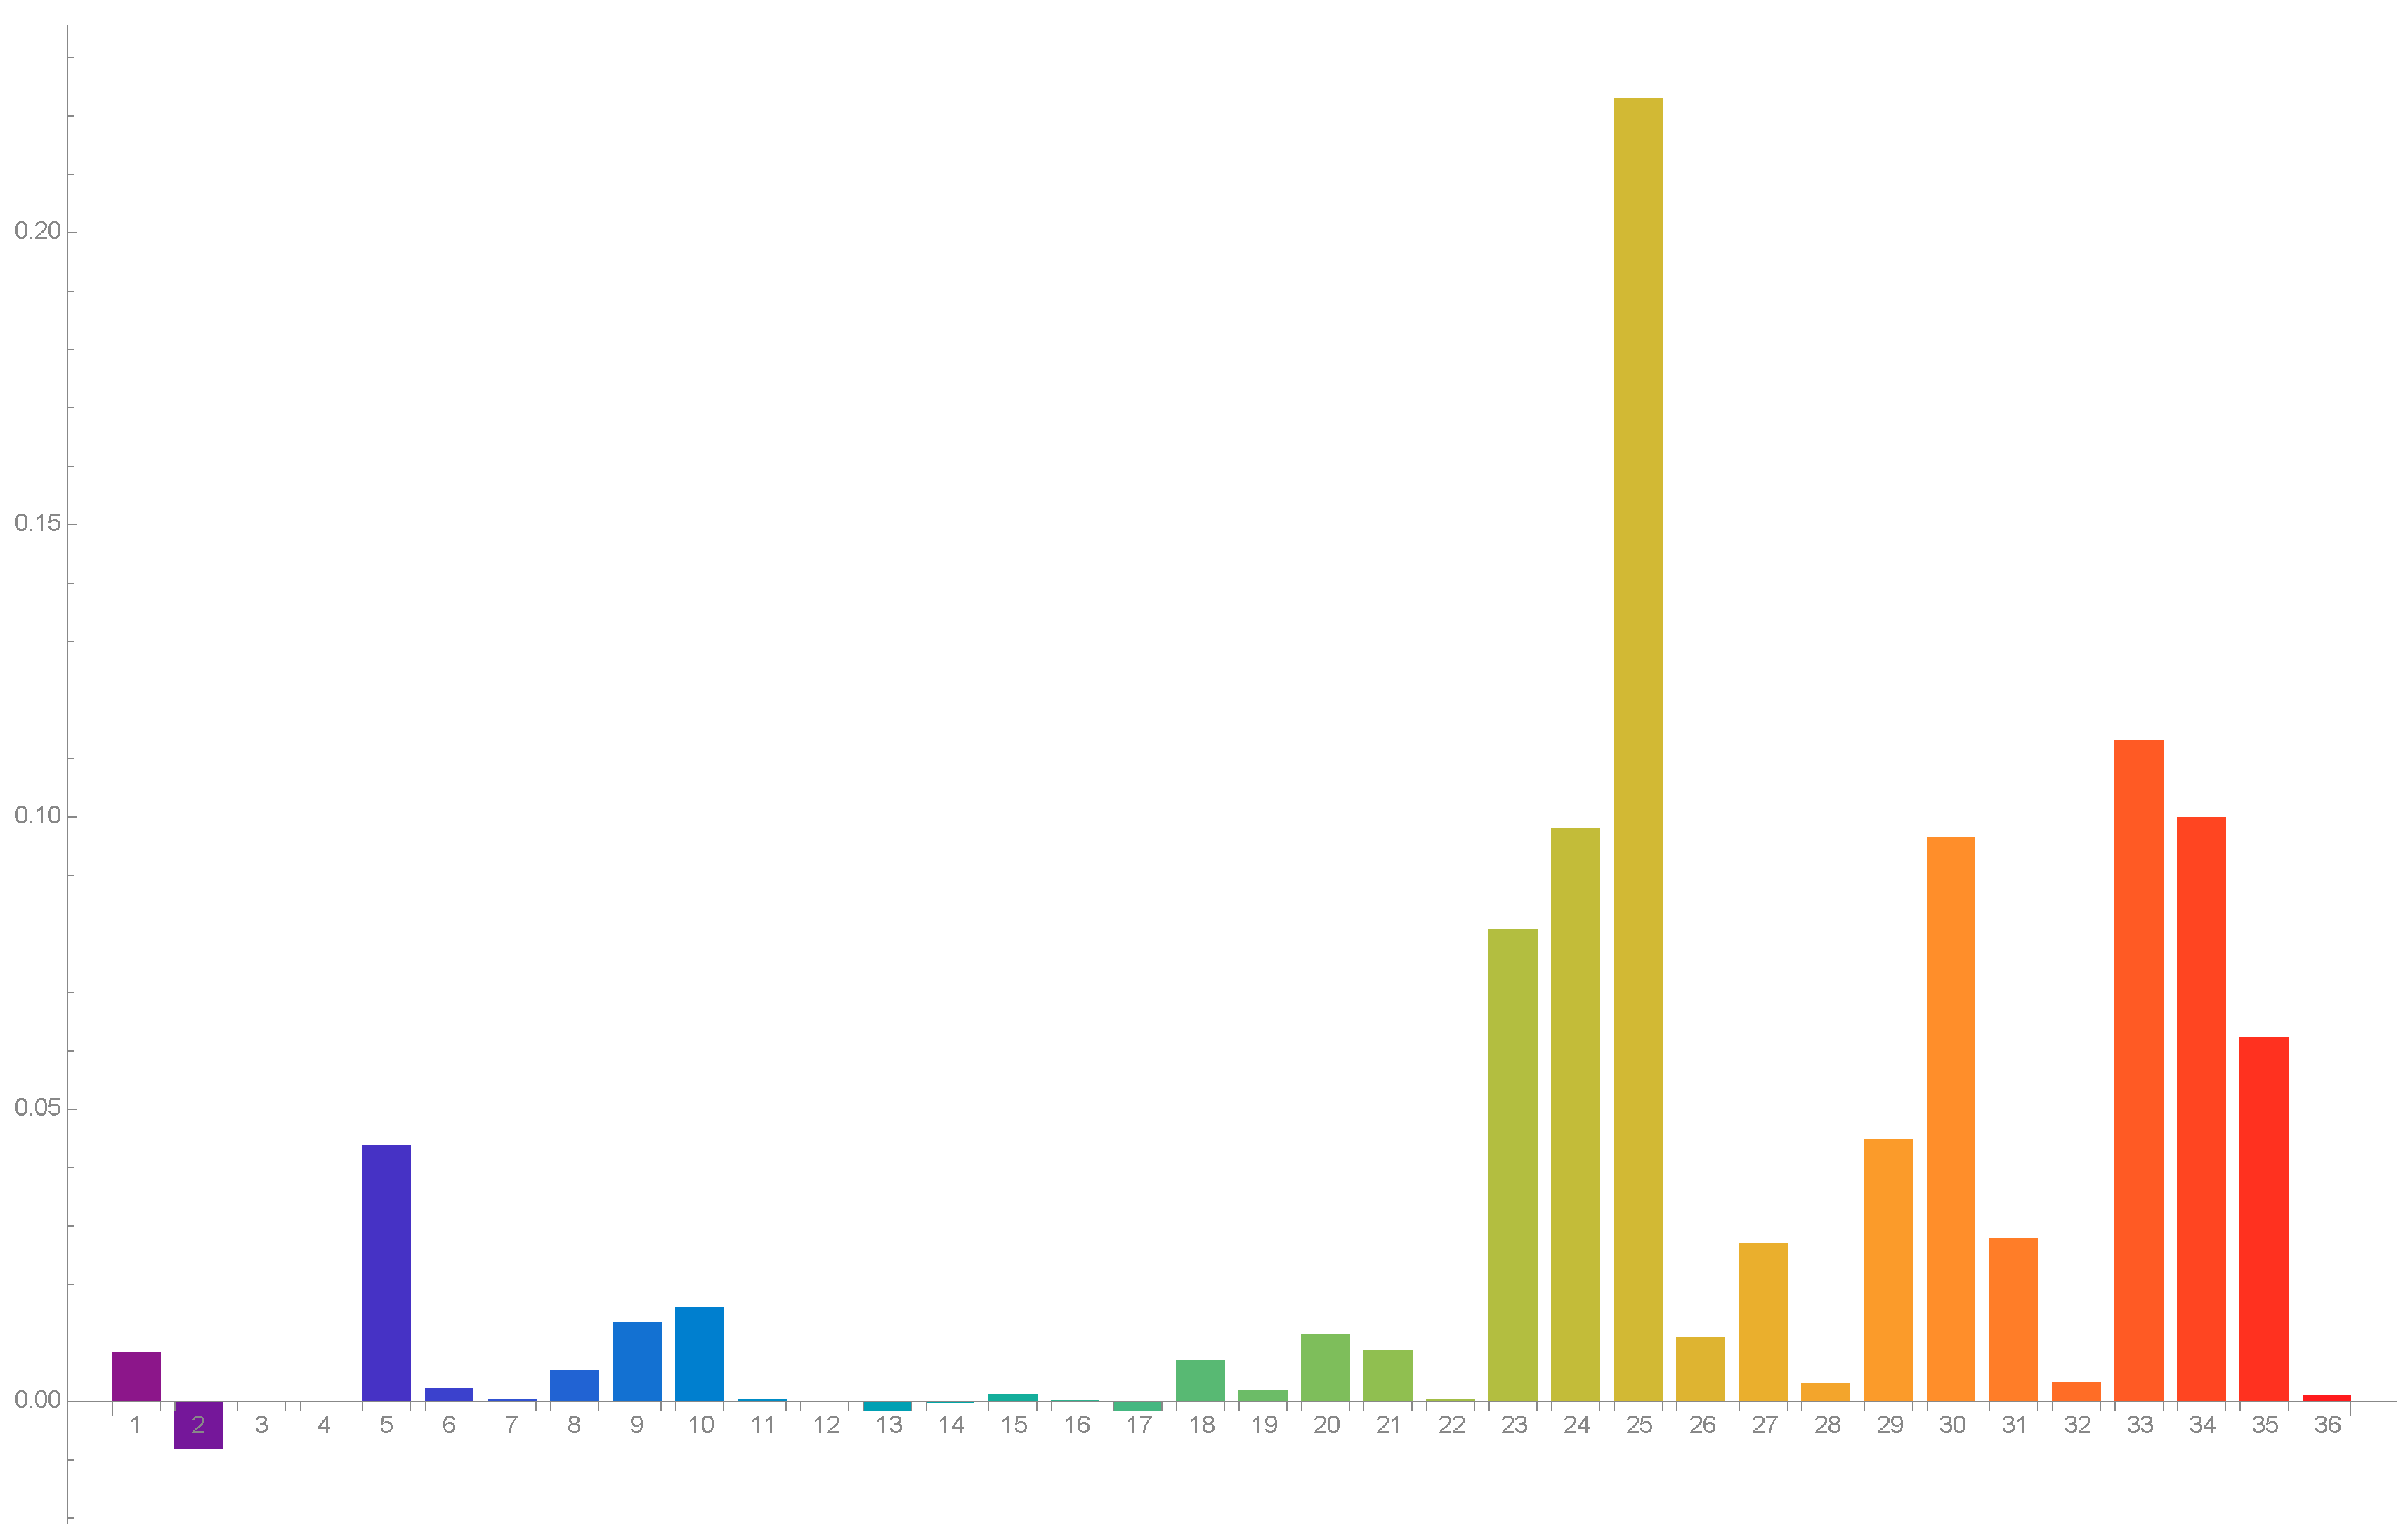
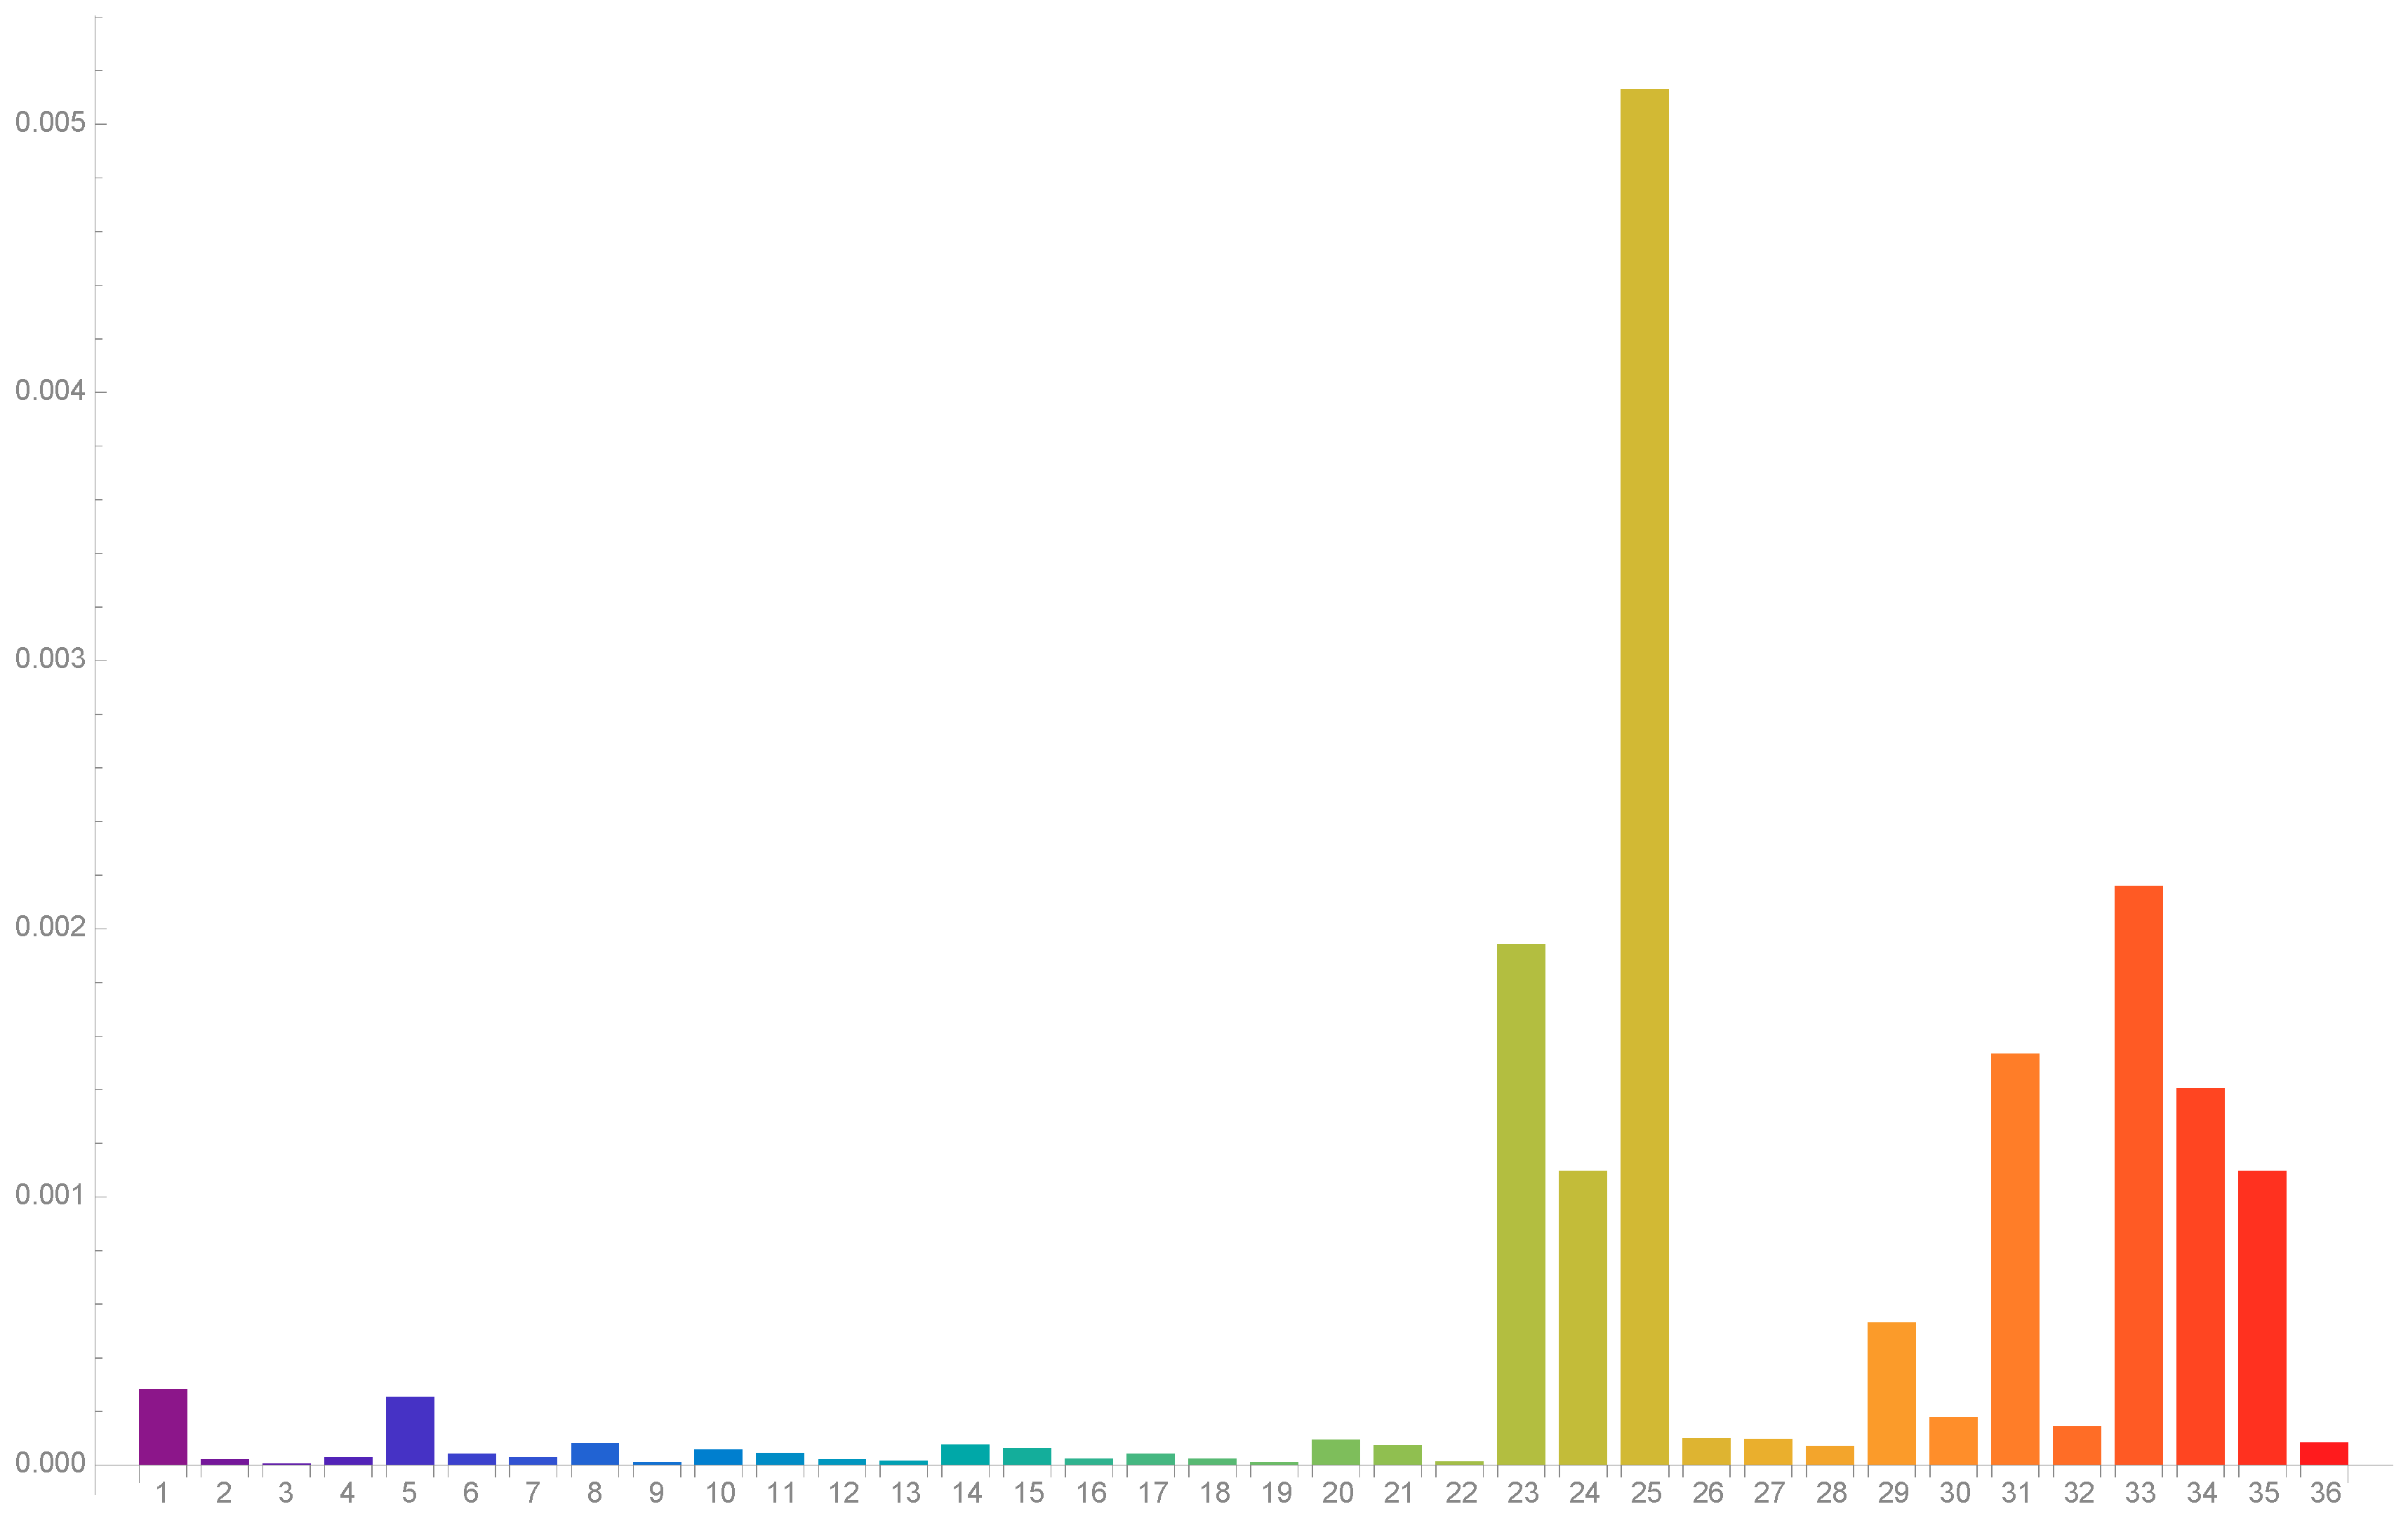
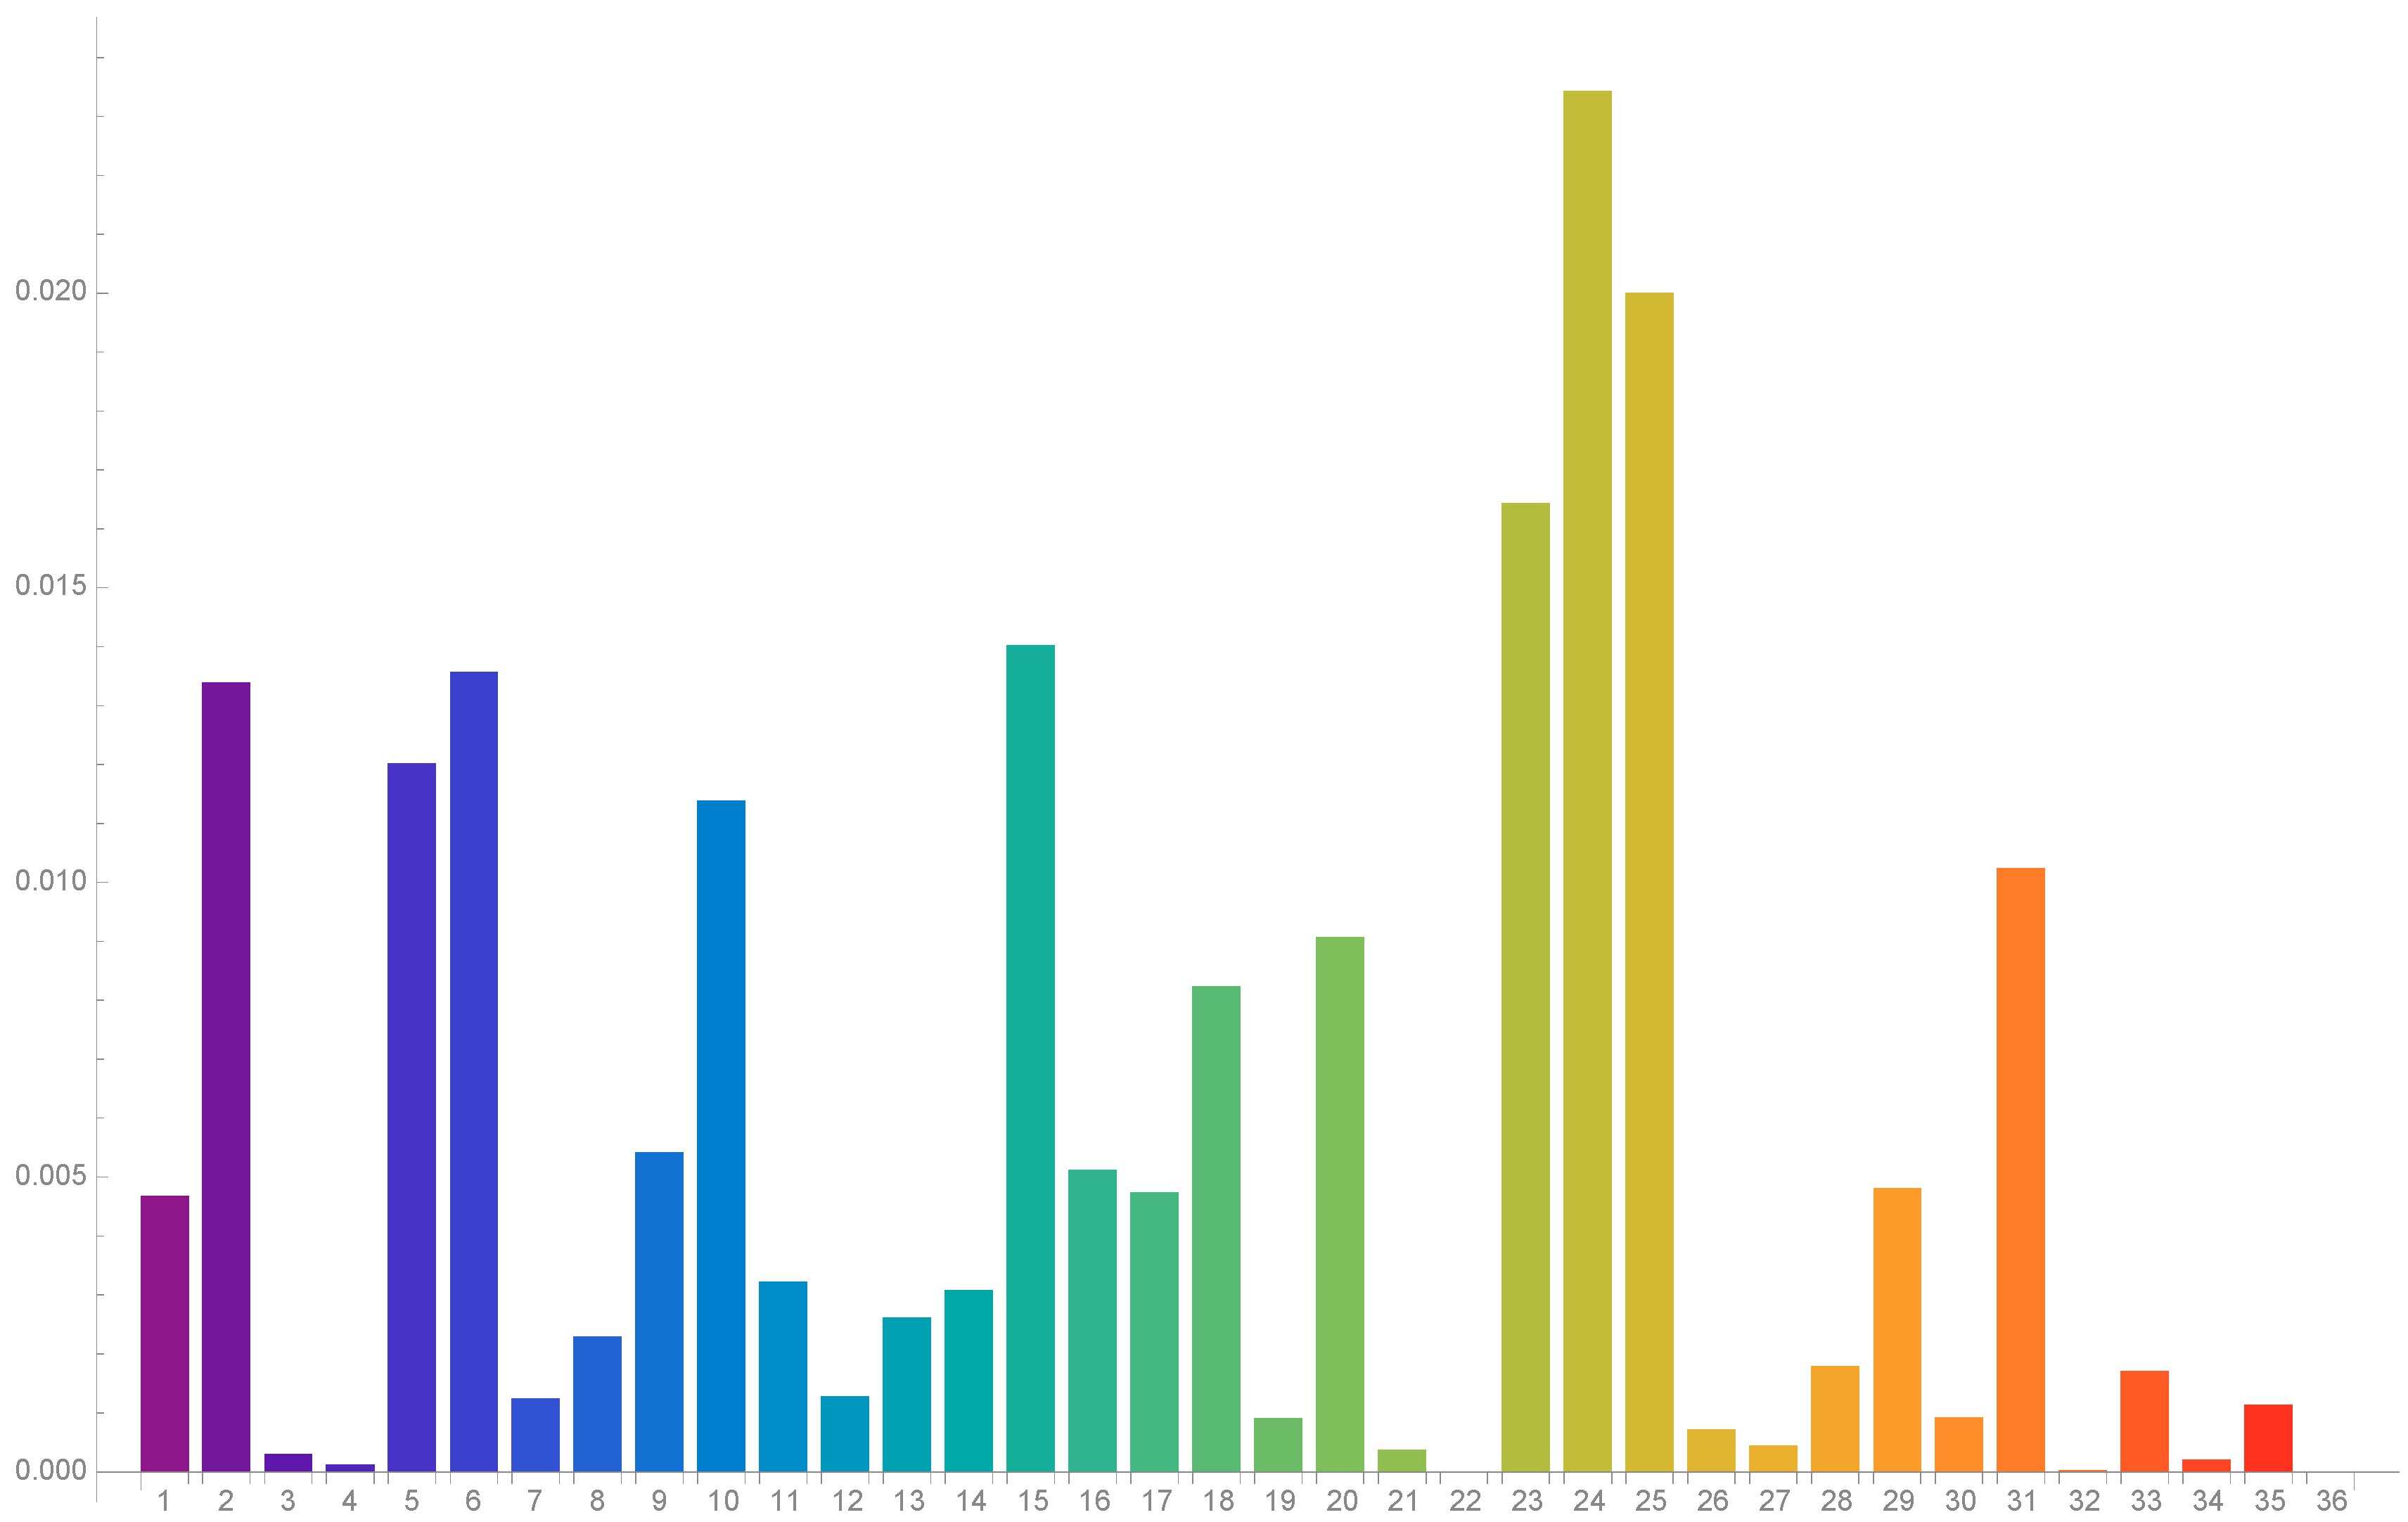
5
The average multipliers correspond to the changes on the money values of net output and imports, and on employment (measured in persons), respectively, induced by a simultaneous increase of 1 36 units in the autonomous demand for the product of each of the 36 sectors.
6
The data are obtained from https://stats.oecd.org (accessed on 30 September 2021).

References

  1. Farzanegan, Mohammad Reza, Hassan F. Gholipour, Mehdi Feizi, Robin Nunkoo, and Amir Eslami Andargoli. 2020. International tourisn and outbreak of coronavirus (COVID-19): A cross-country analysis. Journal of Travel Research 60: 687–92. [Google Scholar] [CrossRef]
  2. Kurz, Heinz Dieter. 1985. Effective demand in a “classical” model of value and distribution: Τhe multiplier in a Sraffian framework. Manchester School 53: 121–37. [Google Scholar] [CrossRef]
  3. Lee, Chien-Chiang, and Mei-Ping Chen. 2020. The impact of COVID-19 on the travel and leisure industry returns: Some international evidence. Tourism Economics, in press. [Google Scholar] [CrossRef]
  4. Mariolis, Theodore. 2008. Pure joint production, income distribution, employment and the exchange rate. Metroeconomica 59: 656–65. [Google Scholar] [CrossRef]
  5. Mariolis, Theodore, and George Soklis. 2018. The static Sraffian multiplier for the Greek economy: Εvidence from the supply and use table for the year 2010. Review of Keynesian Economics 6: 114–47. [Google Scholar] [CrossRef]
  6. Mariolis, Theodore, Nikolaos Ntemiroglou, and George Soklis. 2018. The static demand multipliers in a joint production framework: Comparative findings for the Greek, Spanish and Eurozone Economies. Journal of Economic Structures 7: 18. [Google Scholar] [CrossRef]
  7. Mariolis, Theodore, Nikolaos Rodousakis, and George Soklis. 2020. The COVID-19 multiplier effects of tourism on the Greek economy. Tourism Economics 27: 1848–55. [Google Scholar] [CrossRef]
  8. Mariolis, Theodore, Nikolaos Rodousakis, and George Soklis. 2021. Inter-sectoral analysis of the Greek economy and the COVID-19 multiplier effects. European Politics and Society, in press. [Google Scholar] [CrossRef]
  9. Metcalfe, Metcalfe, and Ian Steedman. 1981. Some long-run theory of employment, income distribution and the exchange rate. Manchester School 49: 1–20. [Google Scholar] [CrossRef]
  10. Papadimitriou, Dimtri, Michalis Nikiforos, and Gennaro Zezza. 2021. The Pandemic, the Stimulus, and the Future Prospects for the US Economy. Strategic Analysis. Annandaleon-Hudson: Levy Economics Institute of Bard College. [Google Scholar]
  11. Qiu, Richard T.R., Jinah Park, ShiNa Li, and Haiyan Song. 2020. Social costs of tourism amid COVID-19 pandemic. Annals of Tourism Research 84: 102994. [Google Scholar] [CrossRef] [PubMed]
  12. Rodousakis, Nikolaos, and George Soklis. 2021. The COVID-19 multiplier effects of tourism on the German and Spanish economies. Evolutionary and Institutional Economics Review, in press. [Google Scholar]
  13. Tsionas, Mike G. 2020. COVID-19 and gradual adjustment in the tourism, hospitality, and related industries. Tourism Economics 27: 1828–1832. [Google Scholar] [CrossRef]
  14. World Travel and Tourism Council (WTTC). 2021. Travel & Tourism: Economic Impact 2021. London: WTTC, April 6. [Google Scholar]
  15. Yang, Yang, Hongru Zhang, and Xiang Chen. 2020. Coronavirus pandemic and tourism: Dynamic stochastic general equilibrium modeling of infectious disease outbreak. Annals of Tourism Research 83: 102913. [Google Scholar] [CrossRef]
Figure 1. The distribution (%) of international travel receipts per sector, US 2015.
Economies 10 00002 g001
Figure 2. Sectoral decomposition of the tourism output multiplier, US 2015.
Economies 10 00002 g002
Figure 3. Sectoral decomposition of the tourism employment multiplier, US 2015.
Economies 10 00002 g003
Figure 4. Sectoral decomposition of the tourism import multiplier, US 2015.
Economies 10 00002 g004
Figure 5. Sectoral decomposition (%) of the output losses in the US economy, 2015.
Economies 10 00002 g005
Table 1. Sector classification.
No.Nomenclature
1Agriculture, forestry and fishing
2Mining and extraction of energy producing products
3Mining and quarrying of non-energy producing products
4Mining support service activities
5Food products, beverages and tobacco
6Textiles, wearing apparel, leather and related products
7Wood and products of wood and cork (except furniture)
8Paper products and printing
9Coke and refined petroleum products
10Chemicals and pharmaceutical products
11Rubber and plastics products
12Other non-metallic mineral products
13Manufacture of basic metals
14Fabricated metal products, except machinery and equipment
15Computer, electronic and optical products
16Electrical equipment
17Machinery and equipment NEC
18Motor vehicles, trailers and semi-trailers
19Other transport equipment
20Other manufacturing; repair and installation of machinery and equipment
21Electricity, gas, water supply, sewerage, waste and remediation services
22Construction
23Wholesale and retail trade; repair of motor vehicles
24Transportation and storage
25Accommodation and food services
26Publishing, audiovisual and broadcasting activities
27Telecommunications
28IT and other information services
29Financial and insurance activities
30Real estate activities
31Other business sector services
32Public administration and defence; compulsory social security
33Education
34Human health and social work
35Arts, entertainment, recreation and other service activities
36Private households with employed persons
Table 2. Average versus tourism multipliers for the US economy, 2015.
MultipliersEconomy’s AverageTourism
Output1.351.53
Employment12.8716.86
Imports0.280.20
Publisher’s Note: MDPI stays neutral with regard to jurisdictional claims in published maps and institutional affiliations.

