1. Introduction
Greyhound racing is a popular recreational pastime that is enjoyed by people of all ages and is legal in many counties including Australia, the United States, the United Kingdom, Sweden, Denmark, Germany, Netherlands, New Zealand, Mexico and Vietnam. In Australia, races are conducted at purpose-built tracks and the races are run counter-clockwise generally on oval-shaped tracks with a mechanical lure system. The racing starting distance varies from 250 m at Bundaberg to 769 m at Dubbo. The most common track surface is a sandy loam [
1,
2,
3]. The radius of the bends and the camber on the bends are not standardised within the industry and the transition between the bend and the straight results in the greyhounds being subjected to high levels of jerk [
4,
5,
6,
7,
8]. The track radii vary from 49 m at Tamworth to 73 m at Mandurah.
Racing greyhounds are stimulated to chase the lure by both sight and sound [
9]. The most common lure used in Australia is the wire-cable-pulled lure system where a continuous wire-cable pulls the lure carriage along a guide rail on the inside of the track. The wire-cable-pulled lure emits a sound that greyhound trainers link to chasing behaviour when the greyhounds are pups so that when they hear this sound it is paired with excitement and racing. The sound of the lure is used to stir the greyhounds prior to racing. The wire cable runs along guide rollers and can travel at a speed in excess of 30 m/s [
10]. This high-speed motion excites the lure rail and supporting structure in a multi-resonant vibration [
11].
The wire-cable-pulled lure system is considered a Work Health and Safety issue for track-side staff and a potential hazard for the greyhounds. When the lure is operating, its many parts are moving at high speeds, which could cause hazards to the greyhounds and nearby people if it catastrophically failed. Considerable work by others has been invested in developing an alternative battery-operated lure system that does away with the need for the potentially lethal wire-cable [
12]. The battery-operated lure developed by Covey Associates and manufactured by Steriline Racing is now used at the Murray Bridge, Richmond and Grafton greyhound racing tracks. The self-propelled lure is powered by a rechargeable lithium-ion battery and importantly eliminates the high-speed steel-wire cable, therefore reducing the operational risk to both racing greyhounds, race officials and the general public. It is expected that it will also significantly reduce the operating and maintenance costs.
Meanwhile, there is a risk that the implementation of such an alternative lure system might result in a non-desirable greyhound response. The greyhounds have been visually and aurally conditioned to follow the wire-cable-pulled lure during racing and training. So it is advised that the battery-operated lure should generate the same visual and audible stimulation to which the greyhounds have been conditioned. It is convenient to move the lure from the cable-driven base to the battery-driven base thus visual excitation is not changed. However, the wire-cable-pulled lure sound is not duplicated by the battery-operated lure so the acoustic excitation changes between the two lure systems.
Currently, it is not known exactly how a greyhound’s hearing system responds to lure sound. The fact is that the wire-cable-pulled lure has been used for decades in greyhound racing. It works well in the race, so how its sound stimulates greyhounds has not attracted attention from industry and researchers. When the battery-operated lure was invented to replace the wire-cable-pulled lure to increase safety and reduce cost, there was concern that this much quieter, battery-operated lure might affect greyhound racing performance as its sound was significantly different from the wire-cable-pulled lure. Therefore, it is worthwhile studying the acoustic difference between the innovative battery-operated lure and the traditional wire-cable-pulled lure, as well as how alternative lure sounds might affect greyhound racing performance.
This paper is the first in a series of papers dealing with the acoustics of the safer cable-less lure and greyhound motivation to chase. This paper focuses on the measurement and objective analysis of the existing cable and proposed cable-less lure sounds to answer the question: What are the lure sounds greyhounds experience during racing? To this end, this research undertook sample measurements of the acoustic signatures of a traditional wire-cable-pulled lure system and two alternative battery-operated lure systems developed by Covey Associates and Steriline Racing. They market this new lure system under the name of Safechase
TM Lure System [
13]. The sound of different lure systems was compared through frequency domain analysis and sound quality analysis.
2. Murray Bridge Greyhound Racing Track and Different Lure Systems
The acoustic measurements were conducted at the Murray Bridge greyhound racing track located in South Australia. The track plan is shown in
Figure 1a with four different starting positions including the two used in this study.
Figure 1b,c show the starting box at the 455 m, the arrangement being common at all starting positions. In the racing event, the greyhounds are initially locked in the starting box. The lure commences its progression around the rail (to the inside of the track—curve marked with red circles in
Figure 1a from a location behind the starting box. When the lure approaches, the starting box gate is triggered to open with the greyhounds released to rush out of the starting box and chase the lure along the track towards the finish.
In this paper, three different lure systems are investigated and compared in terms of their acoustic performance; these are shown in
Figure 2.
Figure 2a shows the Murray Bridge track wire-cable-pulled lure configuration.
Figure 2b,c show the two different configurations of the battery-operated lure system developed by Covey Associates and Steriline Racing. In
Figure 2b there are twelve nylon rollers installed to guide the lure. The two larger diameter rollers orientated in a vertical plane carry the majority of the vertical load while the two rollers directly beneath these carry the lateral load of the lure. There are a further eight rollers orientated in a horizontal plane. All the lure rollers are configured in opposing pairs. This is to constrain the motion of the carriage to the rail and prevent derailment or lift-off in much the same way as a roller coaster vehicle is constrained by opposing wheels [
14,
15].
Figure 2c shows an alternative battery-operated lure configuration where the upper pair of nylon rollers were swapped with mild-steel rollers. These two mild-steel rollers were swapped with two of the upper horizontally mounted softer nylon rollers to increase the noise emanating from the lure.
3. Lure Acoustic Performance Measurement
It is known that greyhounds are able to hear sounds at a higher frequency than humans (45 kHz vs. 20 kHz) [
16,
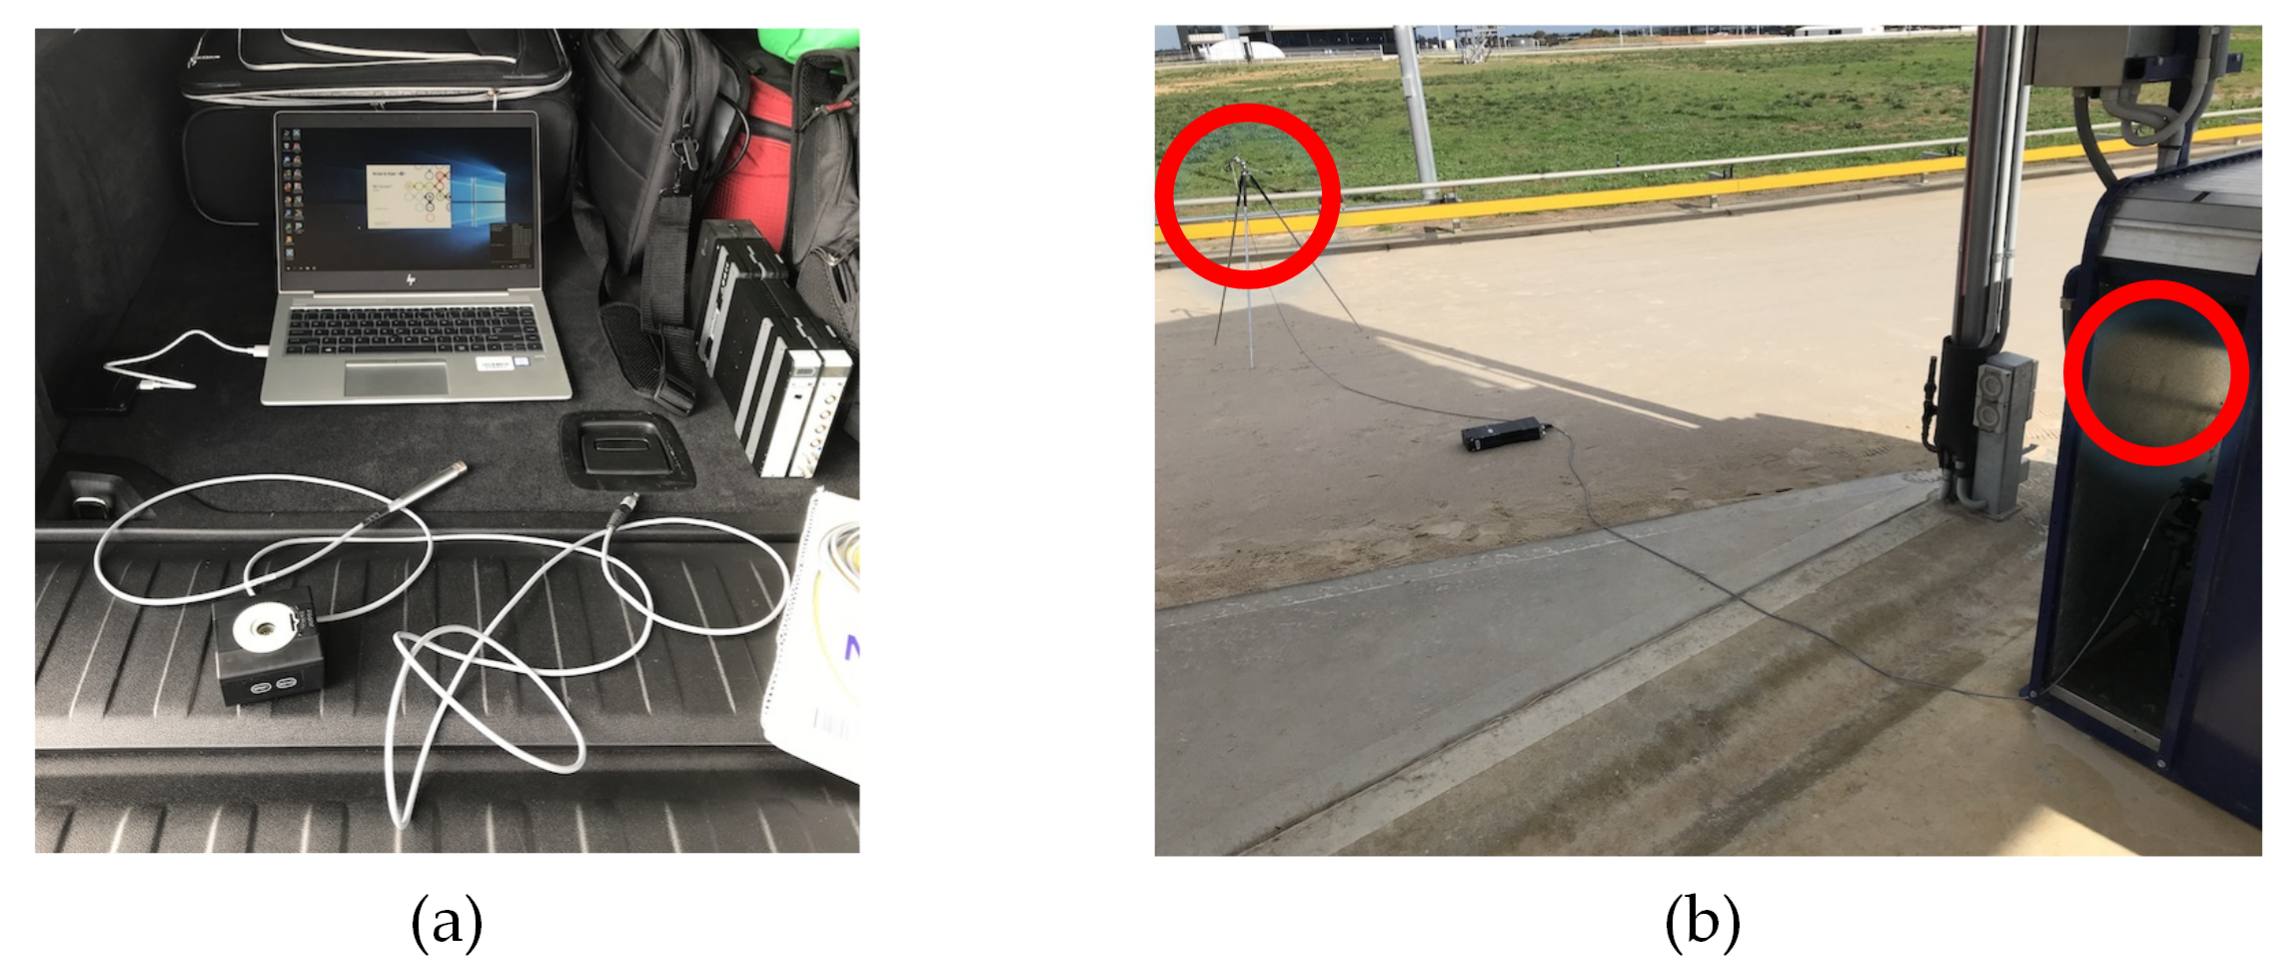
17]. For this reason, a multi-channel noise and vibration data acquisition system and a pair of high frequency microphones were selected over a traditional sound level meter for the collection of the lure sounds. High frequency Brüel & Kjær (B&K) Type 4191 40 kHz measurement grade microphones were used for the acoustic signals collection. This type of microphone has a temperature coefficient of −0.002 dB/°C and its temperature range is −30∼300 °C. So the temperature change in the day has very small impacts on the measurement. The connection between the data acquisition LAN-XI front-end and the host PC was wireless. The B&K LAN-XI Battery Module shown to the right of the image in
Figure 3a enabled the front-end to be located on the track with 2 m cables connecting each of the two microphones—one adjacent to the rail, one in starting Box 1—as shown in
Figure 3b. The required signal conditioning for the externally polarised microphone was provided by the front-end input module. Prior to and after data collection, the microphones were both calibrated using a B&K Type 4231 microphone calibrator as can be seen in the foreground in
Figure 3a. This ensured the correct function of the measurement chain and that the correct gain levels were set for optimum data precision.
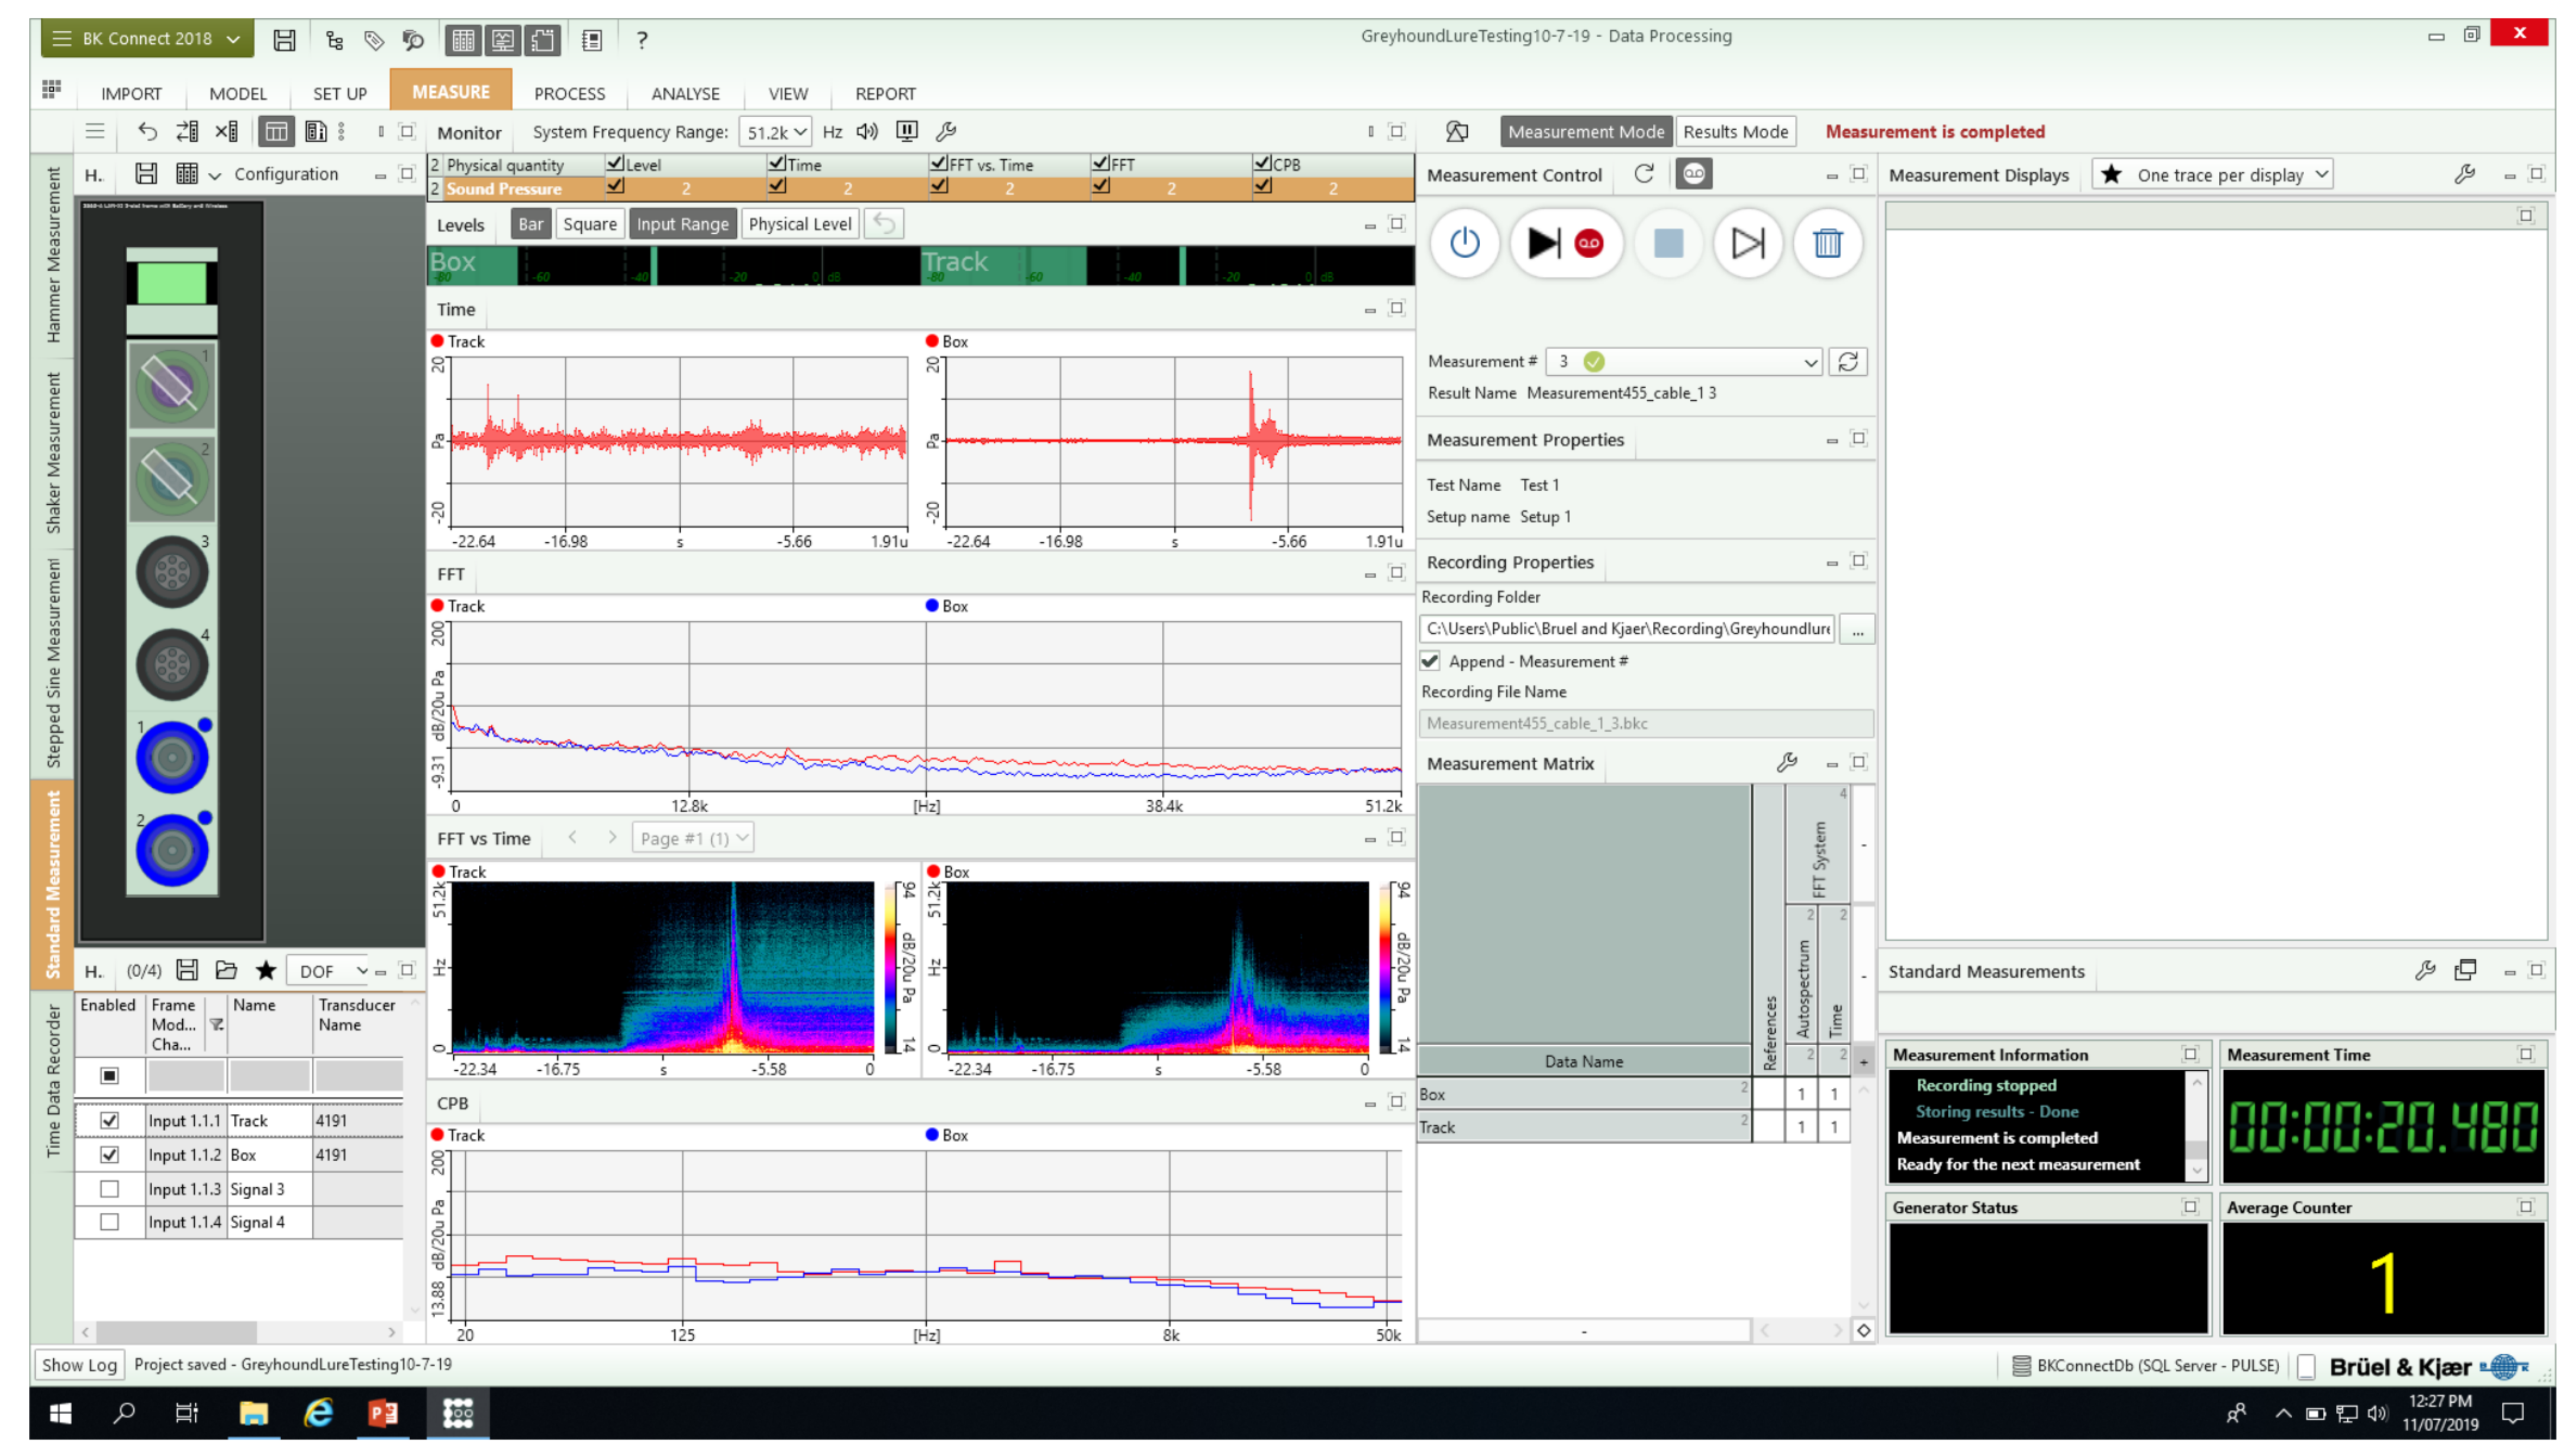
The B&K Connect acquisition software was used to control the data acquisition process with the software interface shown in
Figure 4. As can be seen therein, time data were recorded externally to the project into a proprietary file format.
For each experiment, two simultaneous acoustic recordings were taken positioned 0.6 m from the ground at the following two locations: within starting Box 1 and approximately 2 m from the inside track measured perpendicular from the box opening trigger.
Figure 3b shows the microphone layout which was approximately common at each of the start locations with the microphone positions highlighted by the red circles. The acoustic signals within the box offer insights as to what the greyhounds experience before and shortly after the box gate is opened. The presence of the box should attenuate the higher frequency content generated by the lure motion. The signals on the track, meanwhile, represent the true acoustics of the lure system and offer insights as to what the greyhounds experience while chasing the lure. Tripods were used to position the microphones approximately at required height with the orientation of the microphone at the rail being normal to the rail and that in the box being in the direction of the gate. It should be noted that a wind shield was not used for the microphone installed on the track and that the conditions on the day of measurement were unfortunately particularly windy at times. The impact of the environmental noise on the acoustic measurements can be observed within the collected data.
Approximately 20 s duration recordings were captured with the data acquisition system frequency range specified at 51.2 kHz, corresponding to a sampling rate of 131.1 kHz. This yielded a useful frequency bandwidth of approximately 40 kHz with post-processing for frequency spectra to be conducted subsequently. Since an external trigger was not available to start the data acquisition at a convenient moment consistently for each trial (e.g., at the moment the signal for the box gate opening was triggered), manual start/stop was deployed with start at least 5 s ahead of the gate opening. The commencement of the lure after starting the acquisition system was achieved over a two-way radio and hand signals to the lure operator.
3.1. Lure Sound Measurements at the 395 m and 455 m Starts
Nominally identical acoustical measurement campaigns were undertaken at the 395 m and 455 m starts. As shown in
Figure 1a, the 395 m start is located approximately halfway along the back straight. This box location allowed acoustical data to be measured while the lures approached and pulled away from the microphones along straight sections of track before and after the measurement location. The 455 m start is located at the start of the back straight. This box location allowed acoustical data to be measured while the lures approached on a bend and pulled away along a straight section of track [
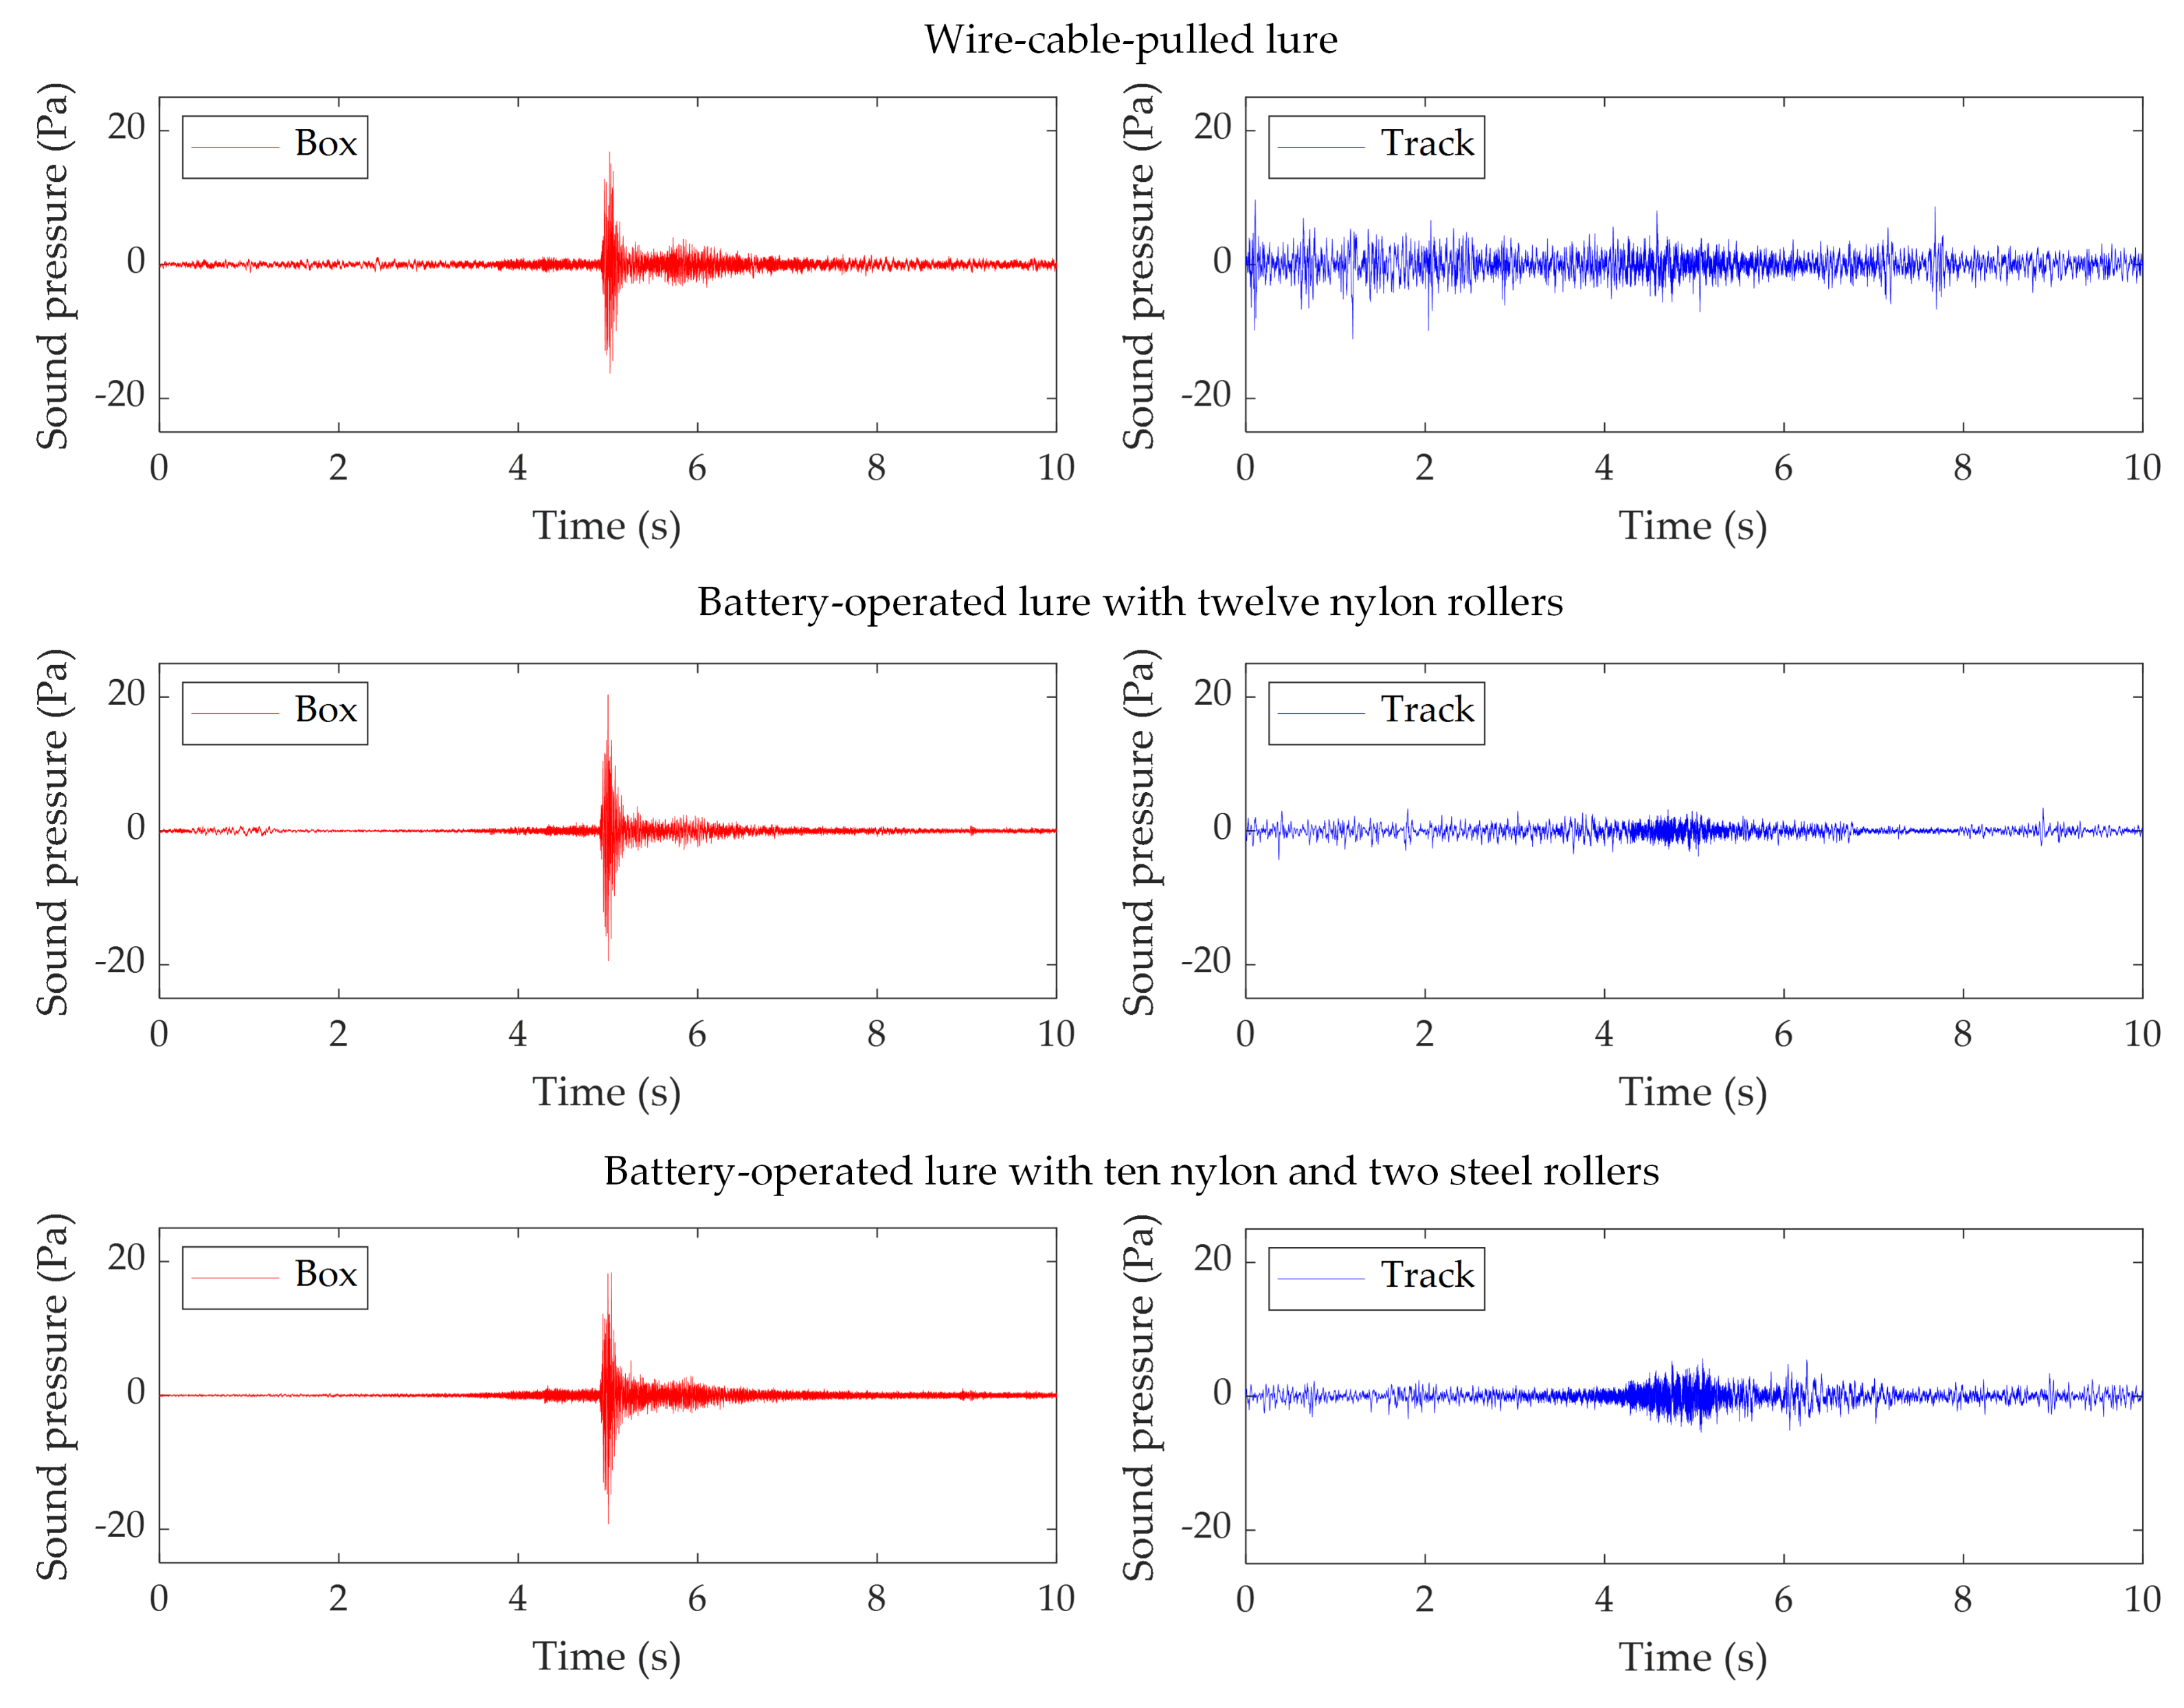
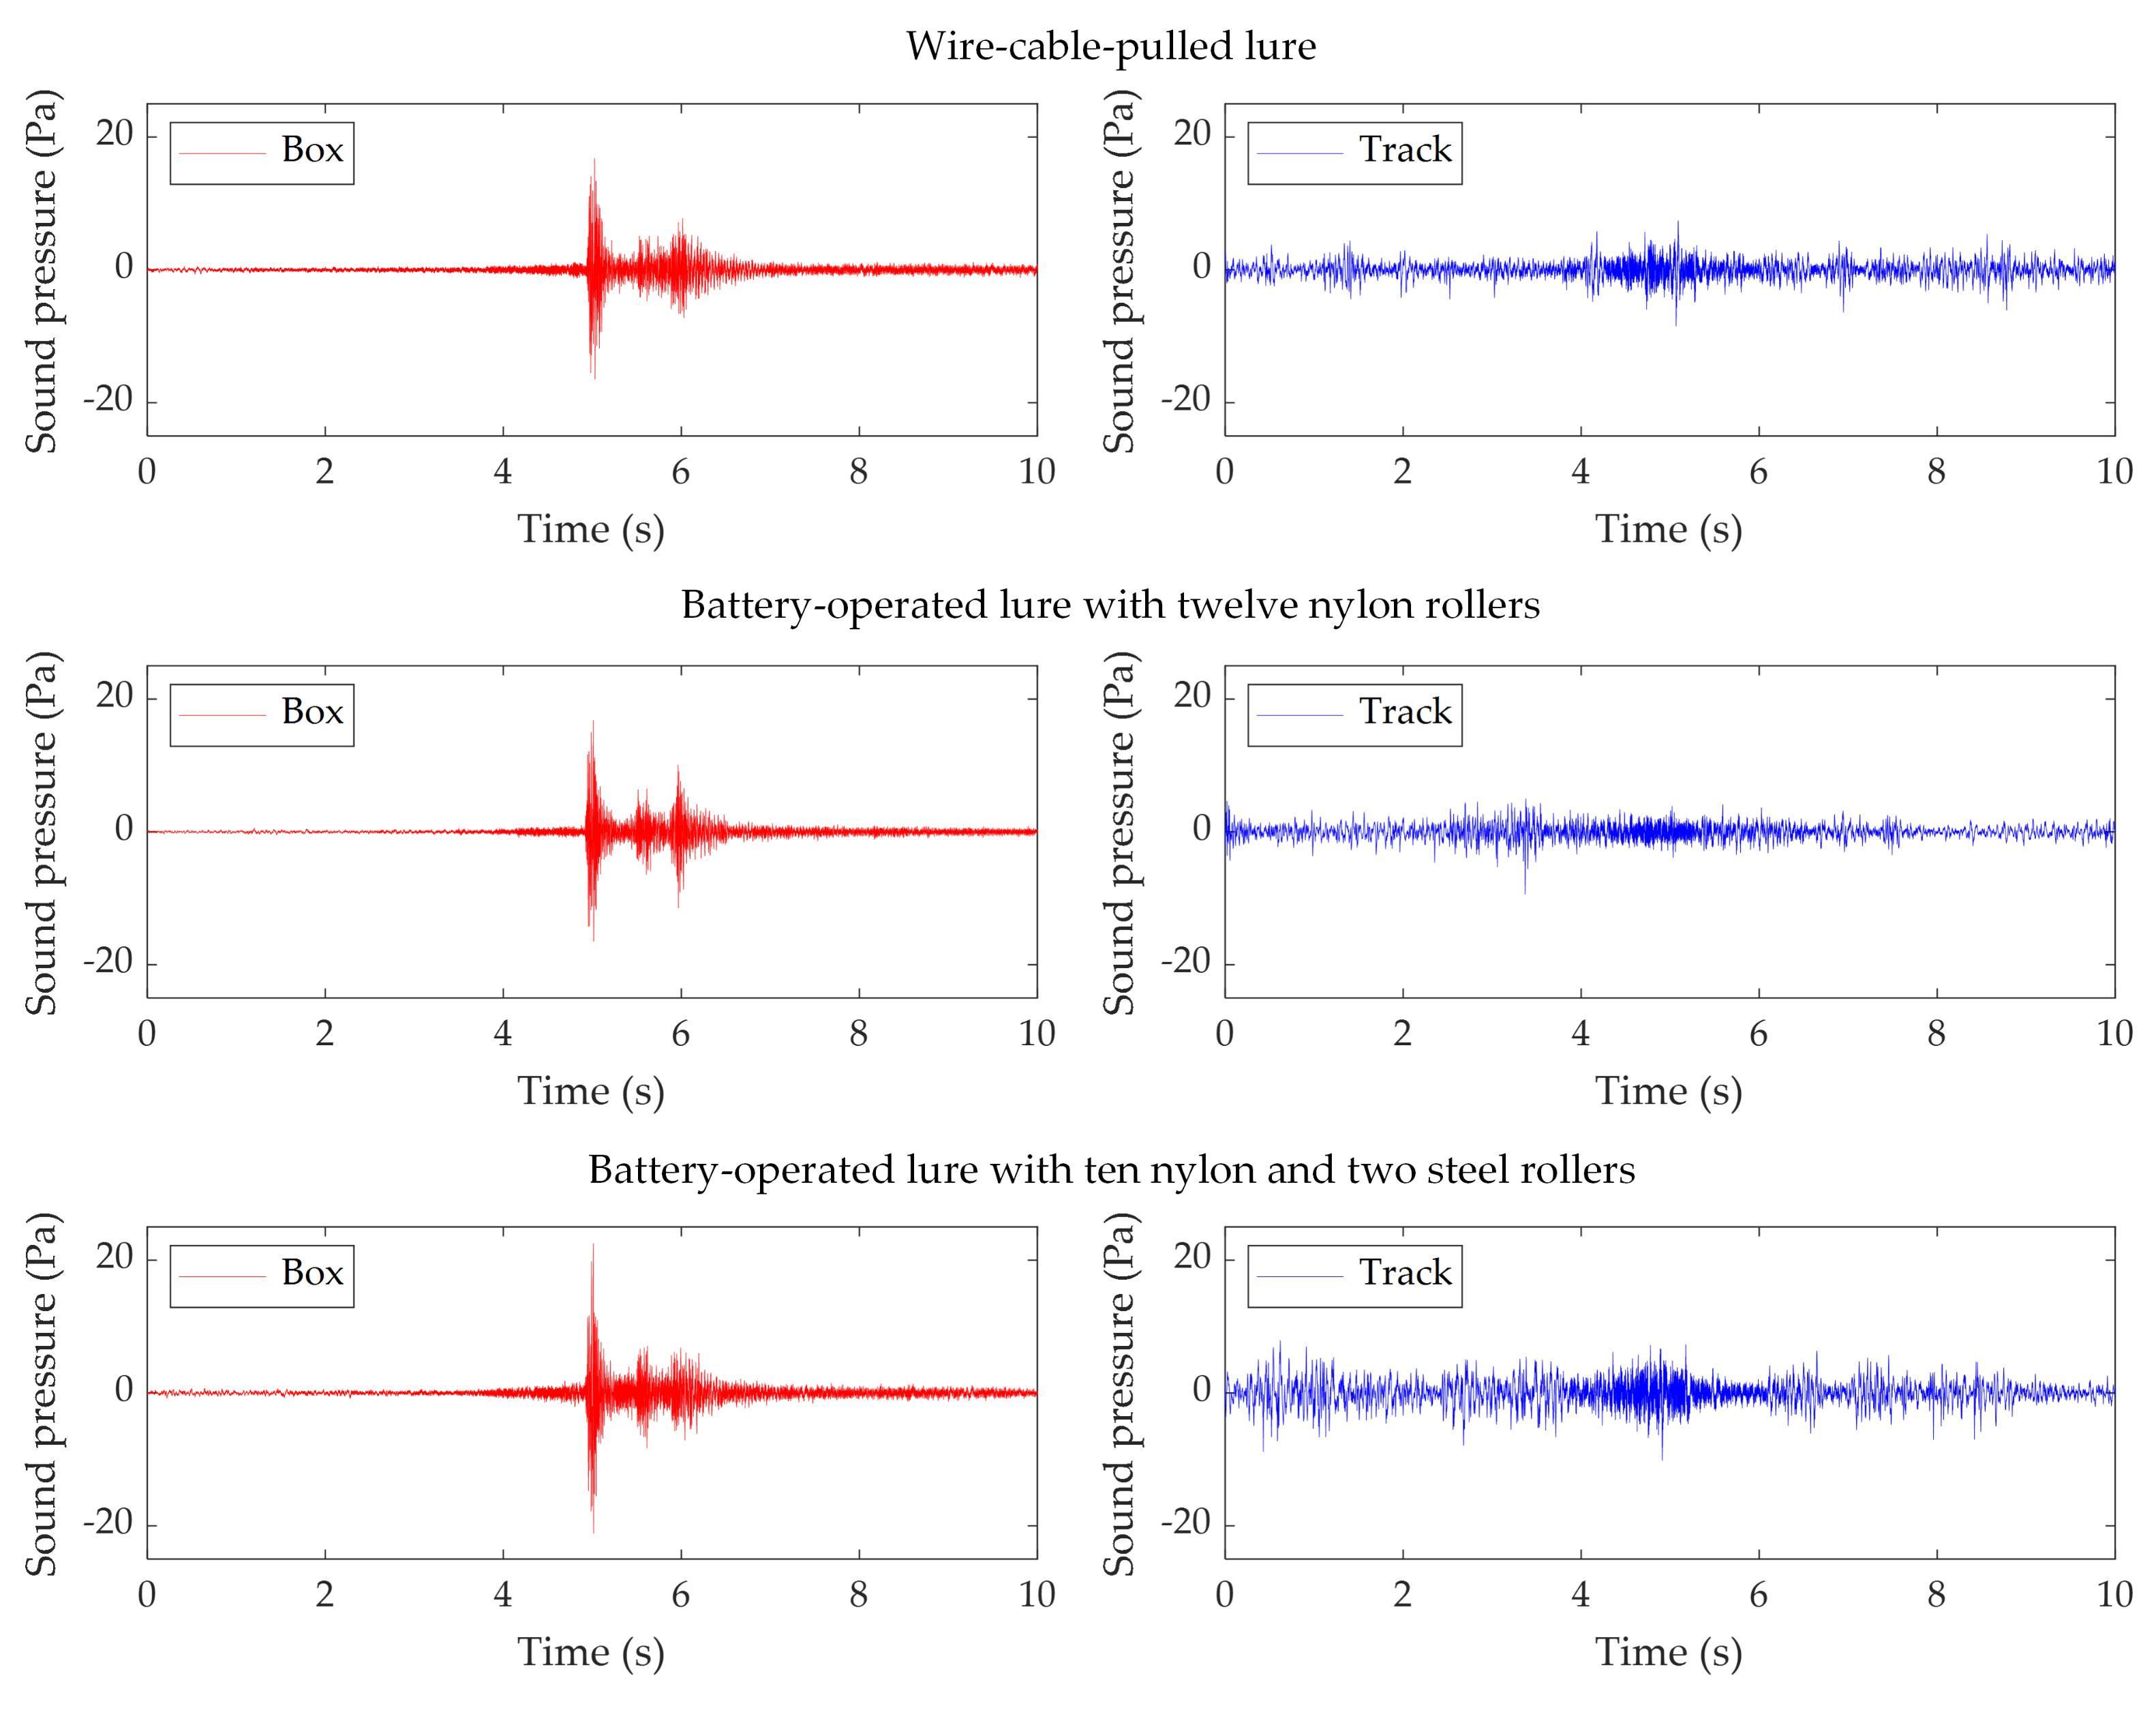
18]. It is hypothesised that there might be different acoustic performance in each case due to the presence of the curved section which may lead to roller/rail squeal interaction. For both the 395 m and 455 m starts measurement campaigns, the lures commenced from a standing start at the relevant ‘red starter marker’ and moved along the track with the normal speed as they would under race conditions. The boxes were activated and opened when the lures passed as they would under race conditions. The sound signals measured at the 395 m start and 455 m start are shown in
Figure 5 and
Figure 6 respectively.
Around 10 s acquisition results are presented, 5 s from each starting distance before and after the box gate was triggered and opened. The large peaks at around 5 s in the box sound signals indicate the box gate opening. It is noted that there are also two small peaks in the box sound signals after the gate opening in
Figure 6 which don’t appear in
Figure 5. They are introduced by gate actions after opening rather than the environmental noise and lure sounds. This only occurred with the 455 m starting box gate. Looking at the lure sound signals measured in the box, when the lures are approaching, the lure sounds in the box are obviously increased which could excite the greyhounds and ready them to jump. After the box gate is opened, the lures keep moving closer to the box and the sound pressure in the box continues to increase. This assists the greyhounds to recognise the lure position from previously learned auditory clues and readies them to jump out of the box when the gate is opened.
After the greyhounds are released from the starting box, they chase the lure as a result of visible and audible stimuli. The acoustic signals measured on the track also show increments when the lure passes. However, in addition to the lure sounds, the microphone also records significant environmental noise which sometimes even has higher sound pressure than the lure sounds. In the following sections, frequency domain and sound quality analyses of the measured signals were therefore conducted to extract the potentially critical characteristics from the lure acoustic performances and to compare them from different perspectives.
3.2. Sound Pressure Level Analysis
Sound pressure level (SPL) describes the effective pressure of a sound relative to a reference sound pressure which is normally selected as the human hearing threshold. The SPL could be calculated by Equation (
1).
where
p is the sound pressure,
is the reference sound pressure which is normally selected as 2 ×
Pa in air.
Since the sampling rate is very high in the measurements, averages of every 50 ms were taken from the measured lure sound pressure so fewer data were obtained, otherwise the plot lines would have been very condensed and it would have been harder to extract information from them. The SPL of different lure sounds measured at the 395 m and 455 m starts are shown in
Figure 7 and
Figure 8. It is found that during the whole process, there are not obvious peaks in the track recordings even when the lures pass the microphone. This indicates that from the SPL perspective, the lure sound does not exceed the environmental noise and is immersed in the environmental noise. The noise measured in the box is significantly lower than that measured on the track, which confirms the sound isolation effect of the starting box. With lower environmental noise in the box, the SPL clearly increases when the lures pass the box. The peak SPL at around 5 s in the box is introduced by the box gate opening.
4. Frequency Domain Analysis
Signal processing in the frequency domain was conducted in this section to investigate the frequency components of the lure sounds and pressure distribution against frequency. The results are organised into two further subsections—one with the data presented in Constant Percentage Bandwidth (CPB) format and the other with the data presented in Fast Fourier Transform (FFT) format. Both data presentation formats are equivalent and show the measured data in the colour map format. The difference between CPB and FFT formats are that the frequency axis is a logarithmic scale for the CPB whereas it is a linear scale for the FFT. The CPB format is often used for acoustic data, instead of the FFT format since the human ear response to increasing frequency has been shown to be closer to logarithmic than linear [
10,
19]. This is presumed to be similar for greyhounds. The disadvantage with the CPB format is that the resolution in the frequency axis is limited, particularly for higher frequencies. The FFT format has fixed frequency resolution, defined by the reciprocal of the data length used, and can therefore enable extraction of closer frequency peaks at higher frequencies than can be achieved with interpretation of the CPB format.
The signal processing in the frequency domain was conducted with the B&K connect software with the parameters shown in
Table 1.
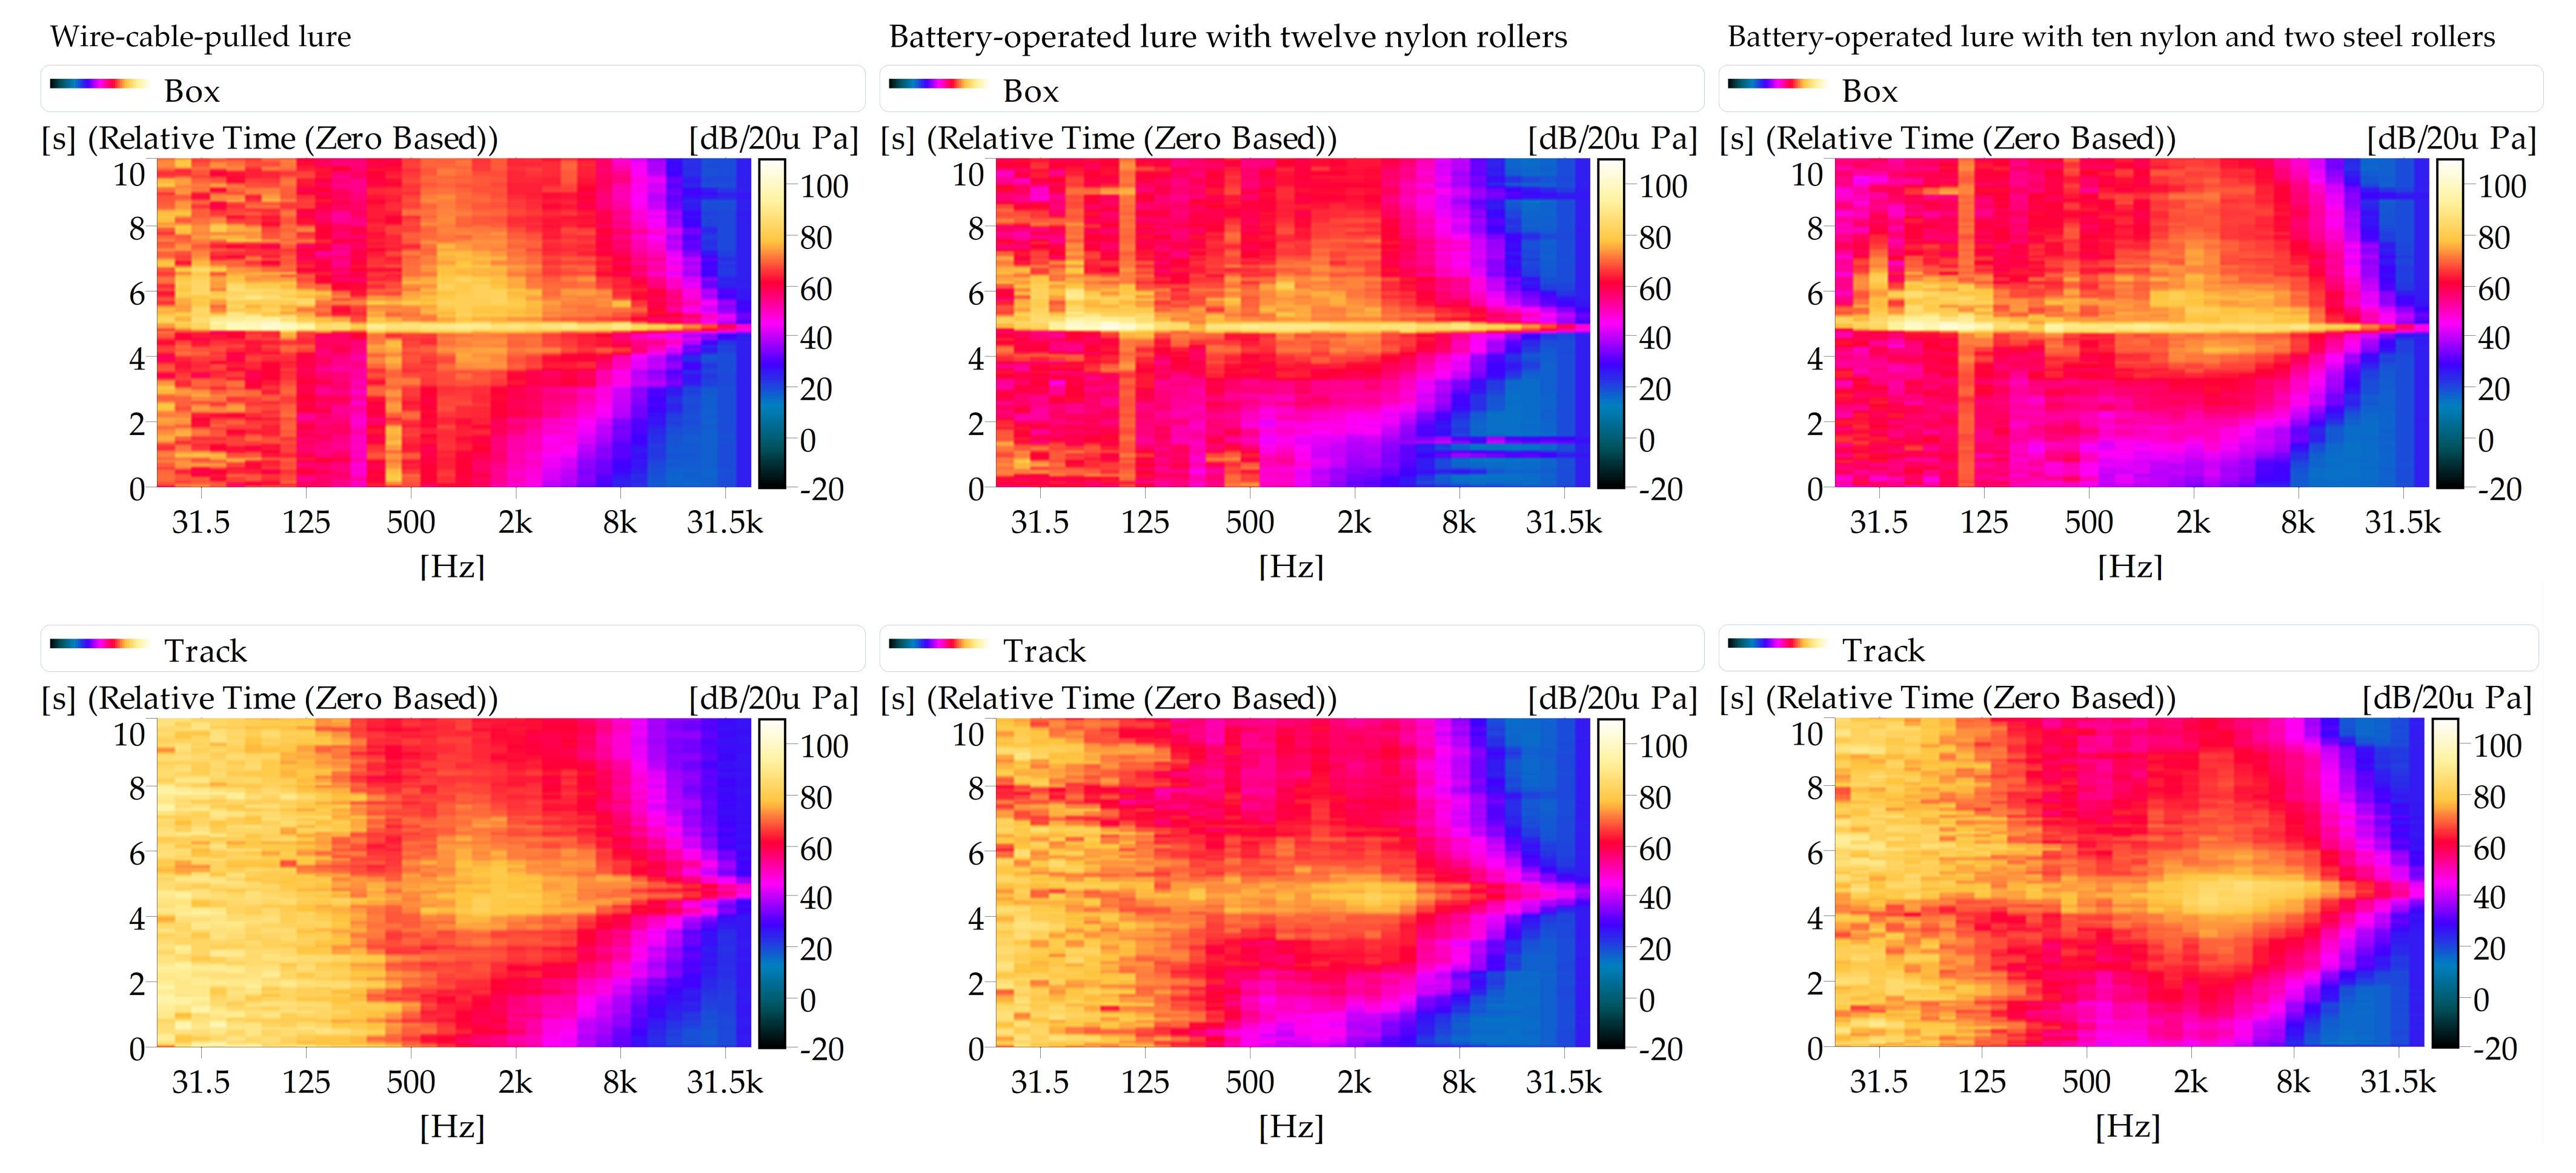
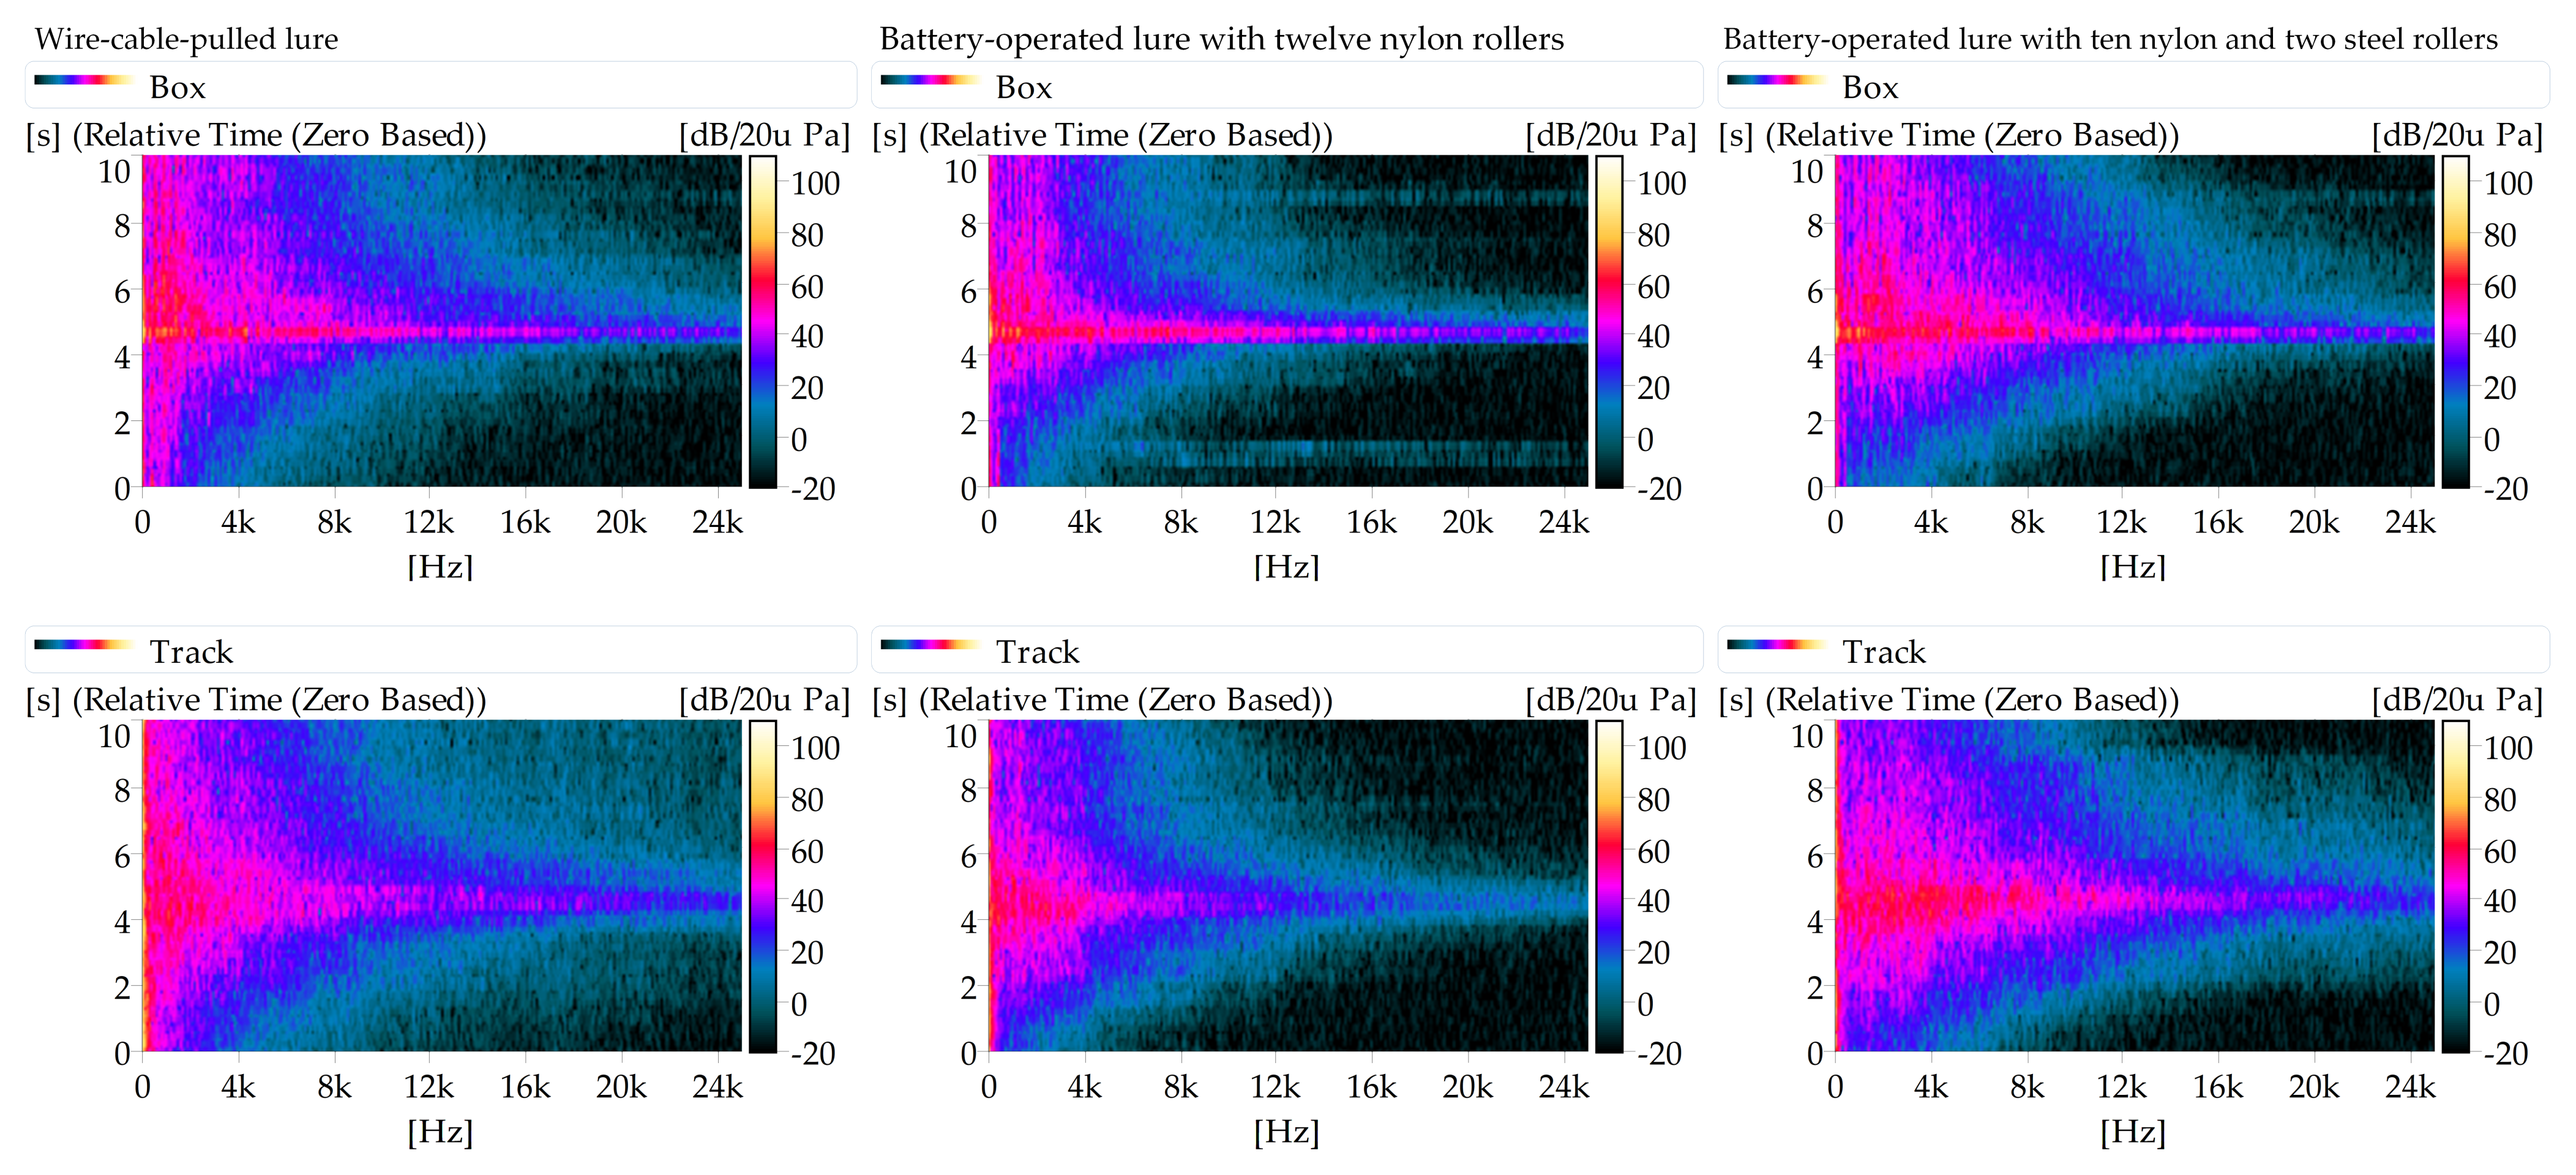
The CPB and FFT analysis results of the lure sounds measured at the 395 m start are shown in
Figure 9 and
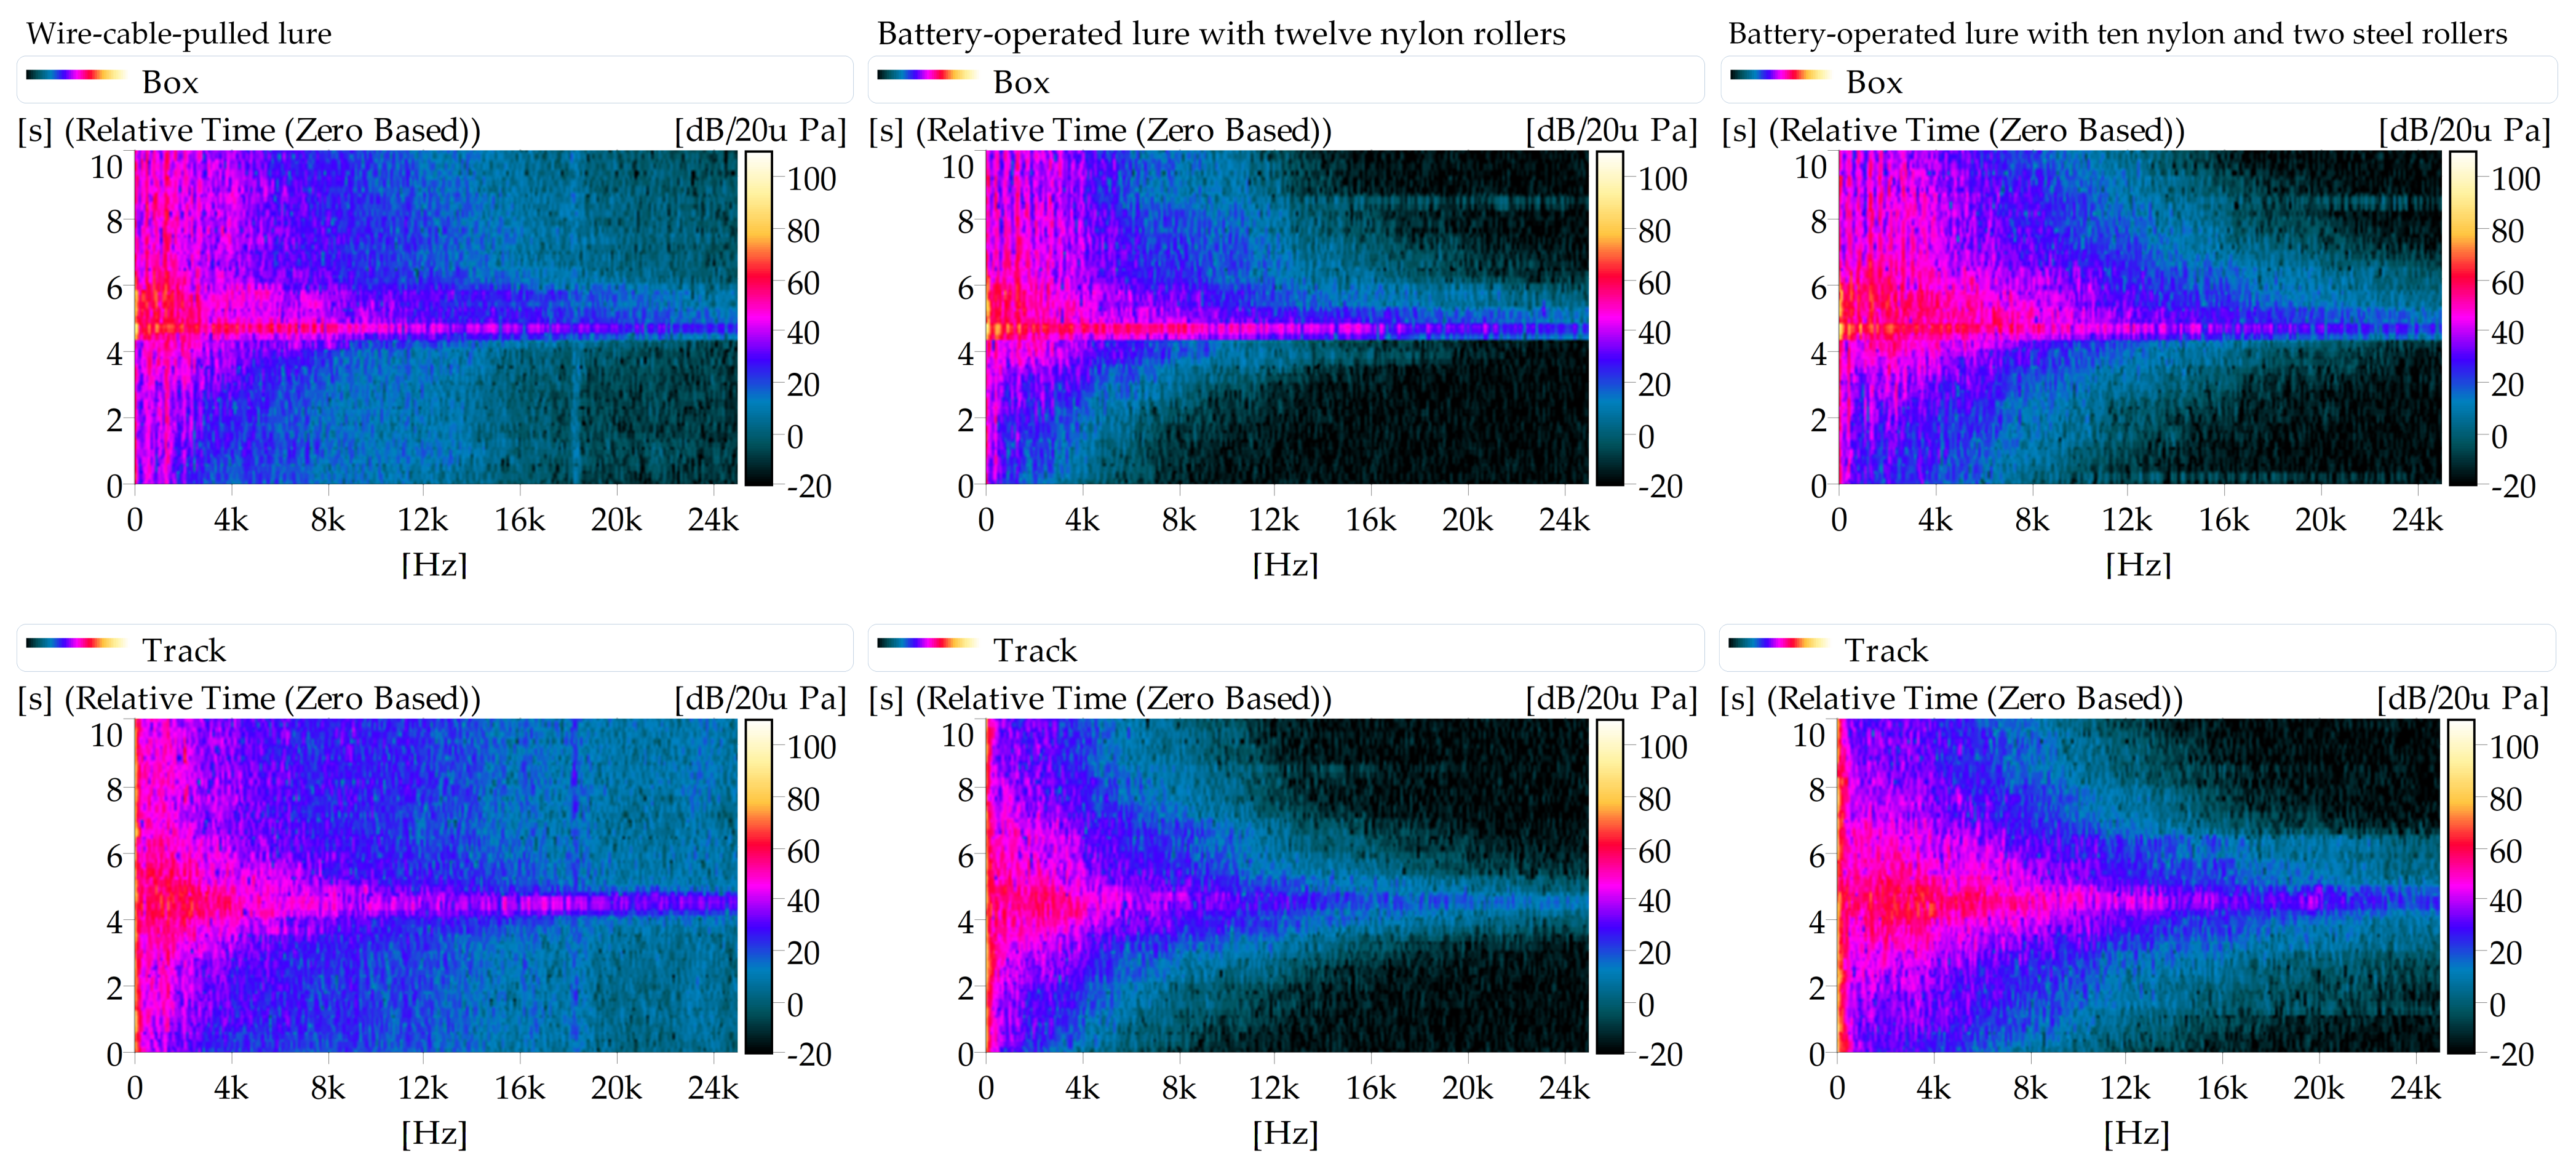
Figure 10. The CPB and FFT analysis results of the lure sounds measured at the 455 m start are shown in
Figure 11 and
Figure 12. In all figures, the upper row shows the measured data for the microphone installed within the box whereas the lower row shows the corresponding data for the microphone installed on the track, adjacent to the rail.
In the figures, the x-axis (horizontal across the page) shows the frequency: low frequency to the left; and high frequency to the right. The y-axis (vertical up the page) shows the relative time at which the sound pressure was captured. During this period, the lure approaches and pulls away from both the microphones, one within Box 1 and the other on the track. The z-axis shows the measured sound pressure level, again on a logarithmic scale, with the colour identified in the legend to the right-hand side of the plot defining the SPL in dB. All of the plots have a common and fixed scale from −20 dB to 110 dB for the sake of easy comparison of data from different scenarios.
There are some interesting observations to be made from the interrogation of the results. In
Figure 9 and
Figure 11, the strong horizontal line appearing in the box sound signal at the 5 s represents the box gate opening. The gate opening is of short duration but large amplitude action as demonstrated by the sound pressure measured in the box. Accordingly, this impulsive signal in the time domain appears as a wide frequency signal in the frequency domain. The powerful low frequency components in the track sound signals which don’t show in the box sound signals before the gate opening are identified as the environmental noise. This is depicted by the yellow colour in the CPB colour map plots in the frequency range below the 125 and 250 Hz 1/3 octave bands.
Looking at the sound signal measurements in the box, it can be seen that environmental noise was blocked in the box before the gate opening and was not obviously increased even after the gate was opened. However, it was observed that even before the gate was opened, there were high frequency components measured which also appeared in the track sound signals. These were identified as the lure sounds since their SPL increased before, and reached its peak shortly after, the gate opening and then decayed, which corresponded to the approaching and moving away of the lure relative to the microphones.
Interestingly, in addition to the high frequency components, the box sound signals also showed low frequency components after the gate was opened. The origin of these sounds is uncertain. If their origin was environmental noise they should always exist after the gate opening as in the track sound signals. Although they show similar increasing, decreasing and peak trends as do the high frequency lure sounds after the gate opening, which suggests they could be part of the lure sounds, it is not clear why they do not appear before the gate opening like the high frequency components. They may be caused by the box itself since some other components were determined to be generated by the box, such as the clear peak at 500 Hz which was evident in the box sound signals especially after the gate opening but was not present in the track sound signals. Besides, ideally in the box sound signals, the environmental noise should be distributed randomly as in the track sound signals and the lure sounds should also decay after they pass the box. However, the box sound signals clearly show other components than the noise and lure sounds, which are waiting to be confirmed by supplementary tests in the future.
Significant differences exist between the different lure systems at each of the starting positions. The data presented in the CPB analysis is clearer than the FFT. The data indicate that the battery-operated lure with twelve nylon rollers displays lower energy levels than the wire-cable-pulled lure. In the colour map this is represented by less yellow/white than for the wire-cable-pulled lure baseline data. Conversely the battery-operated lure with ten nylon and two steel rollers shows a similar or even higher level of energy in the signal compared to the wire-cable-pulled lure. Furthermore, comparison between the battery-operated lures with steel and nylon rollers shows that the higher level frequencies are in the higher frequency range for the battery-operated lure with two steel rollers.
The CPB plots of the track lure sounds at both of the 395 m and 455 m starts are nearly symmetrical to a time around 5 s which is the time when the lure passes the microphone on the track. The difference between the lures approaching and moving away from the track microphone may be explained by the Doppler frequency shift. During the time period prior to the lure passes the track microphone, the frequency can be observed to be slightly higher, gradually decreasing to the value at the time when the lure passes the track microphone where there should be no Doppler frequency shift since there is no relative speed between the lure and the microphone. After the lure passes the track microphone and moves away from it, the frequency continues to reduce, as expected.
5. Sound Quality Analysis
Human psycho-acoustic research shows that the perceived sound loudness varies when the sounds have different frequencies even when they have same sound pressure [
20,
21]. Additionally, the human emotional response to sounds is greatly affected by the sound frequency component, typically described as sharpness [
22,
23]. Assuming this theory is also correct for greyhounds, sound quality (SQ) analysis was conducted for the measured lure sounds in this section from the loudness and sharpness perspectives. This hypothesis is made based on the following conditions and observations: Canines have been living together with humans for a long time. In real life, canines live in same sound environment as humans and have evolved to present very similar sound behaviours to humans. For example, humans can “talk” to their pet dogs just in the same way (loudness, stress, tone...) as they talk to other humans; canines respond to human voices well, especially for trained canines. Research [
24,
25] has revealed that canines also present negative emotions to large amplitude sounds like thunder, fireworks and traffic; this is common to human responses to such sounds.
From the frequency domain analysis, a significant amount of low frequency environmental noise in the track signals was observed. It was possible to eliminate the environmental noise without distorting the lure sounds by applying a high-pass filter as the lure sounds clearly had higher frequency than the environmental noise. However, filtering was not used considering that environmental noise also exists during racing and is heard by the greyhounds. Thus, retaining the environmental noise makes the SQ analysis more realistic.
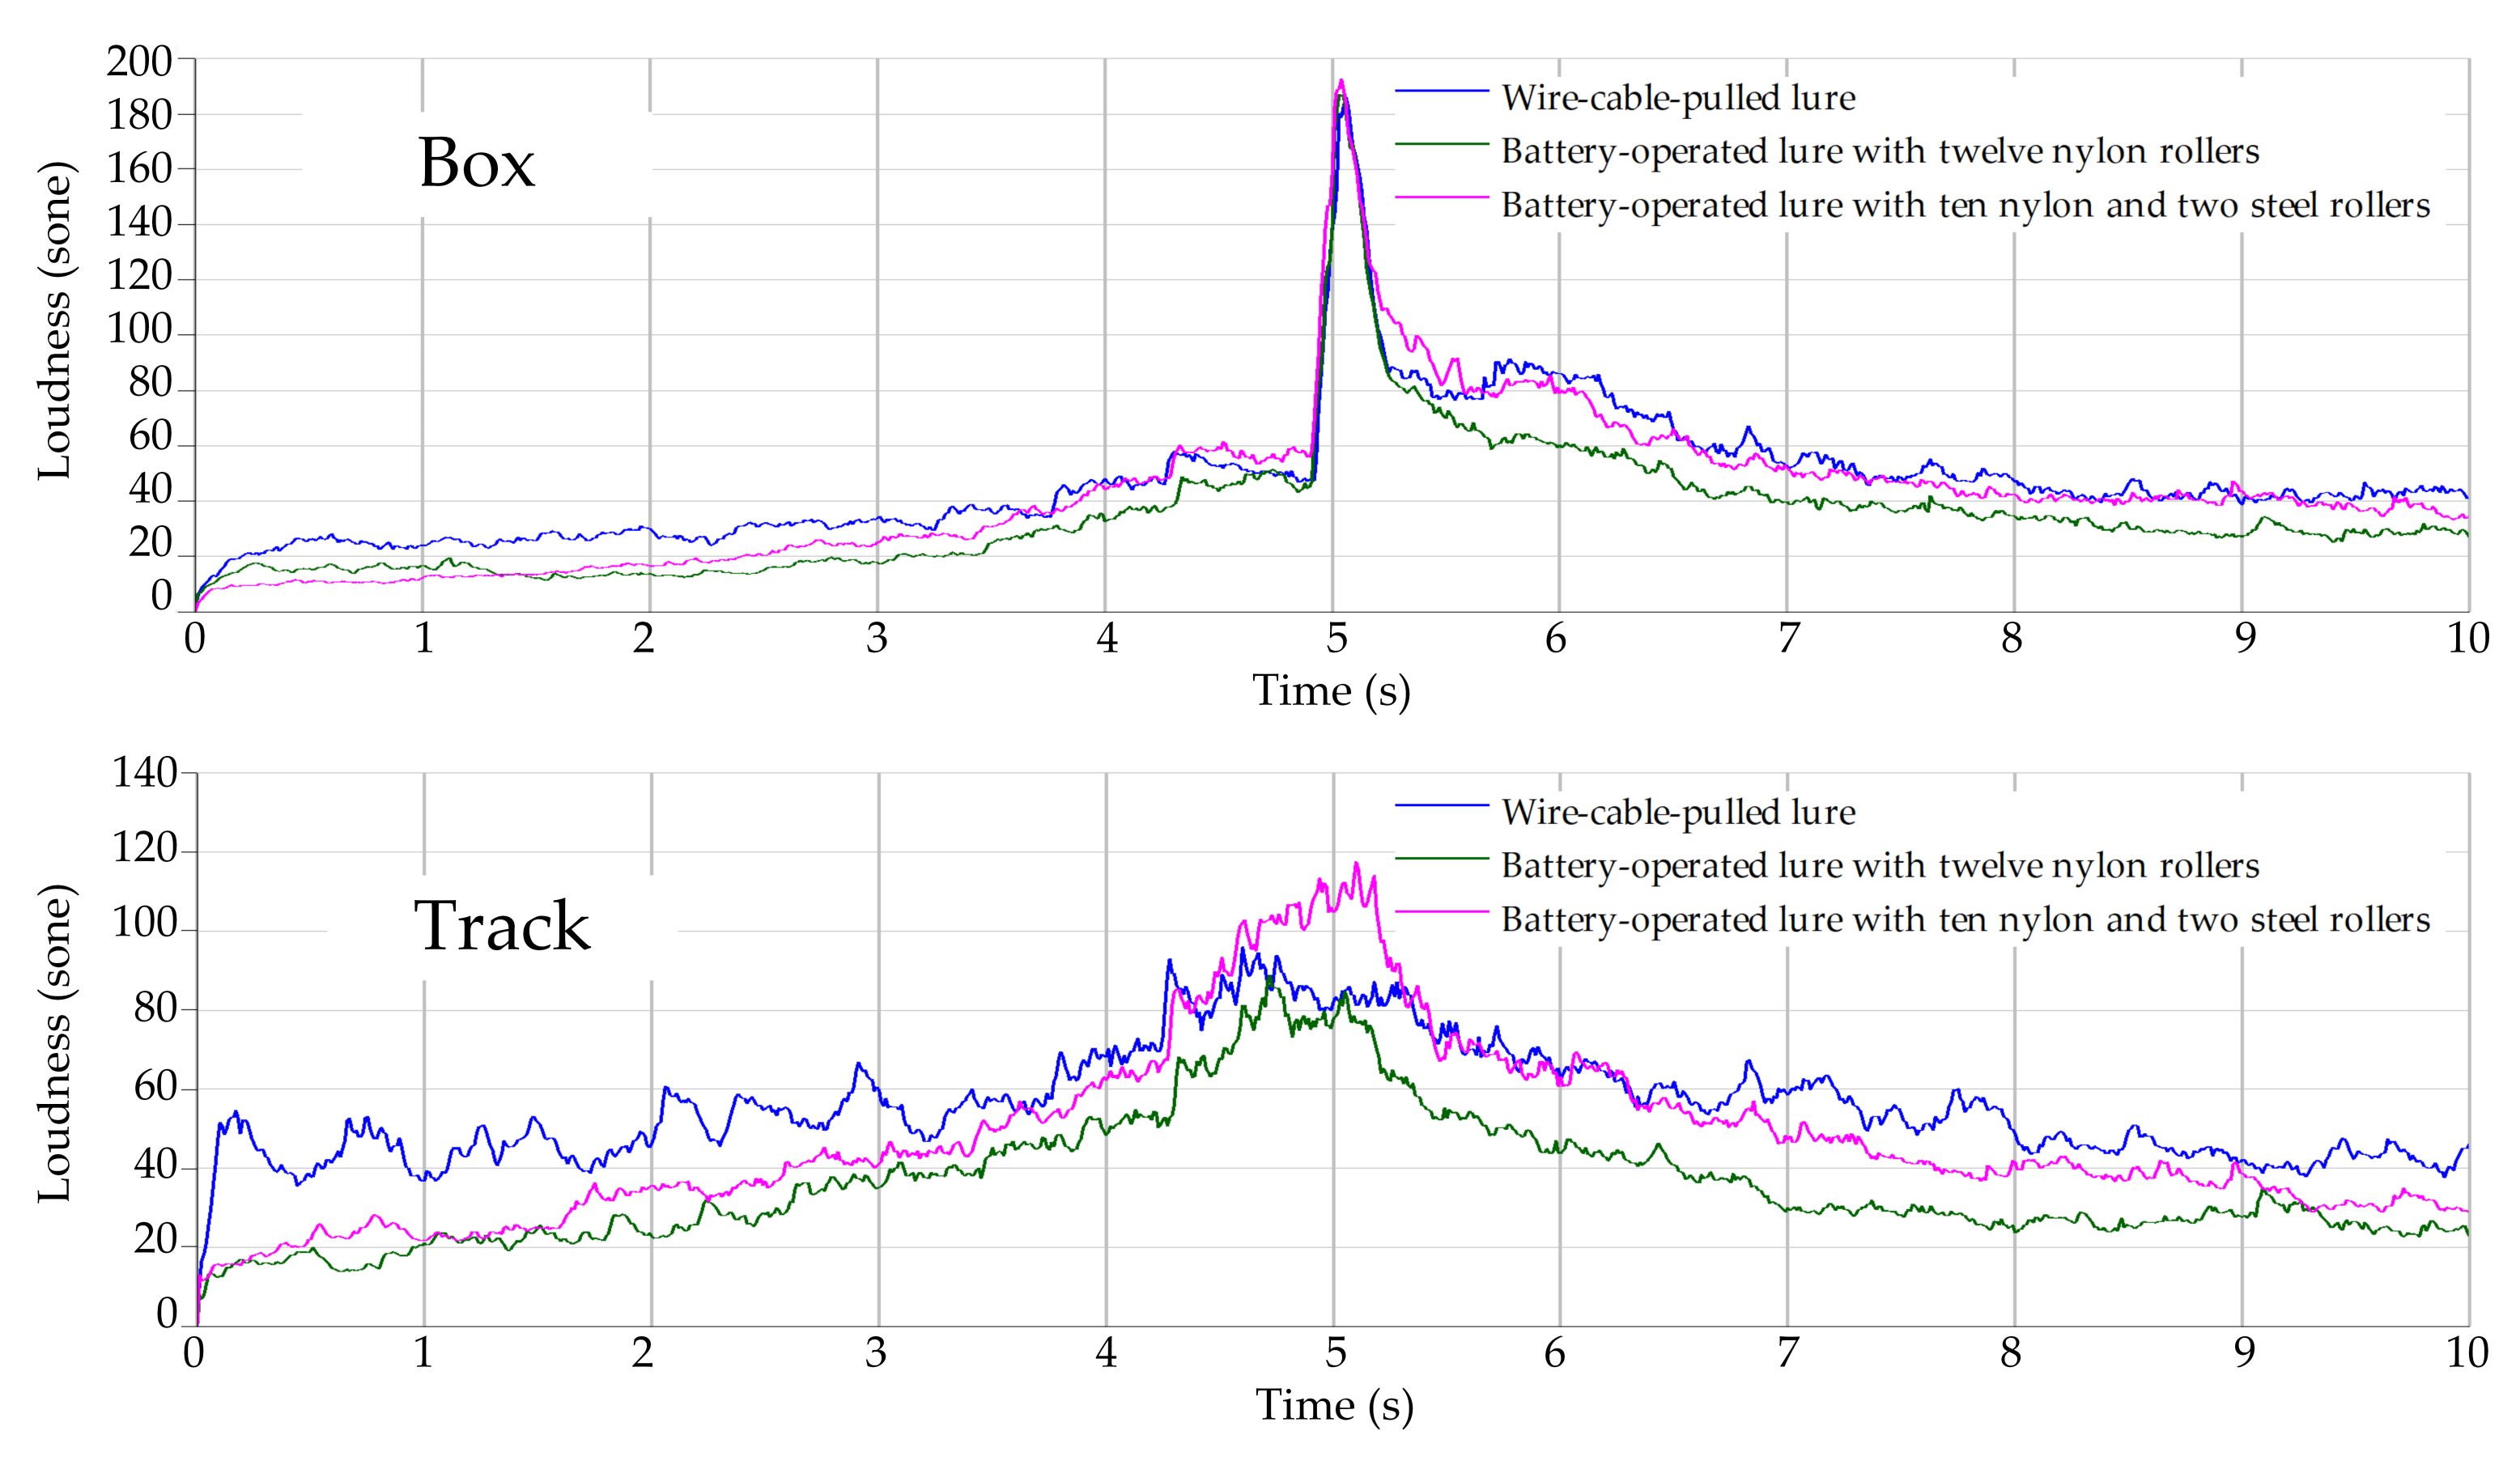
In the SQ analysis, the loudness was calculated according to the ISO 532-1(2017) [
26] with the following parameters: spectrum resolution of specific loudness: 1/8 bark; time interval: 10 ms. The sharpness was analysed using the Zwicker method [
27].
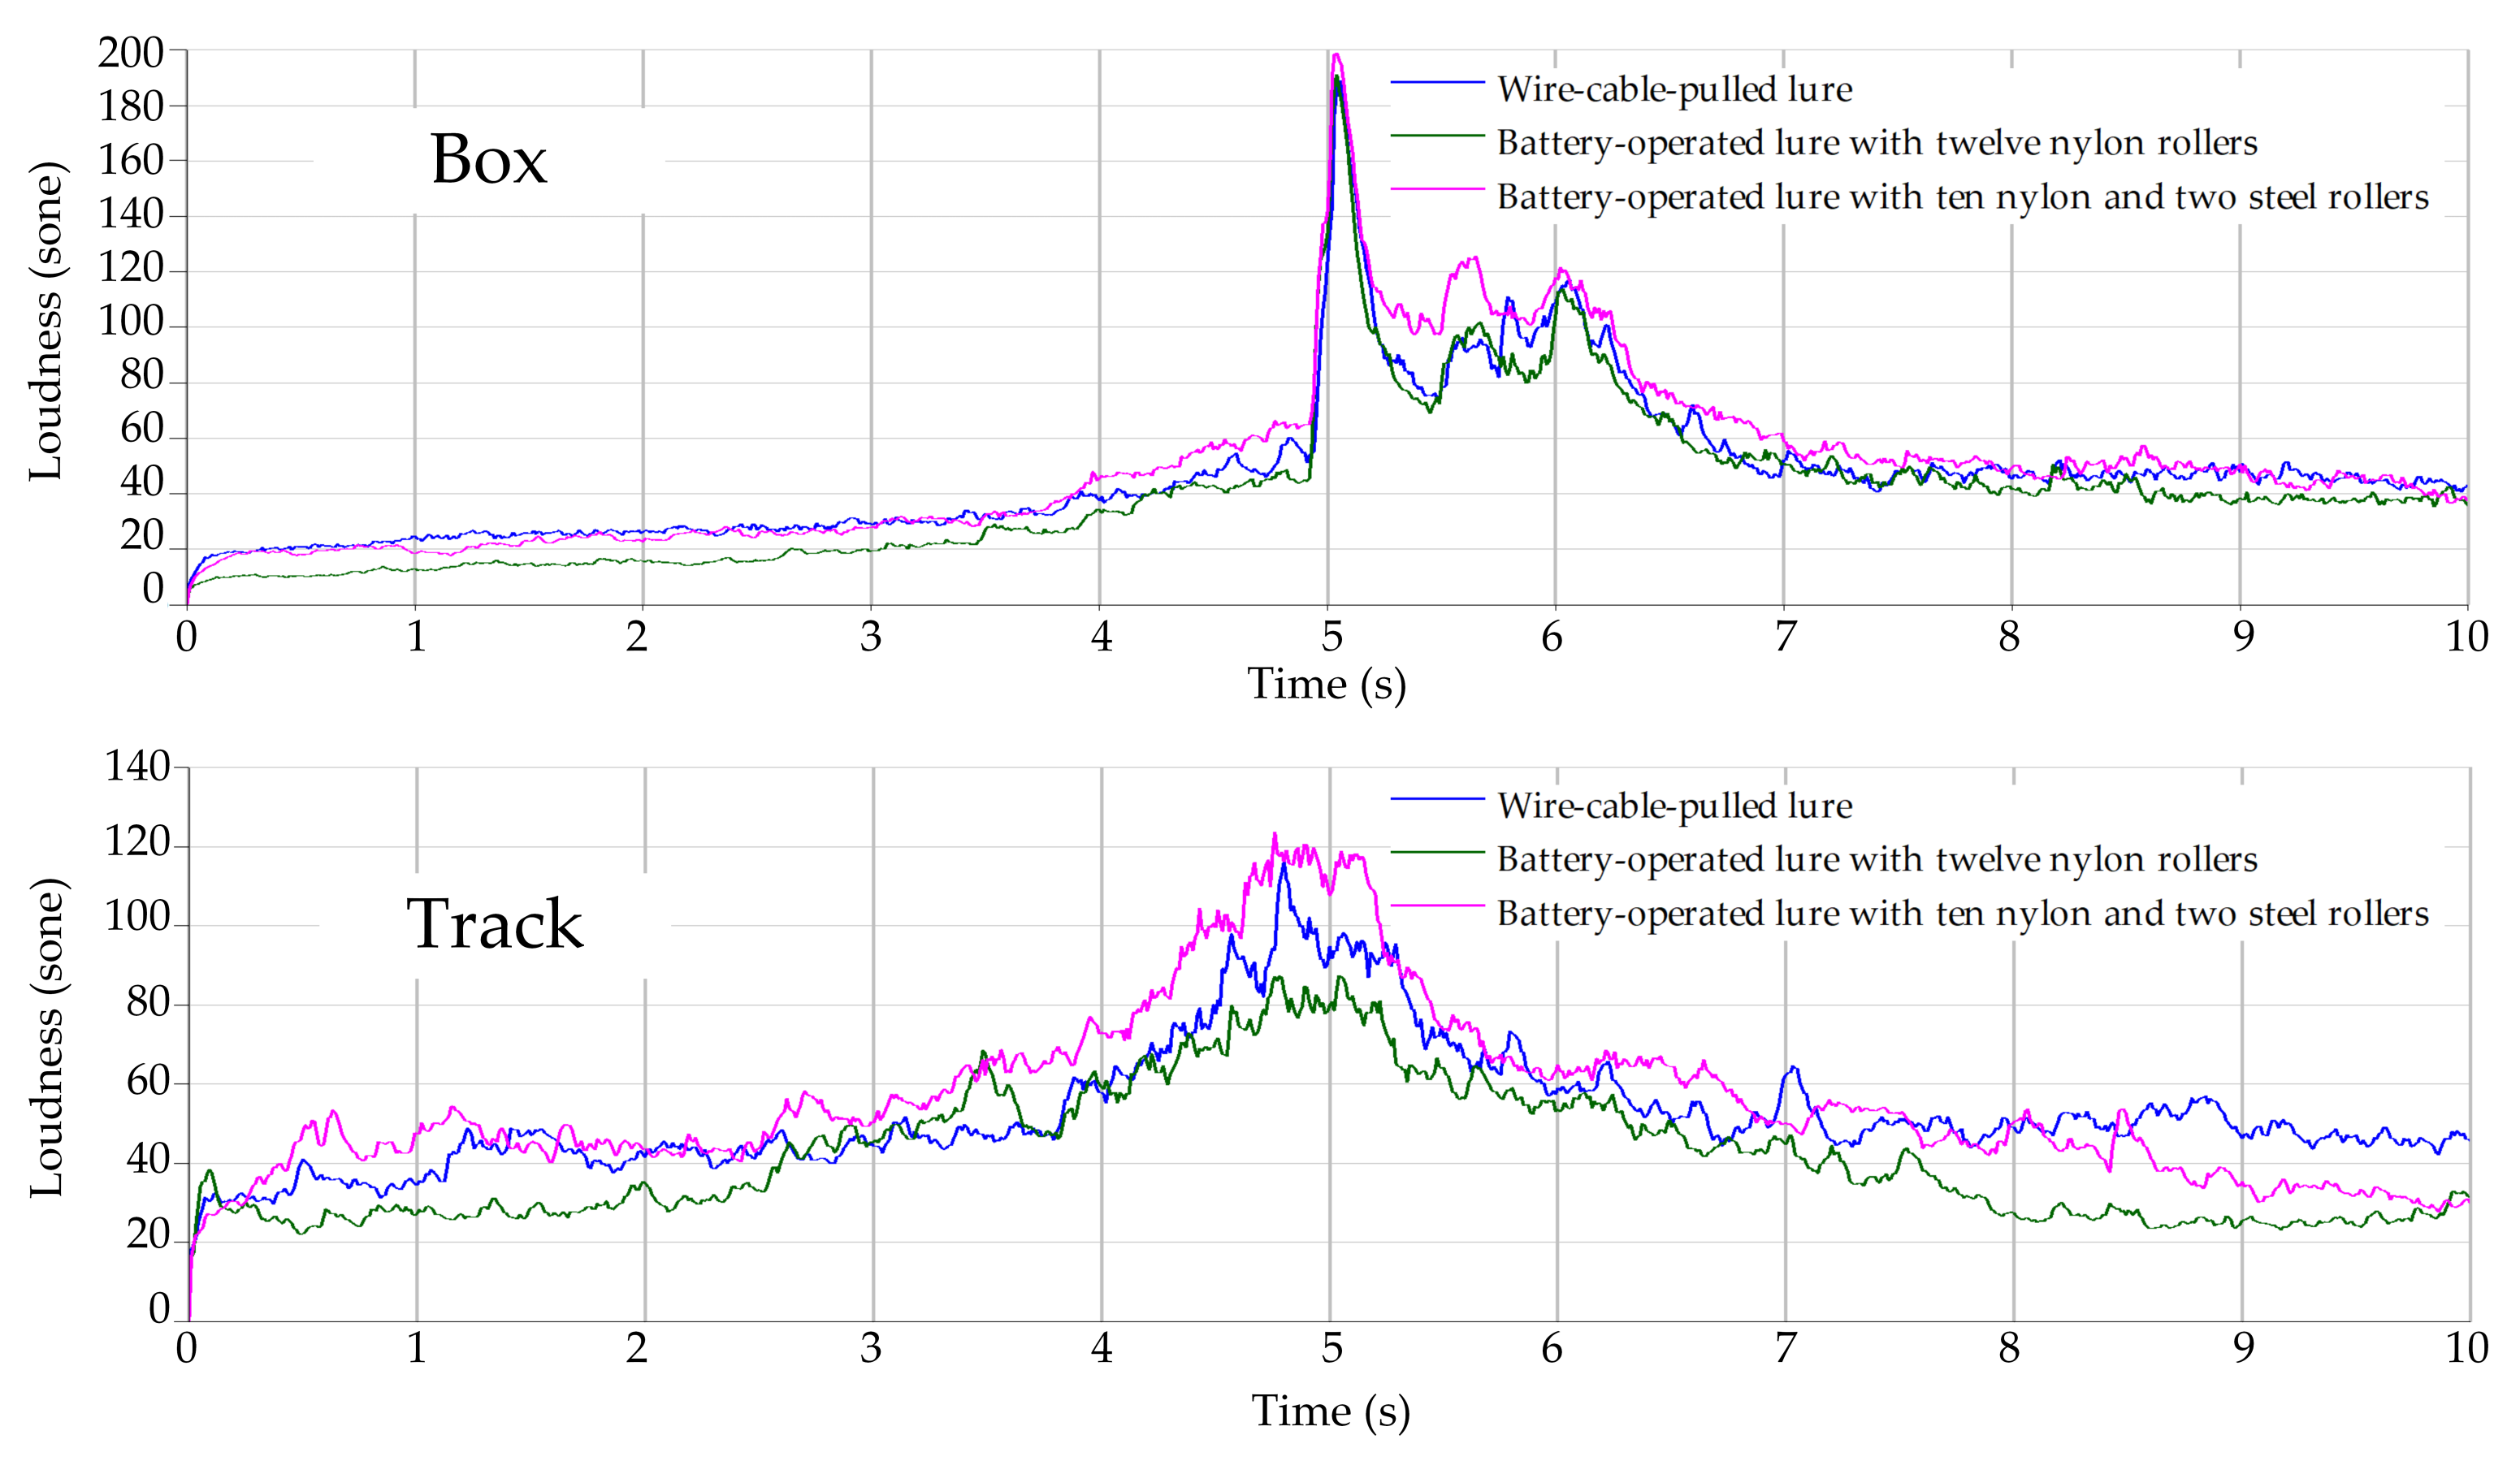
Figure 13 and
Figure 14 show the loudness of different lure sounds measured at the 395 m and 455 m starts respectively.
Comparing the lure sounds measured in the box, the battery-operated lure with twelve nylon rollers had a lower loudness than the wire-cable-pulled lure both before and after the box gate was opened. Using the battery-operated lure may present a problem when the starting box is closed, in so much as the greyhounds may not hear the sound of the approaching lure clearly and may not be sufficiently excited by the sound. If this occurs it may delay some of the greyhounds jumping out of the boxes.
Furthermore, during a race the greyhounds are attracted to the lure by vision and hearing. Greyhounds behind the leading pack are unable to see the lure and supposedly follow the lure sounds.
The lure sounds measured on track shows a significant increase in loudness when the lures are close to the microphone. This demonstrates that the lure sounds have clearly higher loudness than the environmental noise due to relatively higher frequency even if they have similar SPL as the noise. It is therefore possible for the near greyhounds to hear and distinguish the lure sounds from the environmental noise during racing. Nevertheless, the battery-operated lure with twelve nylon rollers shows a reduction in loudness when compared to the wire-cable-pulled lure, so it may not provide a similar level of sound excitation as the wire-cable-pulled lure during racing and the greyhounds chasing performance may also be affected by this relatively quieter lure.
In contrast, when the battery-operated lure is installed with ten nylon and two steel rollers, it shows higher loudness peaks than the wire-cable-pulled lure which implies better hearing excitation during racing. However, it is also worth noting that this lure loudness decays much faster than the wire-cable-pulled lure when it moves away from the microphones. This phenomenon indicates that for greyhounds near the rear of the pack, the battery-operated lure with ten nylon and two steel rollers instead has less loudness than the wire-cable-pulled lure and may provide less chasing incentive. This needs to be evaluated against the non-directional and high level noise produced by the cable-lure which could be equally distracting or even greater distraction. If this were to be proven the battery lure would prove to provide a better chasing incentive than the traditional steel-wire pulled lure. A better lure system may be one that has more metal rollers.
Figure 15 and
Figure 16 show the sharpness of different lure sounds measured at the 395 m start and the 455 m start respectively. It can be seen that the battery-operated lure shows lower sharpness than the wire-cable-pulled lure when installed with twelve nylon rollers but shows higher sharpness than the wire-cable-pulled lure when installed with ten nylon and two steel rollers. This finding is also supported by the CPB and FFT analysis results where the battery-operated lure sound frequency range is lower with twelve nylon rollers than with ten nylon and two steel rollers.
6. Comparison of Wire-Cable-Pulled Lure Running at Different Conditions
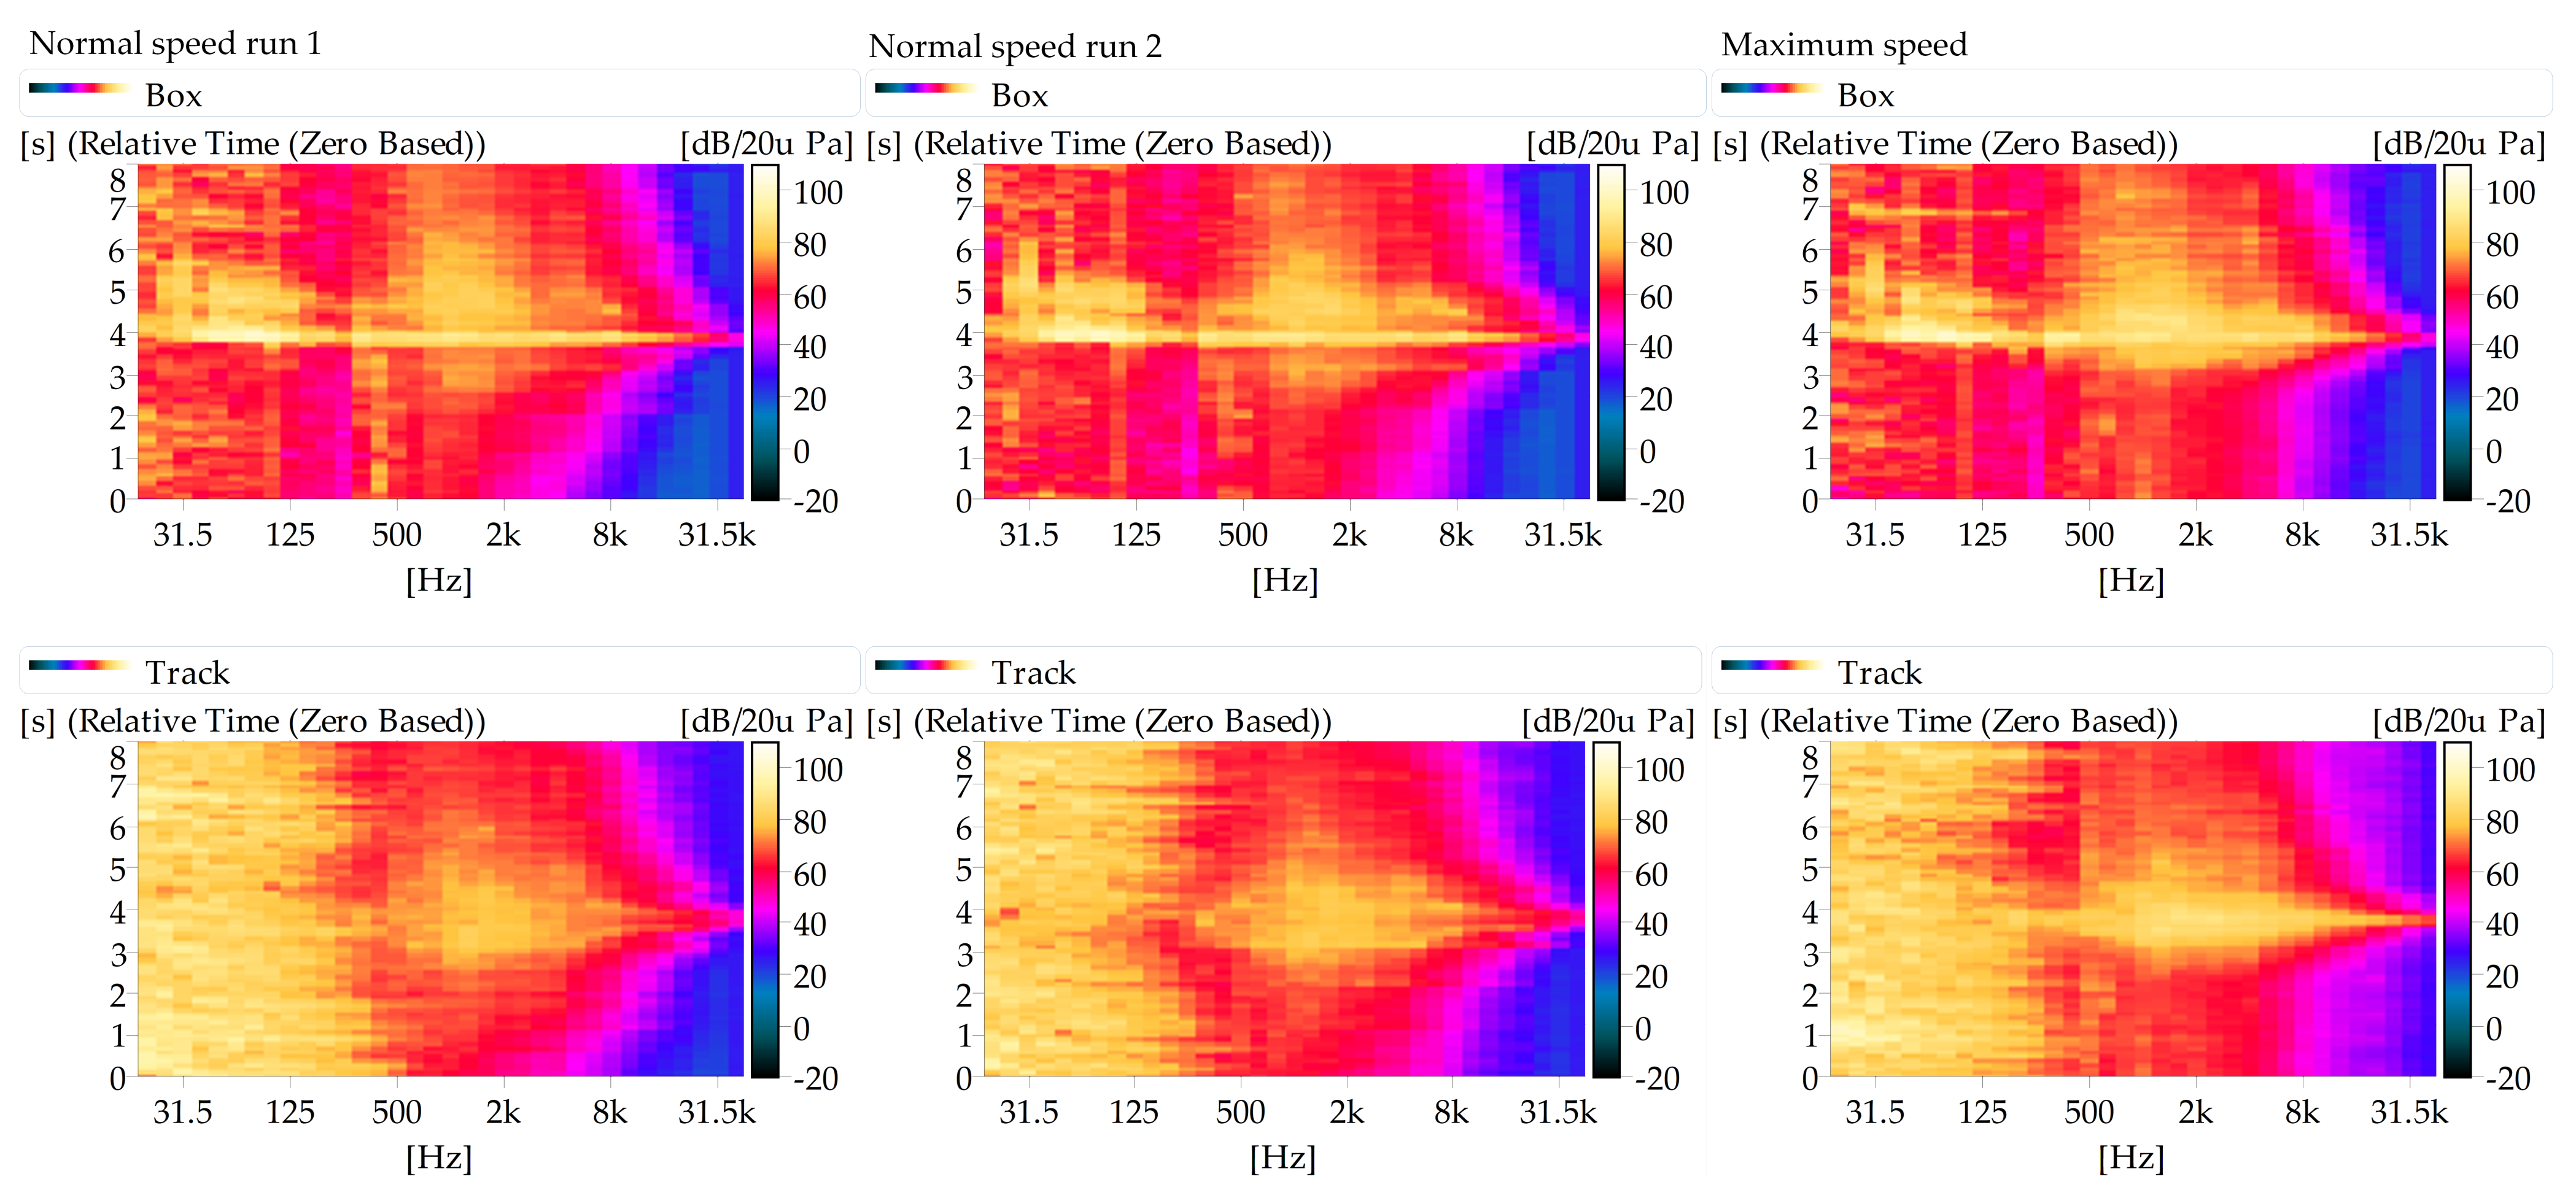
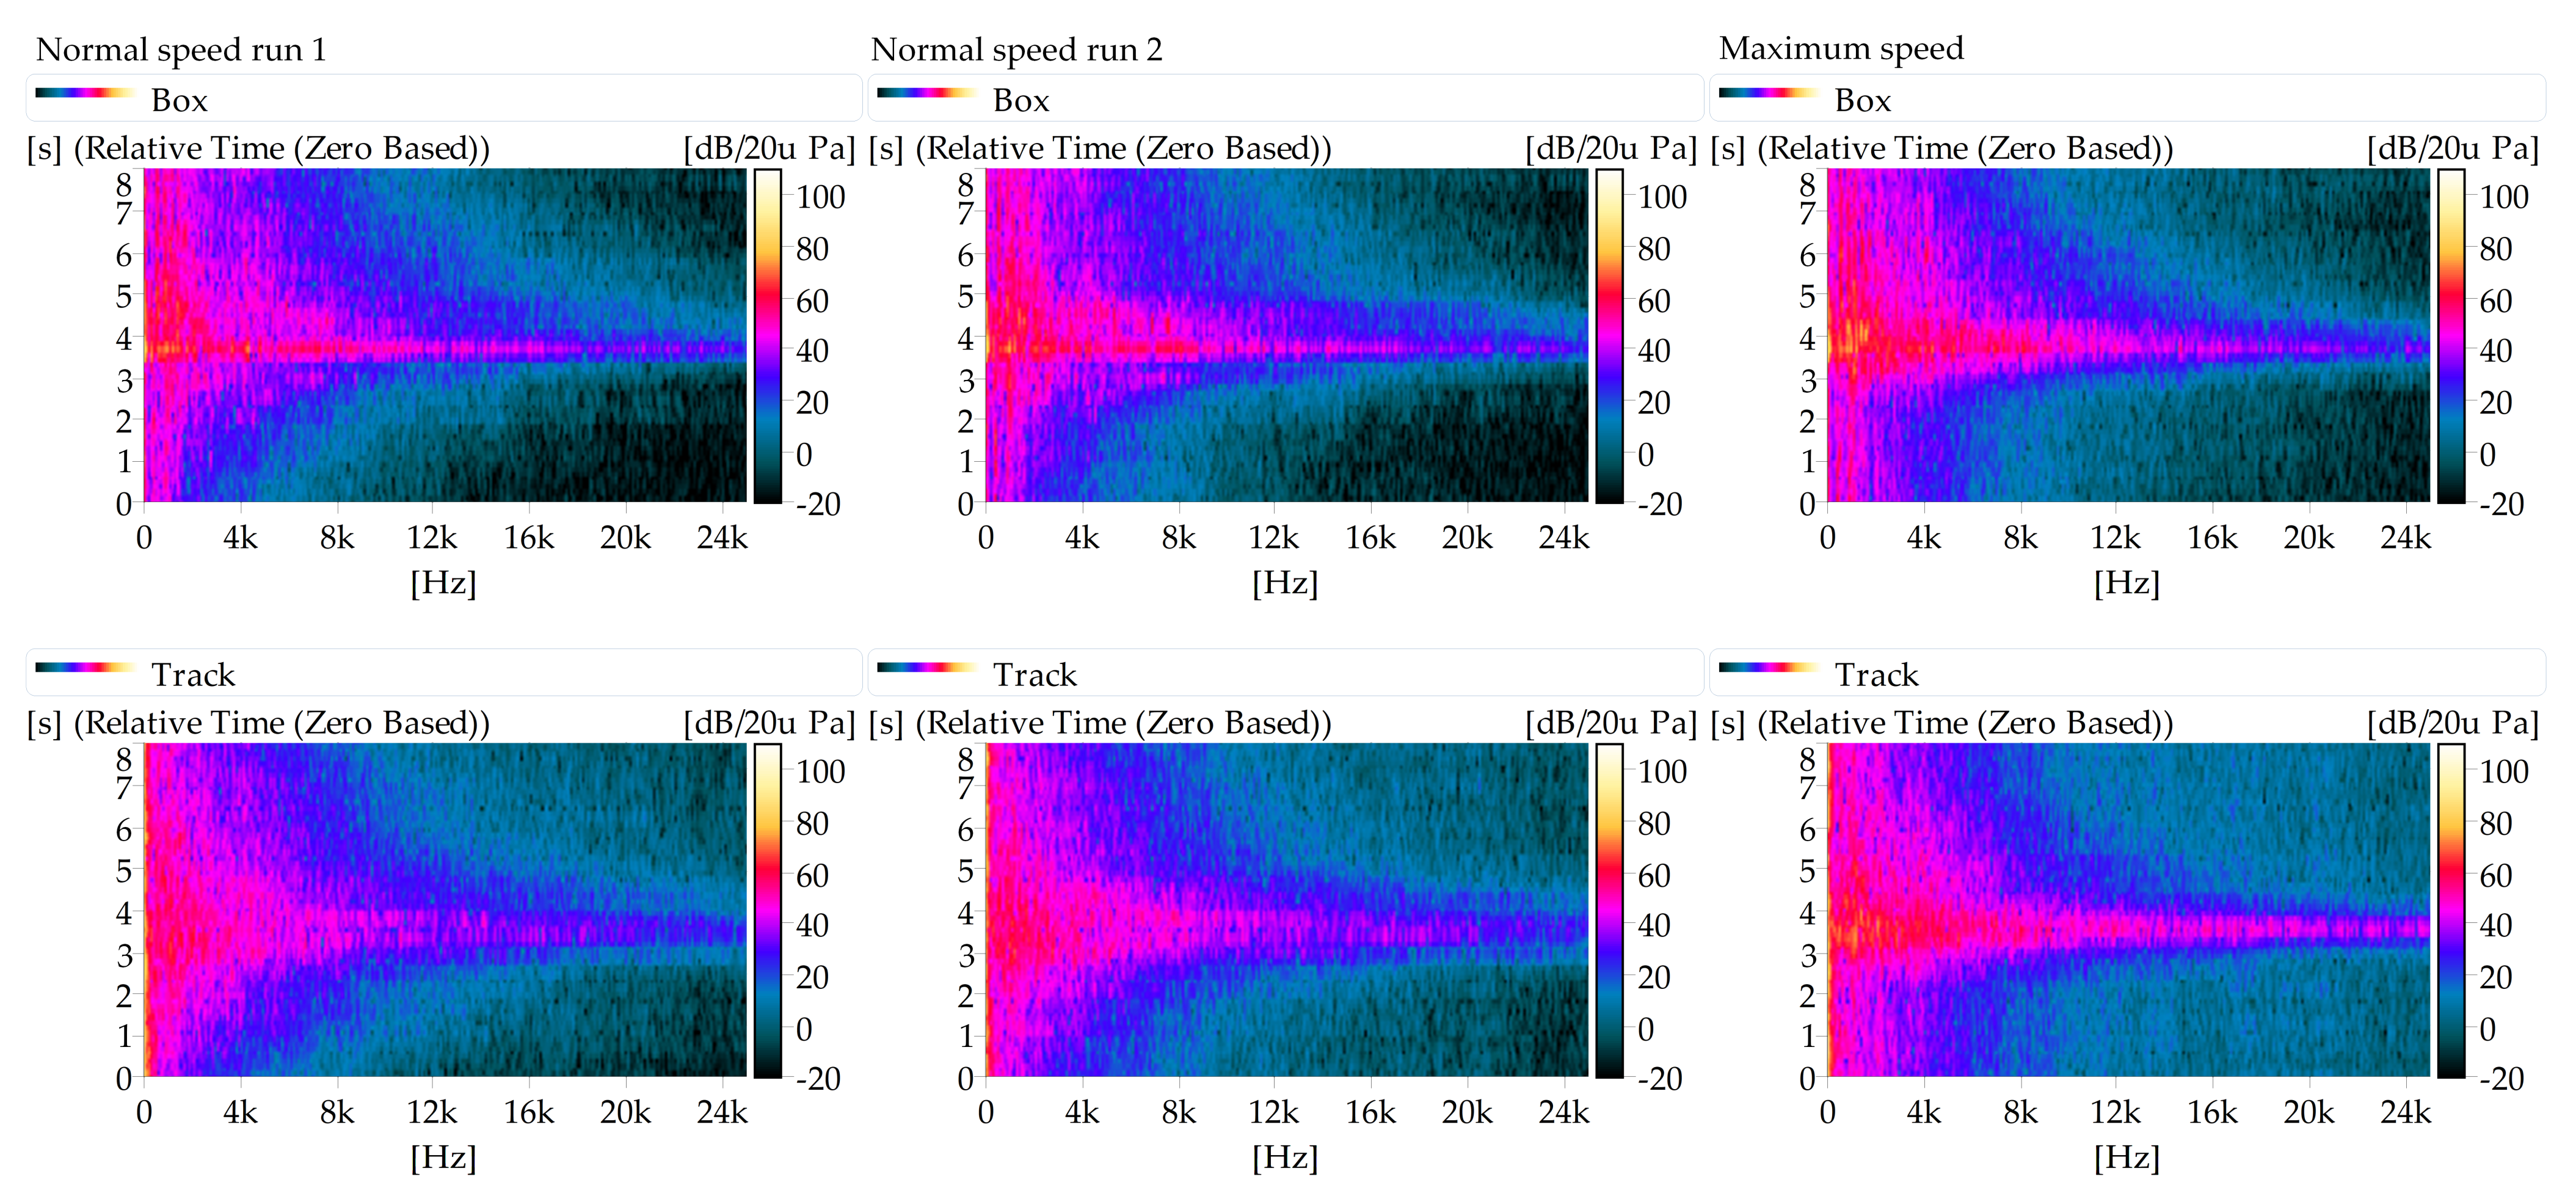
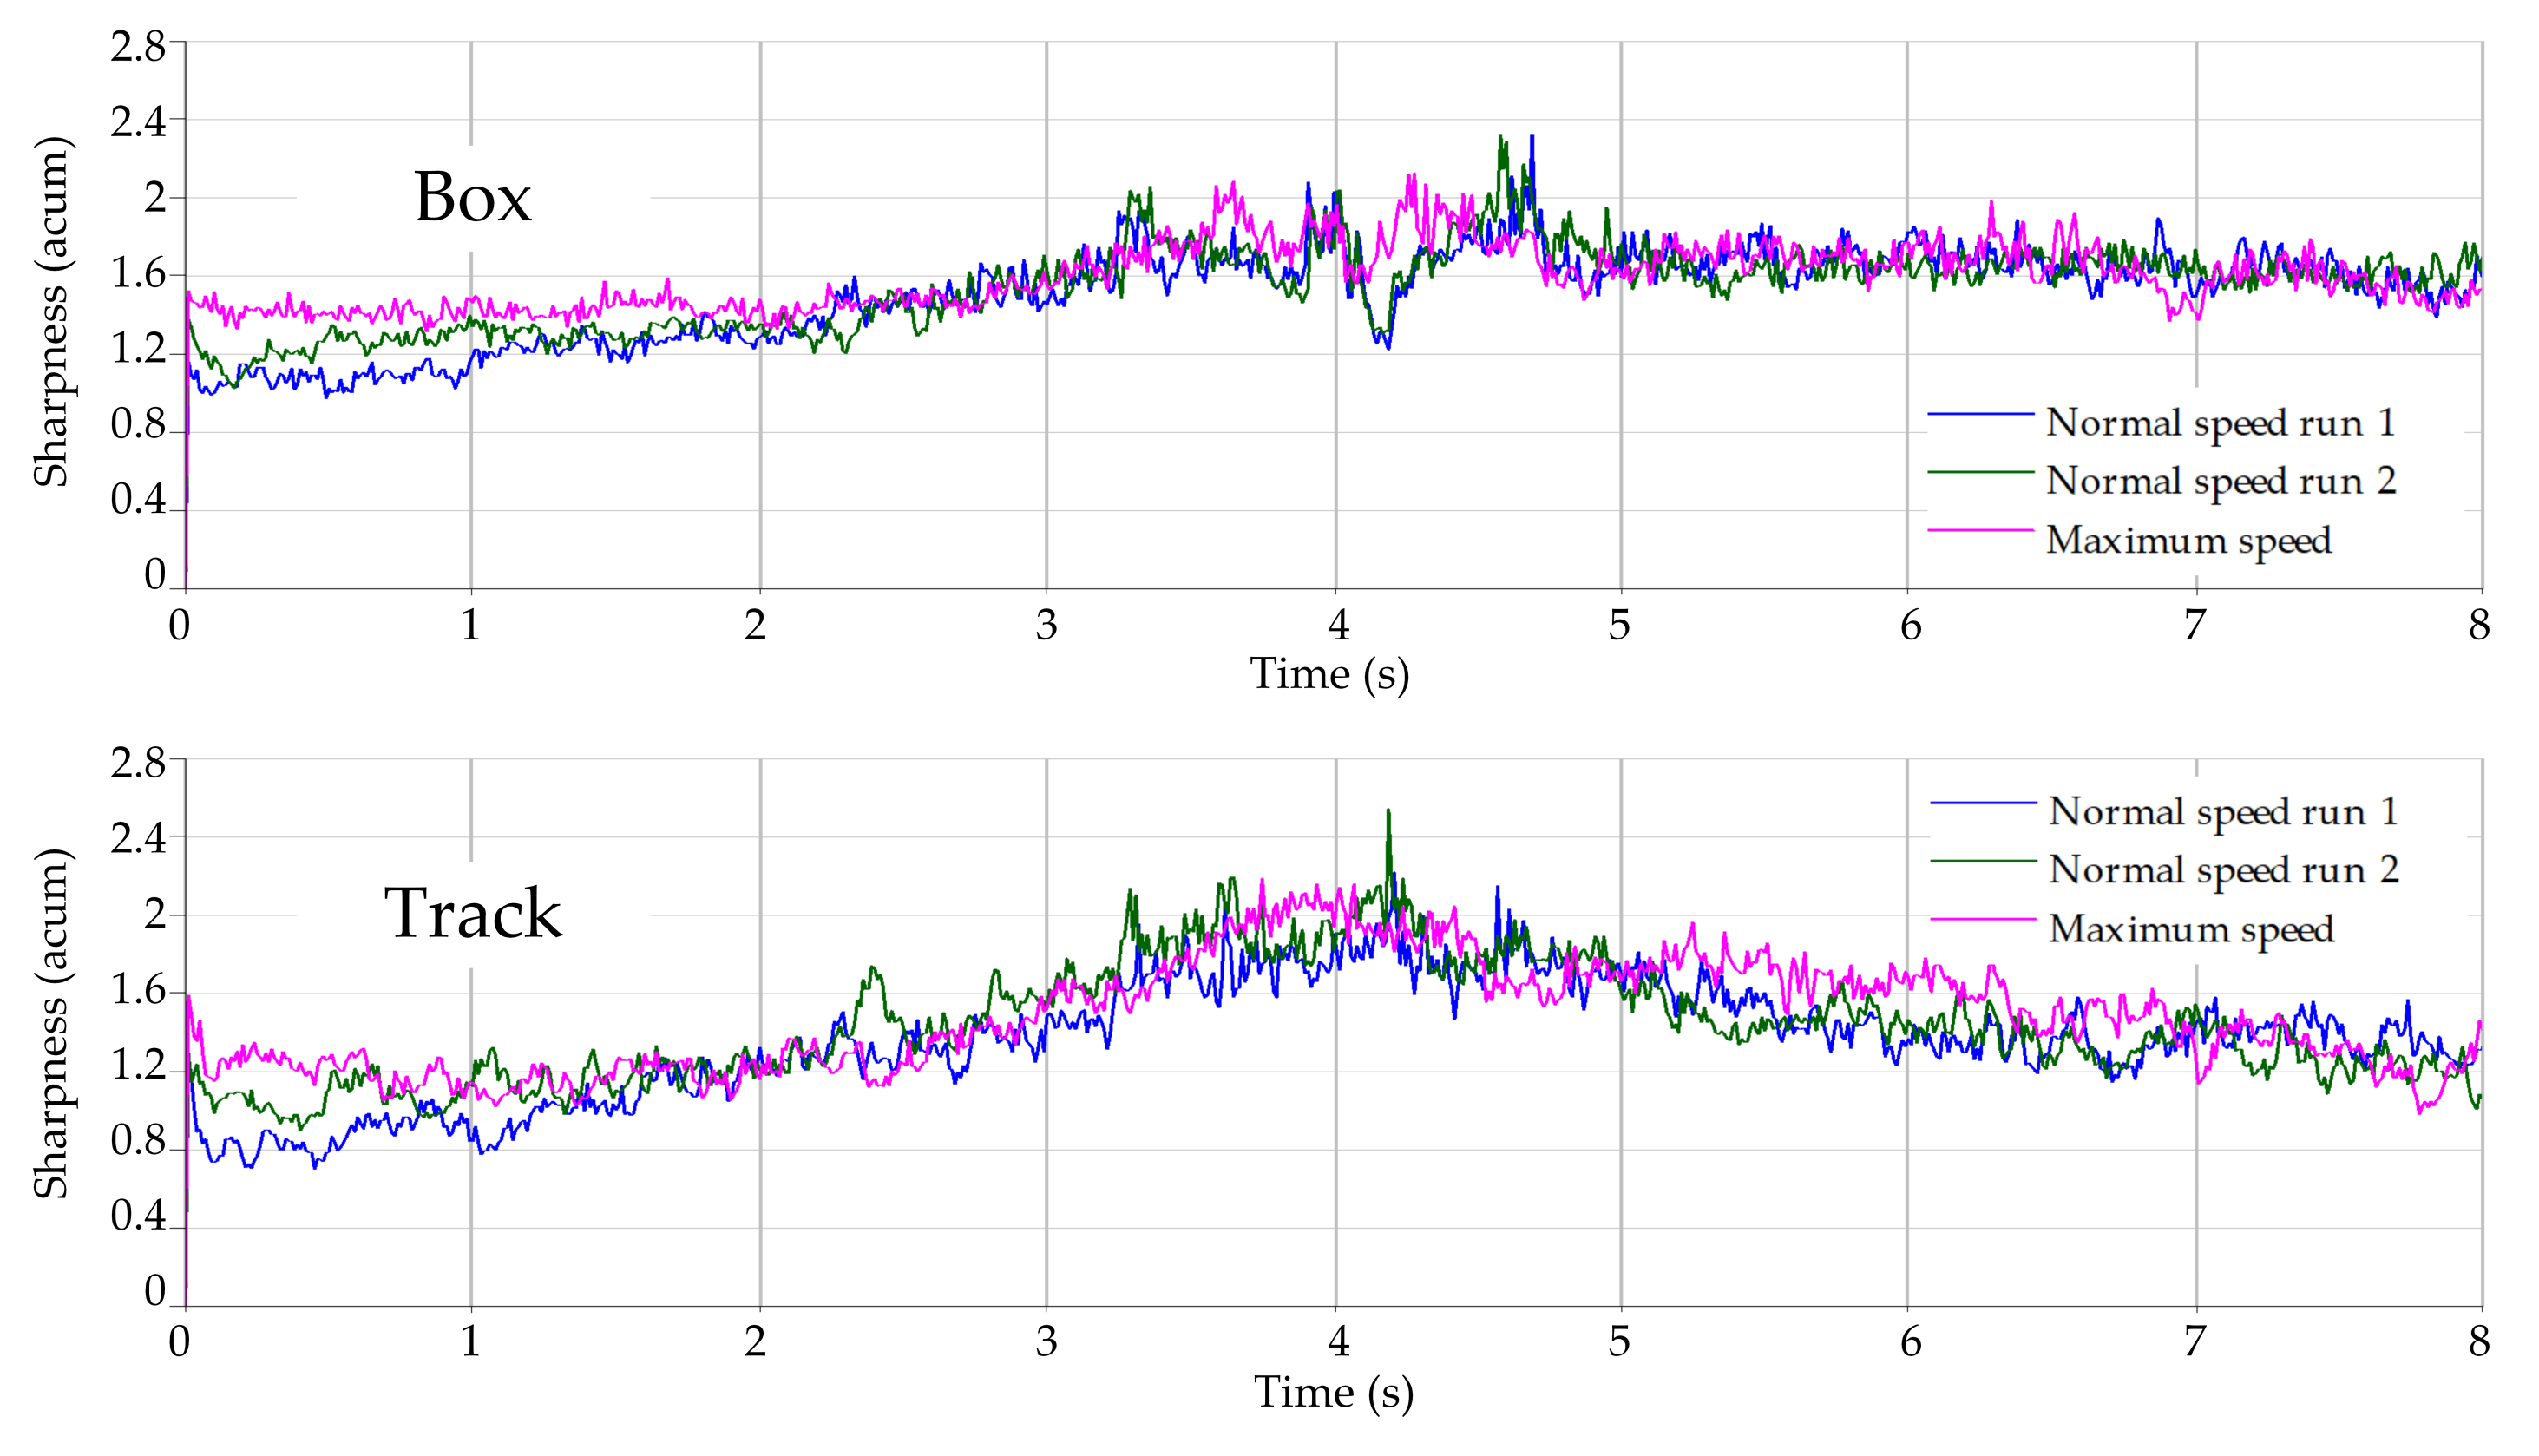
Supplementary trials were conducted at the 395 m start with the wire-cable-pulled lure to investigate the effect of different lure speeds. One more run with the normal speed and one run with the maximum speed which was approximately 30 m/s were conducted. The results are shown in
Figure 17,
Figure 18,
Figure 19 and
Figure 20. The time range was zoomed in to 8 s to show more details when the lure passes the microphones.
Despite the environmental challenges described previously, excellent data consistency and repeatability was observed for the two runs with normal speed. This has been achieved through careful experimental set-up and careful preparation of the raw, time data for subsequent data post-processing. This confirmed the reliability of the set-up and provided the authors with extra confidence in the reliability of the measured sound pressure data. When the lure runs at the maximum speed, it presents a much higher SPL as shown in the CPB and FFT analysis results. The loudness is significantly increased when it is close to the microphones while the sharpness has a similar level to the normal speed scenarios.
7. Conclusions and Recommendations
This paper researched the acoustic difference between the traditional wire-cable-pulled lure and the novel battery-operated lure. Firstly, the lure sounds were measured in the starting box and on the track. The sound pressure and SPL were presented to show the lure sounds characteristics in the time domain. Then, by frequency analysis, the frequency components of the lure sounds were obtained and compared. The environmental noise and lure sounds were clearly distinguished in frequency domain. Finally, the SQ analysis was conducted including the loudness and sharpness, which assists with the understanding of the greyhound’s subjective sensation to different lure sounds.
From the results, It was found that when the battery-operated lure is installed with twelve nylon rollers, it emits a less powerful sound than the traditional wire-cable-pulled lure. This might affect the greyhounds excitation immediately prior to the starting box gate opening. This is because its lower loudness and sharpness could make it harder for the greyhounds to hear it approaching the starting boxes, especially for the greyhounds in boxes more distant from the rail. A fair racing start may be compromised if all the greyhounds are not sufficiently excited by the approaching twelve nylon roller lure. The alternative battery-operated lure which has ten nylon rollers and two steel rollers demonstrated an increase in the sound energy at magnitude that was higher than the wire-cable-pulled lure. This was quite localised. This localisation of the noise could be a benefit as it allows the greyhounds to focus on a single noise source. It may also be more difficult for greyhounds at the rear of the pack to hear during a race. It is recommended that further research needs to be conducted in the area.
It was also noted that environmental noise can be significant. It is recommended the battery-operated lure system be designed so it generates sufficient noise in the audible range of the greyhounds so that the greyhounds can hear the approaching lure clearly and equally from within all closed starting boxes, particularly during race meeting with high wind generated noise.
A more detailed and conclusive study into the greyhound’s behaviour within the starting boxes as the battery-operated lure approaches is strongly recommended. This study would enable a greater understanding of what a statistically significant number of greyhound’s experience within their respective starting box as the lure approaches and the boxes open. It is recommended that a number of different battery-operated lure configurations be trialed to ascertain the optimum pre-box opening and racing lure acoustical configuration for greyhound excitation. Besides, the greyhounds behaviour of chasing lures with different sound characteristics such as the introduced sound of one or more squawkers also deserves further research.
Additional to the preliminary lure sounds measurement, the development of the testing and analysis protocols for the collection of these kinds of field data were established during this study. Capturing high quality data in the field in an efficient manner, taking into consideration the environmental, logistical and other practical challenges, is by no means trivial. It is intended that, in line with other recent contributions [
28,
29], by reporting these in-sights, other practitioners might benefit when attempting similar activities in remote and/or outdoor environmental conditions.


