Article

Recognition of Holoscopic 3D Video Hand Gesture Using Convolutional Neural Networks

Department of Electronic and Computer Engineering, College of Engineering, Design and Physical Sciences, Brunel University London, Uxbridge UB8 3PH, UK
*
Author to whom correspondence should be addressed.
Technologies 2020, 8(2), 19; https://doi.org/10.3390/technologies8020019
Submission received: 31 January 2020 / Revised: 11 April 2020 / Accepted: 13 April 2020 / Published: 15 April 2020
(This article belongs to the Special Issue Computer Vision and Image Processing Technologies)

Abstract

:
The convolutional neural network (CNN) algorithm is one of the efficient techniques to recognize hand gestures. In human–computer interaction, a human gesture is a non-verbal communication mode, as users communicate with a computer via input devices. In this article, 3D micro hand gesture recognition disparity experiments are proposed using CNN. This study includes twelve 3D micro hand motions recorded for three different subjects. The system is validated by an experiment that is implemented on twenty different subjects of different ages. The results are analysed and evaluated based on execution time, training, testing, sensitivity, specificity, positive and negative predictive value, and likelihood. The CNN training results show an accuracy as high as 100%, which present superior performance in all factors. On the other hand, the validation results average about 99% accuracy. The CNN algorithm has proven to be the most accurate classification tool for micro gesture recognition.

1. Introduction

A major form of interaction between users and computers is achieved through devices like the mouse, keyboard, touchscreen, remote control, and other direct contact methods. Communication amongst humans is achieved through more intuitive and natural non-contact methods, e.g., physical movements and sound. The efficiency and flexibility of these non-contact interaction methods have led several researchers to consider using them to support human–computer communication. Gesture forms a substantial part of the human language. It is an important non-contact human interaction method. Historically, to capture the positions and angles of every joint in the user’s gesture, wearable data gloves were employed. The cost and difficulty of a wearable sensor have limited the widespread use of this method. The ability of a computer to understand the gestures and execute certain commands based on those gestures is called gesture recognition. The primary goal of such gesture recognition is to develop a system that can recognize and understand specific gestures and communicate information without any human intervention. The use of hand gestures for a human computer interface (HCI) offers direct measurable inputs by the computer [1]. However, using a controlled background makes hand gesture detection easier [2].
Currently, gesture-based recognition methods based on non-contact visual inspection are popular. The reason for such popularity is due to their low cost and convenience to the user. Hand gesture is an expressive communication method widely used in entertainment, healthcare, and education industries. Additionally, hand gestures are also an effective method to assist users having special needs such as blindness. Hand tracking is important to perform hand gesture recognition and involves performing several computer vision operations including segmentation, detection, and tracking.
The objective of this study is to investigate the effectiveness of the CNN algorithm to extract features and classify various hand motions for detecting hand gestures. In this study, the CNN algorithm is evaluated and compared to standard feature excitation algorithms such as wavelets (WL) and empirical mode decomposition (EMD). A 3D micro hand gesture recognition system was developed using CNN and evaluated using several factors, namely execution time, accuracy, sensitivity, specificity, positive predictive value, negative predictive value, positive likelihood, negative likelihood, and root mean square error. The study utilises three subjects to develop and train the system, and is validated using gestures from 20 subjects.
The rest of this paper is structured as follows. Some studies of the holoscopic camera and 3D micro hand gesture recognition techniques and methods used are presented in Section 2. Section 3 is a presentation and discussion of the results achieved and the conclusion is presented in Section 4.

2. Literature Review

The use of micro lenses array at the image surface was proposed by Professor Lippmann who presented this concept to the French Academy of Sciences at La Photography Integral [3]. The system is based on spatial images with full parallax in all directions, which is similar to a fly’s eye lens array with the display system being a screen holding several lenses [3]. Herbert Ives, in the 1920s, began working on simplifying Lippmann’s idea by joining a lenticular lens sheet-containing a signal array of spherical lenses called lenticules. A signal array of magnifying lenses is designed to view from various angles. In addition, images are exaggerated consistently to provide a pixel from each micro lens. The lenses sheet is transparent and the back face which creates the focal plane is flat. An example of such phenomena is the lenses used in lenticular production where the technology is used to show an illusion of depth by moving or changing images as the image is seen from different angles. This innovative technology could also be utilized for producing 3D images on a flat display sheet. Hence, if the motion of the pictures is taken into consideration, this results in 3D holoscopic video [3,4]. However, this model has its own downside of having non-linear distortion mainly due to the lens radial distortion and micro lens distortion [4].
Ge et al. [5] proposed a 3D CNN method to estimate real-time hand poses from single depth images. The features extracted from images using 2D CNN are not suitable for the estimation of 3D hand pose as they lack spatial information. The proposed method takes input as a 3D volumetric representation of the hand depth image and captures the 3D spatial structure and accurately regresses a full 3D hand pose in a single pass. Then, the 3D data augmentation is performed to make the CNN method robust to various hand orientations and hand size variations. Results of the experiment show that the proposed 3D CNN outperforms the state-of-the-art methods on two challenging hand pose datasets. The implementation runs at over 215 fps on a standard computer with a single GPU which is proven to be very effective.
According to Ge et al. [6], the method proposed is to increase the accuracy of hand pose estimation. The method involves projecting the query depth image onto three orthogonal planes and use the multi-view projections to regress for two-dimensional heat-maps which then can estimate the joint positions on each plane. The generated multi-view projection heatmaps are fused to generate a final estimation of the 3D hand pose. The results of the experiment show that the proposed method outperforms the current state-of-the-art with good generalization.
A technique using depth camera in a smart device for hand gesture recognition is proposed by Keun and Choong [7]. The recognition is made through the recognition of a hand or detection of fingers. For detecting the fingers, the hand skeleton is detected via distance transform and fingers are detected using the convex hull algorithm. To recognize a hand, a newly generated gesture is compared with gestures already learned using support vector machine algorithm. The hand’s centre, finger length, axis of fingers, hand axis, and arm centre are utilised to detect the gesture. The algorithm was implemented and evaluated on an actual smart device.
The apparent motion in pixels for every point can be measured in a pair of images derived from stereo cameras [8]. Such an apparent pixel difference or motion between a pair of stereo images is called disparity [8]. This phenomenon can be experienced by trying to close one of your eyes and then rapidly close it while opening the other. The objects closer to us will be moved to a significant distance from the real position and objects further away move little [8]. This kind of motion is disparity. A case where the disparity is most useful is for the calculation of depth/distance. Distance and disparity from the cameras are inversely related [7,8]. As the distance from the cameras increases, the disparity decreases. This can help for depth perception in stereo images [7,8].
A new technique for 3D rigid motion estimation from stereo cameras is proposed by Demirdjian and Darrell [9]. The technique utilizes the disparity images obtained from stereo matching. Some assumptions like the stereo rig have parallel cameras and, in that case, the topological and geometric properties of the disparity images. A rigid transformation (called d-motion) is introduced whose function is mapping two disparity images of a rigidly moving object. The relation between the motion estimation algorithm and Euclidean rigid motion is derived. The experiment shows that the proposed technique is simpler and more accurate than standard methods.
As per the research conducted by authors [10], hand gesture recognition is one of the most logical ways to generate high adaptability and a convenient interface between users and devices. They formed a hand gesture recognition system using four techniques, in order to verify which technique gives out the most accurate results. The techniques they used include WT, artificial neural network (ANN), EMD and CNN. They evaluated these methods on various factors and the results indicated that CNN is more accurate in comparison to EMD and WT.
According to Pyo et al. [11], the CNN method is used to analyse and evaluate hand gesture recognition. CNN can deal with multi-view changes of hand gestures. The paper also shows how to use depth-based hand data with CNN and to obtain results from it. The evaluation is made against a famous hand database. The results show that CNN recognizes gestures with high accuracy and the technique is suitable for a hand gesture dataset. The CNN structure of three convolutional layers and two fully connected layers has the best accuracy.
Alnaim et al. [12] also studied a gesture recognition model based on the CNN algorithm. They studied the hand gestures of the various subjects after experiencing a stroke. The developed method was evaluated and compared between training and testing modes based on various metrics namely execution time, accuracy, sensitivity, specificity, positive and negative predictive value, likelihood, and root mean square. Results show that testing accuracy is 99% using CNN and is an effective technique in extracting distinct features and classifying data.
A feature match selection algorithm is presented by [13], with an aim to extract and estimate an accurate full parallax 3D model form from a 3D omni-directional holoscopic imaging (3DOHI) system. The novelty of the paper is based on two contributions: feature block selection and its corresponding automatic optimization process. The solutions for three primary problems related to depth map estimation from 3DHI: dissimilar displacements within the matching block around object borders, uncertainty and region homogeneity at image location, and computational complexity.
Kim and Toomajian [14] designed an algorithm determining the feasibility of human hand recognition through micro Doppler signatures measured by Doppler radar with a Deep CNN (DCNN). They classified ten different gestures with micro-Doppler signatures on spectrograms without range information. The 10 gestures were studied from different perspectives by swiping them left to right and right to left, rotating them clockwise and anti-clockwise, holding and double holding, pushing, and double pushing. These different angles of the gestures were measured using Doppler radar. 90% of the data was used for training and 10% was used for validation. With the initial five gestures, 85.6% accuracy was achieved, whereas with seven gestures the accuracy was increased up to 93.1% indicating that accuracy increased with the increase in testing data. However, the study is limited to the tested seven gestures and for testing of more gestures the system required gestures having unique signatures of spectrogram.
Malchanov et al. [15] proposed an algorithm for gesture recognition that challenged the depth and intensity of data using 3D CNN. The research used the vision for intelligent vehicles & applications (viva) data set. The solution combined information from various spatial scales for final predictions. Since, the duration of each hand gesture sequence is different in VIVA dataset the study normalized the temporal lengths of the gesture sequence by re-sampling each gesture to 32 frames using nearest neighbour interpolation (NNI). For classification the CNN classifier consisted of two sub-networks, namely low-resolution and high-resolution network. The results gave a classification rate of around 77.5% on the dataset. This study revealed that combining high- and low-resolution sub-networks helps to improve the classification accuracy to a considerable level.
Nunez et al. [16], using 3D data sequences taken from full-body and hand skeleton, addressed the hand gesture recognition and human activity problems. Their study aimed to propose a deep learning-based approach for temporal 3D pose recognition with a combination of long short-term memory (LSTM) and CNN. They also proposed a two-stage training strategy. The first stage focused on CNN training, whereas the second stage used the full method of LSTM and CNN combined. The results of the study indicated that the small datasets gave out more accurate results as compared to large datasets.
Molchanov et al. [17] proposed a connectionist temporal classification for training the network to detect gestures from an unsegmented input stream. The system used deep 3D-CNN for spatiotemporal feature extraction. They deployed their system for online recognition of gestures where there is huge diversity of people performing gestures, which makes the detecting difficult. For the validation of their model, they used a multi-modal dynamic hand gesture dataset captures with colour, depth and stereo IR sensors. The results achieved from the study were 83.8% accurate, which was higher than all the similar researches in the state-of-the-art algorithm. Their algorithm achieved a human accuracy of 88.4%, making it the most practical application of hand gesture determination technique.
Li et al. [18] used CNN for the detection of gestures along with characteristics of CNN to avoid the overall feature extraction process, which reduces the trained parameters quantity and helps to develop a system of unsupervised learning. The results from the study indicated an overall accuracy of 98.52% as they developed a semi-supervised model through support vector machine (SVM).
A hand recognition sensor using ultra-wide band impulse signals that are reflected from a hand was developed by Kim et al. [19]. Reflection of a surface is used to determine the reflected waveforms in the time domain. Each gesture has its own reflected waveform; therefore, each gesture is unique. CNN was used for the gesture classification. They studied six hand gestures and they were detected with 90% accuracy. The model gave 90% accuracy for a 10-degree step in each gesture.

3. Materials and Methods

3.1. Holoscopic Imaging System Camera

The holoscopic 3D camera offers the easiest method to achieve recording and replaying the light field 3D scene as shown in Figure 1. The concept of this technique was proposed by Lippmann in 1908 [3]. This technology contains micro lens array architecture that offers to double the spatial resolution of the holoscopic 3D camera horizontally by trading horizontal and vertical resolutions [3]. As shown in Figure 2, the camera should be in the form of a planar strength distribution MLA [20]. Despite using the same features of the holographic technique, it records the 3D image in 2D and views in complete 3D through an optical component, without the required bright light source and restrains dark line. Moreover, it enables post-production processing like refocusing [20].
Figure 2 and Figure 3 [21] show the description of the structure of the holoscopic 3D camera which are L0 = Nikon 35 mm F2 wide-angle lens, NF = Nikon F-mount, AP = adaptor plate, ER = 6 mm diameter extension rods, RM ≤ 5 arc minute accuracy rotation mount, MLA = plane of MLA, which is slanted in the process method, T0-T2 = extension tubes, L1 = Rodagon 50 mm F2.8 relay lens × 1.89, C5D M2 = Canon 5D Mark2 DSLR. Arrow displays the position of centre of gravity, SA = Square aperture mouthed to the L0.

3.2. 3D Image Extraction Implementation

Feature extraction is a type of dimensionality reduction method that effectively shows different parts of an image [22,23]. The main process applied to the holoscopic 3D image is that an object is captured by a specific array of multi-micro-lenses [4,24]. Each micro-lens captures a viewpoint of the 2D elemental image of the object from a specific angle [4,22,24]. The captured image consists of directional information and the intensity of the comparable 3D scene in the 2D model. A small grid area in the holoscopic 3D image is called a 2D elemental image [4,22,24]. The principle of the holoscopic 3D image pre-processing is discussed in detail in [4], which involves lens correction, distortion correction, elemental image extraction, etc. Most of these techniques require manual setup.
The holoscopic 3D image pre-processing creates an automated technique to detect the edges of an elemental image and cut out the elemental images from the original the holoscopic 3D image [4]. Figure 4a shows a model of the holoscopic 3D micro-gesture image that contains multiple 2D elemental images. Mostly, each elemental image is roughly a square area with small values that are darker on the edges. Nevertheless, certain boundaries are not straight lines as a result of the distortion of the micro-lens, particularly the ones nearby the holoscopic 3D image borders as the correlated micro-lens are far from the centre [4]. Each element image from the holoscopic 3D image extracts pixels from each lens to form a segment, which will form a part of the image as shown in Figure 4b.
All the elemental images are cut-out based on the straight lines and the distortion. The resulting cut-out image are processed for viewpoint extraction [4]. On the borders of the holoscopic 3D image, certain elemental images are not fully captured, as a result of that, only corrected elemental images will be cut out and utilized later for viewpoint image extraction method [4]. Viewpoint images can be extracted from all the acquired elemental images [4]. The viewpoint image is a low-resolution orthographic projection type of rays from a direction. It can be extracted from the pixels of all the elemental images [4].
In the experimental work, Figure 5 illustrates a standard framework of pre-processing for 3D micro hand gesture video. Firstly, it records 3D micro hand gestures using the holoscopic imaging system camera with a plain background and white illumination. Secondly, the 3D micro hand gestures video will be extracted into multiple frames. Afterward, in the third step, extract the multi view images form each frame and convert to greyscale. Finally, resize the 3D image from 1920 × 1080 pixels to 135 × 75 pixels. Two cameras were used for recordings, the 1st is Canon camera at 5.6 k, while the 2nd is Sony Alpha A7 at 4 k. Two types of multi lenses are installed, for the Canon: 47 x-axis by 55 y-axis, while the Sony: 31 x-axis by 55 y-axis.
Twelve random 3D micro hand gestures are recorded with a plain background using the holoscopic imaging system camera for three different subjects. An example of Pre-extraction 3D micro hand gesture images for the first subject is shown in Figure 6. The length of each video is 10 s with frame rate of 300 per second. Each gesture is given a unique name, namely: sweep motion, shrink motion, circular motion, squeeze motion, 2 fingers shrink, back/forth, rub motion, click motion 1, dance motion, pinch motion, write motion, and click motion 2.
The 3D micro image is extracted into 25 multi-view images, three were selected which are left, centre and right (LCR) with a size 135 × 75. The most significant difference between the left image and the right image is the viewpoint. The human eye will not recognise the difference between the three images, unlike a computer. Figure 7 presents the multi-view images (LCR) for subject 1.

3.3. Computing Platform Specification

All the whole experiments are conducted using a Dell desktop C2544404 (Austin, TA, USA) with Intel ® Core™ i7-6700 CPU, 3.40 GHz, DDR4 16 GB memory, hard drive 512 GB. The operating system is Windows 10 (64 bits) and the experimental using MATLAB versions R20187b and R2019a.

3.4. Images Disparity

Figure 8 shows an example of disparity for the left and right images. The images are pre-processed to extract the different view images, then the image disparity between the left and right images is calculated. Appendix A includes the remaining motions disparity images of the three subjects. The stereo match function is used to find the disparity between the left and right rectified stereo images while the output is the dense disparity map. The disparity algorithm parameters used in this study are: window size of 31 × 31 pixel, and the number of disparities is 49. Despite the disparity images being not clear, CNN has a superior ability to classify unclear images.

3.5. System Validation

The validation study consists of capturing videos from 20 subjects performing 7 gestures. Figure 9 illustrates subjects performing seven universal common hand gestures with three different illuminations and hand position and shape. Appendix B includes the other images of the 20 subjects used in this experiment. The background of each video is plain. The illumination of the first and the second subjects are higher than the third subject. The position of the hand is also slightly different as well as the shape of the hands. The 1st subject is an old woman in late-sixties, while the 2nd subject is a young woman in mid-twenties, and the 3rd is a woman in mid-forties.

3.6. WT & EMD Feature Extraction Algorithms

Wavelets is known as one of the image processing algorithms which can be used for signal analysis where signal frequency differs at the end of time [25]. The technology provides innovative data analysis technique that reports time and frequency analysis which is located in antisymmetric of wavelet. On the other hand, EMD provides benefit to the adaptive data analysis techniques to analyse non-stationary and non-linear data [26,27]. The functionality of EMD algorithm is based on decomposing a signal into intrinsic mode functions with respect to the time domain [27]. EMD method could be compared to other analysis techniques such as WL transforms and Fourier transforms [27].

3.7. CNN

CNN is a type of artificial neural network specifically designed for image recognition. A neural network following the activity of human brain neurons is a patterned hardware and/or software system. CNN is also defined as a different type of multi-layer neural network where each layer of the network converts one amount of activations to another through a function. CNN is a special architecture used for deep learning and frequently used in recognizing scenes and objects, and to carry out image detection, extraction and segmentation [28].
CNN developments can be categorized into two phases, namely training and testing. To build a CNN architecture, it applies three key types of layers: convolutional layer, pooling layer, and the fully connected layer as represented in Figure 10. The first layer is the main block of CNN. It takes many filters that are applied to the given image and creates different activation features in the picture. The second layer is used to down sample the images. It obtains input from non-linear activation function and down sample the images depending on the window size. The last layer is to identify the target in order to determine the category of the final output. Due to the three layers, the necessity for using a feature extraction algorithm is removed, the image data is learned directly by CNN. Therefore, the need for labelling data repeatedly is eliminated. CNN causes the recognition results to be unique and it might be retrained easily for new recognition missions by building on the pre-existing network. All the identified factors have made the usage of CNN significant in the last few years [29].
CNN is an efficient extractor for a completely new task or problem in photo performance, text, audio, video recognition, and classification functions. It removes the need for the manual processing of features and discovers the features directly [29]. When an image is applied with temporal and spatial dependency, it can be effectively captured by CNN which is critical for the detection of real-world objects. The number of parameters (weights) of CNN can increases rapidly when using fully connected neurons, this can be mitigated by using fewer connections, mutual weights, and down-sampling [29].
Although other methods can be used to detect gestures, CNN is more accurate in detecting edges, colour distribution, etc. in the image which makes the network very robust for image classification. One type of deep learning NN is the long/short term memory (LSTM) which is a recurrent NN that incorporates temporal information, which is usually used with time-series data. In contrast, CNN only learns form static images. The current study is based on the use of temporal images and action to develop real-time gesture recognition.

4. Results

4.1. Single-View Image Gestures

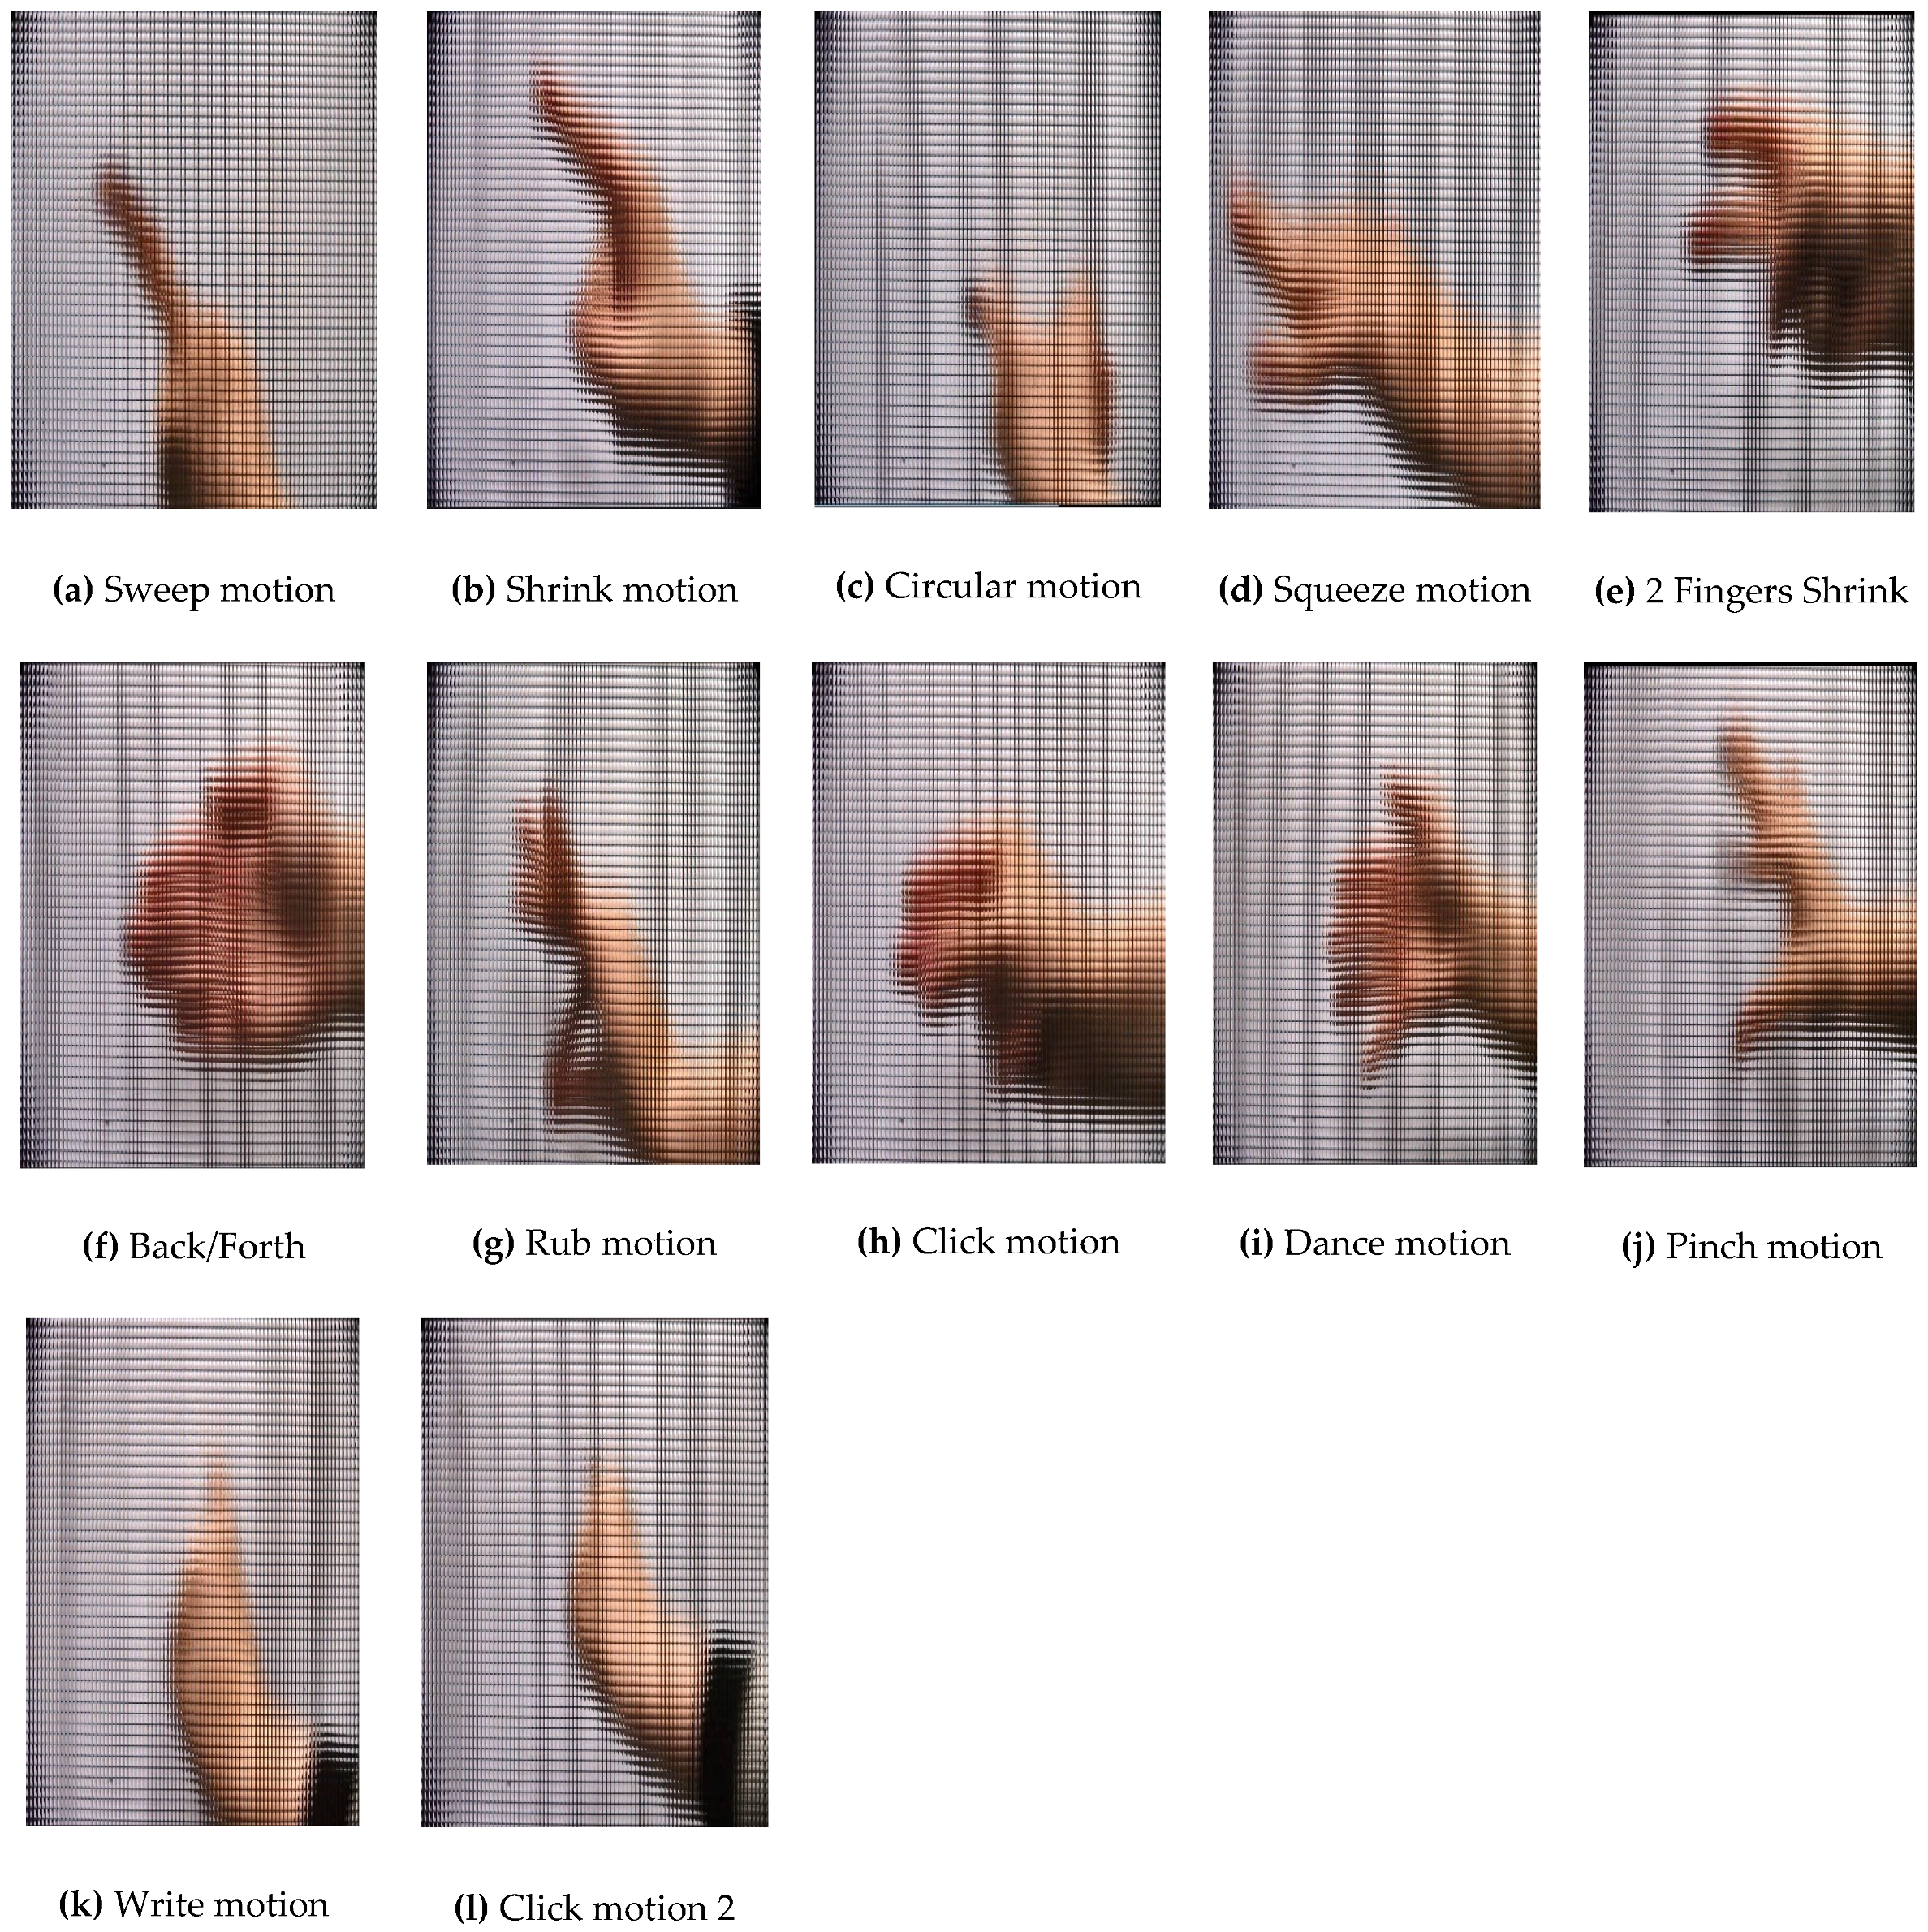
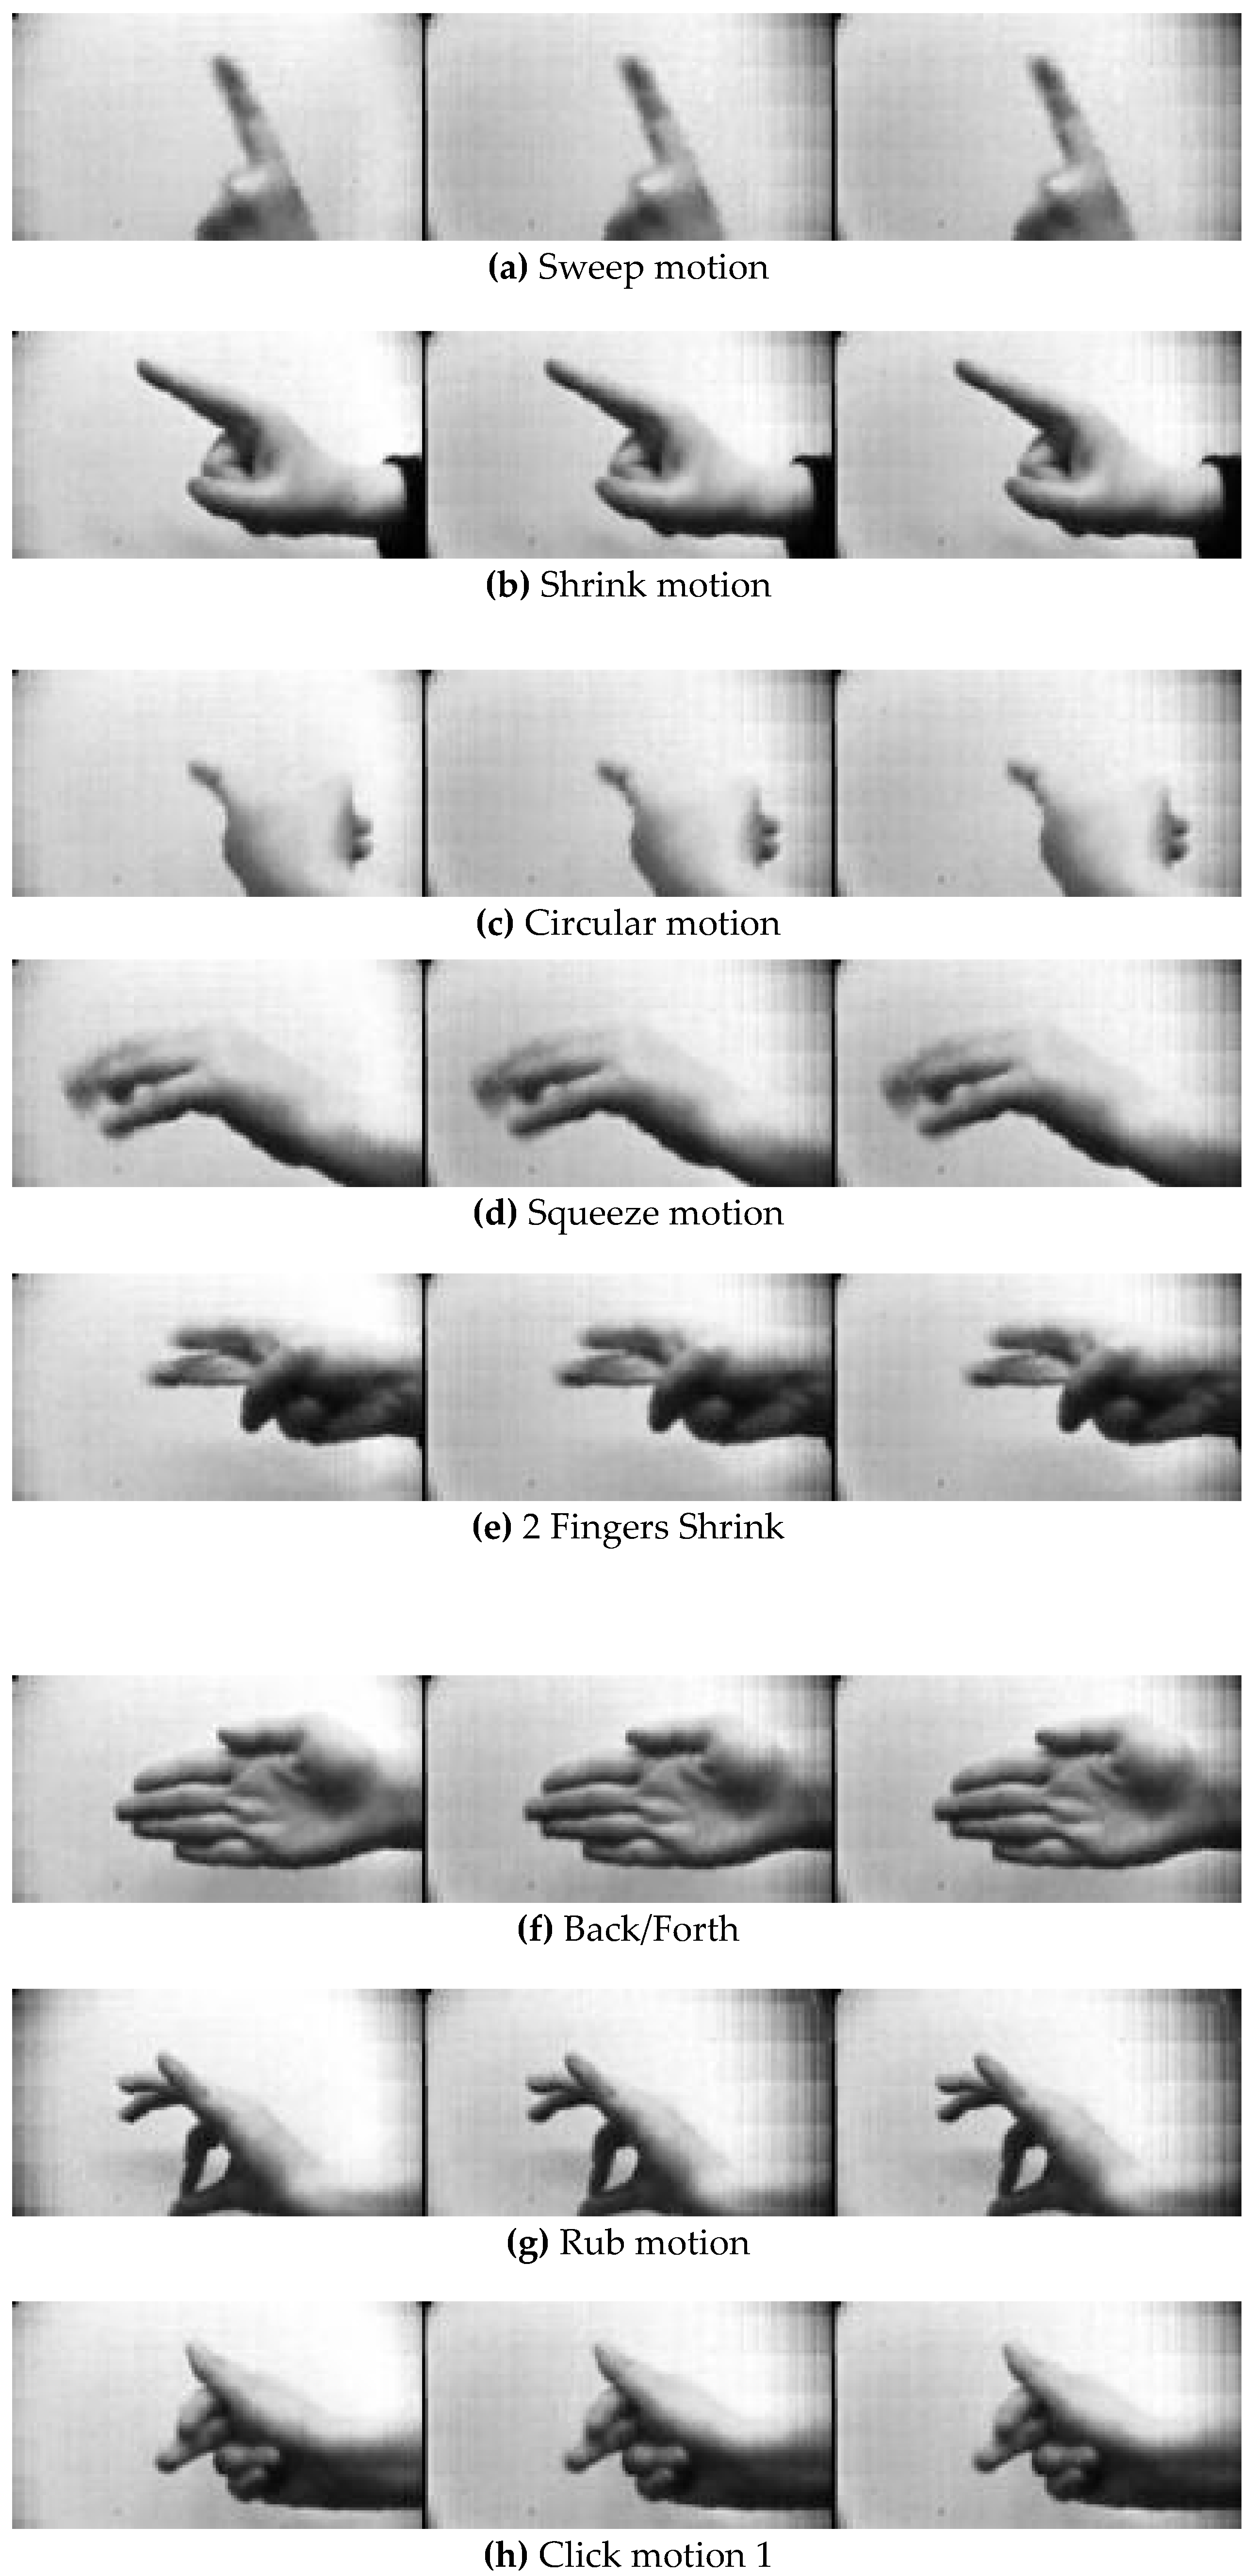
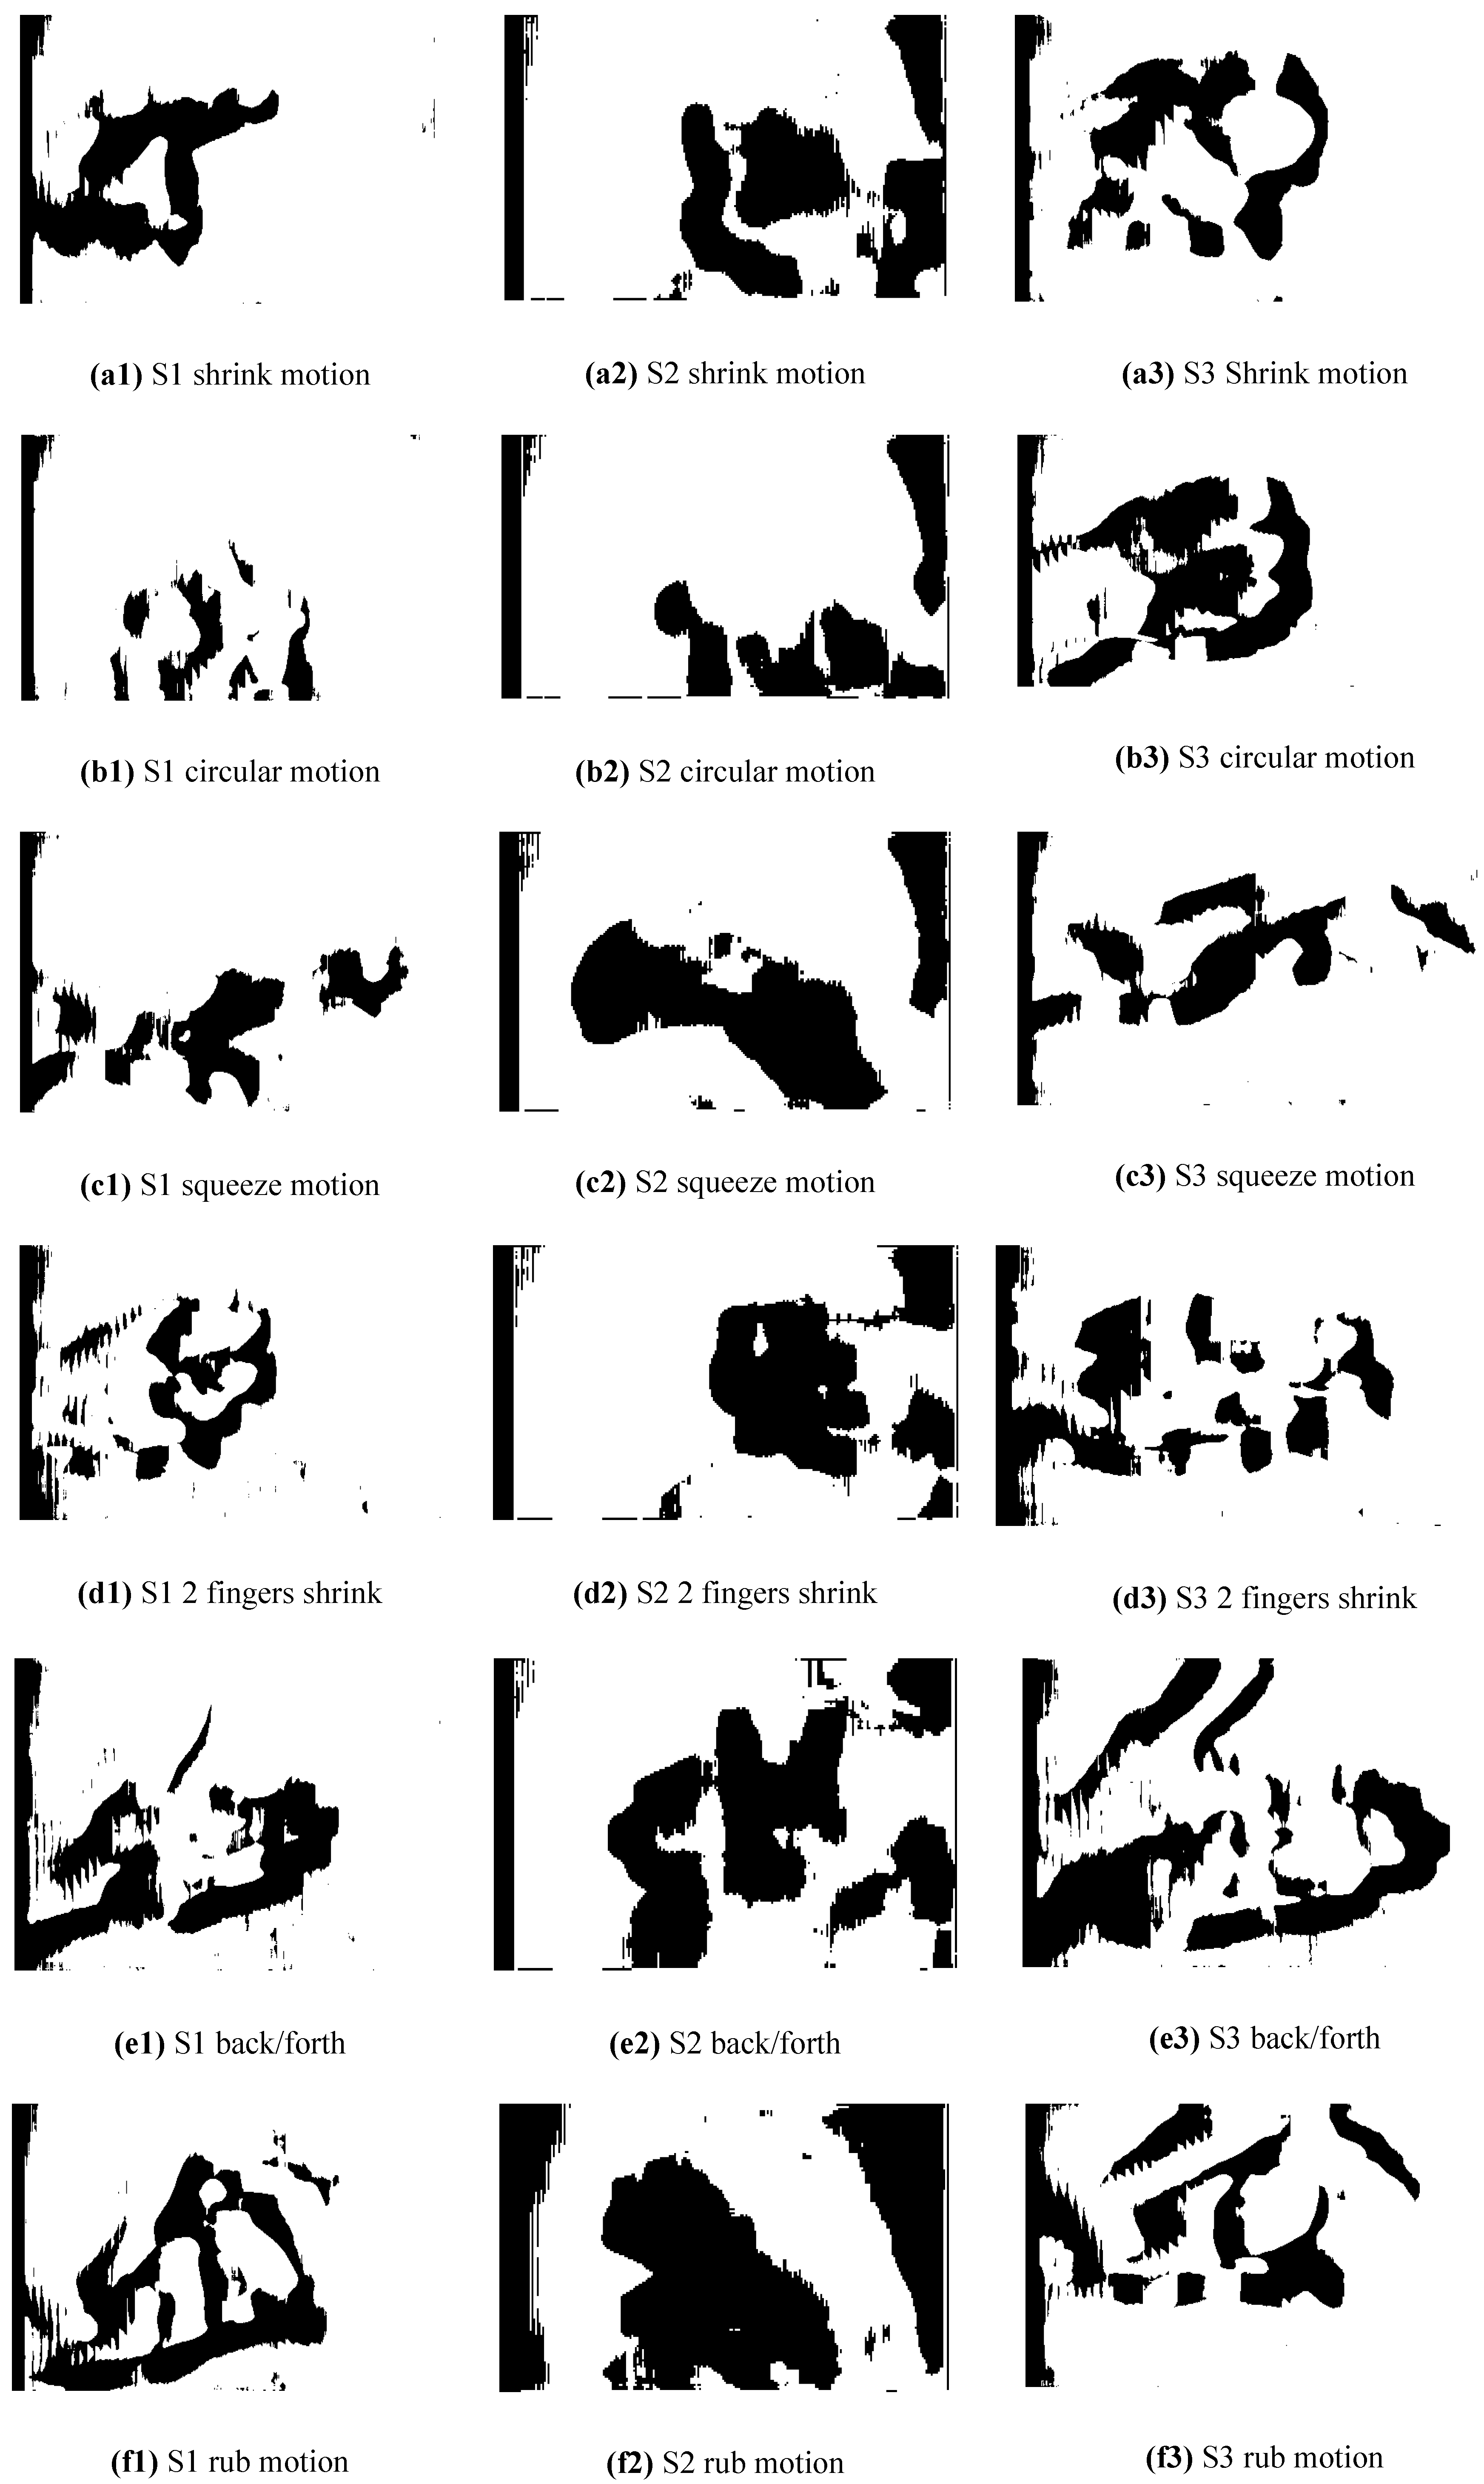
Twelve different 3D micro hand gestures for three subjects are fed as input into CNN. An earlier study by the authors [10] using classical techniques such as WL and EMD as feature extraction methods that is cascade by ANN for classification of 2D gestures. The results of the classification methods are compared with CNN performance. The comparison, including execution time, accuracy, specificity, sensitivity, positive predictive value PPV, NPV, likelihood, and RMS, is represented in Table 1. It also represents the total execution time for EMD, WT, and CNN in training. It should be noted that, for WT, the execution time is less than the total time execution of CNN and EMD combined. However, CNN has exceeded the accuracy value of EMD and WT. The specificity value of EMD is less than CNN and WT, whereas the specificity of WT is the highest. EMD and CNN have higher values of PPV and NPV as compared to WT. The best value of LR+ and LR− is highest for CNN. The RMS value of WT is the highest where that of CNN and EMD has slightly decreased [10].
Table 2 represents comparison of the three algorithms performances when tested in the study. WT and EMD have execution time lesser than CNN. However, for accuracy, CNN and EMD have higher values than WT. However, CNN has the highest value of accuracy. Also, CNN has the highest value of sensitivity when compared to EMD and WT. The specificity of EMD and CNN is lower than WT. As compared to WT, the NPV and PPV values of CNN and EMD are higher. CNN is on the top for LR+ and LR− as compared to EMD and WT. It is also noted that the RMS value of EMD has significantly increased while the RMS value of WT has declined.
During the testing phase, CNN took around 714 min for executing the testing task, which is similar to that of training phase. This indicates that this outcome is not feasible because its along time for the testing of 10 images as if it were mere images required to be tested the researchers would have to wait this long for just getting the results. However, for other parameters, i.e., sensitivity, specificity, PPV, NPV, negative likelihood (LR−), and RMS, CNN has a value of 1. In the testing phase, CNN has LR+ value equal to 1, which is less as compared to EMD and WT. The LR+ value of EMD and WT are 22.4 and 9.1 respectively. However, CNN has a higher execution time, the accuracy in other factors makes this single flaw acceptable [10].

4.2. Multi-View Image Gestures

A CNN is an integral part of deep learning since it is used to train data without applying any image processing methods. In this experiment, the three subjects’ gestures are used to train the system. Each subject records a video of 10 s length per gesture, the extraction algorithm is used to extract three images per frame (LCR). This generates 300 images per video for each point of view (LCR) giving 900 images. The images are divided into training and testing models. The inputs are arranged into two categories, three individual image inputs (single LCR), and combined images (combined LCR). The number of training images for the single LCR is 390, whereas it is 210 for combined images. The CNN training algorithm used in this study is the stochastic gradient descent with momentum (SGDM), adaptive learning (initial value = 0.001), while the search algorithm is Levenberg–Marquardt. The CNN’s topology is designed in seven layers with each layer having the following functionality and size: ImageInputLayer size 135 × 75 for single images whereas 405 × 75 for combined, Convolution2DLayer with filter size 5, filter number 20, 20 hidden neurons, stride size 1. Convolutiona2DLayer means that a 2-D convolutional layer applies sliding convolutional filters to the input. The layer convolves the input by moving the filters along the input vertically and horizontally and computing the dot product of the weights and the input, and then adding a bias term. Rectified Linear Unit input and output size are 1, MaxPooling2DLayer, the value of stride and Pooling are 2, FullyConnectedLayer input size is 135 × 75 and output size is 12, SoftmaxLayer input and output names is 1x1 and ClassificationOutputLayer output size is 12. The CNN hyperparameters are created inside the training options function. The epochs’ parameter value is set to 100 epochs.
CNN algorithm’s performance can be compared using several parameters including execution time (H:M:S). Execution time is the duration taken by the software to implement the task for training and testing. Whereas, the training accuracy is calculated by applying the training data to the model and finding the accuracy of the algorithm. Testing accuracy is obtained by applying the testing data to the model. Sensitivity measures the appropriate count of the identified percentage of positive, specificity measures of the false positive rate, PPV and NPV percentages of positive and negative results in diagnostic and statistics tests that describe the true positive and true negative results. The LR+ and LR− are identified measures in diagnostic accuracy.
Table 3 presents comparison between the three subjects and the overall (training and testing) approaches to find the best results obtained. Single, combined, and all three combined results are displayed in terms of execution time, training, testing, sensitivity, specificity, positive predictive value (PPV), negative predictive value (NPV), positive likelihood (LR+), and negative likelihood (LR−). In the single images experiment, the execution time of the first subject is quite higher than the second and third subjects. The result of training for second subject is lower than first and third subjects. First subject has the best testing result of 100%. Sensitivity result for the third subject is slightly higher than for the first and second results while all results for the three subjects are equal in specificity. The PPV results in this experimental work are equal whereas the result of NPV for the third subject is slightly lesser than the others. LR+ has the best values for three subjects while LR− result for third subject is 0.0425.
For the combined images case, the result of the first-subject experiment is the highest with respect to execution time. The training results of the second subject is slightly lower than the first and third subjects. The second subject has the best testing result at 99%. The result for the first subject is decreased in sensitivity more than the second- and third-subjects’ results, whereas the result of the third subject is slightly lower than first and second subjects in specificity. The PPV result for the third subject is less than the first and second subjects, whereas the result of NPV for the first subject is the lowest. LR+ has the highest value for the third subject while LR− result for the first subject is 0.1333.
The ALL combined experiment shows the performance of all three subjects’ images. The execution time of all three subjects is the highest. The result of training for all three subjects is slightly lower than for first and third subjects. ALL-combined experiment has the lowest result in testing comparing to other results. Sensitivity and specific results for ALL is lowest. The results shown in PPV and NPV for ALL-combined three subjects is also lower than other results. LR+ value is less than the combined result for third subject whereas the result of LR− for ALL-combined experiment is the highest.
Conclusively, first subject has the best values in all categories in single experiment compared to other subjects’ results, except the execution time which is the highest. The results of second subject in combined are better than first and second’s results. The values of ALL-combined experiment in categories is slightly lower than other experiments. Except the value of training is slightly better than the single of the second subject result. Overall, the single experiment of the first subject has the best values in most parameters.
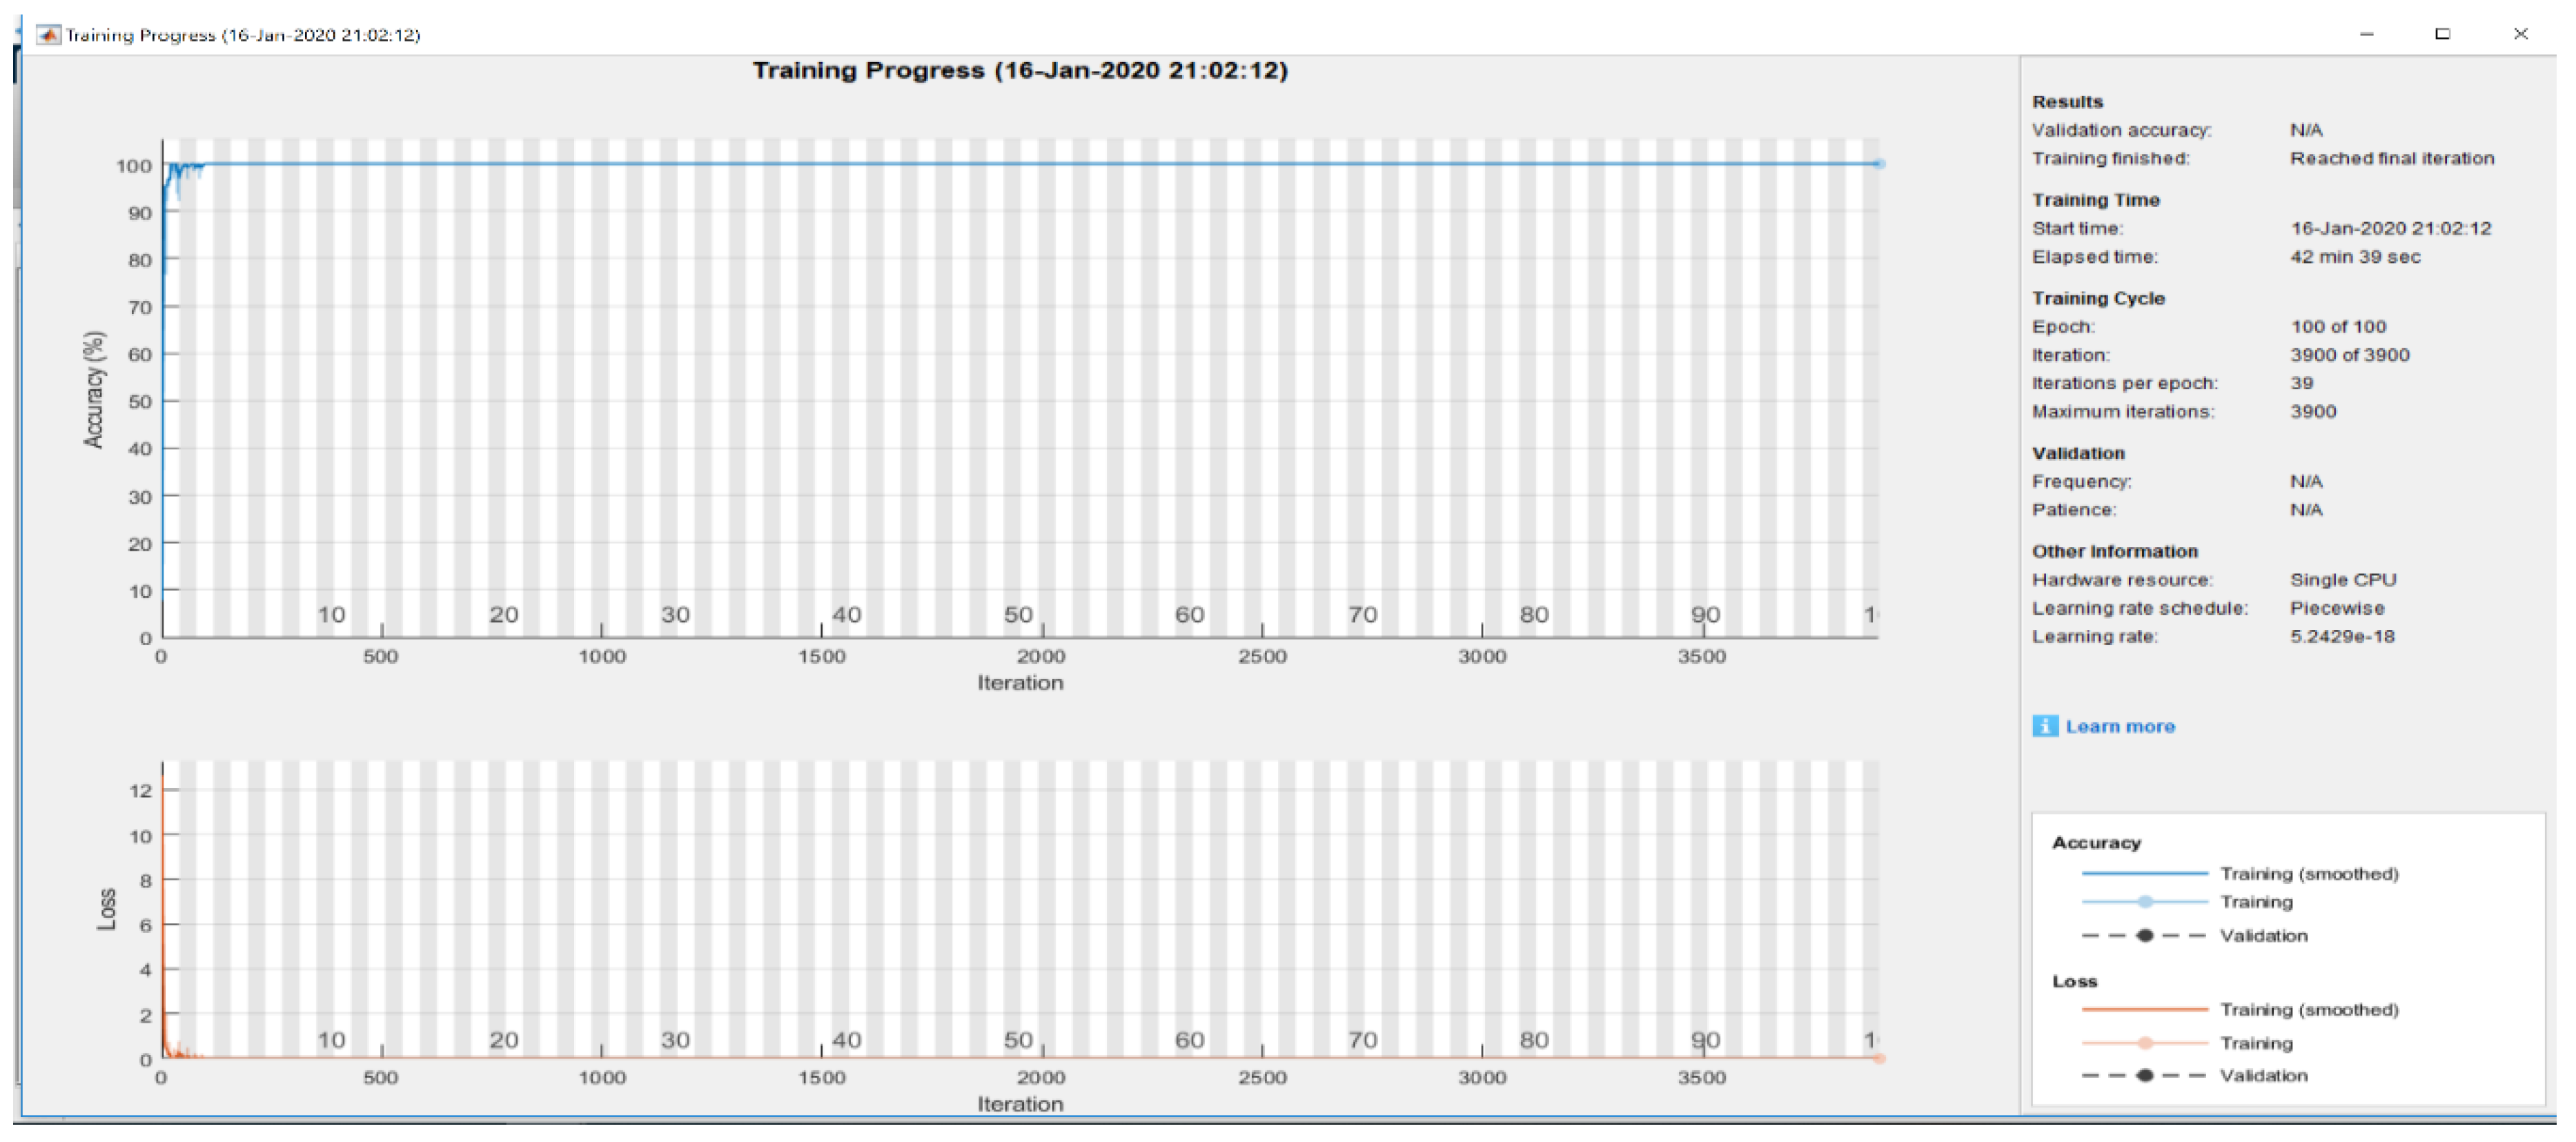
The training progress (plot) is a useful for monitoring when training status of the network [29,30,31]. This method defines how quickly the network accuracy is increasing [30,31]. The first graph is for the training accuracy and the second is for the loss function. Figure 11 shows the training metrics at each iteration, that is, an estimation of the gradient [30,31]. An epoch is a full pass by the whole dataset. The classification accuracy shows a light blue line and the dark blue line is an accuracy which is acquired by implementing a smoothing algorithm to the training accuracy [31]. while an interrupted line defines as the classification accuracy of the whole validation data set [31]. At 39 iterations, the accuracy was decreased, then improved rapidly until it reached 100% [31]. The result of validation accuracy is 100%. The loss function is displayed on the second graph. The light orange line is training loss, smoothed training loss is dark orange line and validation loss is disrupted line means the loss on each mini batch, the loss on validation set [31,32]. The number images used for training and validation is 70% of each class which is selected randomly while the remaining of 30% is used for testing. The algorithm utilises validation data. Hence, it will provide the best structure when the validation error starts to increase as the model is evaluated based on the holdout validation of the dataset after each epoch performance. The training process is stopped when the validation data set begins to degrade, therefore, to get the best structure of the validation set. In addition, other models such as weight decay are suitable for smaller models. Hence, making early stopping perfect for the current research.

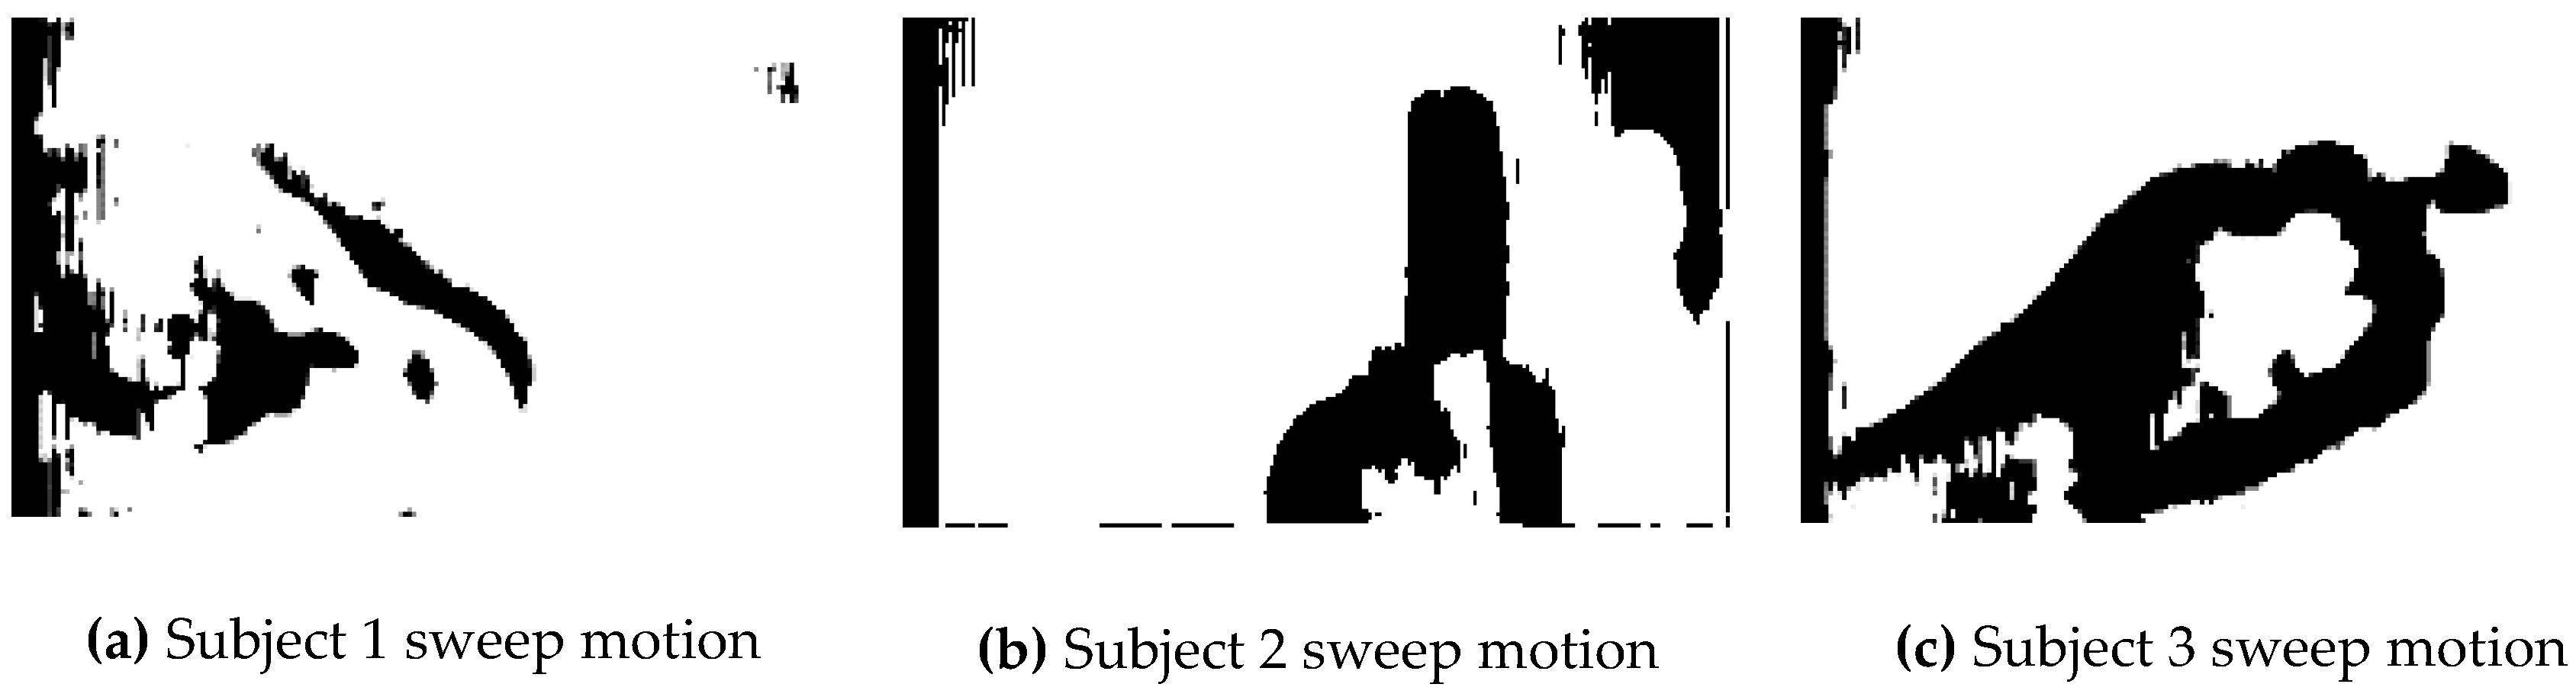
4.3. Gesture Classification Using Disparity Images

In this experiment, disparity images were created of the left/right images extracted from the frames for the three subjects. The system setup is complete identical to the configuration used in Section 4.1. However, there is a single image (disparity image) as the input to the CNN. Table 4 presents comparison results of the three subjects for the training and testing. The system always achieves 100% training accuracy. The first subject has the best testing result at 100%, while the second and third subjects have lower results. The sensitivity result for the second subject is slightly lower than the first and third results, while all results for three subjects are equal in specificity. The PPV result for second subject is lower than other results, while the result of NPV for all three subjects is equalled. LR+ for the second subject is the highest which at 933 while LR− results for all three subjects is equalled. The execution time is the lowest compared to other results. The training result is 100% whereas the testing result is 0.9803. The result is decreased in sensitivity for three subjects results whereas the results of combined are equalled in specificity. The PPV result of the combined is higher than the second subject’s result. The NPV result recorded for the combined experiment is the lowest compared to other results. LR+ is zero compared to the result of the second subject which has the highest result. The highest value for LR− is 0.0364, while other results are zero.
A summary of the comparison is that the first subject has the best values in all categories in the single experiment compared to other subjects’ results, except the execution time for the second subject is the highest. The values presented for the combined experiment is slightly lower than other results. Overall, the single experiment of the first subject has the best values in most parameters.

4.4. System Validation Using CNN

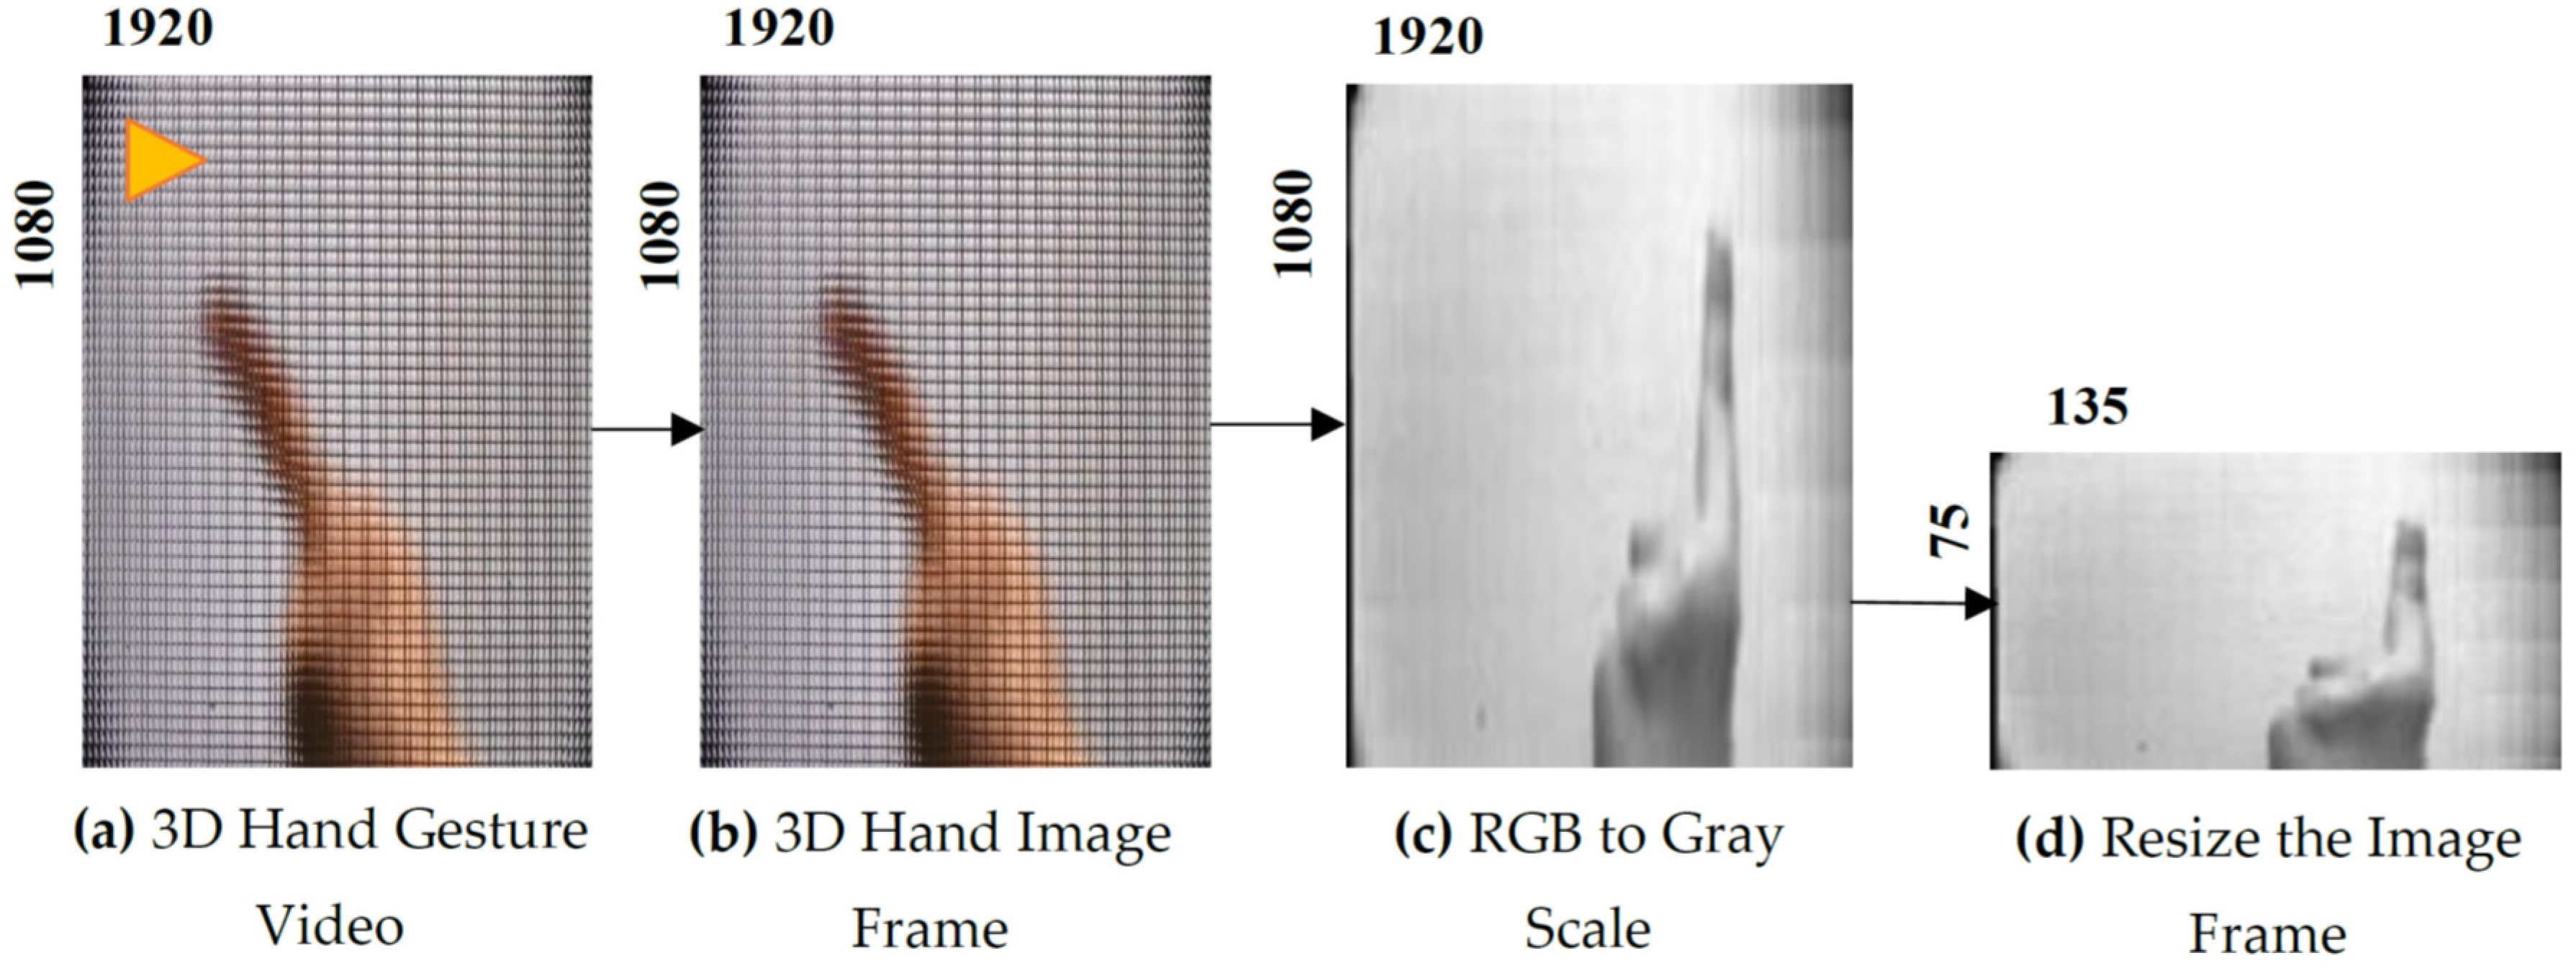
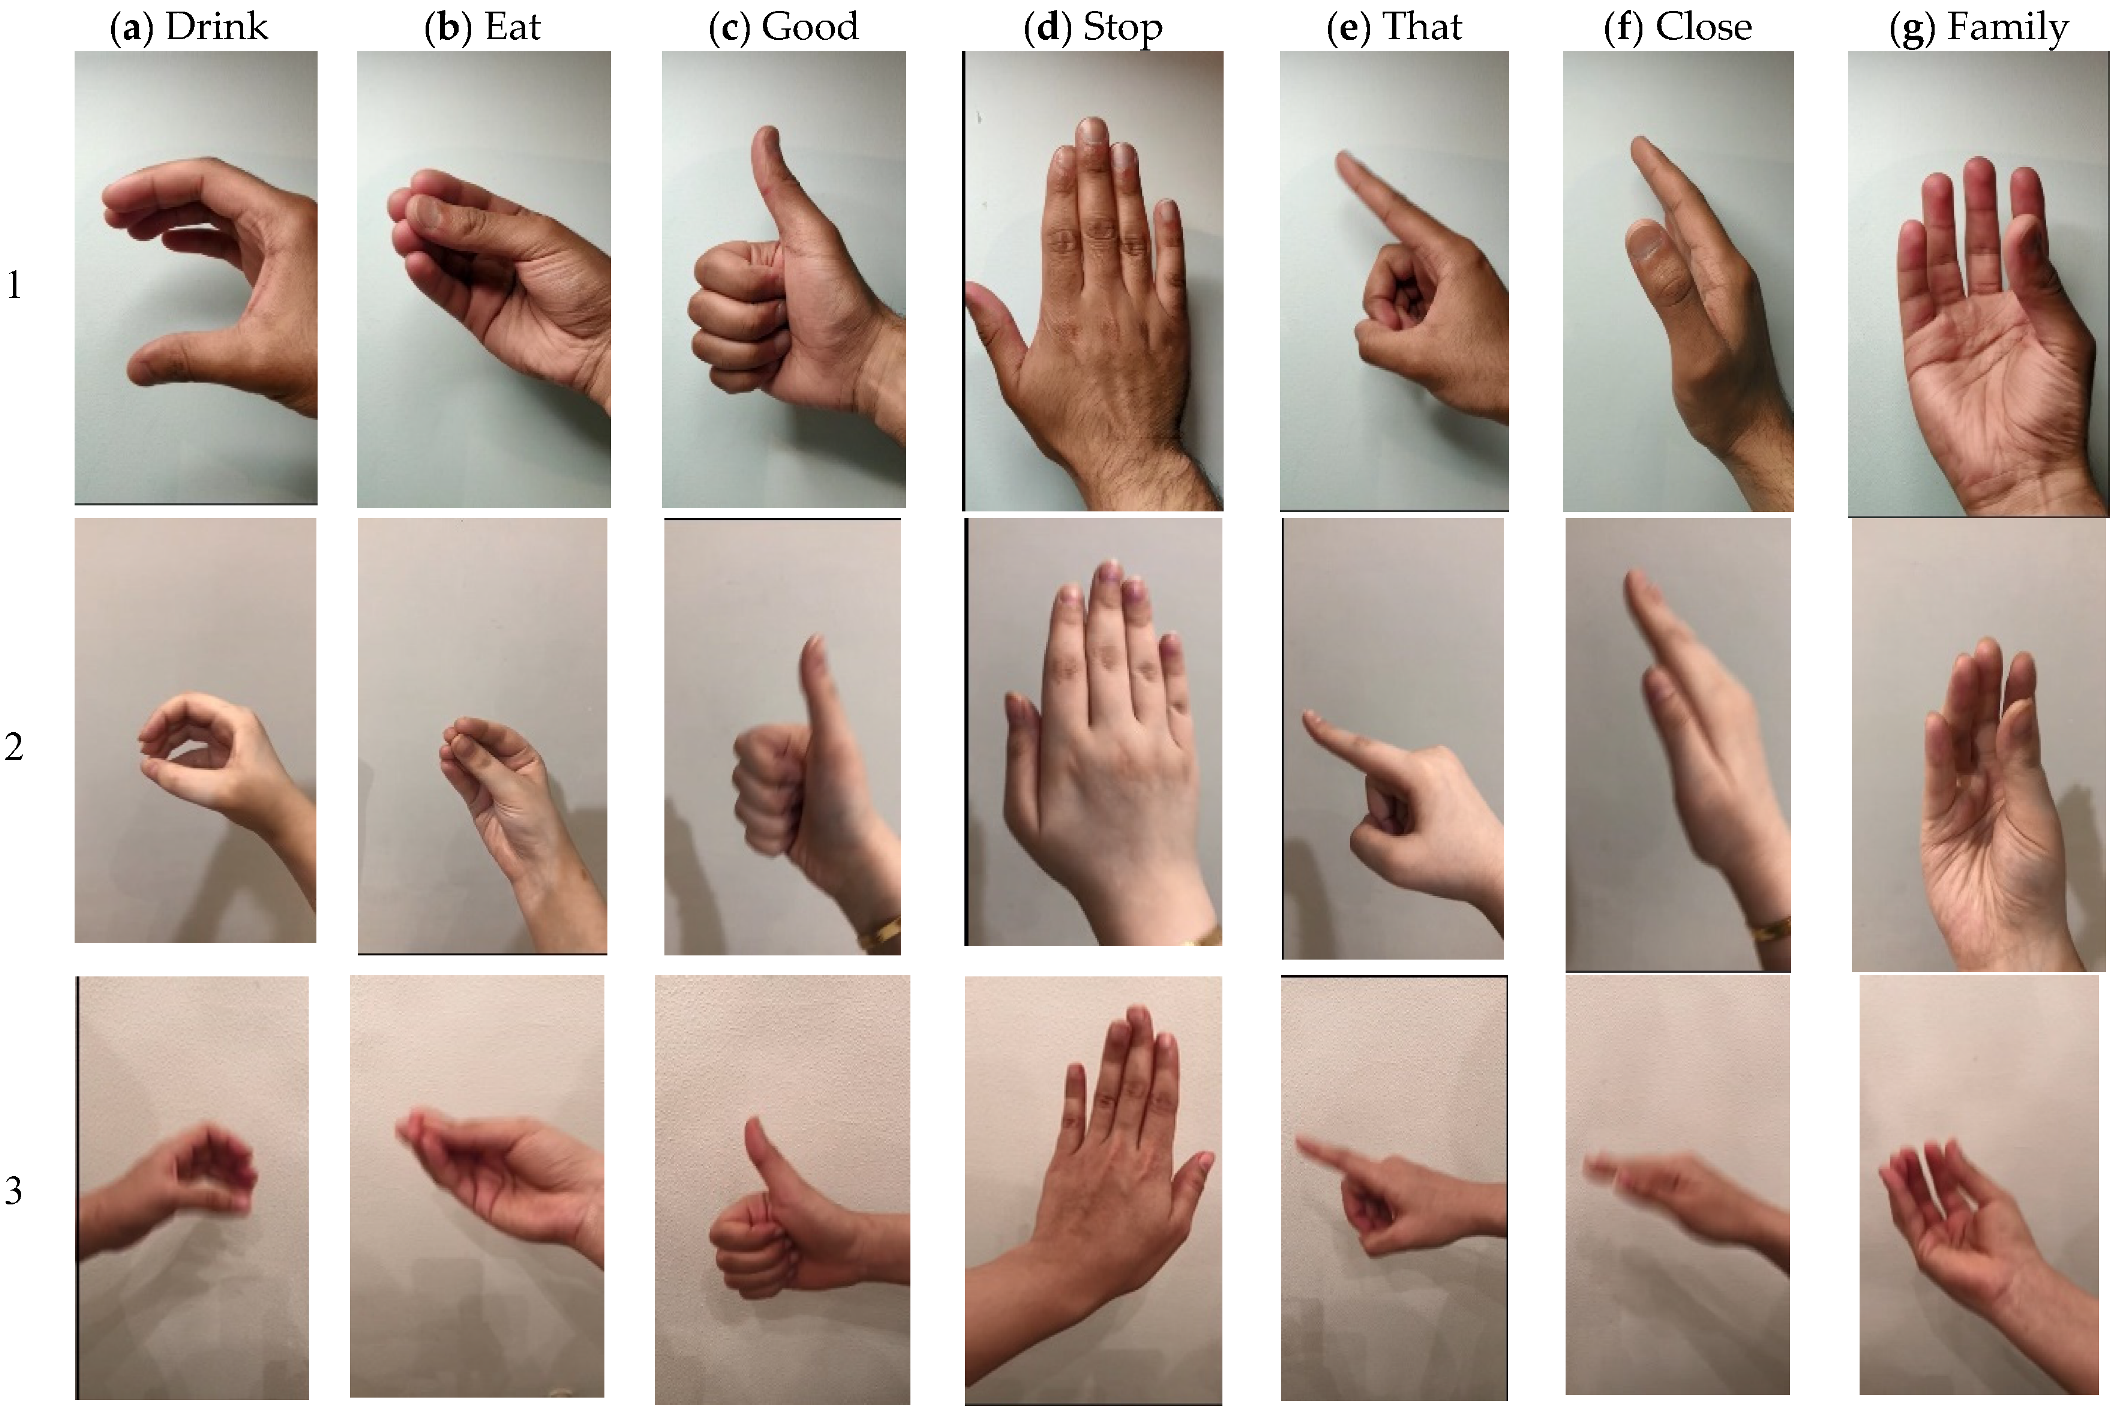
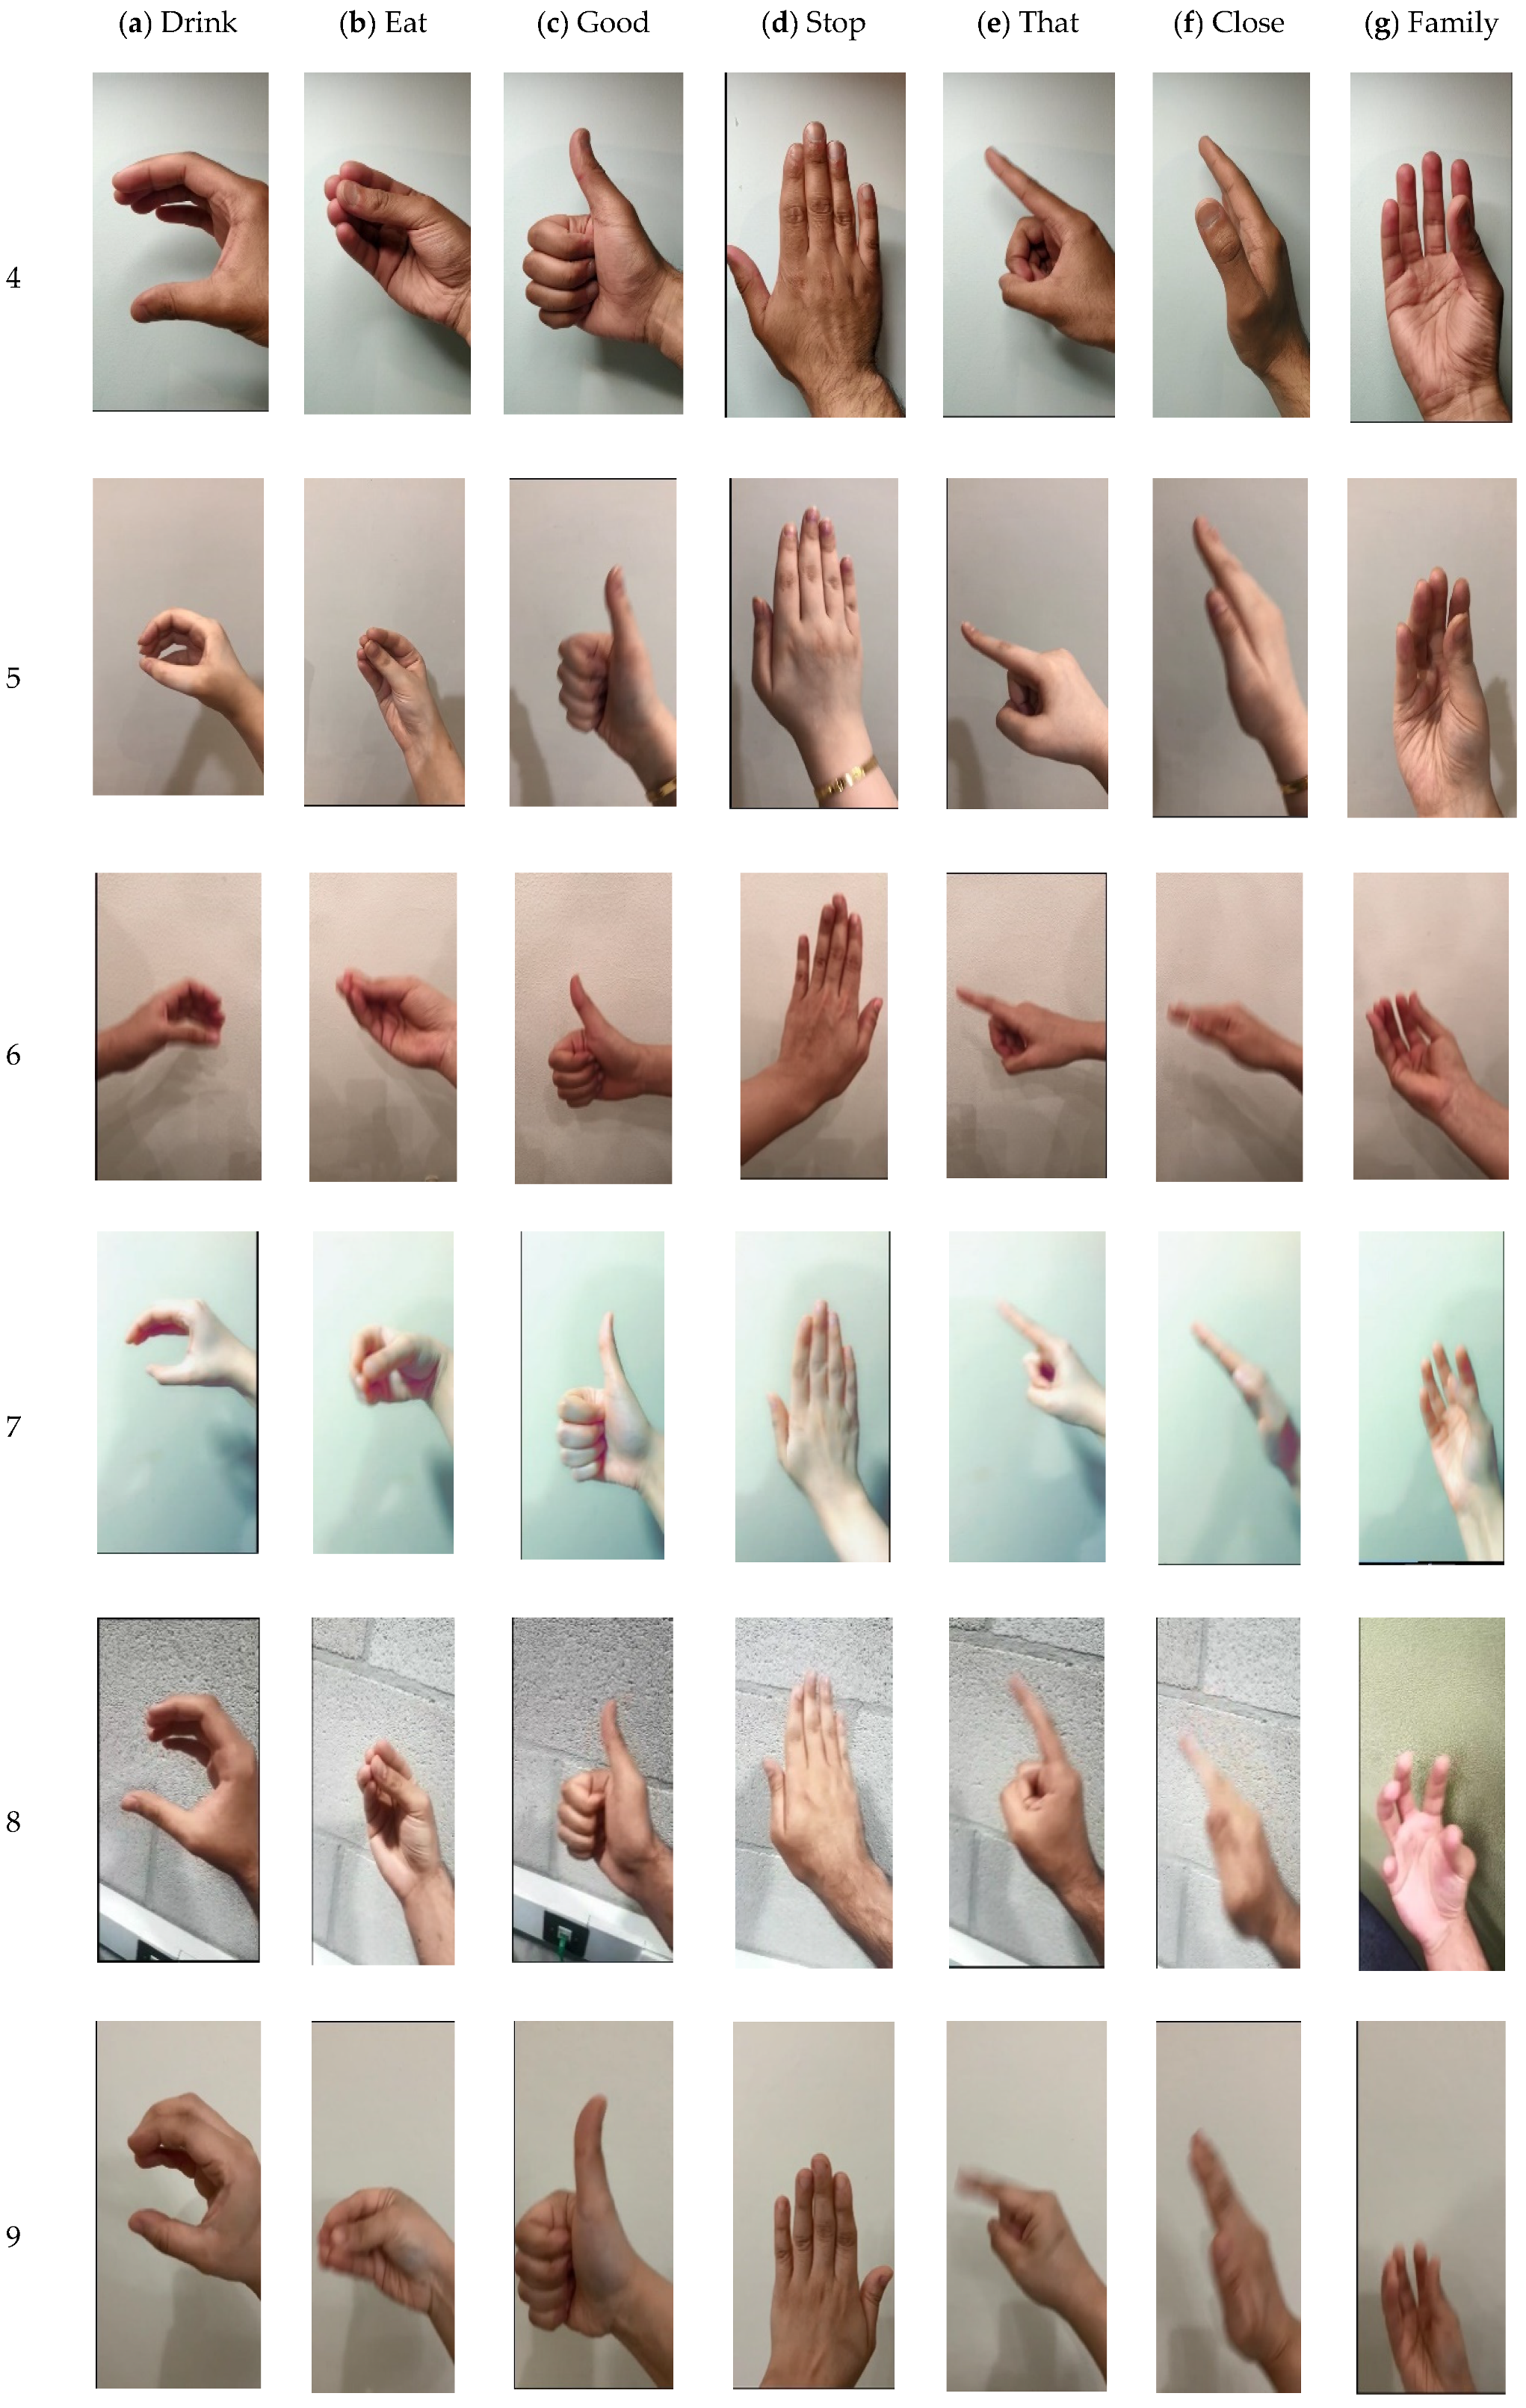
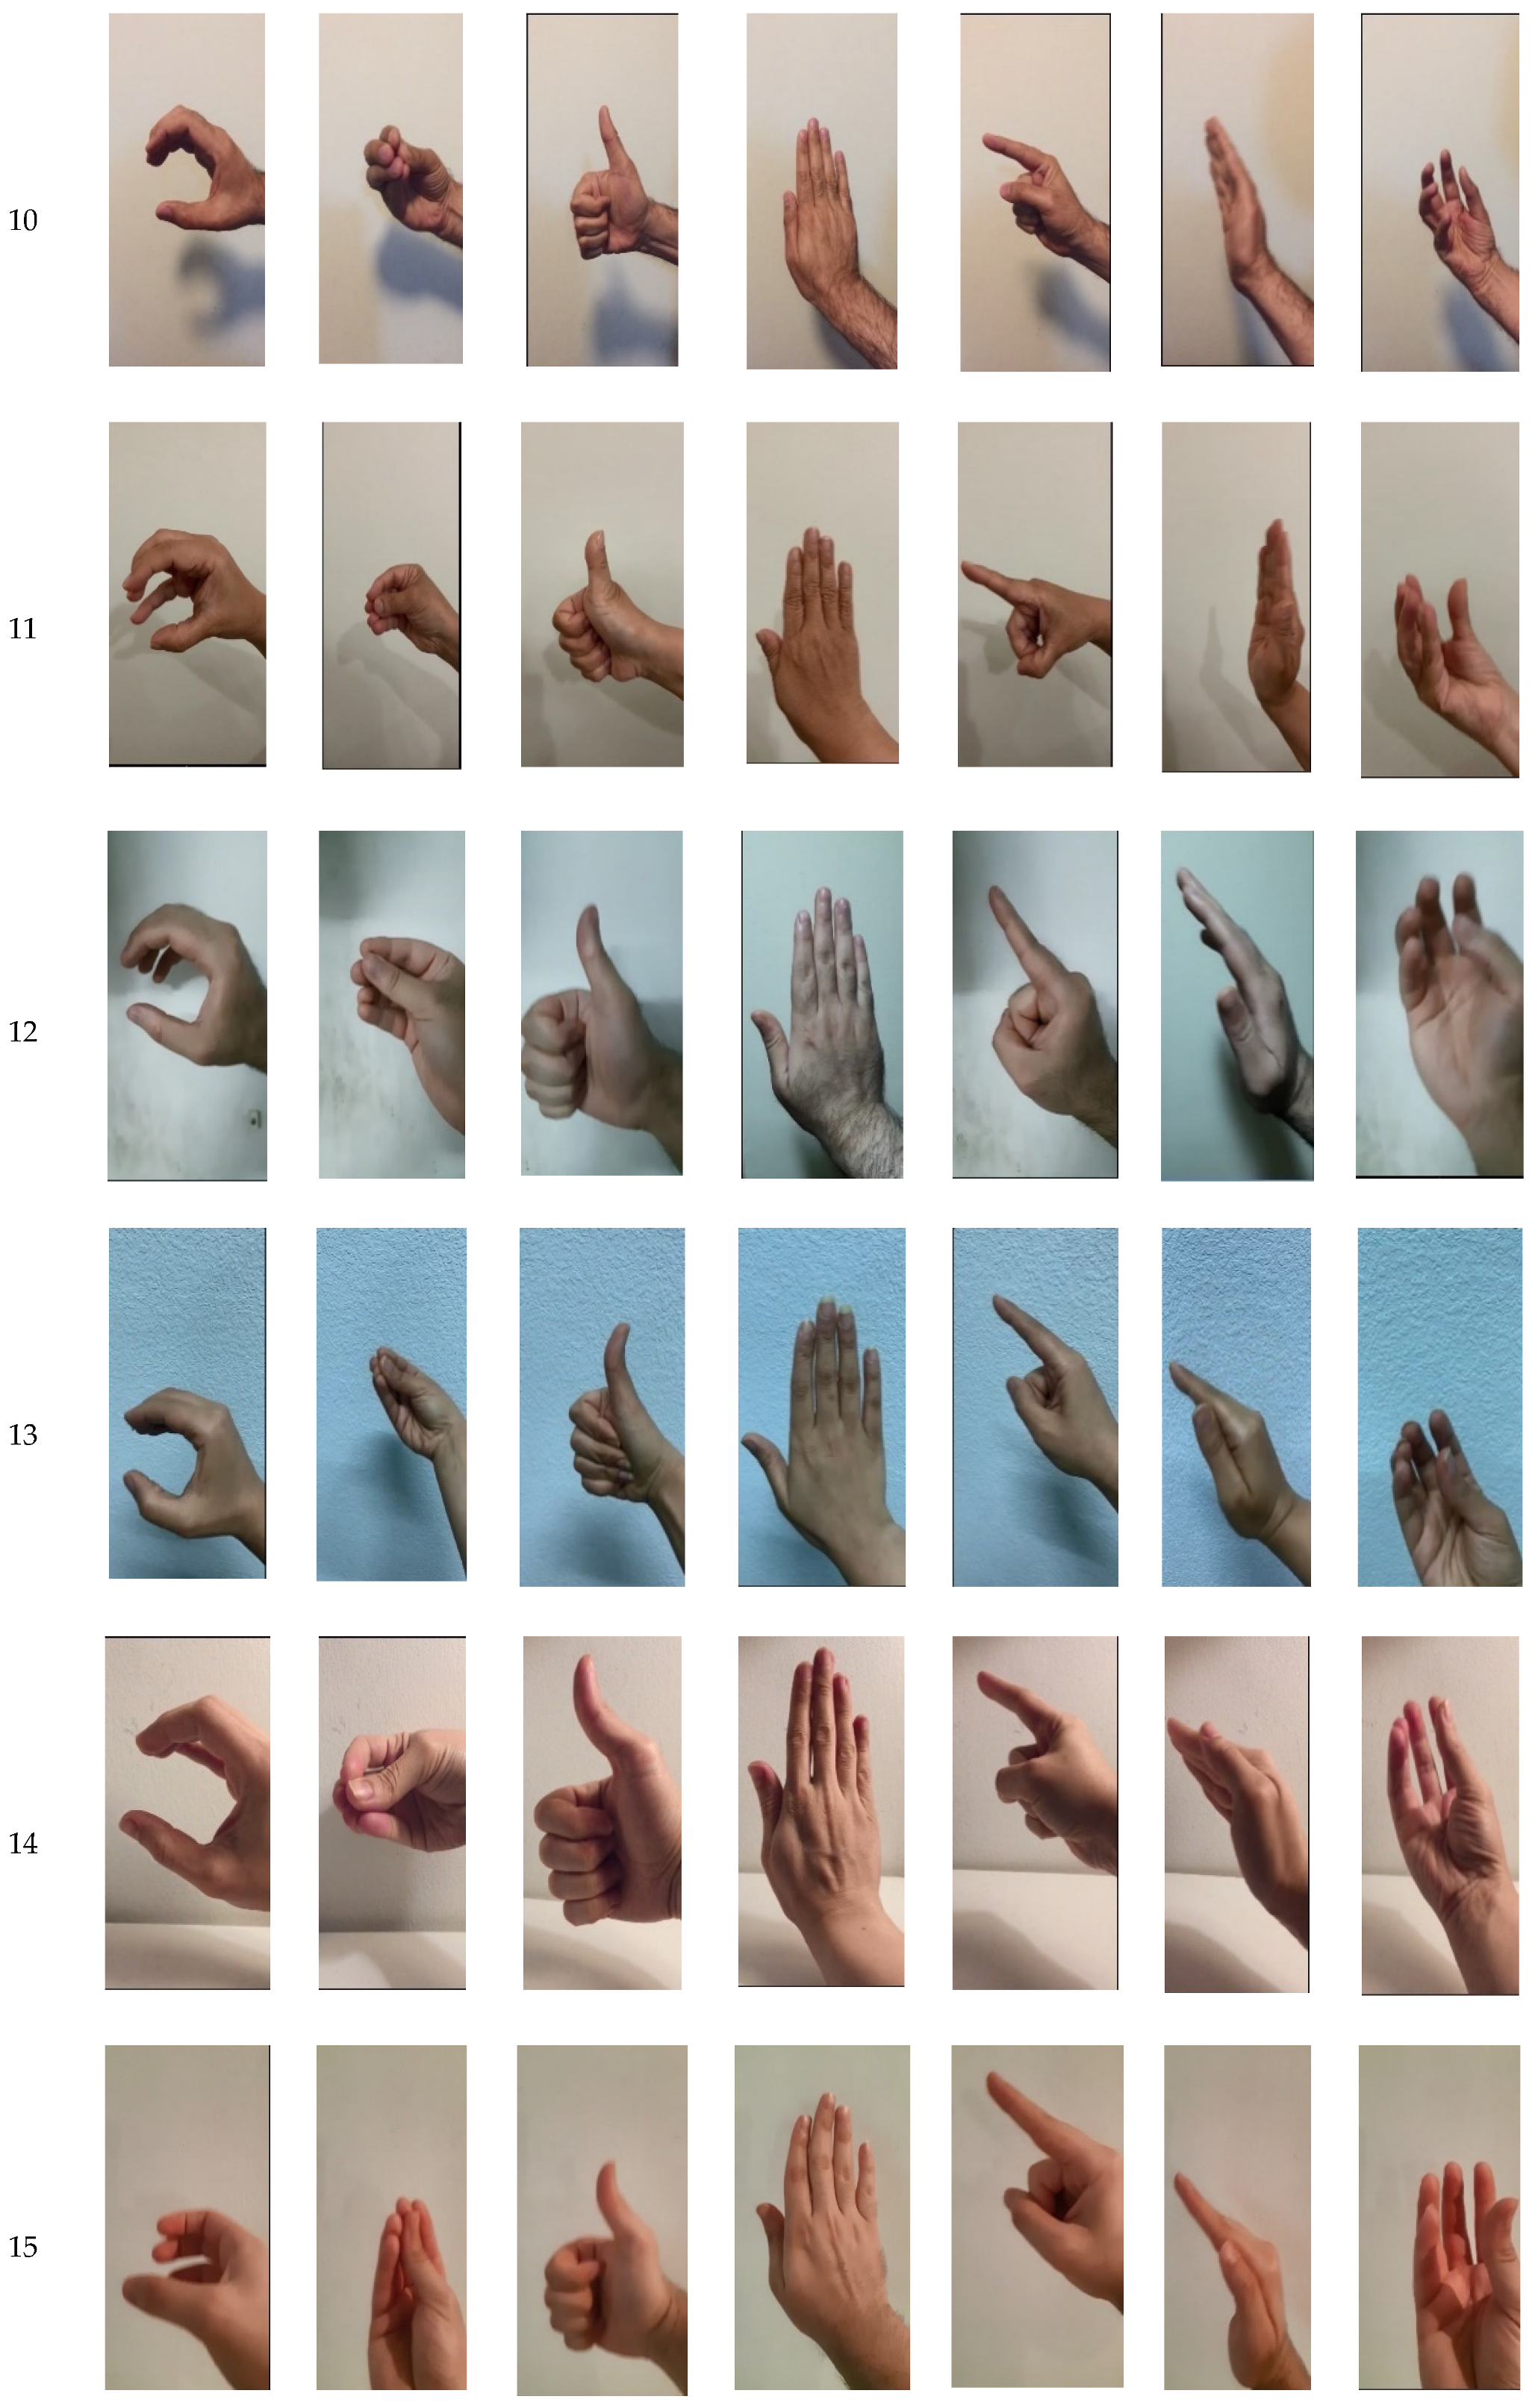
In this experimental work, the system is validated using 20 subjects with 7 gestures each. 140 videos are generated, and 24,698 image frames were extracted. The method to convert the image frame from RGB colour to grey and resize it to 227 × 227 from the original image size. Each recorded video has a various number of frames between 3394 to 3670 frames. The data of images is divided into training and testing datasets. The number of training frames is 17,288 (70%) while the remaining (7410) is used for testing. The experiments were executed to acquire the accuracy of seven hand gestures.
A summary of the values obtained for various parameters in training and testing approach is listed in Table 5. The accuracy result of training is 100% compared to 99.12% for testing. The value of sensitivity in training is slightly higher than testing. Specificity for training is 100% whereas for testing is 99.89%. The PPV and NPV of testing is lower than training. The best value for LR+ and LR− are recorded for training.
The training parameter values in CNN are fixed for all categories. The execution time for training and testing is approximate 4 h, 19 min, and 57 s, which is the duration to train and validate the system using seven hand gestures. Overall, CNN is an algorithm capable of classifying different hand gestures.

5. Conclusions

Hand gesture detection is the basis for providing a natural HCI system. The most essential aspects of gesture recognition are segmentation, detection, and tracking. In this work, experiments are conducted for 3D micro hand gesture recognition using feature extraction and classification through the CNN technique. In this experimental work, twelve 3D motions are recorded from three subjects. The second experimental work was performed for the disparity of 3D micro hand gestures using the CNN technique. To present the system validation study, seven different common gestures recorded for twenty subjects and implemented using CNN algorithm. Experiments were implemented to compare the performance of the CNN technique in terms of different factors such as execution time, training, testing, sensitivity, specificity, PPV, NPV, LR+, and LR−. The results generated from this study provided 99.12% accuracy which complies with research conducted in [10]. The main contribution of this experimental work is that CNN able to detect the significant features of an image without any human observation. The results showed that the single experiment for the first subject delivered better results in all categories because of the weight sharing feature and efficient memory storage of CNN. For the system validation study, CNN algorithm has a high ability to classify images. The important contribution of this paper is that provides a high accuracy using different statistical factors for hand gesture detection using CNN algorithm. In future work, the LSTM algorithm will be utilised to classify the gestures of the twenty subjects. The data will be deposited using Brunel University Research Archive (BURA) which will easily allow further research in 3D micro hand gesture recognition.

Author Contributions

Conceptualization, N.A., M.A. and R.S.; methodology, N.A.; software, N.A.; validation, N.A., M.A. and R.S.; formal analysis, N.A.; investigation, N.A.; resources, N.A.; data curation, N.A.; writing—original draft preparation, N.A.; writing—review and editing, N.A. and M.A.; visualization, N.A.; supervision, M.A.; project administration, M.A.; funding acquisition, M.A. All authors have read and agreed to the published version of the manuscript.

Funding

This research received no external funding.

Acknowledgments

The first author indebted to show her appreciation to Imam Abdulrahman bin Faisal University for their financial support received for PhD study.

Conflicts of Interest

The authors declare no conflict of interest.

Appendix A

Figure A1. The disparity of Subjects 1, 2 and 3 images.
Technologies 08 00019 g0a1aTechnologies 08 00019 g0a1b

Appendix B

Figure A2. Seven hand motions for the remaining seventeen subjects.
Technologies 08 00019 g0a2aTechnologies 08 00019 g0a2bTechnologies 08 00019 g0a2c

References

  1. Park, S.; Yu, S.; Kim, J.; Kim, S.; Lee, S. 3D hand tracking using Kalman filter in depth space. EURASIP J. Adv. Signal Process. 2012, 2012, 36. [Google Scholar] [CrossRef] [Green Version]
  2. Manresa, C.; Varona, J.; Mas, R.; Perales, F.J. Hand tracking and gesture recognition for human-computer interaction. ELCVIA Electron. Lett. Comput. Vis. Image Anal. 2005, 5, 96–104. [Google Scholar] [CrossRef]
  3. Lippmann, M.G. La photographie integrale. C. R. Acad. Sci. 1908, 146, 446–551. [Google Scholar]
  4. Aggoun, A.; Tsekleves, E.; Swash, M.R.; Zarpalas, D.; Dimou, A.; Daras, P.; Nunes, P.; Soares, L.D. Immersive 3D holoscopic Video System. IEEE MultiMedia 2013, 20, 28–37. [Google Scholar] [CrossRef] [Green Version]
  5. Ge, L.; Liang, H.; Yuan, J.; Thalmann, D. 3D Convolutional Neural Networks for Efficient and Robust Hand Pose Estimation from Single Depth Images. In Proceedings of the 2017 IEEE Conference on Computer Vision and Pattern Recognition (CVPR), Honolulu, HI, USA, 21–26 July 2017; pp. 5679–5688. [Google Scholar]
  6. Ge, L.; Liang, H.; Yuan, J.; Thalmann, D. Robust 3D Hand Pose Estimation in Single Depth Images: From Single-View CNN to Multi-View CNNs. In Proceedings of the 2016 IEEE Conference on Computer Vision and Pattern Recognition (CVPR), Las Vegas, NV, USA, 27–30 June 2016; pp. 4422–4436. [Google Scholar]
  7. Ahn, Y.-K.; Park, Y.-C. The Hand Gesture Recognition System Using Depth Camera. In Proceedings of the ACHI 2017: The Tenth International Conference on Advances in Computer-Human Interactions, Nice, France, 19–23 March 2017; pp. 234–238. [Google Scholar]
  8. Hamzah, R.A.; Ibrahim, H. Literature Survey on Stereo Vision Disparity Map Algorithms. J. Sens. 2016, 2016, 8742920. [Google Scholar] [CrossRef] [Green Version]
  9. Demirdjian, D.; Darrell, T. Motion Estimation from Disparity Images. In Proceedings of the Eighth IEEE International Conference on Computer Vision, ICCV 2001, Vancouver, BC, Canada, 7–14 July 2001; pp. 213–218. [Google Scholar]
  10. Alnaim, N.; Abbod, M. Mini Gesture Detection Using Neural Networks Algorithms. In Proceedings of the Eleventh International Conference on Machine Vision (ICMV 2018), Munich, Germany, 1–3 November 2018. [Google Scholar]
  11. Pyo, J.; Ji, S.; You, S.; Kuc, T. Depth-Based Hand Gesture Recognition Using Convolutional Neural Networks. In Proceedings of the 13th International Conference on Ubiquitous Robots and Ambient Intelligence (URAI), Xi’an, China, 19–22 August 2016; pp. 225–227. [Google Scholar]
  12. Alnaim, N.; Abbod, M.; Albar, A. Hand Gesture Recognition Using Convolutional Neural Network for People Who Have Experienced a Stroke. In Proceedings of the 2019 3rd International Symposium on Multidisciplinary Studies and Innovative Technologies (ISMSIT), Ankara, Turkey, 11–13 October 2019. [Google Scholar]
  13. Alazawi, E.; Aggoun, A.; Abbod, M.; Swash, M.R.; Fatah, O.A.; Fernandez, J. Scene Depth Extraction from Holoscopic Imaging Technology. In Proceedings of the 2013 3DTV Vision beyond Depth (3DTV-CON), Aberdeen, UK, 7–8 October 2013. [Google Scholar]
  14. Kim, Y.; Toomajian, B. Hand Gesture Recognition Using Micro-Doppler Signatures with Convolutional Neural Network. IEEE Access 2016, 4, 7125–7130. [Google Scholar] [CrossRef]
  15. Molchanov, P.; Gupta, S.; Kim, K.; Kautz, J. Hand Gesture Recognition with 3D Convolutional Neural Networks. In Proceedings of the 2015 IEEE Conference on Computer Vision and Pattern Recognition Workshops (CVPRW), Boston, MA, USA, 7–12 June 2015. [Google Scholar]
  16. Núñez, J.C.; Cabido, R.; Pantrigo, J.J.; Montemayor, A.S.; Vélez, J.F. Convolutional Neural Networks and Long Short-Term Memory for skeleton-based human activity and hand gesture recognition. Pattern Recognit. 2018, 76, 80–94. [Google Scholar] [CrossRef]
  17. Molchanov, P.; Yang, X.; Gupta, S.; Kim, K.; Tyree, S.; Kautz, J. Online Detection and Classification of Dynamic Hand Gestures with Recurrent 3D Convolutional Neural Networks. In Proceedings of the 2016 IEEE Conference on Computer Vision and Pattern Recognition (CVPR), Las Vegas, NV, USA, 27–30 June 2016. [Google Scholar]
  18. Li, G.; Tang, H.; Sun, Y.; Kong, J.; Jiang, G.; Jiang, D.; Tao, B.; Xu, S.; Liu, H. Hand gesture recognition based on convolution neural network. Clust. Comput. 2019, 22, 2719–2729. [Google Scholar] [CrossRef]
  19. Kim, S.Y.; Han, H.G.; Kim, J.W.; Lee, S.; Kim, T.W. A hand gesture recognition sensor using reflected impulses. IEEE Sens. J. 2017, 17, 2975–2976. [Google Scholar] [CrossRef]
  20. Holoscopic 3D Vision. Available online: https://www.brunel.ac.uk/research/Projects/Horoscopic-3D-Vision (accessed on 20 January 2020).
  21. Swash, M.R. Holoscopic 3D Imaging and Display Technology: Camera/Processing/Display. Ph.D. Thesis, Brunel University London, London, UK, 2013. [Google Scholar]
  22. Agooun, A.; Fatah, O.A.; Fernandez, J.C.; Conti, C.; Nunes, P.; Soares, L.D. Acquisition, Processing and Coding of 3D Holoscopic Content for Immersive Video Systems. In Proceedings of the 2013 3DTV Vision beyond Depth (3DTV-CON), Aberdeen, UK, 7–8 October 2013. [Google Scholar]
  23. Feature Extraction. Available online: https://uk.mathworks.com/discovery/feature-extraction.html (accessed on 16 January 2020).
  24. Liu, Y.; Meng, H.; Swash, M.R.; Gaus, Y.F.A.; Qin, R. Holoscopic 3D Micro-Gesture Database for Wearable Device Interaction. In Proceedings of the 2018 13th IEEE International Conference on Automatic Face & Gesture Recognition (FG 2018), Xi’an, China, 15–19 May 2018. [Google Scholar]
  25. Daubechies, I. Ten Lectures on Wavelets; Siam: Philadelphia, PA, USA, 1992. [Google Scholar]
  26. Huang, N.E.; Shen, Z.; Long, S.R.; Wu, M.C.; Shih, H.H.; Zheng, Q.; Yen, N.C.; Tung, C.C.; Liu, H.H. The Empirical Mode Decomposition and Hilbert Spectrum for Nonsignalar and Nonstationary Time Series Analysis. Proc. R. Soc. Lond. Ser. A Math. Phys. Eng. Sci. 1998, 454, 903–995. [Google Scholar] [CrossRef]
  27. Nathaniel, E.U.; George, N.J.; Etuk, S.E. Determination of Instantaneous Frequencies of Low Plasma Waves in the Magnetosheath Using Empirical Mode Decomposition (EMD) and Hilbert Transform (HT). Atmos. Clim. Sci. 2013, 3, 576–580. [Google Scholar] [CrossRef] [Green Version]
  28. Convolutional Neural Network. Available online: https://uk.mathworks.com/solutions/deep-learning/convolutional-neural-network.html (accessed on 20 January 2020).
  29. Train Network. Available online: https://uk.mathworks.com/help/deeplearning/examples/monitor-deep-learning-training-progress.html (accessed on 20 January 2020).
  30. Brownlee, J. How to Choose Loss Functions When Training Deep Learning Neural Networks. Available online: https://machinelearningmastery.com/how-to-choose-loss-functions-when-training-deep-learning-neural-networks/ (accessed on 20 January 2020).
  31. Christoff, N.; Manolova, A.; Jorda, L.; Mari, J.-L. Morphological Crater Classification via Convolutional Neural Network with Application on MOLA Data. In Proceedings of the ANNA ‘18; Advances in Neural Networks and Applications 2018, St. Konstantin and Elena Resort, Bulgaria, 15–17 September 2018; pp. 1–5. [Google Scholar]
  32. Fritzke, B. Growing Cell Structures—A Self-organizing Network in k Dimensions. In Proceedings of the 1992 International Conference on Artificial Neural Networks (ICANN–92), Brighton, UK, 4–7 September 1992; pp. 1051–1056. [Google Scholar]
Figure 1. Holoscopic 3D camera prototype by 3DVJVANT project at Brunel University London [20].
Technologies 08 00019 g001
Figure 2. 3D integral Imaging camera PL: Prime lens, MLA: Microlens array, RL: Relay lens and CMOS Imaging Sensor [21].
Technologies 08 00019 g002
Figure 3. Square Aperture Type 2 camera integration with canon 5.6 k sensor [21].
Technologies 08 00019 g003
Figure 4. (a) The Holoscopic 3D micro gesture image contains of multiple 2D element Images. (b) The feature extraction for the Holoscopic 3D Image is extracting pixels from each lens to form a segment, the segment will form part of the image.
Technologies 08 00019 g004
Figure 5. Pre-processing for 3D micro hand gesture video. (a) Record 3D micro hand gestures using the Holoscopic imaging system camera. (b) 3D micro hand gestures will be extracted as an image. (c) Convert the 3D image from RGB to grey scale. (d) Resize the 3D image from 1920 × 1080 pixel to 135 × 75 pixel.
Technologies 08 00019 g005
Figure 6. Pre-extraction for first subject’s 3D micro hand motions.
Technologies 08 00019 g006
Figure 7. Post-extraction for first subject’s 3D hand micro motions (LCR).
Technologies 08 00019 g007aTechnologies 08 00019 g007b
Figure 8. The disparity images of the Sweep motion for the three subjects.
Technologies 08 00019 g008
Figure 9. Seven universal hand gestures for three different subjects.
Technologies 08 00019 g009
Figure 10. A CNN Concept.
Technologies 08 00019 g010
Figure 11. Training progress. The first graph shows the training accuracy (classification accuracy) X-axis is 100 epoch and Y-axis is 3900 Iterations. The second graph is the loss function (cross entropy loss).
Technologies 08 00019 g011
Table 1. Comparison between WT, EMD and CNN for Training phase.
WTEMDCNN
Exe Time ± SD (sec)5.794 ± 0.8959.869 ± 1.778713.694 ± 122.640
Accuracy ± SD0.400 ± 0.0720.618 ± 0.1201 ± 0
Sensitivity ± SD0.923 ± 0.0410.983 ± 0.0081 ± 0
Specificity ± SD7.756 ± 8.070.738 ± 0.2311 ± 0
PPV ± SD0.557 ± 0.1380.778 ± 0.0791 ± 0
NPV ± SD0.935 ± 0.0100.963 ± 0.0111 ± 0
LR+ ± SD18.871 ± 22.71754.628 ± 64.9261 ± 0
LR− ± SD0.713 ± 0.1190.396 ± 0.1231 ± 0
RMS ± SD2.420 ± 1.4520.850 ± 0.1281 ± 0
Table 2. Comparison between WT, EMD and CNN for Testing phase.
WTEMDCNN
Exe Time ± SD (min)0.204 ± 0.0300.192 ± 0.060713.694 ± 122.640
Accuracy ± SD0.3947 ± 0.0690.620 ± 0.1330.971 ± 0.007
Sensitivity ± SD0.331 ± 0.2250.554 ± 0.2451 ± 0
Specificity ± SD0.936 ± 0.0380.733 ± 0.3681 ± 0
PPV ± SD0.673 ± 0.4160.756 ± 0.2231 ± 0
NPV ± SD0.930 ± 0.0210.9676 ± 0.0151 ± 0
LR+ ± SD9.103 ± 8.78522.422 ± 24.9241 ± 0
LR− ± SD0.681 ± 0.1550.392 ± 0.1941 ± 0
RMS ± SD1.9780 ± 0.9010.835 ± 0.2001 ± 0
Table 3. Comparison between first subject, second subject and third subject using CNN for overall (Training and Testing) approaches.
1st Subject2nd Subject3rd SubjectALL
Single (LCR)CombinedSingle (LCR)CombinedSingle (LCR)CombinedCombined
Execution Time (H:M:S)02:33:4702:36:1600:49:0200:24:4500:51:5100:53:0802:50:16
Training110.99720.9996110.9997
Testing10.97210.99550.99730.97080.93900.9288
Sensitivity10.8667110.957510.7943
Specificity111110.99800.9963
PPV111110.97730.9479
NPV10.9880110.996410.9827
LR+00000506212.5806
LR00.1333000.042500.2064
Table 4. Comparison the disparity between individual subjects and Combined using CNN for Training and testing.
Factors1st Subject2nd Subject3rd SubjectCombined
Execution Time (H:M:S)00:29:3100:32:0900:31:1800:27:28
Training1111
Testing10.99800.99780.9803
Sensitivity10.998910.9636
Specificity1111
PPV10.985111
NPV1110.9967
LR+093300
LR−0000.0364
Table 5. Comparison between twenty subjects using CNN for Training and Testing approaches.
Figure 4.TrainingTesting
Execution Time (H:M:S)4:19:5700:00:20
Accuracy10.9912
Sensitivity10.9934
Specificity10.9989
PPV10.9934
NPV10.9989
LR+1884.4175
LR−10.0066

