Article

Demonstration of the Effect of Centre of Mass Height on Postural Sway Using Accelerometry for Balance Analysis

by
Oseikhuemen Osemekhian Davis Ojie
1,
Reza Saatchi
2,* and
Mahdieh Saatchi
3
1
Cultural Communication and Computing Research Institute, City Campus, Sheffield Hallam University, Sheffield S11WB, UK
2
Materials and Engineering Research Institute, Sheffield Hallam University, City Campus, Sheffield S11WB, UK
3
Shahid Sadoughi University of Medical Sciences and Health Services, Yazd, Iran
*
Author to whom correspondence should be addressed.
Technologies 2020, 8(2), 20; https://doi.org/10.3390/technologies8020020
Submission received: 26 February 2020 / Revised: 18 April 2020 / Accepted: 21 April 2020 / Published: 22 April 2020

Abstract

:
The effect of center of mass (COM) height on stand-still postural sway analysis was studied. For this purpose, a measurement apparatus was set up that included an accelerometry device attached to a rod: three plumb lines, positioned at 50, 75 and 100 cm to an end of the rod, each supported a plumb bob. Using a vice mechanism, the rod was inclined from vertical (0 degree inclination) in steps of 5 degrees to 90 degrees. For each inclination, the corresponding inclination angle was manually measured by a protractor and the positions of the three plumb bobs on the ground surface were also manually measured using a tape measure. Algebraic operations were used to calculate the inclination angle and the associated displacements of the plumb bobs on the ground surface from the accelerometry data. For each inclination angle, the manual and accelerometry calculated ground displacement were close. The height of COM, where the measurement was taken, affected the projected displacement on the ground surface. The COM height had a nonlinear double-effect relationship with sway as it can affect both the angle and projected sway. Normalization of the COM height was used to reduce this effect for comparison purposes.

1. Introduction

Postural sway during quiet standing is determined by the movement of the center of pressure (COP) position. The movement of COP under the feet regulates the center of mass (COM) of a person based on the operation of the inverted pendulum model [1]. The COM position is an imaginary point at which the total mass of the body can be assumed to be concentrated [2]. Postural sway assessment during quiet standing is of importance in the study of kinesiology, neurology, gerontology, motor control research, physical rehabilitation and other human movement areas [3]. In balance studies, during quiet standing, the COM sway can be used to determine the contribution of each sensory system, i.e., visual, somatosensory and vestibular, to postural control and to estimate their functionalities [4]. Therefore, the study of COM position in analysis of sensory system dysfunction and fall risk is important in the diagnosis of the underlying dysfunctions in these systems.
Various methods have been proposed for COM estimation. In quiet standing, the kinematic method is used and is based on the definition of COM [1,5,6,7]. Clinically, postural assessment could be carried out using a force platform. However, these systems are expensive and are only available in specialized centers. Additionally, a growing body of evidence suggests that poor designs of the posturographic hardware may significantly affect the assessment of the COP signal [8,9]. An alternative approach to force platform in postural analysis is accelerometry. Accelerometry is the use of an accelerometer to quantify human movement patterns [10,11,12]. The benefits of using accelerometry, compared to force platforms, in gait analysis includes lower cost, portability (i.e., test is not restricted to a laboratory environment) and flexibility in applications (e.g., it reduced size and weight allow balance measurements to be performed during walking) [10,11].
The use of accelerometry in human activity analysis and postural recognition has been reported in a number of studies [13,14]. A wearable device with a triaxial accelerometer on the chest region and a suitable algorithm were reported to detect patterns of step and determined walking postures [15]. The approach was around 93% accurate in comparison with that of a physiotherapist.
Postural assessment can be carried out by measuring sway in stand-still position. A commonly used test for this purpose is the modified Clinical Test for Sensory Interaction of Balance (mCTSIB). It consists of four balance assessment tests: (i) eyes open standing on a firm surface, (ii) eyes closed standing on a firm surface, (iii) eyes open standing on a flexible surface (such as a foam) and (iv) eyes closed standing on a flexible surface [16]. In postural control, the goal is to maintain COM within the limits of stability, thus analysis associated with COM may provide an understanding of the mechanisms responsible for balance control [17]. A number of studies reported the use of accelerometers and gyroscopes to quantify sway metrics for fall detection of balance deficit in the elderly at risk of falling and in patients with Parkinson’s disease, multiple sclerosis and Alzheimer’s disease [18,19,20].
For balance tests, it may be necessary to compare the data from a patient against groups of patients or against the data from healthy control subjects. Diagnostic features can be obtained through averaging over a number of measurements of healthy subjects [21]. The use of accelerometers to measure COM sway has been reported in several studies [22,23,24].
The aim of this study was to demonstrate the effect of the COM height on postural sway analysis using an accelerometry-based approach of an inverted pendulum and then to propose a method that allows sway comparisons across subjects with different COM heights to be carried out. In the following sections, an accelerometry approach for sway path measurement, the apparatus used in the study, and the results obtained are discussed.

2. Hypothesis of the Study

In this study, the effect of COM height in postural sway analysis was investigated. To carry out this investigation, we hypothesized that the same angular deviation should result in the same projected sway displacement on ground irrespective of their COM heights, to facilitate comparison of the sway measurements across subjects. This hypothesis is based on deriving sway patterns to analyze balance-related dysfunctions such that if the same dysfunction exists among subjects, their sway measurement should be comparable.

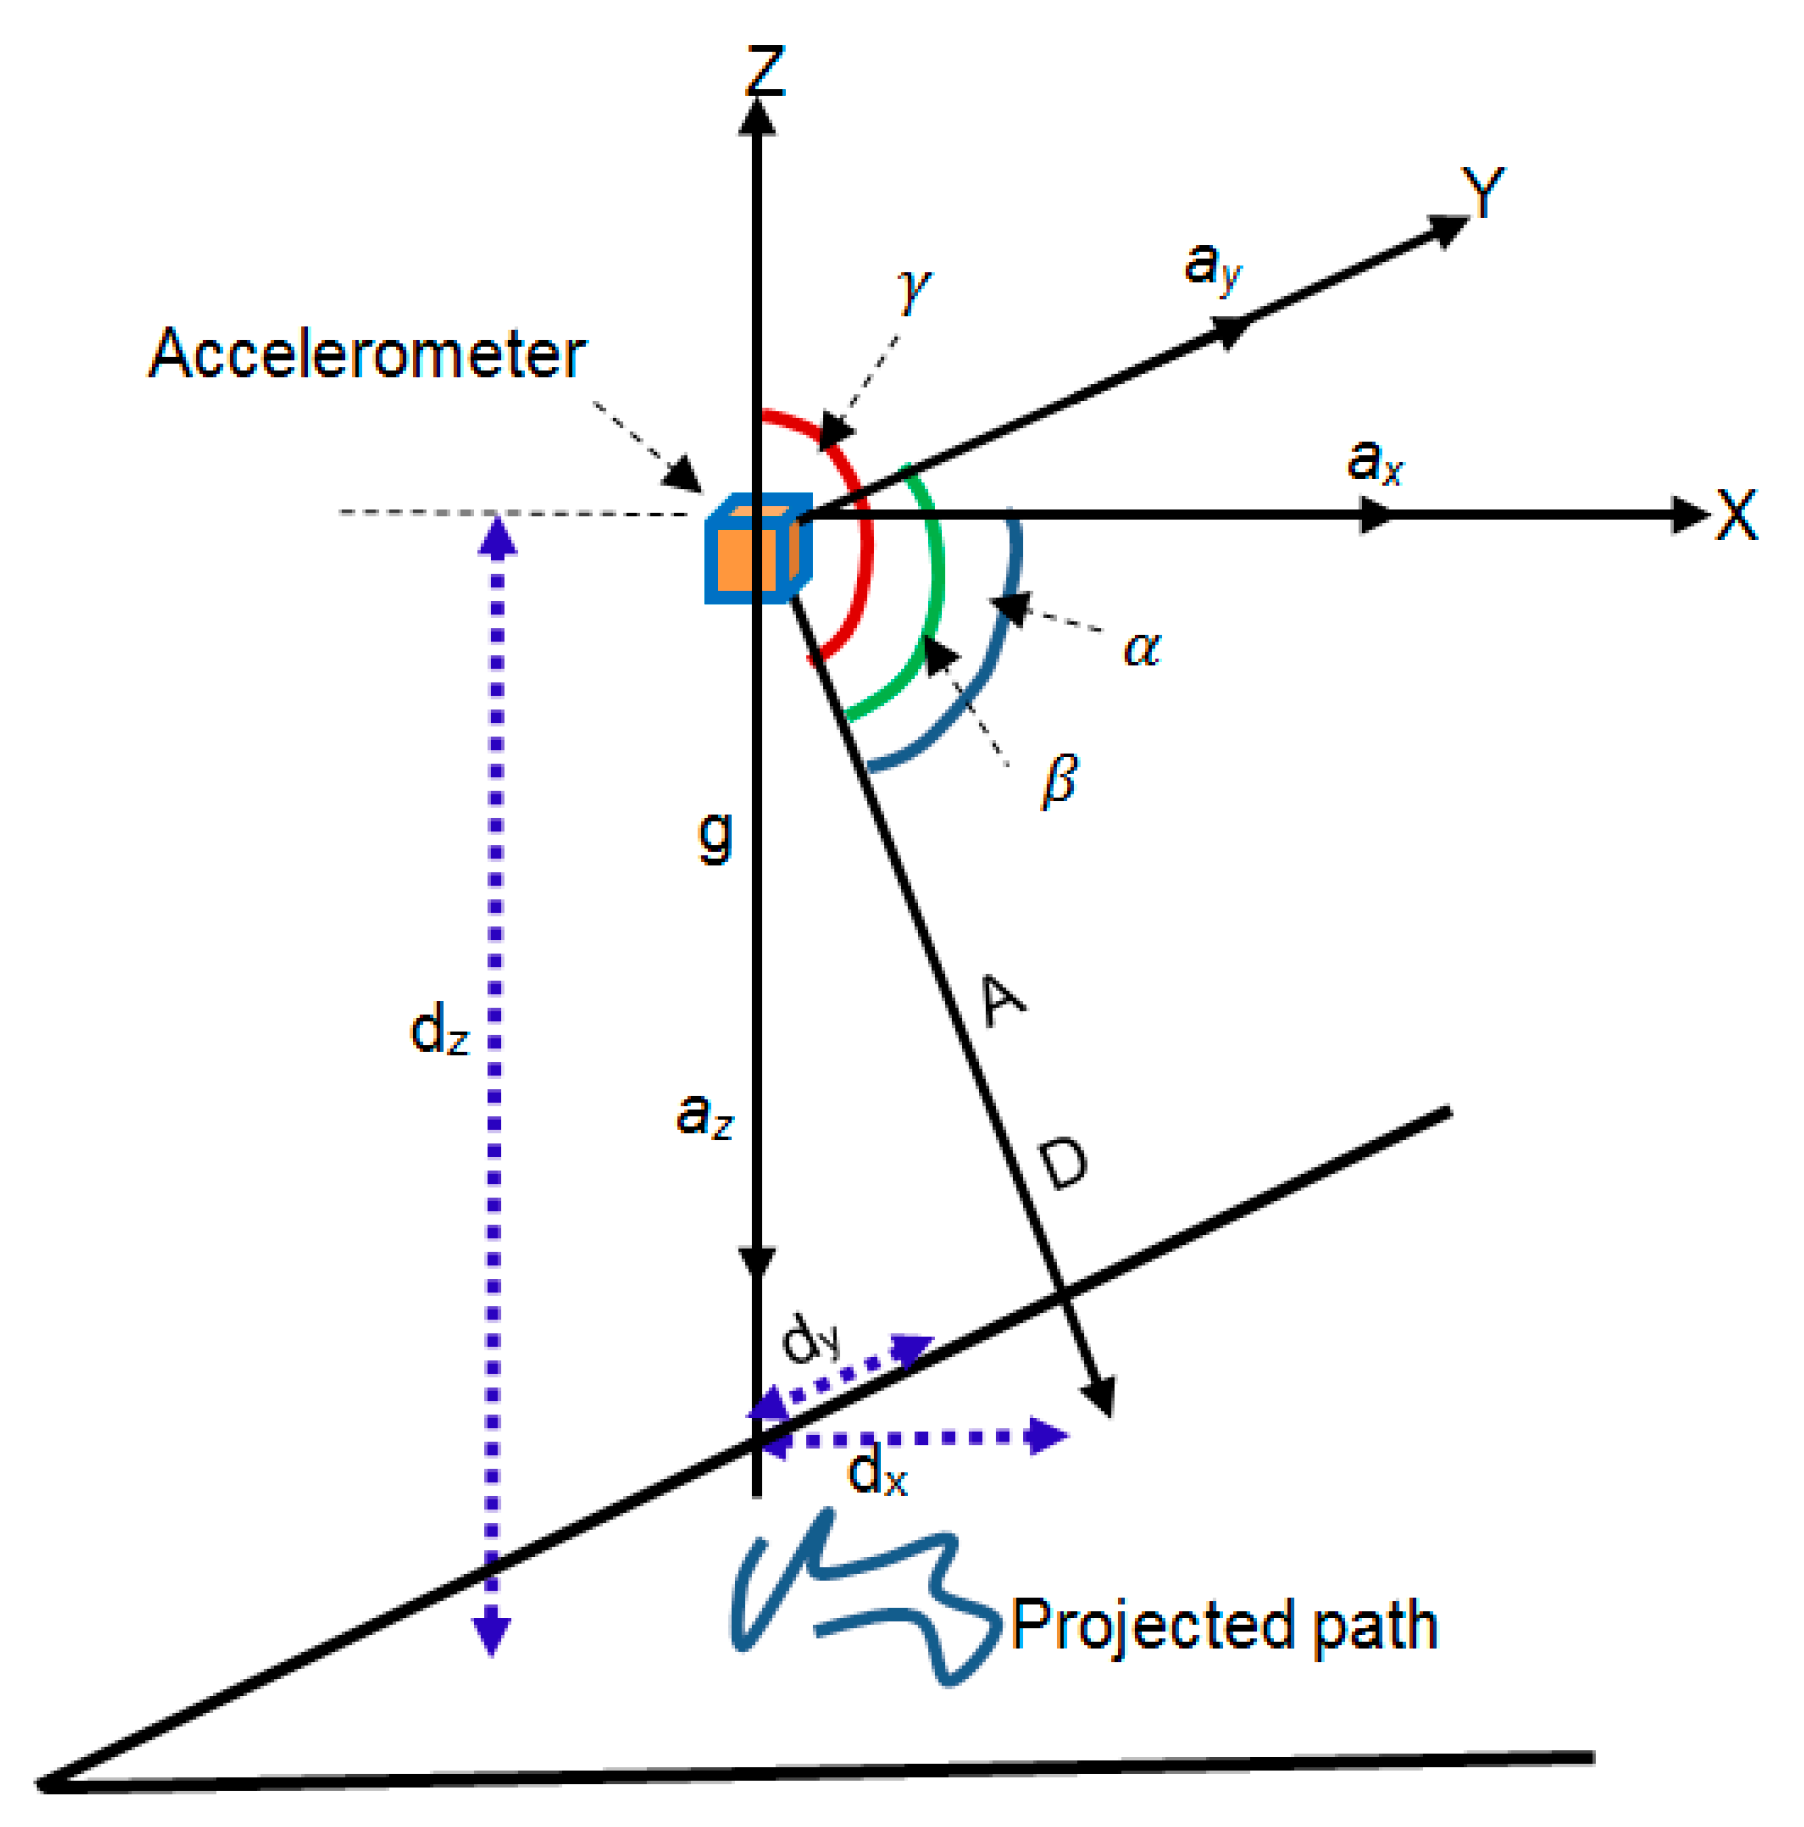
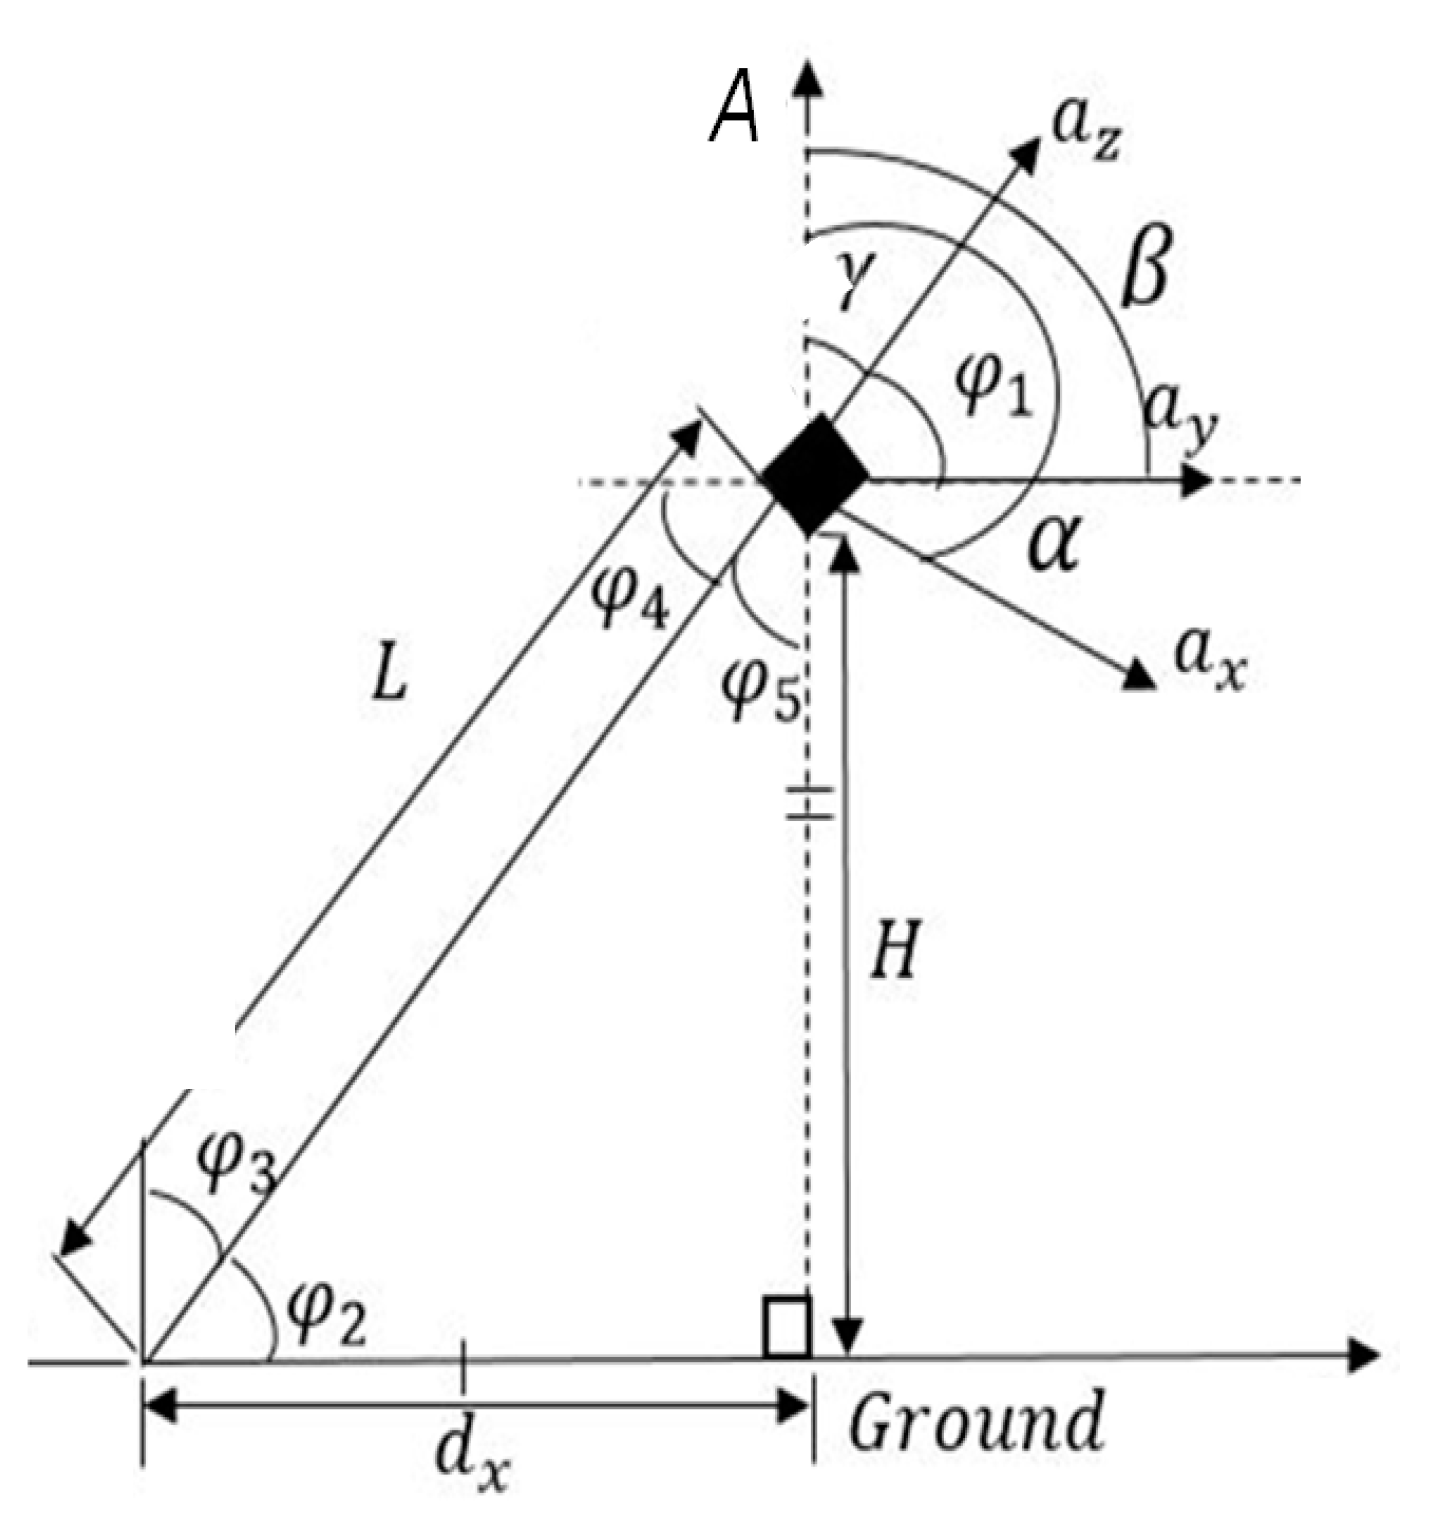
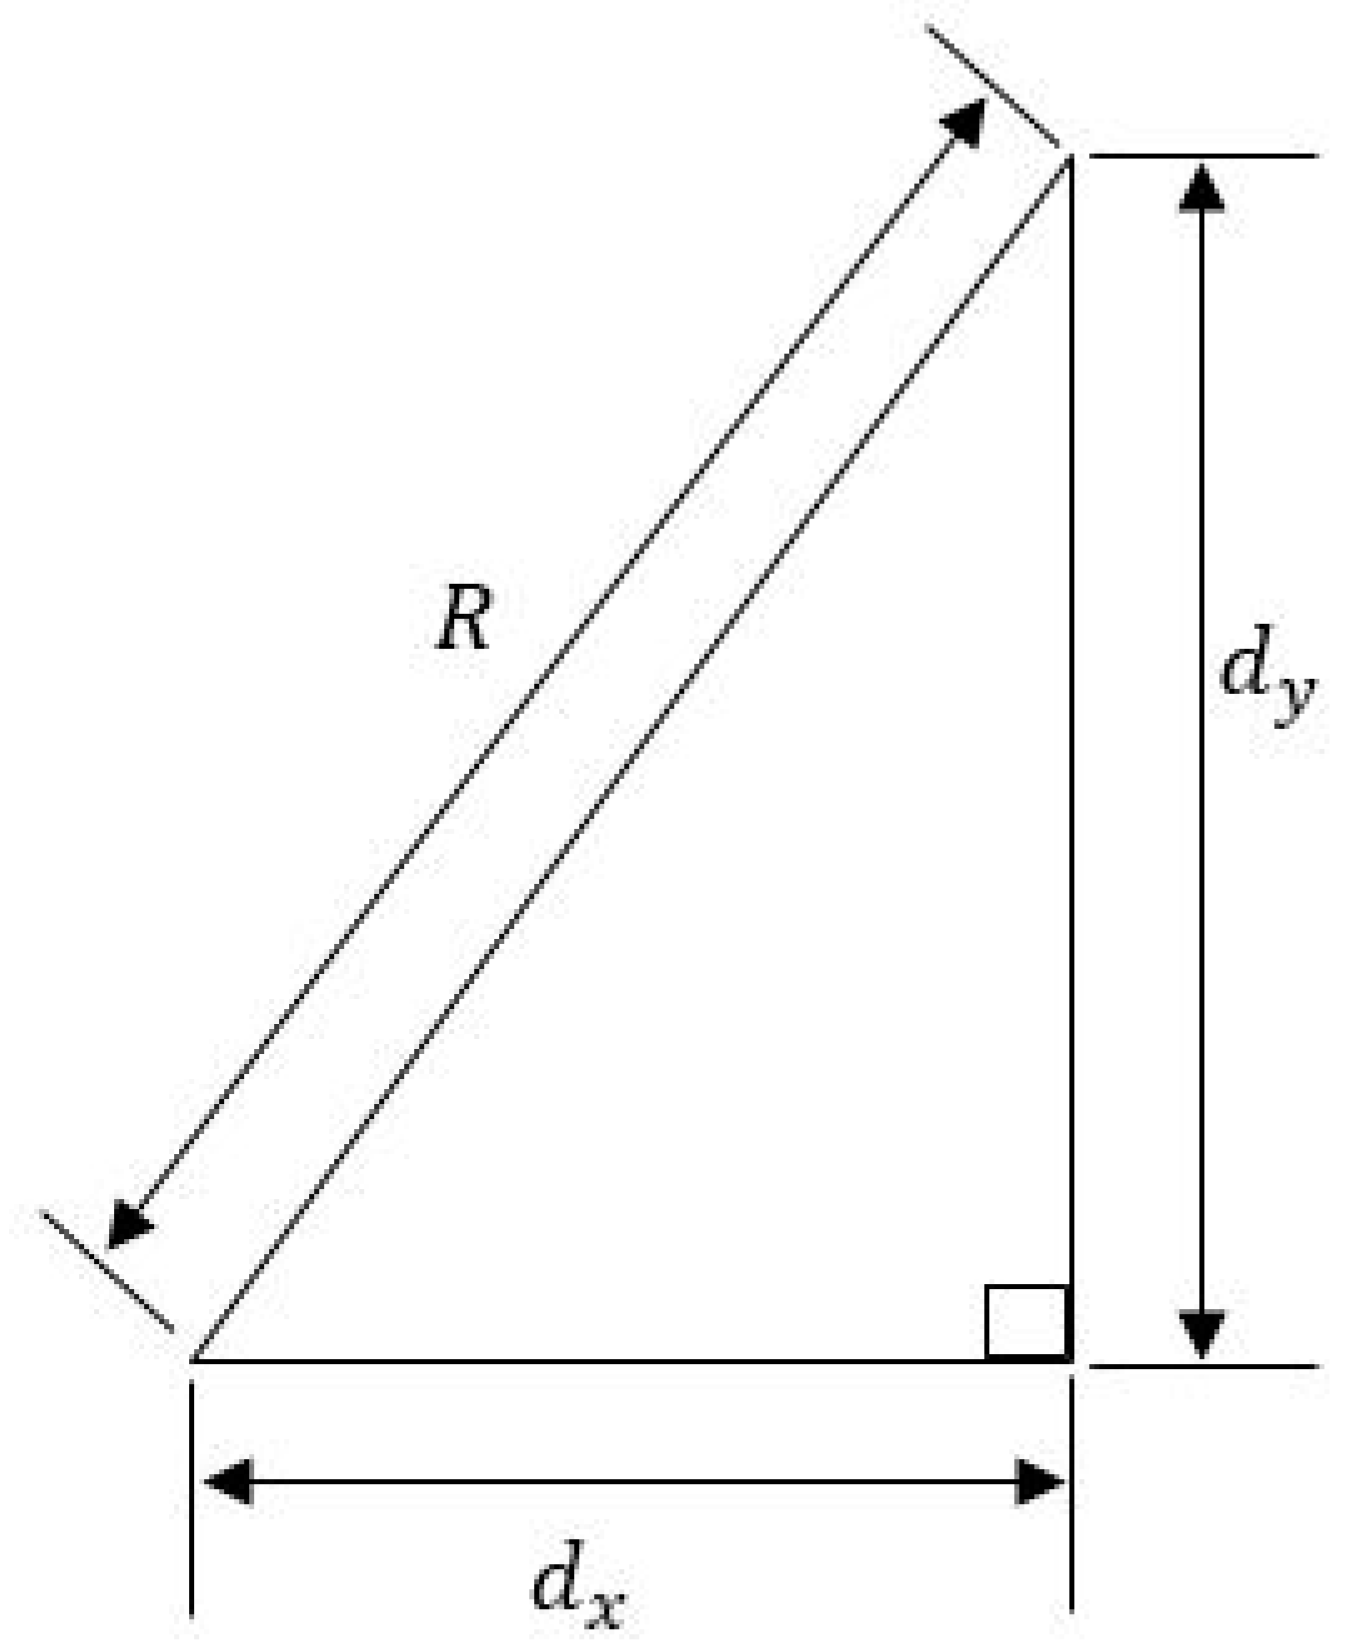
3. Accelerometry-Based Sway Measurement

During quiet standing, human sway can be modelled using the principle of an inverted pendulum. A method for the evaluation of standstill balance is shown in Figure 1 and described using Equations (1)–(3) [25], where A is the resultant acceleration. The directional cosines of the three perpendicular acceleration vectors, ax, ay and az, are given by cos(α), cos(β) and cos(γ), respectively. The projected distance is D, and the position of the COM from the ground surface is dz.
A = a x 2 + a y 2 + a z 2
cos ( α ) = a x A ,    cos ( β ) = a y A ,    cos ( γ ) = a z A
D = d z cos ( γ ) ,   d x = D cos ( α ) , = D cos ( β )
where α, β and γ are the angles obtained from the directional cosines. However, the inverted pendulum model can be described using Figure 2 and by Equations (4) and (5). This approach is similar to the one link model described in [26].
φ 1 = 90 γ ,   γ = α 90 ,   φ 1 = 180 α
φ 2 = φ 1 , φ 3 = γ (corresponding angles) and φ 4 = φ 2   ,   φ 5 = φ 3 (alternate angles).
d x = L cos ( α ) ,   d y = L cos ( β ) ,   H = L   cos ( γ )
The angles   φ 1 , φ 2 and φ 3 and the inclined vertical height from ground (H) are defined as indicated in Figure 2.
Alternatively, using the Pythagoras theorem, d x and d y can also be obtained from Figure 3 as defined by Equation (6), where R is the resultant displacement on ground (i.e., the resultant displacement in the x and y axes) from the z – axis, d x = d x when α is negative and d y = d y when β is negative.
R = L sin ( γ ) , d x = L 2 ( sin ( γ ) 2 cos ( β ) 2 ) , d y = L 2 ( sin ( γ ) 2 cos ( α ) 2 )

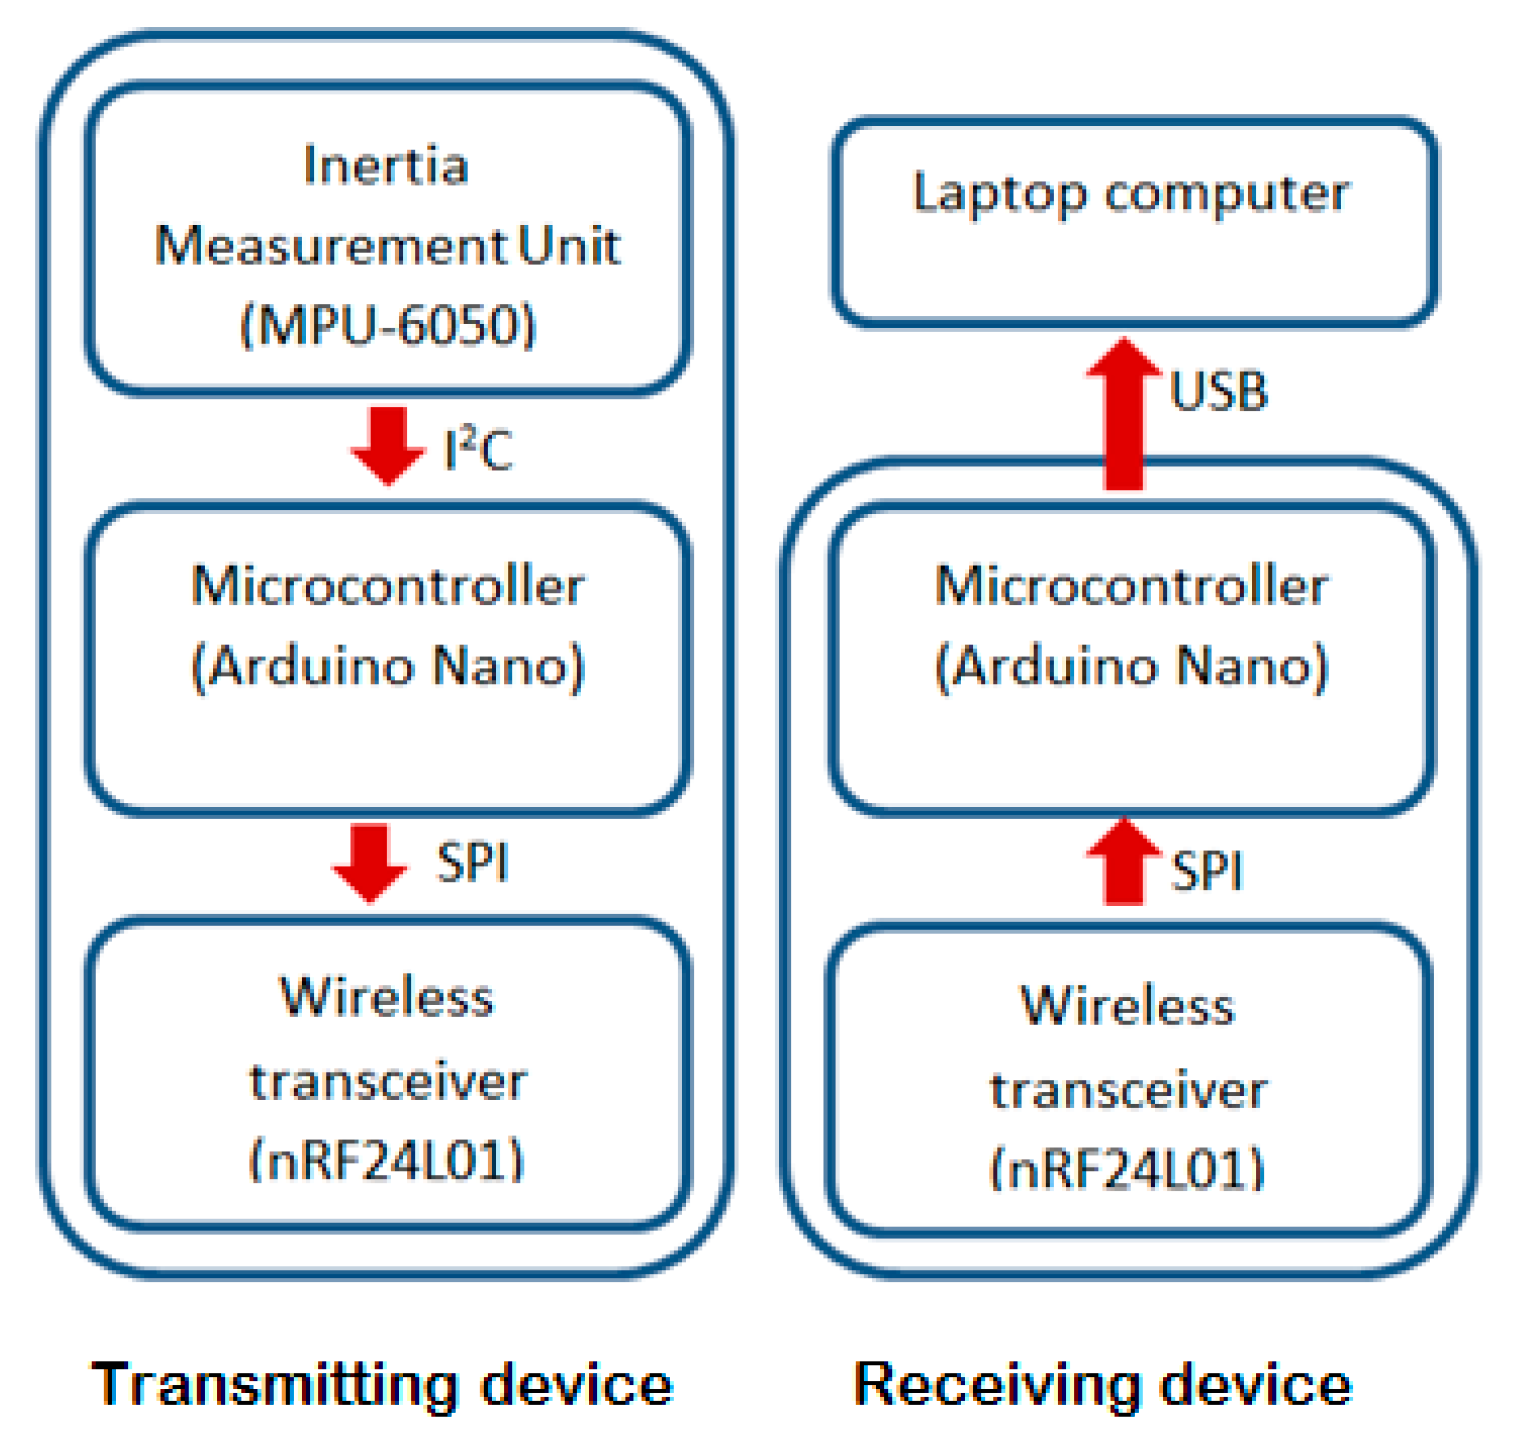
4. Accelerometry Measurement Devices

The accelerometry measurement devices, developed to carry out the tests, are shown in Figure 4.
The overall system consisted of a transmitting device and a receiving device. The transmitting device measured the movements using an inertia measurement unit (accelerometer and gyroscope, type: MPU-6050). The measurements related to the three perpendicular axes (X, Y and Z) for movements. The data were sent wirelessly (by a wireless transceiver, type: nRF24L01) via a microcontroller board (type: Arduino) to the receiving device. On the receiving side, another transceiver (type: nRF24L01) received the accelerometry data and forwarded them to a laptop computer via a microcontroller board (type: Arduino). The computer then displayed the data and stored them for processing and analysis.

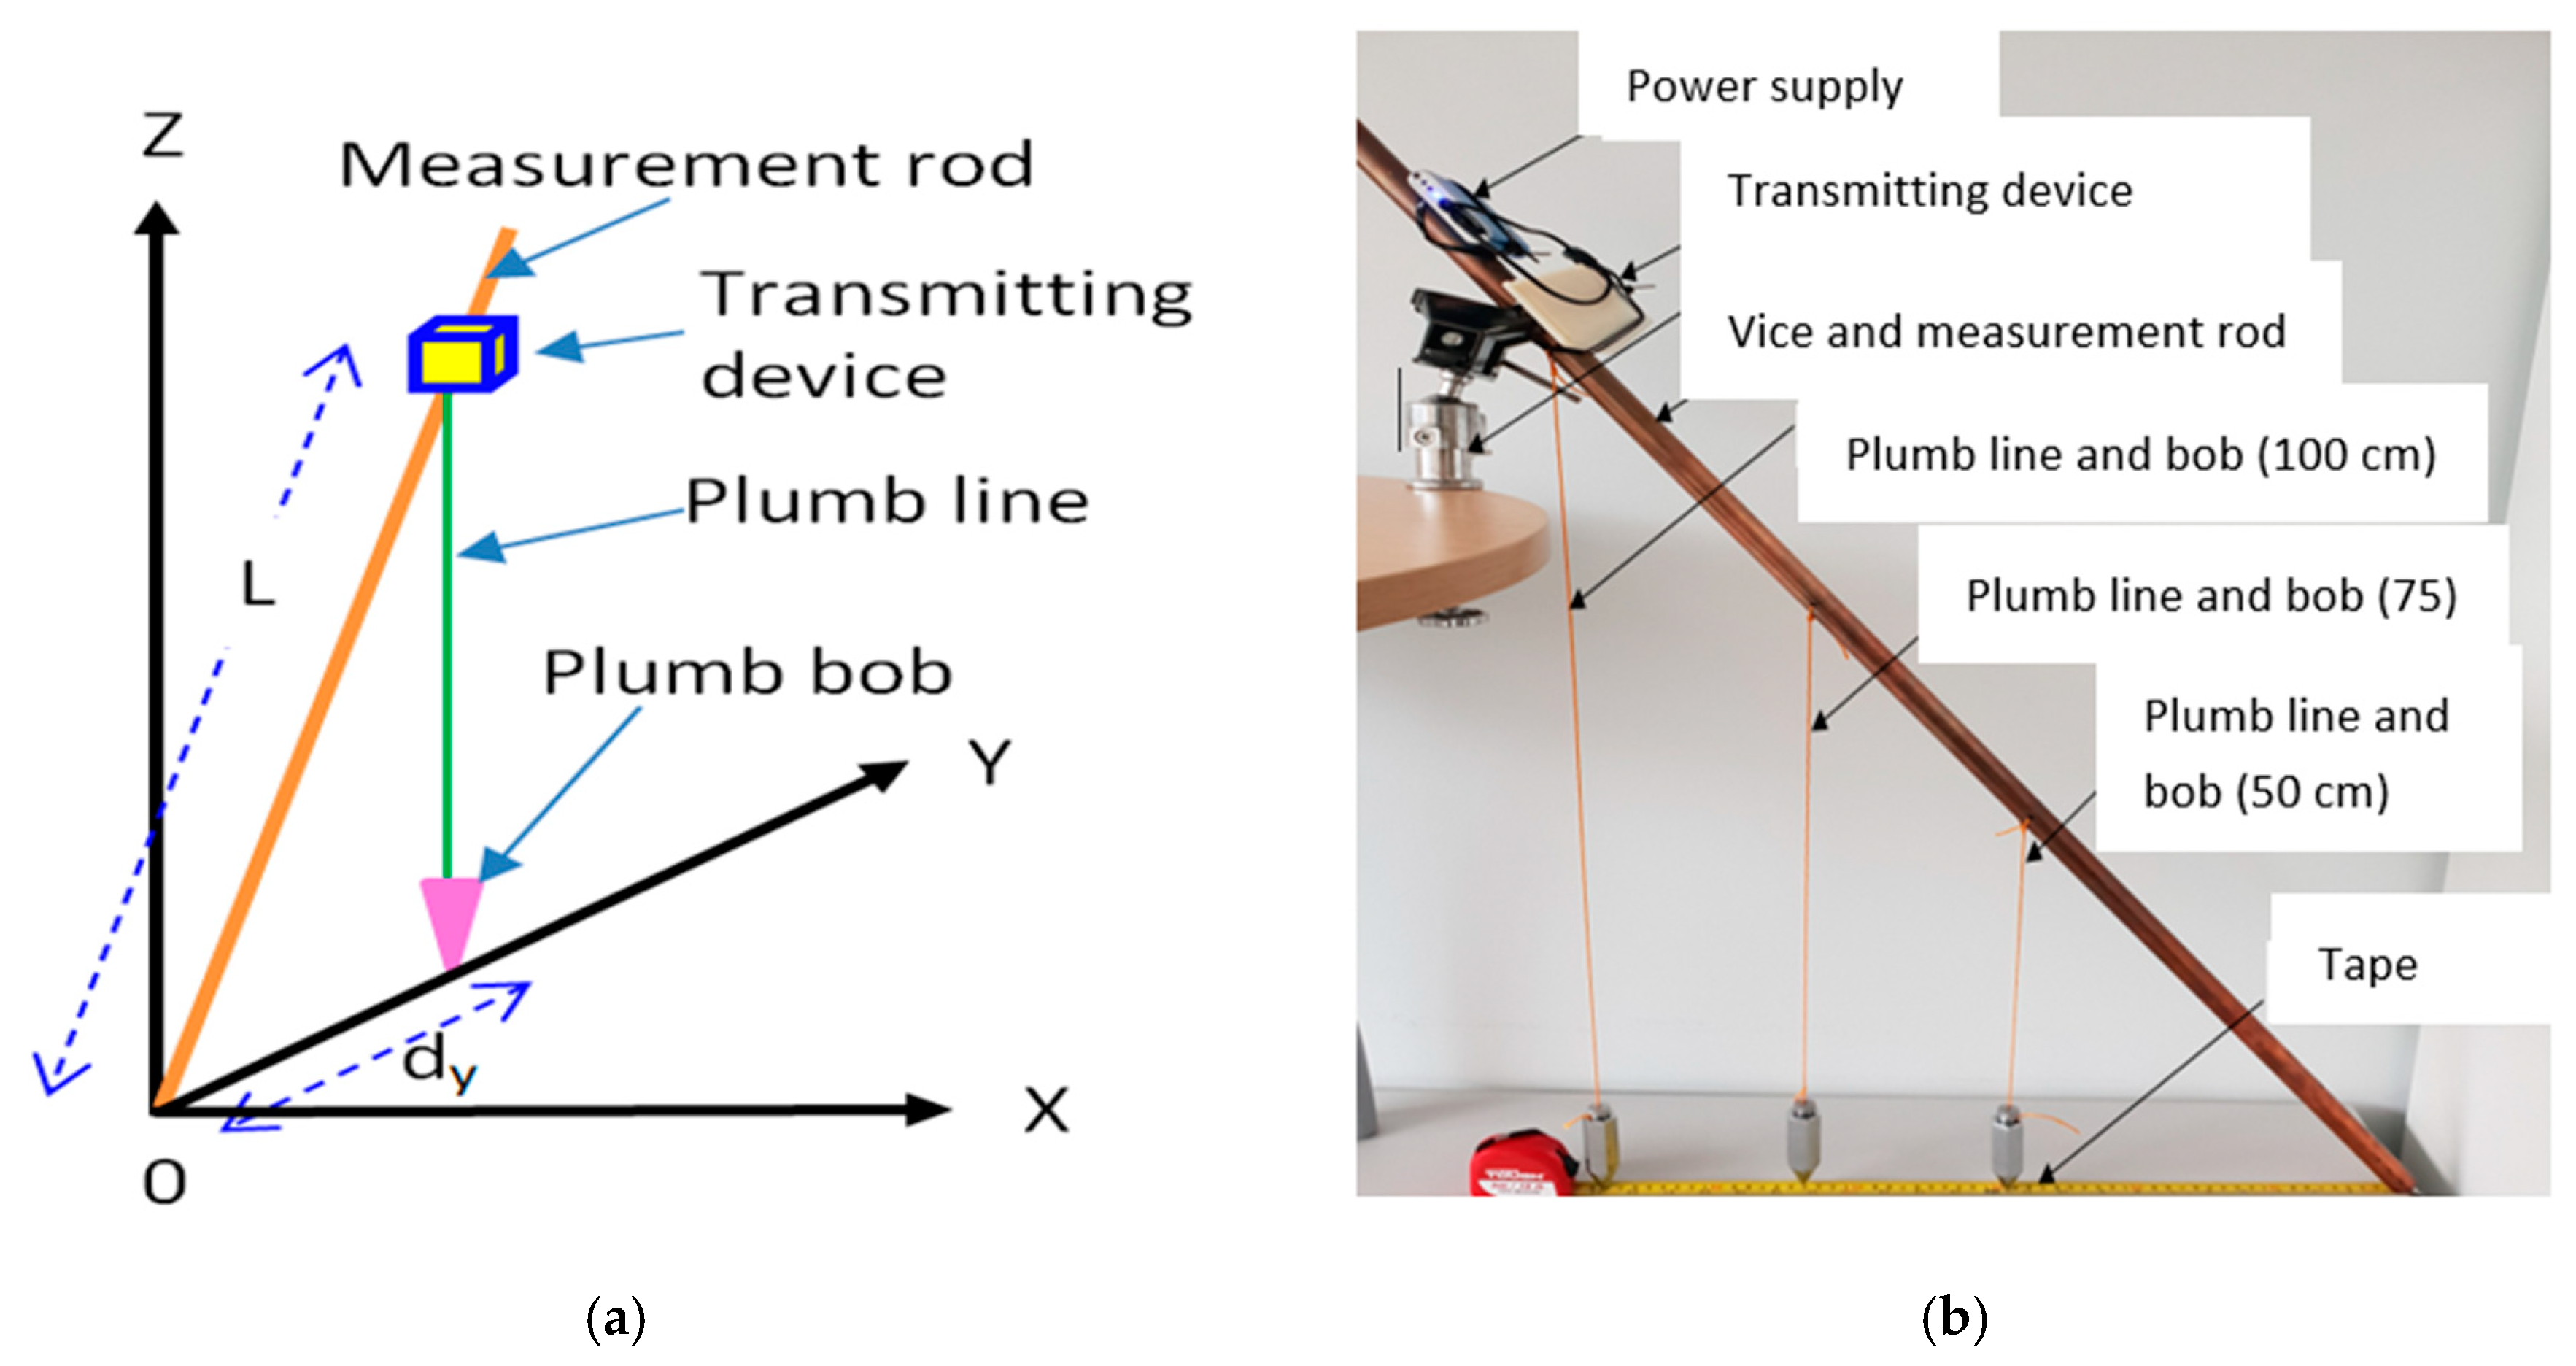
5. Measurement Apparatus
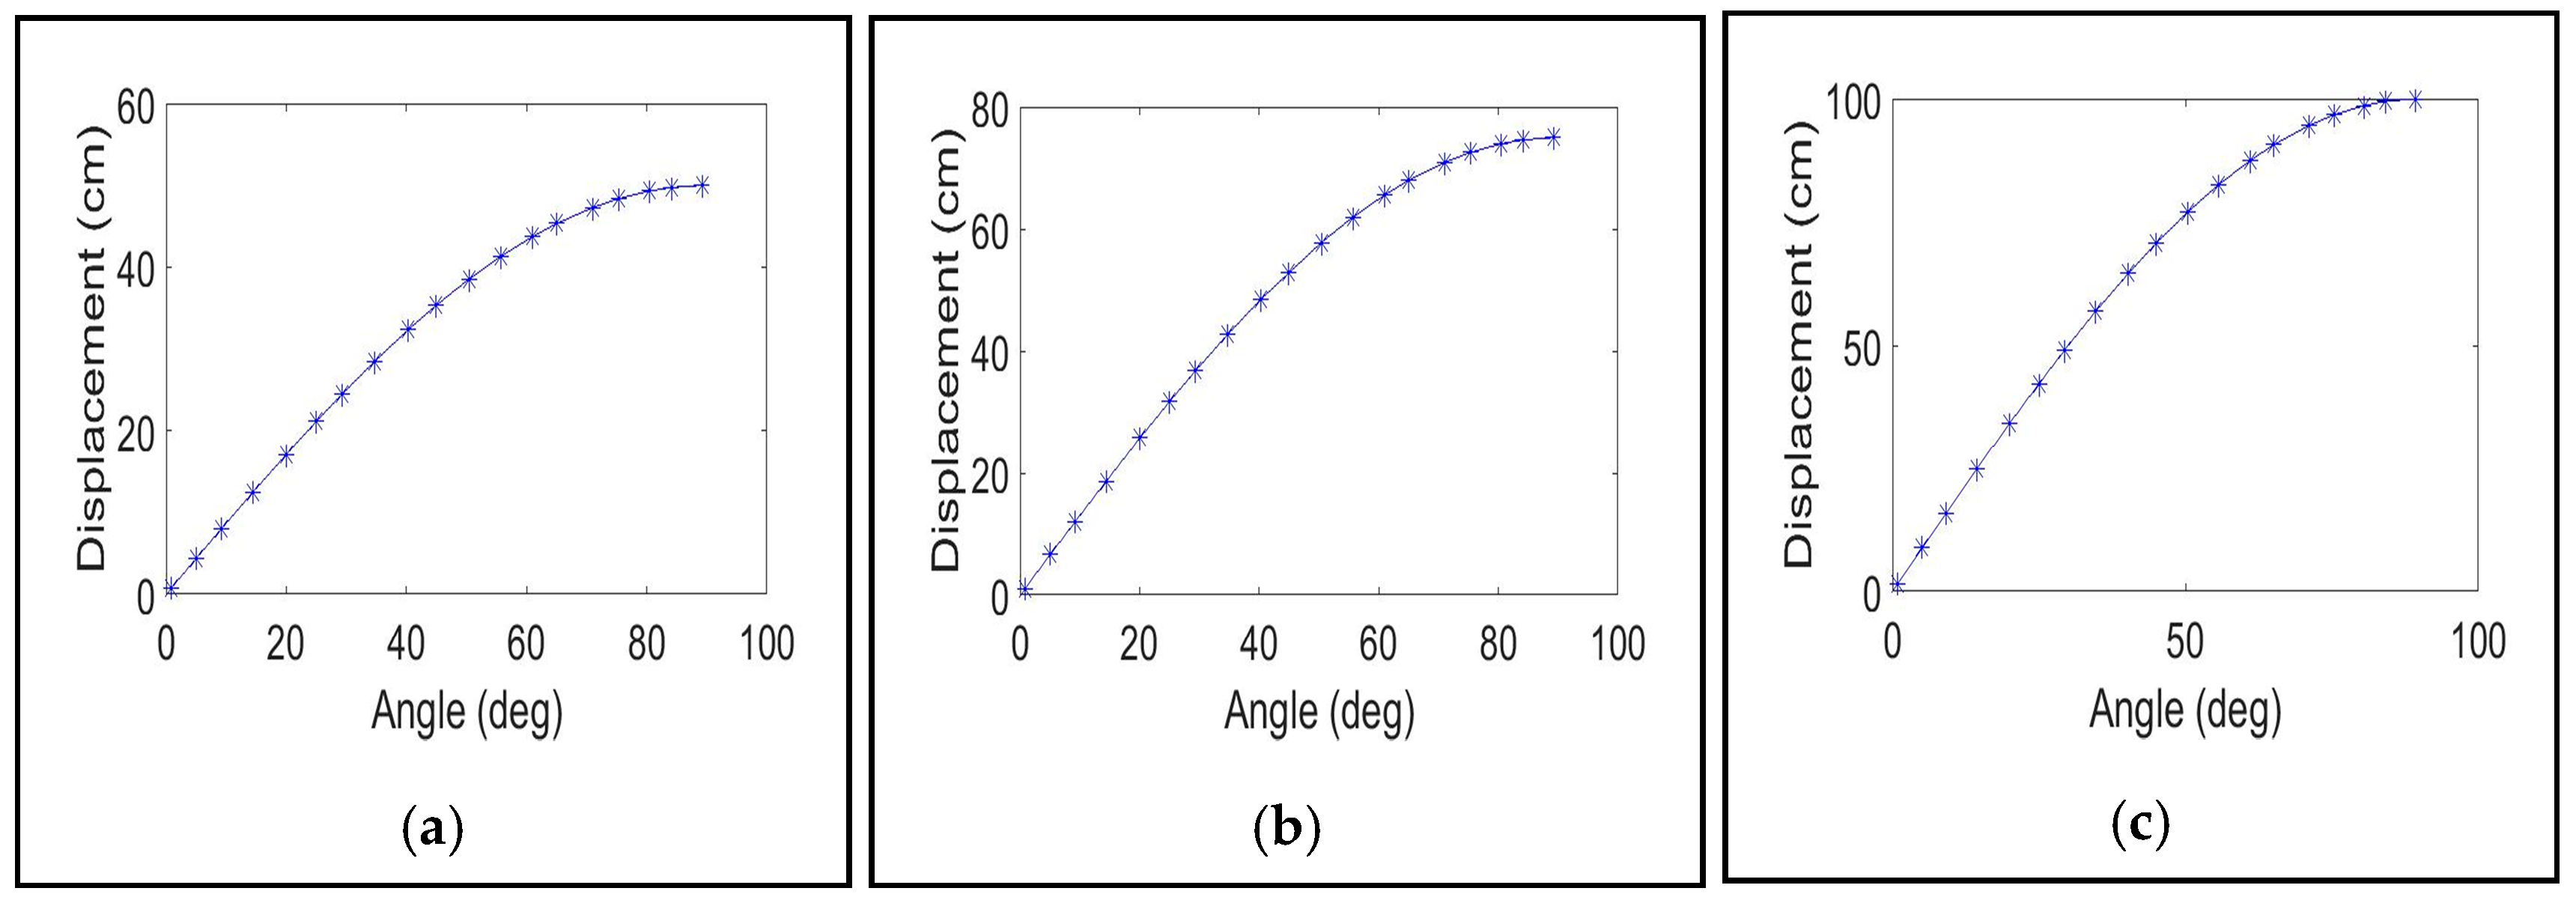
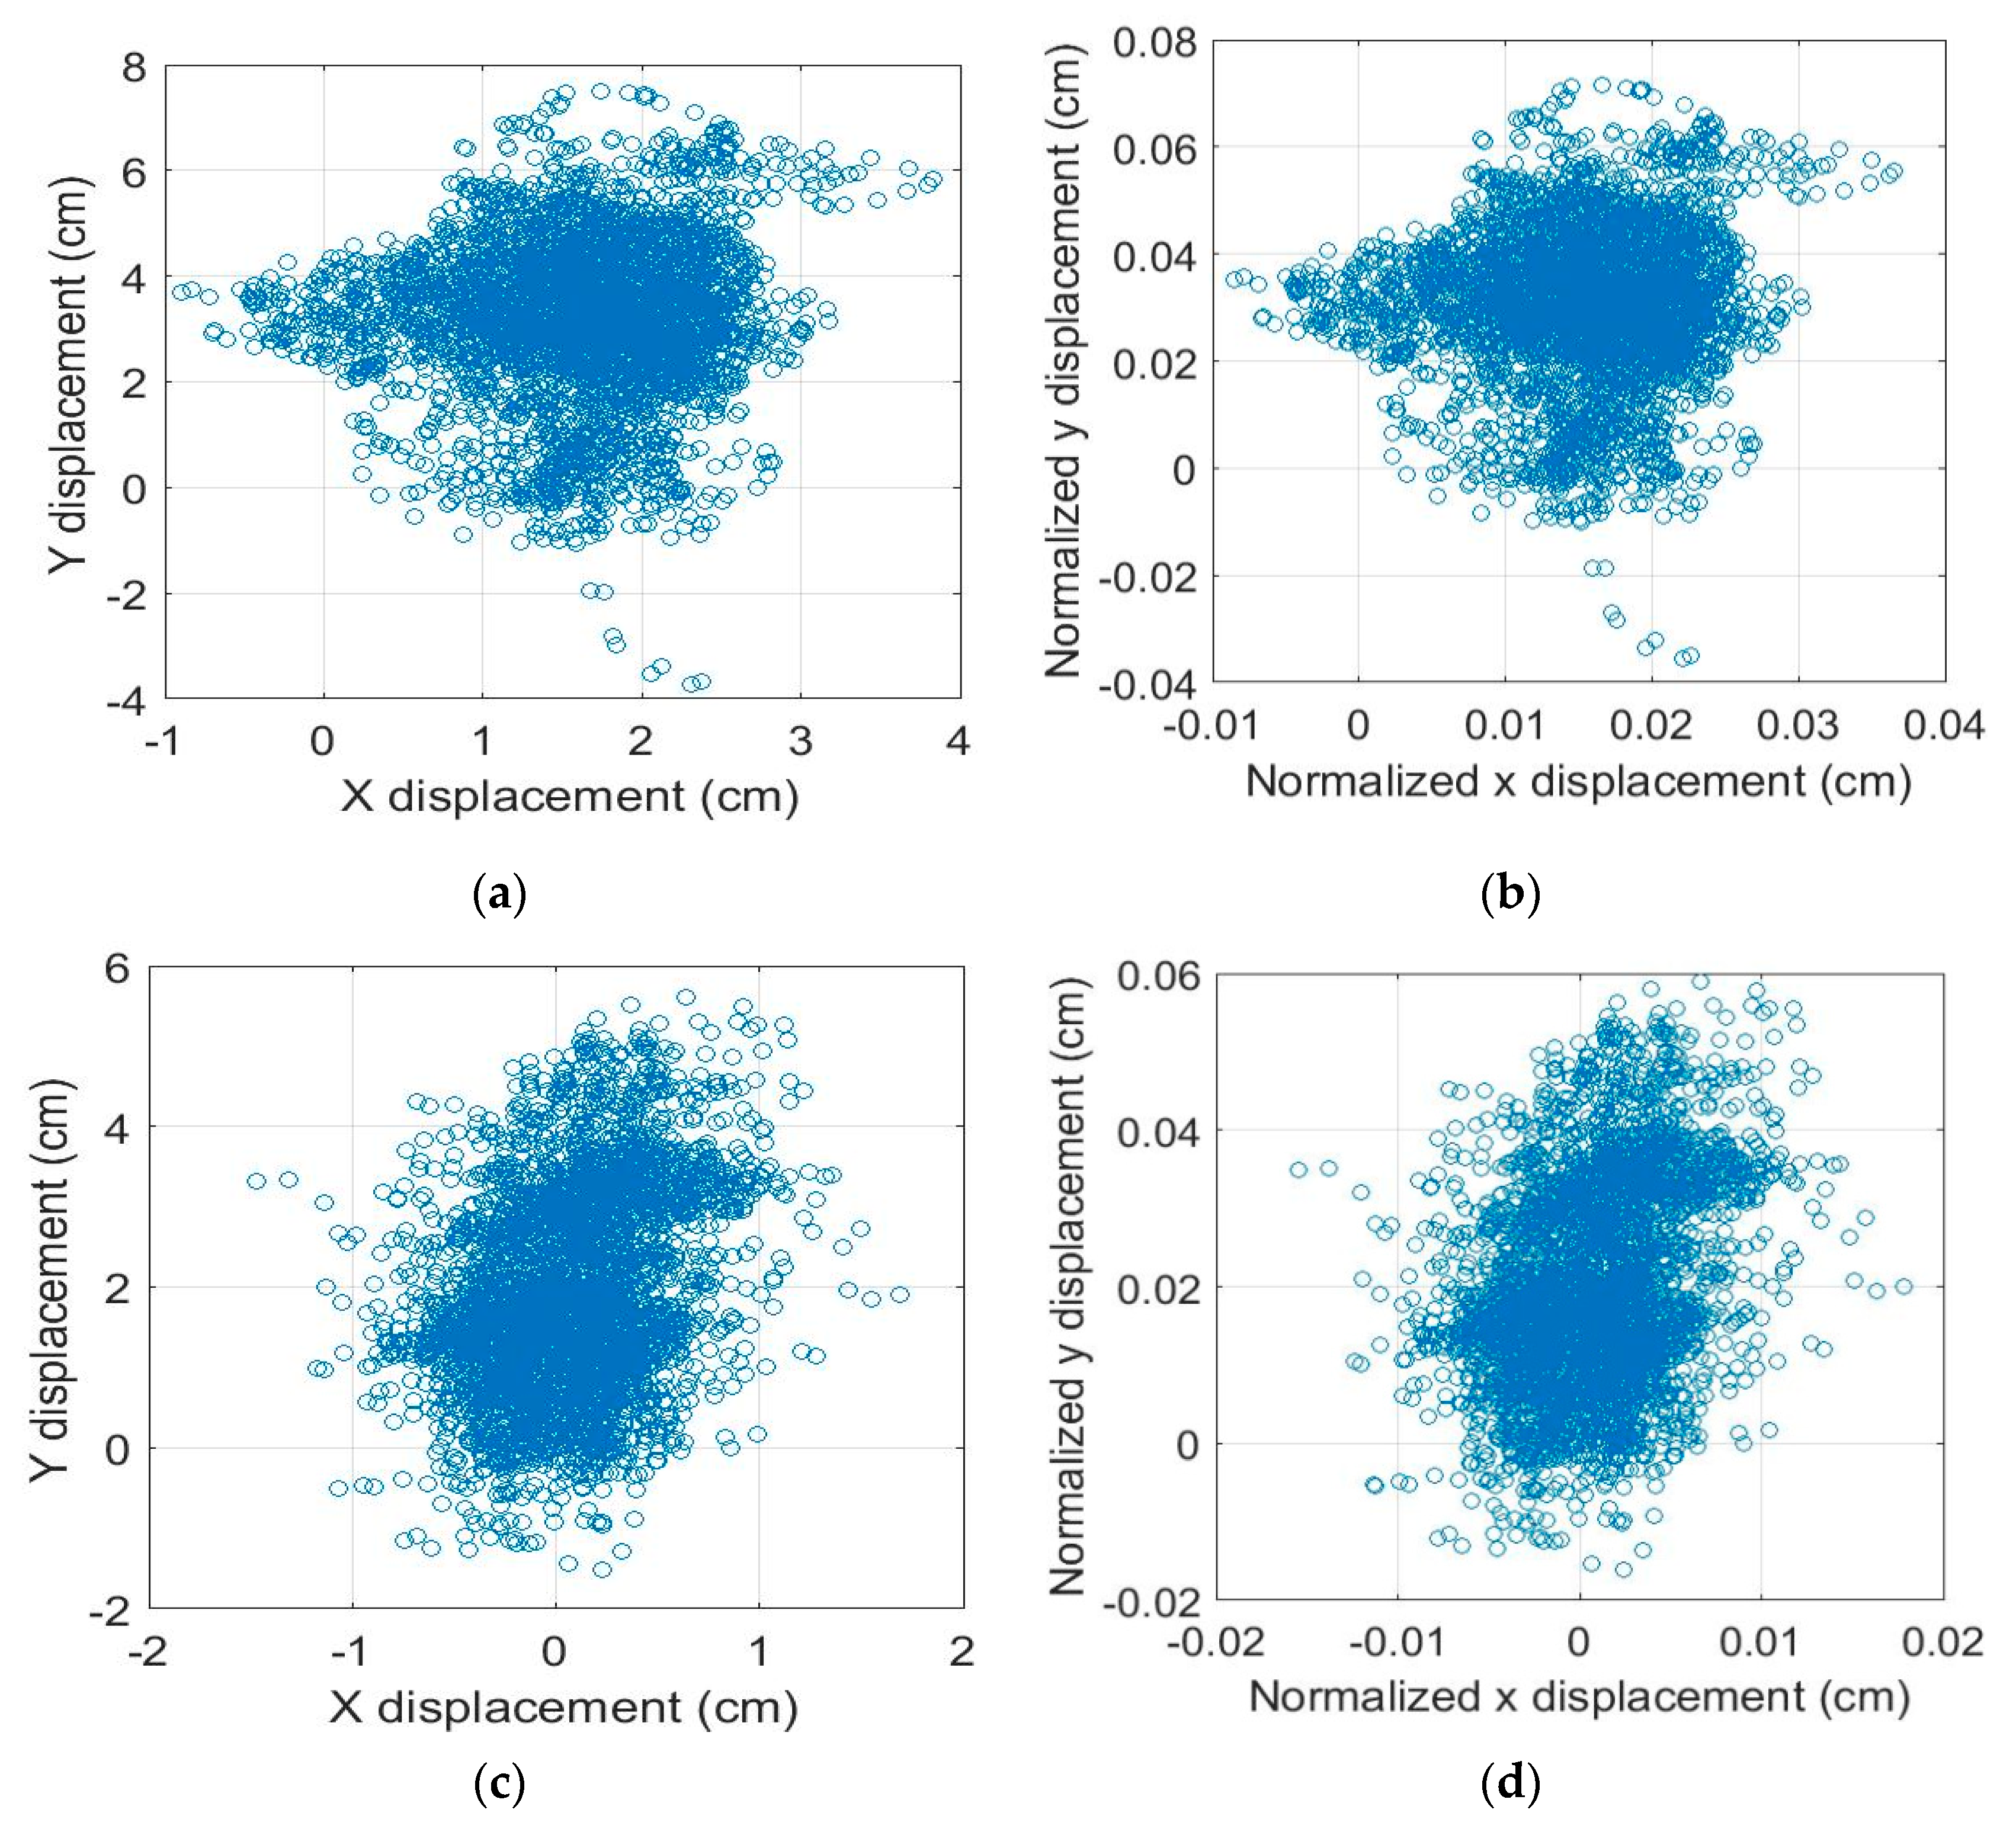
The apparatus used to carry out the measurements is shown in Figure 5.
The test apparatus consisted of a measurement metal rod with a length of 134 cm and diameter of 2 cm, the transmitting device (described in Section 4) attached to the rod at distance L = 100 cm from one end of the rod and three plumb lines–plumb bobs. The plumb lines–plumb bobs were attached to the measurement rod at: position 1 = 50 cm, position 2 = 75 cm and position 3 =100 cm, respectively, from one of its ends as shown in Figure 5. The measurement rod was held by a vice that allowed it to be inclined accurately in steps of 5 degrees from the vertical (inclination angle of 0 degree) to 90 degrees (horizontal to the ground) in the Y axis of the accelerometer. The inclination angle was determined manually with a protractor. For each angle, the position (dy) of each plumb bob from the origin (shown as 0 in Figure 5a) was measured manually using a tape measure. Simultaneously, the accelerometry data from the three axes of the accelerometer (X, Y and Z) were wirelessly transmitted to the receiving device (described in Section 4). The algebra described in Section 3 was used to determine accelerometry-based angles and ground projected displacements, and these were compared with the manual measurements.

Data Analysis

The data from the accelerometry device were lowpass filtered using a fourth order Butterworth filter with a cutoff frequency of 2 Hz to remove unwanted frequency components. The sample rate for data recording was 60 samples per second. The displacement in the Y-direction (dy) from the accelerometry data was determined using Equation (7) and averaged (dya) over the number of samples, N (i.e., measurement interval = 60 seconds × 60 samples per second = 3600 samples).
d y a = 1 N n = 1 N d y ( n )
The inclination angle in the Y-direction ( γ ) from the accelerometry was determined using Equation (2) and averaged ( γ a ) over the number of samples (N).
γ a = 1 N n = 1 N γ ( n )
Data analysis was performed in SPSS® statistical package. T-test, correlation and regression analysis were carried out to interpret the measurements.

6. Results and Discussion
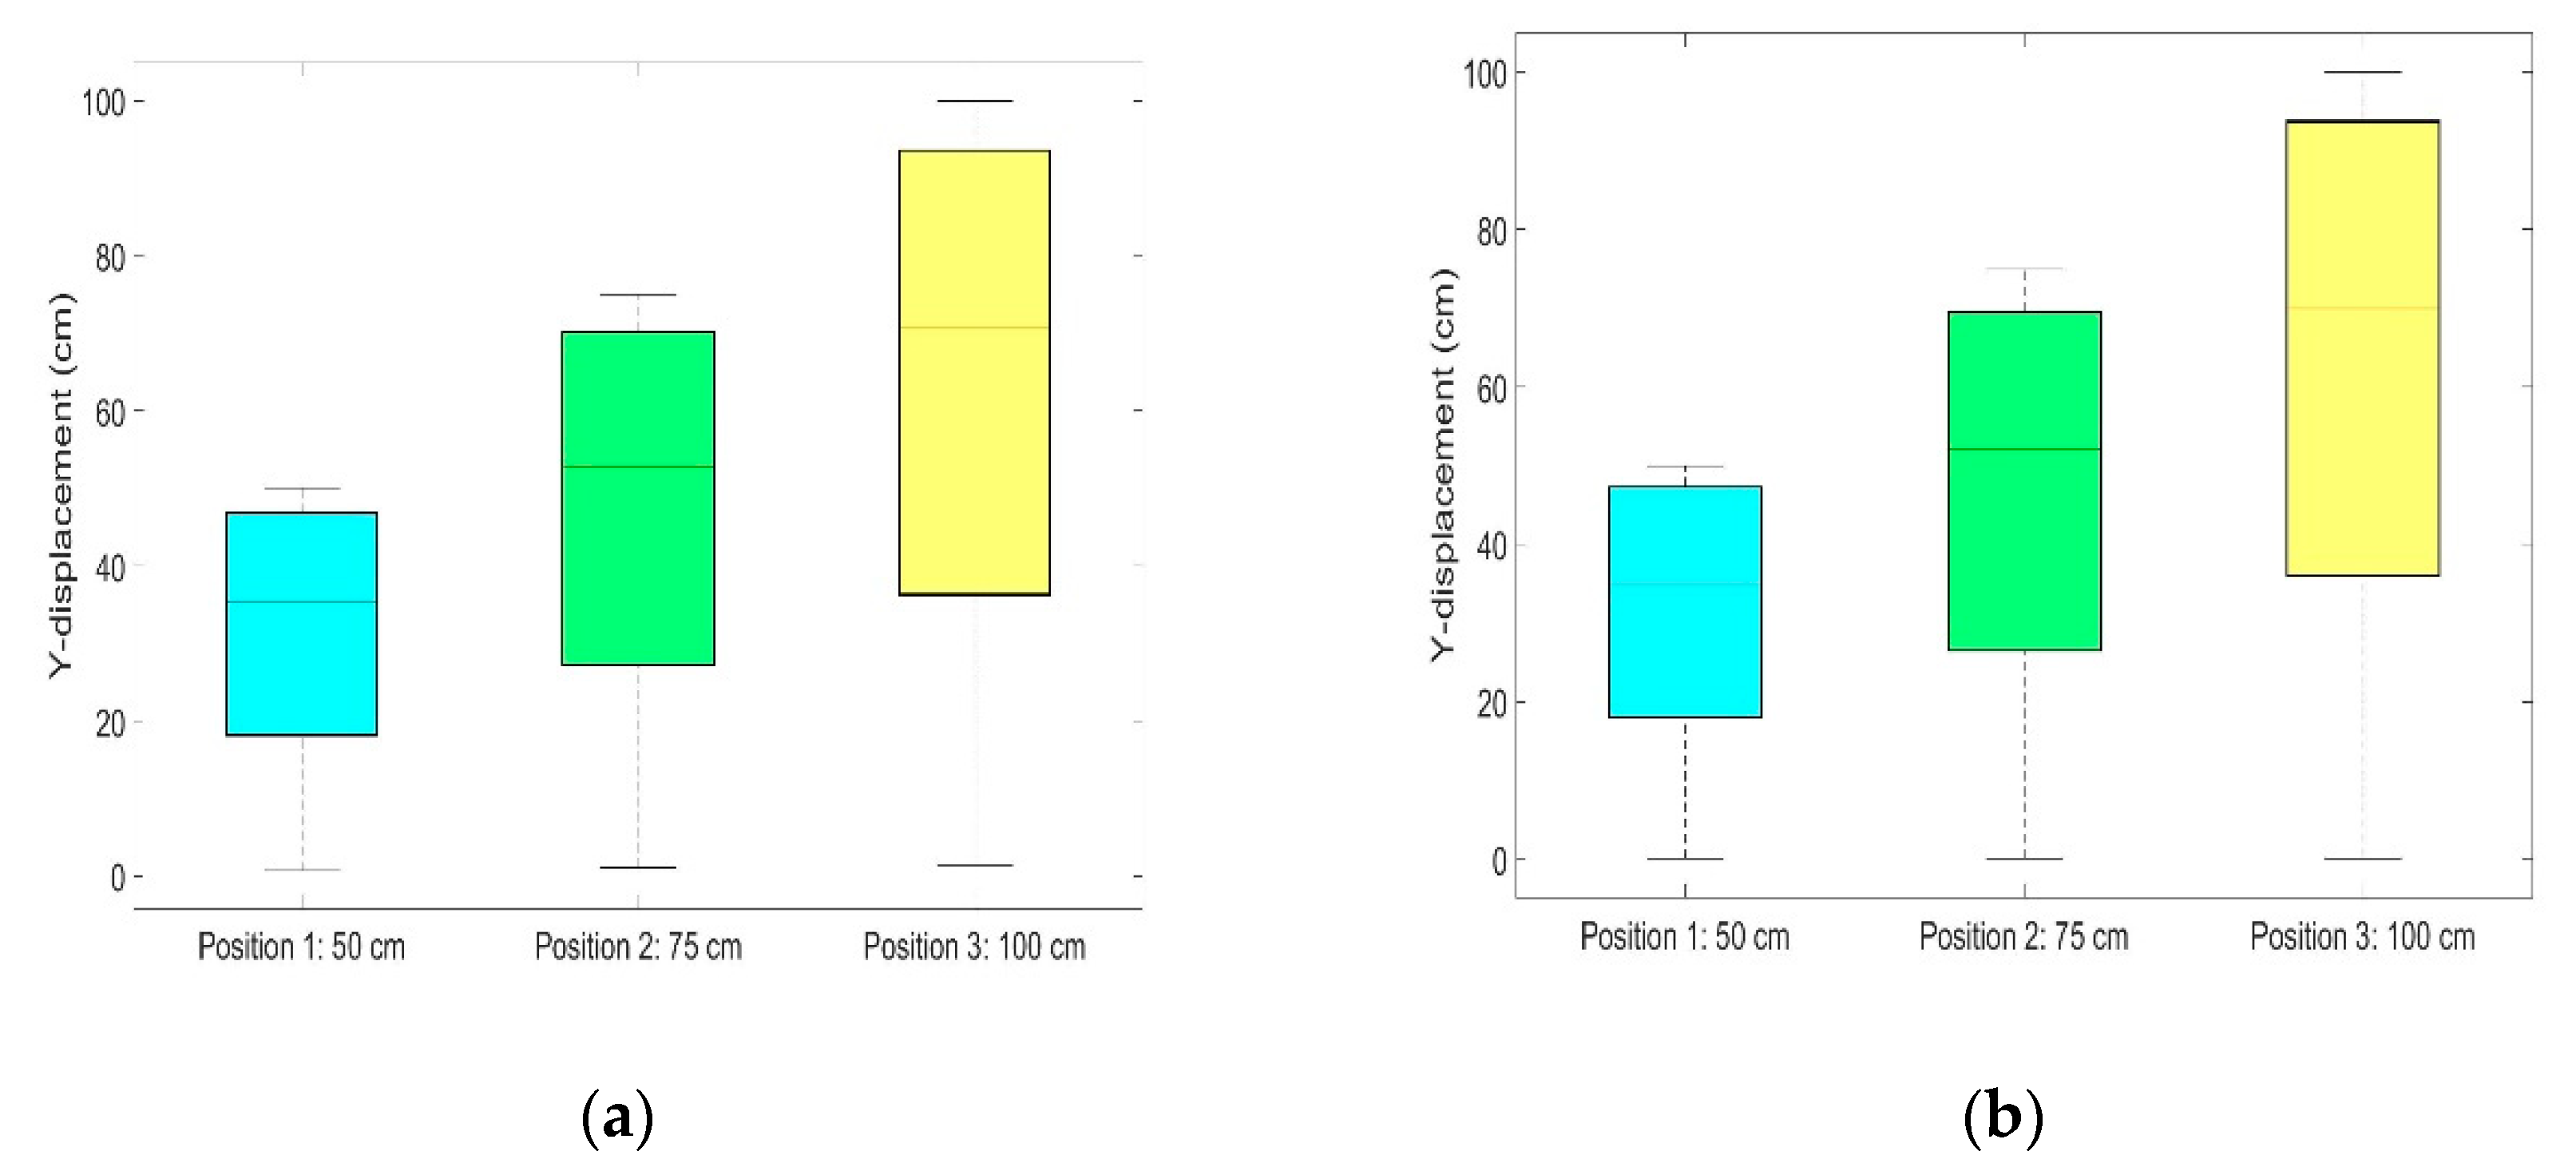
Nineteen measurements were obtained from the inclination angles of around 0 to 90 degrees in steps of around 5 degrees. The resulting manual and accelerometry measurements are provided in Table 1 and Table 2, respectively.
The displacements in Table 2 correspond to positions 1 (i.e., 50 cm), 2 (i.e., 75 cm) and 3 (i.e., 100 cm). They were determined using: d y = L cos ( β ) , cos ( β ) = a y A , d y = L a y A , respectively.
For the manual measurements, the means (M) and standard deviations (SD) for the positions were, position 1: M = 31.5 cm, SD = 16.6 cm, position 2, M = 46.9 cm, SD = 24.8 cm, position 3: M = 62.8 cm, SD = 33.3 cm. For the accelerometry-based measurements, the means and standard deviations were, position 1: M = 31.5 cm, SD = 16.7 cm, position 2: M = 47.2 cm, SD = 25.0 cm and position 3: M = 62.9 cm, SD = 33.3 cm. The accelerometry-based and manual measurements gave close readings for the three positions. The plots of the displacements against the angles for the accelerometry-based measurement of Table 2 are shown in Figure 6.

6.1. T-test

The Shapiro–Wilk test was used to establish whether the data of the three measurement positions were from a normal distribution (confidence interval CI = 95%). This indicated the data from each group were from a normal distribution (p > 0.05). In order to establish whether the displacements from the three positions (position 1 against 2, position 1 against 3 and position 2 against 3) were different, paired sample t-test with α = 0.01 was used. The results of the t-tests indicated that significant differences existed between the measurements for the three tests. When comparing the measurement positions (1 and 2, 1 and 3 and 2 and 3), probability values less than 0.01 (p < 0.01) were obtained. This indicated that the height of the COM can affect the measured postural sway displacement. This can have an implication when comparing the sway displacements across individuals of different COM heights.

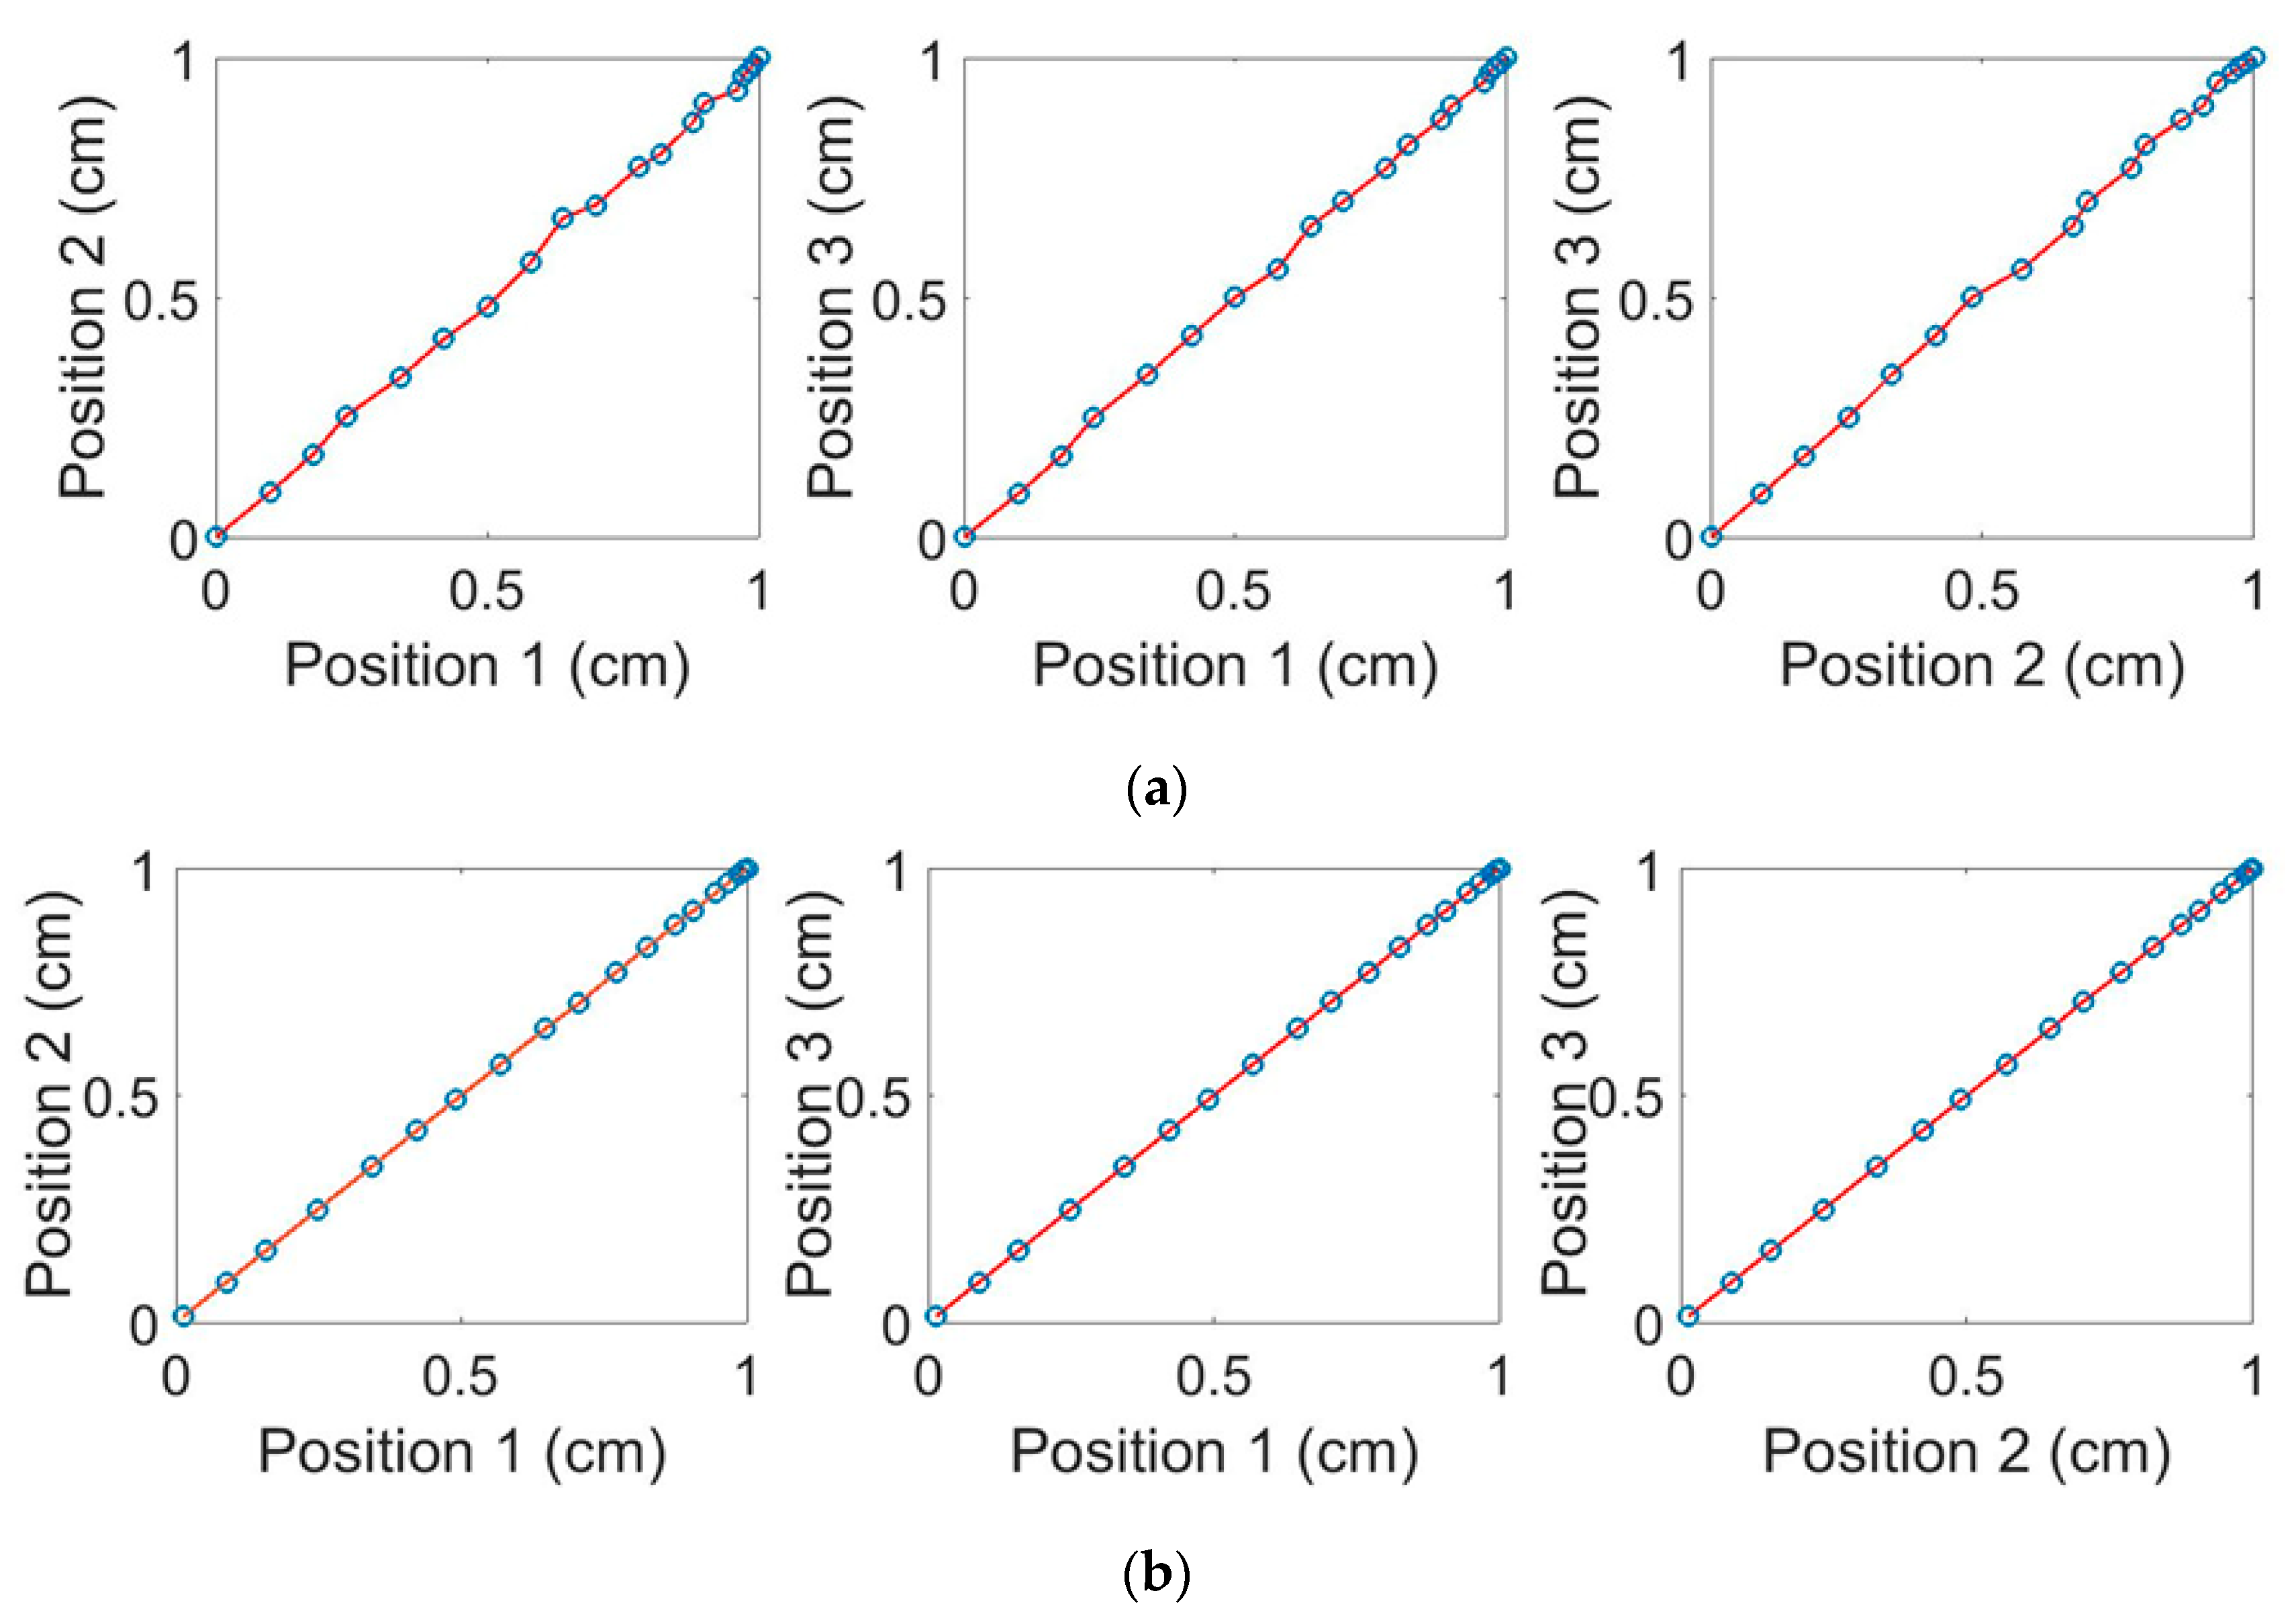
6.2. Correlation and Linear Regression Analysis

To test the relationship between the three positions for the manual and accelerometry measurements, Pearson's correlation with confidence interval 95% (α = 0.05) and linear regression were performed. For the manual measurements, there was a strong positive correlation between positions 1 and 2, r = 0.999; positions 1 and 3, r = 1.000; and positions 2 and 3, r = 1.000 (p ≤ 0.001). The relationships between the positions 1 and 2, 1 and 3 and 2 and 3 are shown in Figure 7. Similarly, for accelerometry measurement there was a strong positive correlation between positions 1 and 2, r = 1.000, positions 1 and 3, r = 1.000; and positions 2 and 3, r = 1.000 (p ≤ 0.001).
The respective gradients of the plots in Figure 7a were: 1.49, 2.00 and 1.34. For Figure 7b, the respective gradients were: 1.50, 2.00 and 1.33. The manual and accelerometry-based measurements had close gradients. The accelerometry-based results (Figure 7b) showed that the displacements value for position 2 could be obtained from displacements of position 1 using the formula: 1.5x-0.003 (x is the horizontal axis). Similarly, from the same figure, the gradient for positions 3 versus 1 was 2.00, and for positions 3 and 2, it was 1.33. For each plot, the gradient represented the ratio of COM heights, i.e., 75/50 = 1.50, 100/50 = 2.00 and 100/75 = 1.33. The implication for these results is that when performing sway analysis, a person with a higher COM would produce a greater sway ground projected displacement for the same angular movement. A difference of 25 cm between the COM for positions 1 and 2 resulted in a gradient of 1.5, and a difference of 50 cm between the COM for position 1 and 3 resulted in a gradient of 2.0. Similarly, a difference of 25 cm between the COM for positions 2 and 3 resulted in a gradient of 1.33. This issue could introduce a bias that may affect interpretation of sway path measurements. As such, a taller subject produces a larger ground project sway displacement than a shorter person.
The box plots in Figure 8 further illustrate the relationships between the measurements associated with positions 1, 2 and 3 for both the manual and accelerometry-based measurement methods. These indicated the statistics for the measurement, e.g., median (horizontal bar inside each box) and interquartile range increased as the COM height increased.
In order to deal with the bias introduced by the COM height, the measurements could be normalized by setting the COM height to unity for all subjects. This concept is illustrated in Figure 9, where the plots of Figure 7 were normalized by setting the value of L in Equation (5) to unity for all positions. In these plots, similar displacement was produced by all three positions for a given angular inclination.
Figure 10 shows accelerometry-based sway plots from two healthy adult subjects in a standing still test on a foam surface with eyes closed (this is one of the tests associated with the Modified Clinical Test for Sensory Interaction of Balance [16]). The device containing the accelerometer was worn at lower back region at the level of the iliac crest. The plots show the ground projected displacements in the X and Y directions. For the plots in Figure 10a,b, the COM height of the subject was 105 cm and for the plots in Figure 10c,d, the COM height was 95 cm. Figure 10a,c was obtained from when the actual COM heights (L) were used in the formulae described in Section 3 and for the plots in Figure 10b,d, L was set to 1. The magnitudes of displacements shown in normalized plots of Figure 10b,d were comparable, while for those in Figure 10a,c, their relative displacements may not be comparable owing to the bias introduced by their respective COM positions.
In this study, we compared the COM based on a fixed angle. In humans, the COM could affect the angle of inclination due to its position as taller subjects may sway more naturally, and also, it affects the projected sway on the ground. The COM height can therefore be suggested to have a nonlinear double effect (i.e., component is present in both the sway angle and magnitude) on ground projected sway and normalization reduces this effect for comparison. Thus, maintaining upright standing control is not reliant solely on the integration of the somatosensory, visual and vestibular, but also taking into consideration the COM height of the subject.

7. Conclusions

The study investigated the effect of center of mass (COM) height on accelerometry-based postural sway analysis. For this purpose, an apparatus was devised that allowed the ground projected displacement and its associated sway angle to be measured both manually and by accelerometry. It was observed that for different inclination angles, the projected displacements on the ground surface were related to the height of the COM, i.e., a higher COM resulted in a larger projected sway displacement. This could affect the interpretation of accelerometry data for balance analysis when a comparison displacement is needed across subjects with different COM heights. A method that normalized COM height was found useful in dealing with this effect. Associated results from the test apparatus, and two healthy adult subjects were used to demonstrate these issues. However, care must be taking when analyzing subjects of differing COM, as the COM position affects both magnitude and angular sway.

Author Contributions

Conceptualization, methodology and formal analysis by O.O.D.O. and R.S. Writing by O.O.D.O. and R.S., with contributions by M.S. All authors have read and agreed to the published version of the manuscript.

Funding

This research received no external funding.

Conflicts of Interest

The authors declare no conflict of interest.

References

  1. Winter, D.; Patla, A.; Prince, F.; Ishac, M.; Gielo-Perczak, K. Stiffness control of balance in quiet standing. J. Neurophysiol. 1998, 80, 1211–1221. [Google Scholar] [CrossRef] [PubMed] [Green Version]
  2. Lafond, D.; Duarte, M.; Prince, F. Comparison of three methods to estimate the center of mass during balance assessment. J. Biomech. 2004, 37, 1421–1426. [Google Scholar] [CrossRef]
  3. Rosker, J.; Markovic, G.; Sarabon, N. Effects of vertical center of mass redistribution on body sway parameters during quiet standing. Gait Posture 2011, 33, 452–456. [Google Scholar] [CrossRef] [PubMed]
  4. Shumway-Cook, A.; Horak, F. Assessing the influence of sensory interaction on balance. Phys. Ther. 1986, 66, 1548–1550. [Google Scholar] [CrossRef] [PubMed]
  5. Corriveau, H.; Hébert, R.; Prince, F.; Raîche, M. Postural control in the elderly: An analysis of test-retest and interrater reliability of the COP-COM variable. Arch. Phys. Med. Rehabil. 2001, 82, 80–85. [Google Scholar] [CrossRef] [PubMed]
  6. Hasan, S.; Robin, D.; Szurkus, D.; Ashmead, D.; Peterson, S.; Shiavi, R. Simultaneous measurement of body center of pressure and center of gravity during upright stance. Part I: Methods. Gait Posture 1996, 4, 1–10. [Google Scholar] [CrossRef]
  7. Hasan, S.; Robin, D.; Szurkus, D.; Ashmead, D.; Peterson, S.; Shiavi, R. Simultaneous measurement of body center of pressure and center of gravity during upright stance. Part II: Amplitude and frequency data. Gait Posture 1996, 4, 11–20. [Google Scholar] [CrossRef]
  8. Błaszczyk, J.W.; Beck, M.; Sadowska, D. Assessment of postural stability in young healthy subjects based on directional features of posturographic data: vision and gender effects. Acta Neurobiol. Exp. (Warsaw) 2014, 74, 433–442. [Google Scholar]
  9. Błaszczyk, J.W. The use of sway vector for the assessment of postural instability. Gait Posture 2016, 44, 1–6. [Google Scholar] [CrossRef]
  10. Kavanagh, J.; Menz, H. Accelerometry: A technique for quantifying movement patterns during walking. Gait Posture 2008, 28, 1–15. [Google Scholar] [CrossRef]
  11. Yang, C.; Hsu, Y. A Review of Accelerometry-Based wearable motion detectors for physical activity monitoring. Sensors 2010, 10, 7772–7788. [Google Scholar] [CrossRef] [PubMed]
  12. Mathie, M.; Coster, A.; Lovell, N.; Celler, B. Accelerometry: providing an integrated, practical method for long-term, ambulatory monitoring of human movement. Physiol. Meas. 2004, 25, R1–R20. [Google Scholar] [CrossRef] [PubMed] [Green Version]
  13. Oshima, Y.; Kawaguchi, K.; Tanaka, S.; Ohkawara, K.; Hikihara, Y.; Ishikawa-Takata, K.; Tabata, I. Classifying household and locomotive activities using a triaxial accelerometer. Gait Posture 2010, 31, 370–374. [Google Scholar] [CrossRef] [PubMed]
  14. Khan, A.; Hammerla, N.; Mellor, S.; Plötz, T. Optimising sampling rates for accelerometer-based human activity recognition. Pattern Recognit. Lett. 2016, 73, 33–40. [Google Scholar] [CrossRef]
  15. Chien, J.C.; Hirakawa, K.; Shieh, J.; Guo, H.W.; Hsieh, Y. A simple method for walking posture analysis using accelerometers. In Proceedings of the 2016 International Conference on Communication Problem-Solving (ICCP), Taipei, Taiwan, 7–9 September 2016; pp. 1–3. [Google Scholar]
  16. Cohen, H.; Blatchly, C.A.; Gombash, L.L. A study of clinical test of sensory interaction and balance. Phys. Ther. 1993, 73, 346–351. [Google Scholar] [CrossRef]
  17. Martínez-Ramírez, A.; Lecumberri, P.; Gómez, M.; Rodriguez-Mañas, L.; García, F.; Izquierdo, M. Frailty assessment based on wavelet analysis during quiet standing balance test. J. Biomech. 2011, 44, 2213–2220. [Google Scholar] [CrossRef]
  18. Mancini, M.; Salarian, A.; Carlson-Kuhta, P.; Zampieri, C.; King, L.; Chiari, L.; Horak, F. ISway: a sensitive, valid and reliable measure of postural control. J. Neuroeng. Rehabil. 2012, 9, 1–8. [Google Scholar] [CrossRef] [Green Version]
  19. Spain, R.; St George, R.; Salarian, A.; Mancini, M.; Wagner, J.; Horak, F.; Bourdette, D. Body-worn motion sensors detect balance and gait deficits in people with multiple sclerosis who have normal walking speed. Gait Posture 2012, 35, 573–578. [Google Scholar] [CrossRef] [Green Version]
  20. Gago, M.; Fernandes, V.; Ferreira, J.; Silva, H.; Rocha, L.; Bicho, E.; Sousa, N. Postural stability analysis with inertial measurement units in Alzheimer's disease. Dement. Geriatr. Cogn. Disord. Extra 2014, 4, 22–30. [Google Scholar] [CrossRef] [Green Version]
  21. Goldring, D.; Londe, S.; Sivakoff, M.; Hernandez, A.; Britton, C.; Choi, S. Blood pressure in a high school population. J. Pediatrics 1977, 91, 884–889. [Google Scholar] [CrossRef]
  22. Alberts, J.; Hirsch, J.; Koop, M.; Schindler, D.; Kana, D.; Linder, S.; Campbell, S.; Thota, A. Using accelerometer and gyroscopic measures to quantify postural stability. J. Athl. Train. 2015, 50, 578–588. [Google Scholar] [CrossRef] [PubMed] [Green Version]
  23. Hiiragi, Y. Evaluation of postural sway using a triaxial accelerometer. Rigakuryoho Kagaku 2004, 19, 305–309. [Google Scholar] [CrossRef] [Green Version]
  24. Marvel, C.A. quantitative measure of postural sway deficits in schizophrenia. Schizophr. Res. 2004, 68, 363–372. [Google Scholar] [CrossRef] [PubMed]
  25. Mayagoitia, R.; Lötters, J.; Veltink, P.; Hermens, H. Standing balance evaluation using a triaxial accelerometer. Gait Posture 2002, 16, 55–59. [Google Scholar] [CrossRef]
  26. Najafi, B.; Lee-Eng, J.; Wrobel, J.S.; Goebel, R. Estimation of center of mass trajectory using wearable sensors during golf swing. J. Sports Sci. Med. 2015, 14, 354–363. [Google Scholar]
Figure 1. Tracing of the trajectory of the accelerometer on ground [25].
Technologies 08 00020 g001
Figure 2. Sway path projection based on inverted pendulum.
Technologies 08 00020 g002
Figure 3. Displacements on ground using the resultant method.
Technologies 08 00020 g003
Figure 4. Accelerometry devices used for the tests.
Technologies 08 00020 g004
Figure 5. Test measurement apparatus (a) schematic diagram with only one of the three plumb bobs shown; (b) actual apparatus.
Technologies 08 00020 g005
Figure 6. Relationship between the displacements and angles from the accelerometry device (a) COM = 50 cm (b) COM = 75 cm (c) COM = 100 cm.
Technologies 08 00020 g006
Figure 7. Analysis of the three positions (a) manual and (b) accelerometry.
Technologies 08 00020 g007
Figure 8. Box plots for (a) manual, (b) accelerometry-based measurements.
Technologies 08 00020 g008
Figure 9. Normalized displacements (a) manual and (b) accelerometry.
Technologies 08 00020 g009
Figure 10. Accelerometry-based sway plots from two healthy adult subjects standing on a foam surface with eyes closed. (a) The actual COM height value was used in determining the displacements, (b) COM height was set to 1 to produce a normalized sway displacement plot. (c,d) are as figures (a,b), but for the second subject.
Technologies 08 00020 g010
Table 1. Manual measurements.
Measurement NumberAngle γ (Degrees)Position 1 (Displacements at COM = 50 cm)Position 2 (Displacement at COM = 75 cm)Position 3 (Displacement at COM = 100 cm)
10000
25579
31091317
415121925
520172534
625213142
730253650
835294356
940325065
1045355270
1150395877
1255416082
1360446587
1465456890
1570487095
1675487297
1780497398
1885497499
19905075100
Mean = 31.5 cm
Standard deviation = 16.6 cm
Mean = 46.9 cm
Standard deviation = 24.8 cm
Mean = 62.8 cm
Standard deviation = 33.3 cm
Table 2. Accelerometry measurements.
Measurement NumberAngle γ (Degrees)Position 1 (Displacements at COM = 50 cm)Position 2 (Displacement at COM = 75 cm)Position 3 (Displacement at COM = 100 cm)
10.800.691.041.39
25.094.446.668.87
39.127.9311.8915.85
414.4212.4518.6824.90
520.0517.1425.7234.29
625.0121.1431.7242.28
729.3524.5136.7649.02
834.6628.4442.6556.87
940.2732.3248.4764.63
1044.9635.3352.7870.66
1150.3938.5257.7877.05
1255.6541.2861.9282.57
1361.0243.7465.6187.48
1465.0645.3468.0190.68
1571.0247.2870.9294.56
1675.3348.3772.5596.74
1780.4849.3173.9798.62
1884.1749.7474.6199.48
1989.2850.0074.9999.99
Statistics Mean = 31.5 cm
Standard deviation = 16. 7 cm
Mean = 47.2 cm
Standard deviation = 25.0 cm
Mean = 62.9 cm
Standard deviation = 33.3 cm

