Abstract
The uncertainties present in a variety of electromagnetic (EM) problems may have important effects on the output parameters of interest. Unfortunately, deterministic schemes are not applicable in such cases, as they only utilize the nominal value of each random variable. In this work, a two-dimensional (2D) finite-difference time-domain (FDTD) algorithm is presented, which is suitable for assessing randomness in the electrical properties, as well as in the dimensions of orthogonal objects. The proposed technique is based on the stochastic FDTD method and manages to extract the mean and the standard deviation of the involved field quantities in one realization. This approach is applied to three test cases, where uncertainty exists in the electrical and geometrical parameters of various materials. The numerical results demonstrate the validity of our scheme, as similar outcomes are extracted compared to the Monte Carlo (MC) algorithm.
1. Introduction
Wave propagation in a material with random electric and geometric properties may introduce uncertainty in the involved field quantities. For example, the variability present in biologic tissues [1,2] may have a non-trivial effect on the absorbed radio wave power. Consequently, a reliable assessment of such randomness is an essential step, since neglecting the latter may increase the risk of misinterpretation of the simulated outcomes. Unfortunately, deterministic analysis is not suitable in those cases, as it only takes into account the nominal values of each random variable. For this reason, several methods exist in the literature for solving stochastic electromagnetic (EM) problems.
The most common technique for uncertainty assessment is the Monte Carlo (MC) algorithm [3]. Particularly, this approach performs a high number of sample realizations, each time selecting a different value of each random input. Then, the extracted data are post-processed for the computation of the statistical moments of the examined outputs. However, a major disadvantage of this scheme is the slow rate of convergence , with N denoting the number of samples. As a result, this method requires elongated computational times for solving complex EM problems, thus rendering it impractical in such scenarios.
An alternative surrogate is the generalized polynomial chaos (PC) [4], which has been applied in a variety of uncertainty problems. Specifically, this technique is based on the orthogonal expansion of a second-order random process and can be more efficient than the MC algorithm, for cases with a low number of random variables. Unfortunately, the PC scheme suffers from the ‘curse of dimensionality‘, which means that the computational cost of this approach increases exponentially with the number of stochastic inputs or with the order of the expansion.
A more recent scheme combines the finite-difference time-domain (FDTD) algorithm with the Delta method [5], aiming at speeding up the stochastic analysis of random media problems. The proposed technique is named stochastic FDTD (S-FDTD) and manages to compute the mean and the standard deviation of the field components in one simulation. Therefore, the S-FDTD algorithm can be less computationally demanding than both the MC and the PC approaches. However, the accuracy of this scheme depends on correlation coefficient values, which appear in the updated equations.
In our work, we introduce an extension of the S-FDTD technique, which is able to assess random media, as well as uncertainties in the dimensions of rectangular dielectrics. The proposed technique enhances the work in [6] by additionally taking into consideration the uncertainties present in the conductivity of the random medium. The validation of our algorithm is performed via three two-dimensional (2D) stochastic EM problems. Numerical results prove the effectiveness of our approach, and comparisons with the MC method show that satisfactory outcomes can be extracted with a lower computational cost.
2. Literature Review of Related Works
The S-FDTD technique has been utilized in a variety of random media uncertainty scenarios. For example, the works in [1,5] introduced the mathematical background of this scheme and applied it in one dimensional (1D) biolectromagnetic problems. Moreover, the authors in [7] presented an extension of the S-FDTD algorithm, which is able to assess uncertainties caused by the electron and the ion content of the atmosphere. Their numerical outcomes indicated a significant efficiency enhancement compared to the MC technique, thus proving that the proposed method can be a good alternative for EM ionospheric propagation studies. A variation of the S-FDTD technique for assessing uncertainties in cold plasma medium is examined in [8]. The suggested approach is based on the bilinear transform technique and has been successfully tested in 1D, 2D, and three-dimensional (3D) cases.
The work in [9] introduced a novel S-FDTD scheme, which is free from time-step stability restrictions. This method utilizes the locally one-dimensional approach (hence named S-LOD-FDTD) and is useful for cases with dense grids. Numerical outcomes in 1D transmission-line examples indicate that reliable results can be extracted more efficiently than with the MC or the traditional S-FDTD algorithms. A further extension of the S-LOD FDTD technique to 2D EM uncertainty problems was presented in [10]. Larger computational time-steps render the proposed scheme faster than the MC and the S-FDTD approaches, in this case as well. The S-FDTD algorithm has also been combined with the alternating-direction implicit (ADI) method and applied to 1D cases with random dielectric materials [11]. Furthermore, in [12], a variation of the S-FDTD technique was presented, which is suitable for assessing randomness in circular dielectrics. Specifically, the Delta method was applied to the polar FDTD scheme and more reliable outcomes than the conventional S-FDTD approach are extracted for those problems.
In [13], a stochastic version of the finite-difference frequency-domain algorithm was proposed. This approach was tested on 1D and 2D bioelectromagnetic problems and manages to calculate the mean and the variance of the involved field quantities in one realization with a fair degree of accuracy. The work in [14] presents a modified S-FDTD technique, which is appropriate for assessing uncertainties in dispersive materials. Particularly, the proposed scheme is based on a D-H formulation and can be applied to general dispersive media of a single pole. Finally, the authors in [15] suggested an S-FDTD method that is able to assess geometrical variations in bioelectromagnetic problems. Their approach focused on the variance calculation of the specific absorption rate (SAR) in a 2D slice of a human model, as well as in estimating the impact of tissue variation in 1D and 2D biological cases.
3. Methodology
According to [16], the equations for the 2D FDTD algorithm in a lossy medium are:
where , , and denote the dielectric permittivity, the magnetic permeability, and the conductivity of the background medium, respectively. Additionally, and are the spatial steps in the x and y directions, and is the time-step value. A medium with stochastic electric and magnetic properties is modeled by introducing uncertainty in the parameters , , and . Also, the randomness in the width and height of the random dielectric is incorporated in and . In our work, the magnetic permeability is considered deterministic, however this quantity can be also treated as stochastic by following a similar procedure to the one demonstrated below. As described in [5], the mean and the variance of a function f that depends on the variables , , ⋯, can be approximated by the following equations respectively:
where are the mean values of , , ⋯, . According to (4), the mean field updates can be calculated directly from the standard 2D FDTD equations, as long as the random variables are substituted by their corresponding nominal values. In order to approximate the standard deviation of the field components, we start by applying the variance operator to both sides of (1):
Next, we will continue with the expansion of the left side of (6). Utilizing the formula, , where denotes the covariance between the random variables X and Y, yields:
Applying the identity , where is the correlation coefficient between the variables X and Y, to (7) gives:
The work in [5] suggests that can be safely set equal to 1, thus leading to:
The electric field component is correlated with the conductivity and the dielectric permittivity. In this case, the approximation of (5) can be applied, as:
As a result, (9) becomes:
The rest of the mathematical analysis is presented in Appendix A. The extracted equations are shown below:
where
4. Numerical Results
The proposed technique is evaluated via three 2D EM problems with random dielectric slabs. Specifically, the first test case involves a lossless rectangular material with uncertainty in its width and height. In Figure 1, the schematic of the examined problem is presented. The computational domain is discretized into cells with mean spatial steps equal to , where denotes the wavelength in the vacuum at 2 GHz. The random dielectric is located at the 140th cell, while the remaining space is filled with air. The dielectric permittivity of the slab has a value of and the stochastic variables follow a normal distribution with standard deviations equal to the of their corresponding mean values. It is worth mentioning that the time-step is equal to and the total simulation time is 7.2 ns. Finally, unwanted reflections are reduced by employing the first-order Mur absorbing boundary [17] condition (ABC). This ABC is simple and requires less computational resources than the perfectly matched layer (PML) [18]. The proposed S-FDTD technique is compared with 1000 MC realizations. Particularly, Figure 2 and Figure 3 depict the mean and the standard deviation of the magnetic field at point (140, 140). In Figure 3, the accuracy of the proposed technique is examined with various correlation coefficient values. By setting , we guarantee a good agreement from 4 to 5 ns compared to the MC method. For , valid outcomes can be extracted around 0 to 4 ns, while gives satisfactory results, between 5.25 and 7.2 ns.
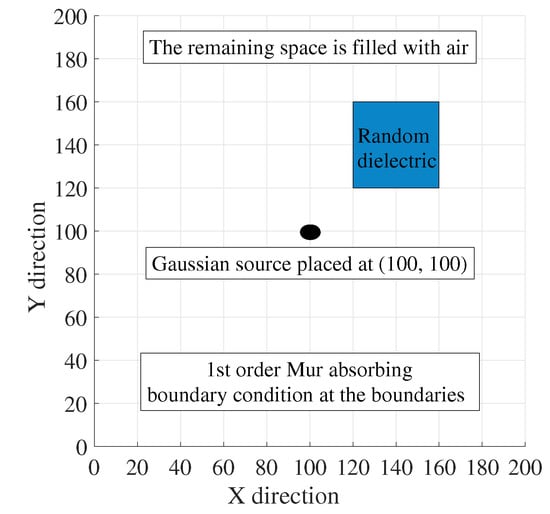
Figure 1.
The schematic of the first numerical test.
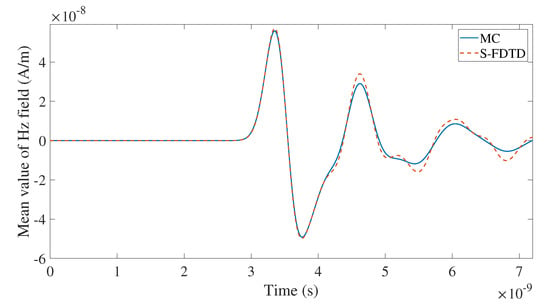
Figure 2.
Mean value of field at point (140, 140) for the first numerical test. Monte Carlo (MC), stochastic finite-difference time-domain (S-FDTD).
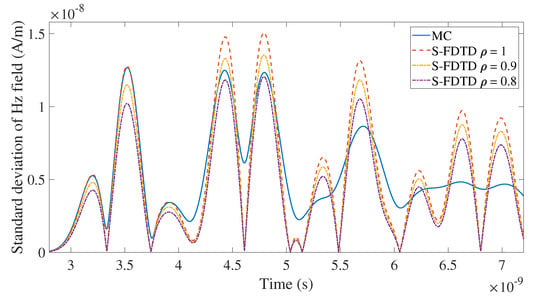
Figure 3.
Standard deviation of field at point (140, 140) for the first numerical test.
The second scenario exhibits the same problem setup as in the first case, however an additional uncertainty in the dielectric permittivity of the medium is incorporated. Again, each random variable follows a normal distribution with standard deviation equal to the of the corresponding nominal value. In Figure 4 and Figure 5, the mean and the standard deviation of the component are depicted at point (120, 140). Accurate results compared to the MC technique are obtained by setting .
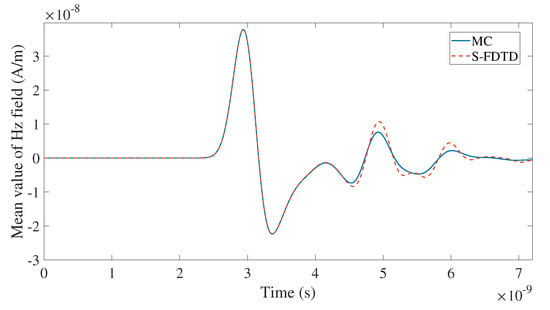
Figure 4.
Mean value of field at point (120, 140) for the second numerical test.
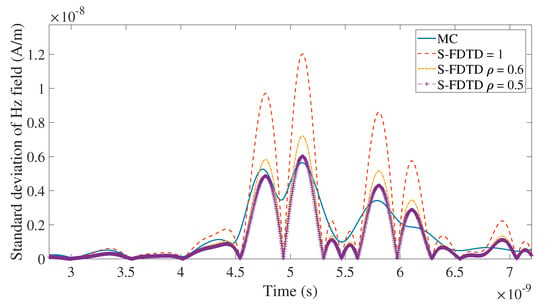
Figure 5.
Standard deviation of field at point (120, 140) for the second numerical test.
The third numerical test exhibits two rectangular materials with randomness present in their dielectric permittivities, conductivities, and in their dimensions. Figure 6 illustrates the schematic of this scenario, where the mean dielectric permittivity of the top material is equal to and the corresponding conductivity has a value S/m. Similarly, the same parameters for the bottom dielectric are and S/m. Also, the variability of each stochastic input is the same as in the case of the first two scenarios. Figure 7 depicts the mean field component, while Figure 8 illustrates the standard deviation of the same quantity. In this test case, satisfactory outcomes are extracted by setting to be around 0.7. It is also worth mentioning that for all problems, the required simulation time for the MC technique is approximately 1.44 h, while the proposed S-FDTD approach needs 17.88 s. Unfortunately, the choice of correlation coefficient values is still an open problem, as they cannot be known beforehand. Setting can often to lead to an overestimation of the standard deviation, which can be observed in Figure 3, Figure 5 and Figure 8. According to [19], a partial solution to this problem is to perform a small fraction of MC simulations, which unavoidably increases the total computational cost of the S-FDTD technique.
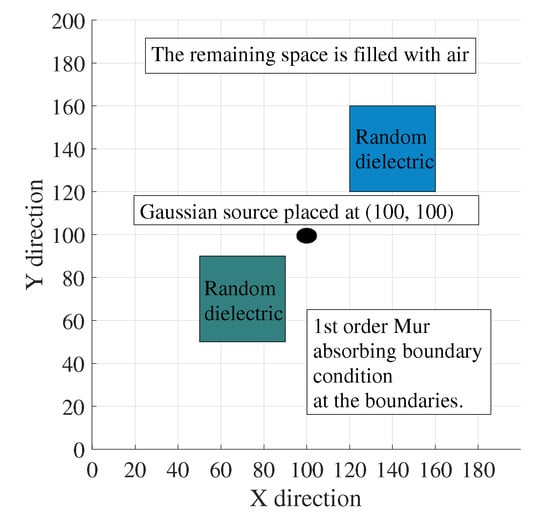
Figure 6.
The schematic of the third numerical test.
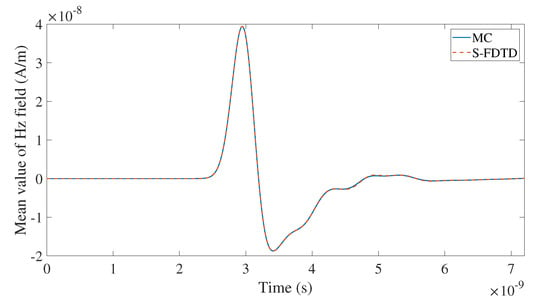
Figure 7.
Mean value of field at point (120, 140) for the third numerical test.
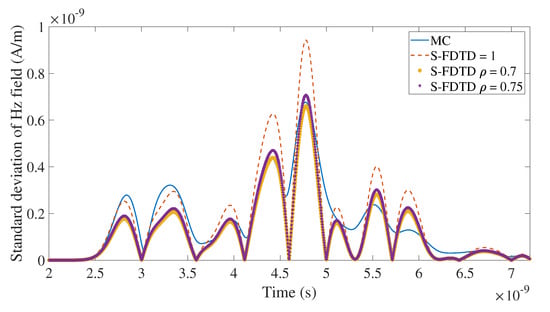
Figure 8.
Standard deviation of field at point (120, 140) for the third numerical test.
5. Conclusions
An extension of the S-FDTD algorithm is presented, which is able to assess uncertainties in the electrical and geometrical characteristics of rectangular dielectrics. The proposed approach manages to extract the mean and the standard deviation of the involved field quantities in one realization, thus rendering it less computationally expensive than the MC method. Nevertheless, the accuracy of this scheme highly depends on the correlation coefficient values, which unfortunately cannot be known beforehand. Particularly, those coefficients are coupled with the random field components and, therefore, their estimation is infeasible without the statistical characteristics of the latter. In future works, the proposed approach will be extended to 3D cases, by applying the stochastic analysis to the 3D FDTD equations. As a result, geometric uncertainties presented in the length, width, and height of random slabs can be assessed. In this case the S-FDTD approach will consist of twelve updated equations, as the mean and the standard deviation of the six field components need to be computed in those scenarios.
Author Contributions
Conceptualization, C.S.; Investigation, C.S.; Methodology, C.S.; Software, C.S.; Supervision, N.K. and T.Z.; Validation, C.S.; Visualization, C.S.; Writing—original draft, C.S.; Writing—review and editing, C.S. and T.Z. All authors have read and agreed to the published version of the manuscript.
Funding
This research received no external funding.
Conflicts of Interest
The authors declare no conflict of interest.
References
- Smith, S.M.; Furse, C. A stochastic FDTD method for statistically varying biological tissues. In Proceedings of the 2011 IEEE International Symposium on Antennas and Propagation (APSURSI), Spokane, WA, USA, 3–8 July 2011; pp. 2274–2277. [Google Scholar] [CrossRef]
- Aiouaz, O.; Lautru, D.; Wong, M.F.; Conil, E.; Gati, A.; Wiart, J.; Hanna, V.F. Uncertainty analysis of the specific absorption rate induced in a phantom using a stochastic spectral collocation method. Ann. Telecommun. 2011, 66, 409–418. [Google Scholar] [CrossRef]
- Hastings, F.D.; Schneider, J.B.; Broschat, S.L. A Monte-Carlo FDTD technique for rough surface scattering. IEEE Trans. Antennas Propag. 1995, 43, 1183–1191. [Google Scholar] [CrossRef]
- Xiu, D.; Karniadakis, G.E. The Wiener–Askey polynomial chaos for stochastic differential equations. SIAM J. Sci. Comput. 2002, 24, 619–644. [Google Scholar] [CrossRef]
- Smith, S.M.; Furse, C. Stochastic FDTD for analysis of statistical variation in electromagnetic fields. IEEE Trans. Antennas Propag. 2012, 60, 3343–3350. [Google Scholar] [CrossRef]
- Salis, C.; Kantartzis, N.; Zygiridis, T. A stochastic FDTD method for rectangular objects with geometric uncertainties. In Proceedings of the 2019 8th International Conference on Modern Circuits and Systems Technologies (MOCAST), Thessaloniki, Greece, 13–15 May 2019; pp. 1–4. [Google Scholar] [CrossRef]
- Nguyen, B.T.; Furse, C.; Simpson, J.J. A 3-D stochastic FDTD model of electromagnetic wave propagation in magnetized ionosphere plasma. IEEE Trans. Antennas Propag. 2015, 63, 304–313. [Google Scholar] [CrossRef]
- Fang, Y.; Liu, J.; Jiao, Z.; Bai, G.; Xi, X. A 3-D Stochastic FDTD algorithm for wave propagation in isotropic cold plasma medium based on bilinear transform. IEEE Trans. Plasma Sci. 2019, 47, 173–178. [Google Scholar] [CrossRef]
- Salis, C.; Zygiridis, T.; Sarigiannidis, P.; Kantartzis, N. Unconditionally-stable time-domain approach for uncertainty assessment in transmission lines. In Proceedings of the 2016 5th International Conference on Modern Circuits and Systems Technologies (MOCAST), Thessaloniki, Greece, 12–14 May 2016; pp. 1–4. [Google Scholar] [CrossRef]
- Salis, C.; Kantartzis, N.; Zygiridis, T. Stochastic LOD-FDTD method for two-dimensional electromagnetic uncertainty problems. COMPEL 2017, 36, 1442–1456. [Google Scholar] [CrossRef]
- Salis, C.I.; Zygiridis, T.T. An unconditionally stable technique for uncertainty assessment in random media based on the ADI scheme. J. Electromagnet. Wave. 2018, 32, 671–684. [Google Scholar] [CrossRef]
- Salis, C.; Zygiridis, T.; Sarigiannidis, P.; Kantartzis, N. A stochastic FDTD approach for assessing random media uncertainties in polar coordinates. In Proceedings of the 2017 6th International Conference on Modern Circuits and Systems Technologies (MOCAST), Thessaloniki, Greece, 4–6 May 2017; pp. 1–4. [Google Scholar] [CrossRef]
- Masumnia-Bisheh, K.; Forooraghi, K.; Ghaffari-Miab, M. Electromagnetic uncertainty analysis using stochastic FDFD method. IEEE Trans. Antennas Propag. 2019, 67, 3268–3277. [Google Scholar] [CrossRef]
- Liu, J.F.; Lv, H.; Fang, Y.; Zhao, Y.C.; Xi, X.L. A D-H scheme stochastic FDTD method and its SC-PML implementation. IEICE Electron Expr. 2018, 15, 20180606. [Google Scholar] [CrossRef]
- Masumnia-Bisheh, K.; Forooraghi, K.; Ghaffari-Miab, M.; Furse, C.M. Geometrically stochastic FDTD method for uncertainty quantification of EM Fields and SAR in biological tissues. IEEE Trans. Antennas Propag. 2019, 67, 7466–7475. [Google Scholar] [CrossRef]
- Taflove, A.; Hagness, S.C. Computational Electrodynamics: The Finite-Difference Time-Domain Method, 3rd ed.; Artech House: Norwood, MA, USA, 2005. [Google Scholar]
- Mur, G. Absorbing boundary conditions for the finite-difference approximation of the time-domain electromagnetic-field equations. IEEE Trans. Electromagn. Compat. 1981, EMC-23, 377–382. [Google Scholar] [CrossRef]
- Berenger, J.P. A perfectly matched layer for the absorption of electromagnetic waves. J. Comput. Phys. 1994, 114, 185–200. [Google Scholar] [CrossRef]
- Bisheh, K.M.; Gatabi, B.Z.; Andargoli, S.M.H. Stochastic FDTD accuracy improvement through correlation coefficient estimation. Wave Random Complex 2015, 25, 154–169. [Google Scholar] [CrossRef]
© 2020 by the authors. Licensee MDPI, Basel, Switzerland. This article is an open access article distributed under the terms and conditions of the Creative Commons Attribution (CC BY) license (http://creativecommons.org/licenses/by/4.0/).