Article

Architecting and Designing Sustainable Smart City Services in a Living Lab Environment

LUT School of Engineering Science, Lappeenranta University of Technology, 53850 Lappeenranta, Finland
*
Author to whom correspondence should be addressed.
Technologies 2018, 6(4), 99; https://doi.org/10.3390/technologies6040099
Submission received: 1 September 2018 / Revised: 22 October 2018 / Accepted: 30 October 2018 / Published: 1 November 2018
(This article belongs to the Special Issue Advanced Green Information and Communication Technology)

Abstract

:
In terms of sustainability, cities become smart when they provide smart services to the inhabitants using information and communication technologies without threatening the future of the environment, economy, or society. However, the process of developing such sustainable smart services has certain challenges, especially in understanding the real needs of the people living in the city. Citizens or, in a wider perspective, the inhabitants of the city are the key stakeholders in the case of smart services in a city. Active involvement of the people throughout the development process is a way of successfully designing such services. On the other hand, integrating sustainability, for example, including environmental data, into smart city services is challenging. Therefore, this research aims to combine environmental data with regular smart city services, while engaging city inhabitants in the development process. This approach was adapted from the concept of living lab methodology. Finally, an application developed following this method is presented and evaluated.

1. Introduction

It was reported by the United Nations (UN), that, in 2016, around 54.5% of the world’s population lived in the cities. The UN also projects that, by 2030, 60% of the global population will live in urban areas [1]. Thus, it can be seen that cities are growing in an extensive manner. To scale basic services to the extent of increasing demand forms a challenge for the cities. A “smart city” that connects its physical infrastructure, social system, and economic framework with information technology (IT) systems to increase the overall efficiency of operations can be seen as one approach. Increasing the operational efficiency can be achieved by making better operational choices combining analytics and modeling [2]. The term “smart city” became one of the hot topics in the recent era of science and research. A smart city can be defined from various perspectives. In simple words, a city with technological advances that supports citizens in their daily tasks is considered a smart city. However, with the increase in a city’s population, adverse pressure in the form of social, economic, and environmental effects can be noted [3]. Currently, to motivate citizens to be sustainable in a smart city is a challenge, along with designing a service that promotes sustainable behavior.
Due to rapid urbanization, around three-fourths of the total energy consumption and most of the greenhouse gas (GHG) emissions are caused by cities, which makes them a good candidate for sustainable development actions. Sustainable development was defined by the Brundland report as “development that meets the need of the present without compromising the need for the future generation” [4]. Again, in the case of smart cities, “sustainability and sustainable urban development concepts generate awareness of the production and use of resources required for residential, industrial, transportation, commercial, or recreational processes” [5]. Although there is a desire to monitor the sustainability of cities (or effects of sustainable actions), the information regarding this phenomenon is quite vague [3]. By stating that “establishing reliable methods for measuring sustainability is currently a major issue, which acts as the driving force in the discussion on sustainable development [3]”, the author points that knowledge regarding measuring sustainability needs to be developed before establishing a sustainable city. There is much confusion in assessing sustainability in cities. Designing smart city services to correctly quantify sustainability is essential for distinguishing procedures that are not sustainable, advising engineers about their reliability, and assessing their human impact [6].
Smart city services are acknowledged as increasing the overall living quality of the inhabitants [7]. Smart cities intend to apply information and communication technologies (ICT) in many ways, such as for monitoring city transportation, water supply, and traffic, and for providing road safety, e-health facilities, thereby sustaining the socio-economic wellbeing of the inhabitants of a city [8]. Citizens are one of the main types of consumers of these smart city services. In this research, citizens are coined as inhabitants—people living in the city over a period—without factoring legal rights, for example, the right to vote in national elections. Thus, it excludes people visiting the city for a short time. Currently, inhabitants of a city are more likely to use the services that they require the most for their essential task, such as mobility or housing. The services that mainly focus on the environmental aspects do well during test cases but lose citizen involvement in the long run. As described in previous research, “human motivation is inherently dynamic; what motivates us to start an action might change while we are performing that action” [9]. There are substantial data available that are being used by applications to motivate citizens in a smart city. However, if these smart city services received more attention, smart cities could achieve sustainability at a faster pace. In the case of designing smart city services, certain user interaction methods should be followed. Innovating a new technology or service for the public sector must be developed from a wider perspective. Citizens are not only users, but also an active part of the development process. Citizens are concerned with the advancement of technology; thus, their requirements and expectations are applicable [10]. According to researchers, development in public sectors is becoming increasingly complex as time goes on, and it requires more than one entity to produce a solution maintaining many layers of complexity [11]. Open innovations involving citizen involvement in the process can be a solution to such complexity. Living labs are a special type of an environment created in real life settings, to accommodate open innovations where citizen can actively take part throughout the lifetime of a project following specific methodologies using special tools, prior to being implemented in the community [12].

1.1. Motivation and Objective

With respect to the situation discussed in the previous section, there is a lack of environmental perception in regular smart city services, especially in software applications. Therefore, the main motivation of this research was to showcase a design approach for developing smart city services which also contain environmental information to facilitate citizen knowledge on sustainability in cities. This research aims to answer to the needs of the smart city service development in two phases. Firstly, it follows the selected human involvement methodology to develop a sustainable smart city service, with as many citizen interactions as possible. Next, the developed prototype, in this case an online map application, is tested for user experience through an online survey. The prototype application was independently developed by the authors using open resources and open environmental data following standard application development techniques. The formulas used to calculate certain values are explained and referenced in detail in the process. The research was conducted focusing on the citizens of the greater Helsinki area, where the surveys were conducted on full- and part-time students of two popular universities and some business owners in the area. Although the process reflects a design process for developing an application for a smart city service that provides environmental data alongside regular services, this process can also be slightly modified and followed to design various smart city services. The objective of this research was to test the living lab methodology to develop a sustainable smart city service that emphasizes environmental information and increases the knowledge of citizens about sustainability in cities.

1.2. Research Questions

A smart city can be made sustainable in many ways; for example, information and communication technologies (ICT) can be used to reduce power consumption or to optimize public transportation. An earlier study showed that using automated sensors in the home or office environment to control electronic equipment reduced energy consumption, and proper visualization motivated users to be conscious about their energy usage [13]. This research proposed a way of making environmental data visible to citizens by integrating the data with traditional smart city services. At the same time, we engaged citizens during the development process of this approach. The main research questions that were addressed throughout the work in order to achieve our objective are as follows:
  • How can environmental information be integrated into smart city services in a meaningful way by following the living lab methodology?
  • What is the experience of users in terms of viewing the environmental data in the case of the service presented in this research?
The first question was addressed by utilizing the living lab methodology for the design and implementation of a real smart city service prototype that emphasizes environmental information. This process is presented step-by-step for the selected smart city service. The second question is related to the outcomes of the implemented smart city service. As the timeframe of the research did not allow evaluation of the impacts of the smart city service on the sustainability of a city, we focused more on the short-term impression that the smart city service had on citizens. This was achieved through user testing and online surveys.

1.3. Structure of the Paper

The rest of the paper is organized in the following order: Section 2 presents various applications of smart city services, as well as the relationship between sustainability and smart cities, while explaining the living lab methodology and discussing the importance of environmental data in web applications. Section 3 presents the process adapted in this research and describes each step conducted during this research, focusing on the selected smart city service, i.e., a case of transportation use. Section 4 shows the results collected from citizens and explains the outcomes of the study. Section 5 summarizes the research work, and briefly describes the limitations and future prospects of the research.

2. Related Work

This section is divided into three parts supporting the background knowledge to solve the research questions above. The studies that were found relating to smart city services, living labs, and sustainability mostly defined the topics in different scenarios and stated their advantages. Furthermore, we reviewed the literature that relates sustainability to smart city services and living labs in terms of the environment supporting that relationship.

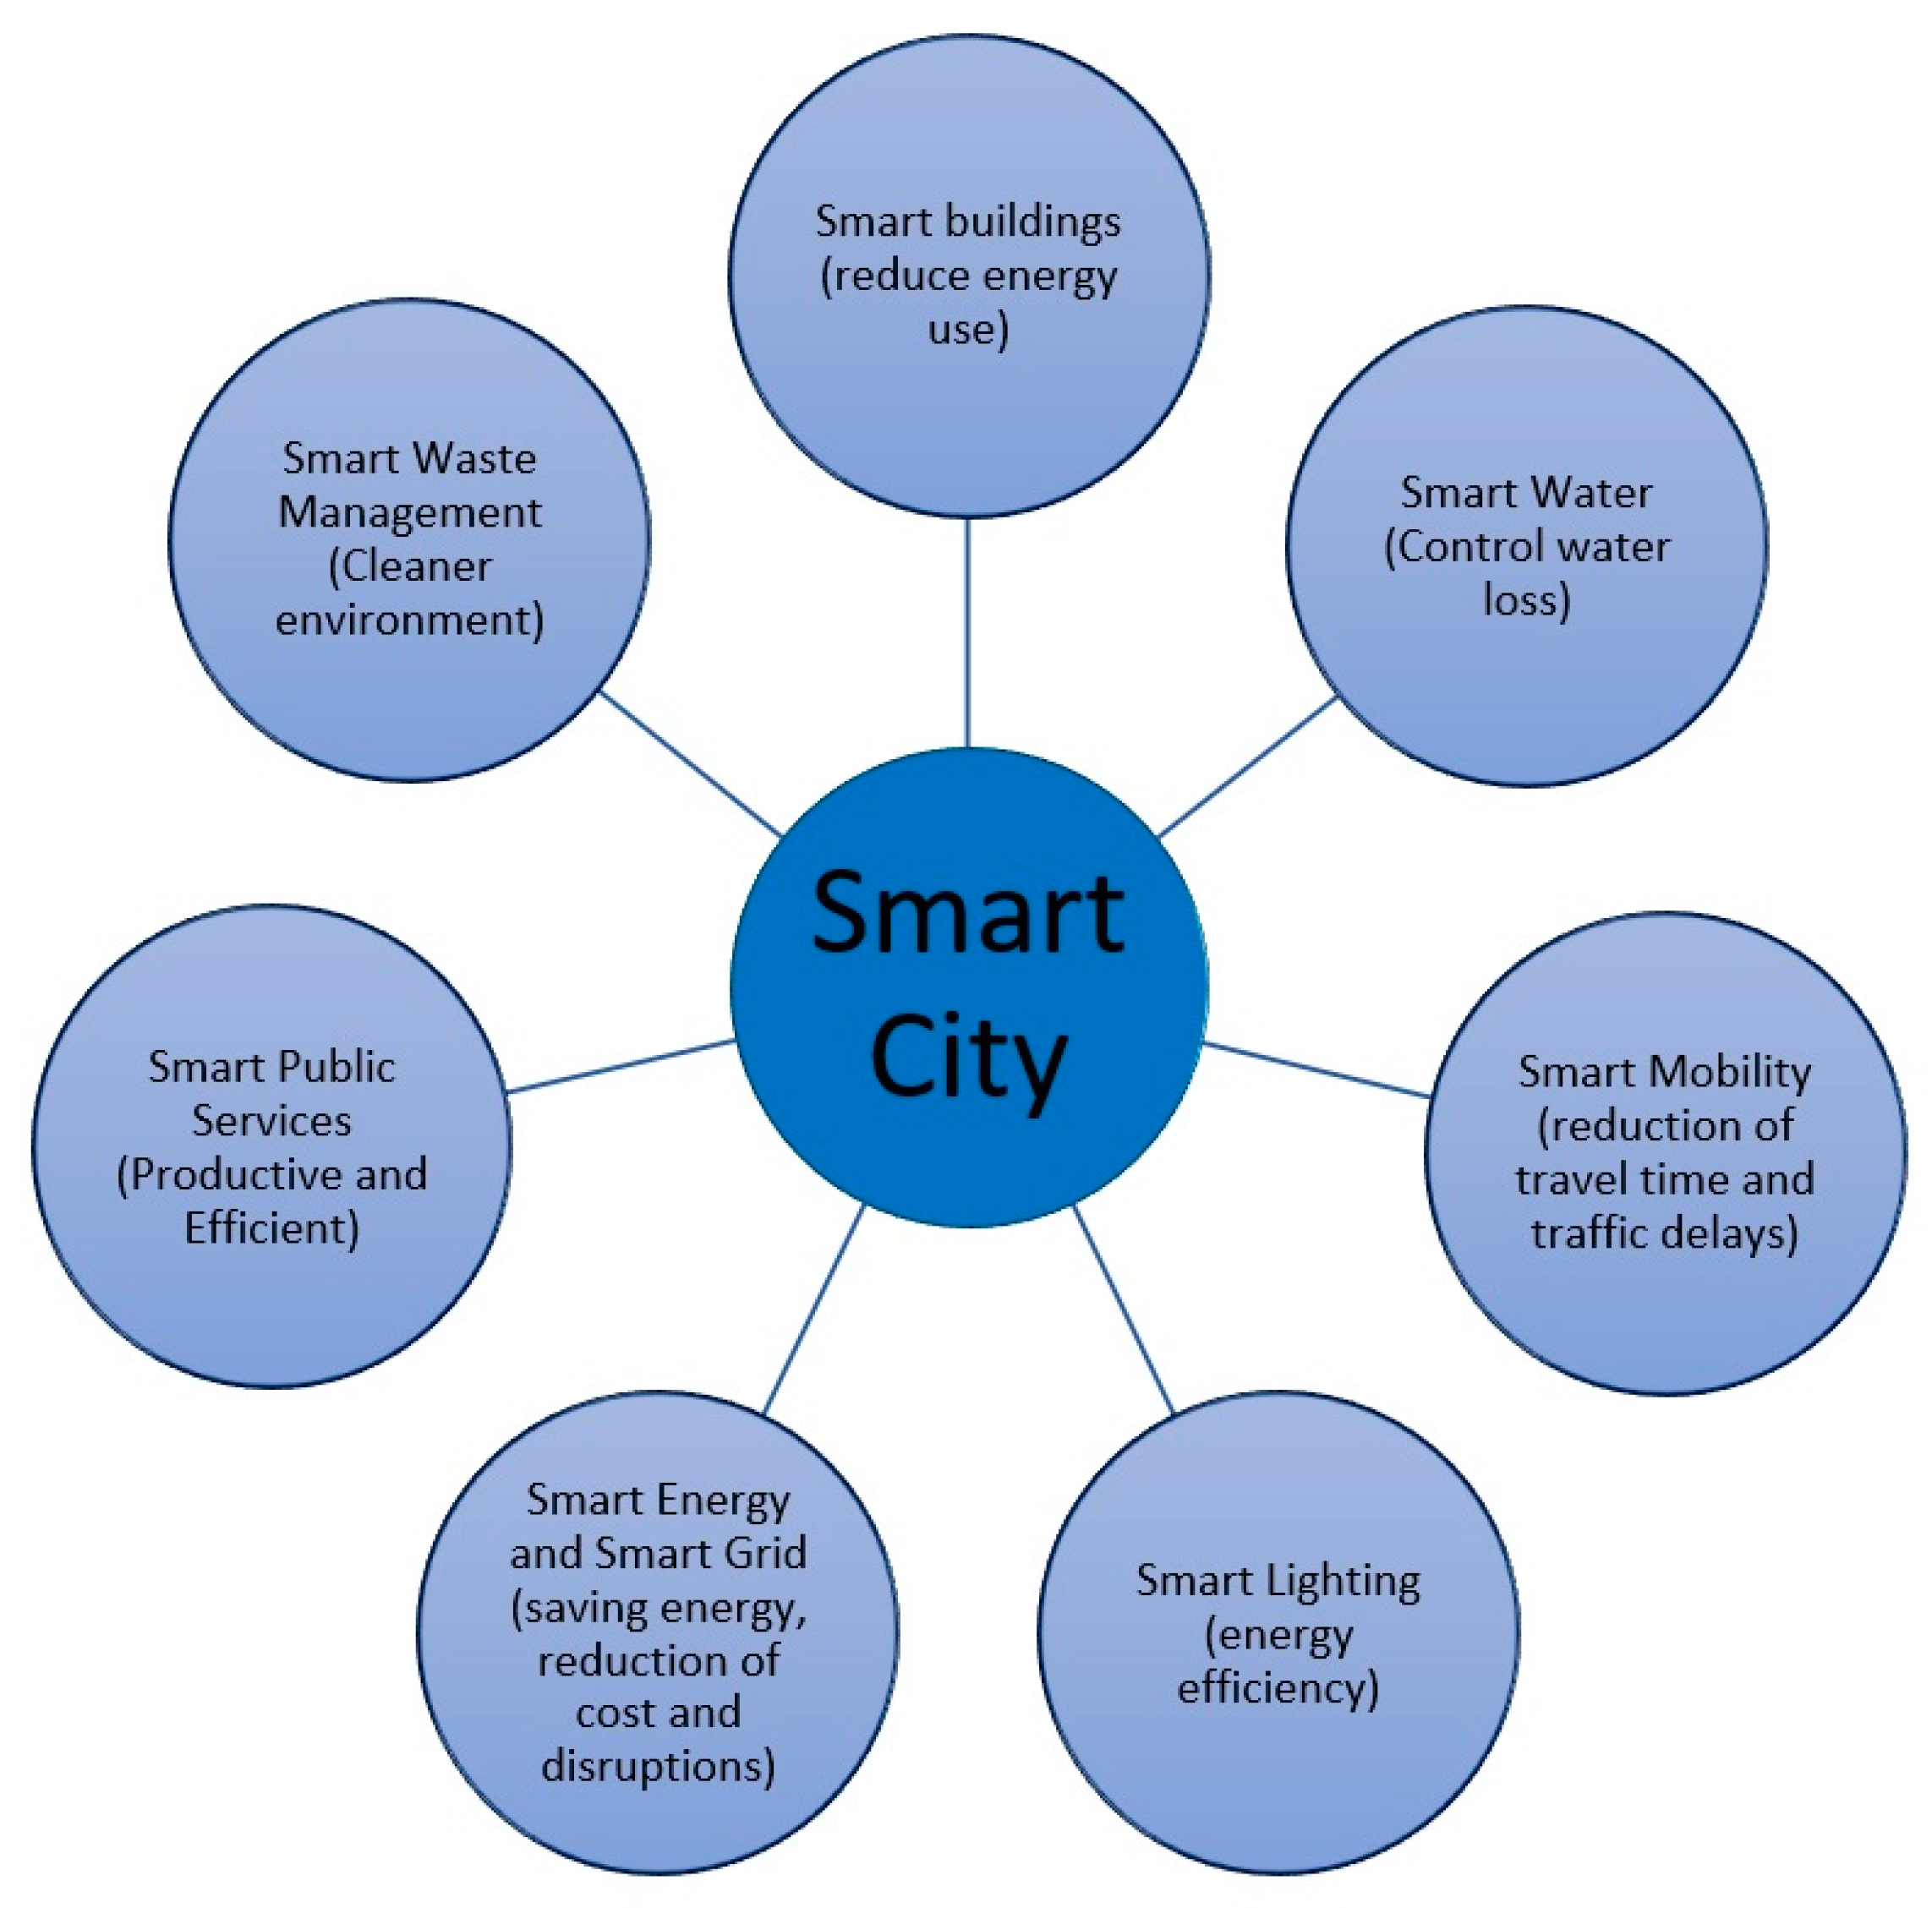
2.1. Smart City Services

The development of urban life in terms of quality, improved services, and environmental sustainability can be termed as smart city or smart city services. Many definitions are built around the concepts of information and technology, which are considered key elements in the development of smart cities [14]. In this case, a smart city cannot be confused with a digital city where written documents are transformed into digital form and bookkeeping is moved to a computer database. Here, information is not only stored from citizens, but there are also sensors automatically collecting real-time data, systems that analyze these data, and actuators sending out signals to keep the city services active round the clock [15]. In terms of providing services, a city can be considered as an organization and the citizens can be considered as customers. Citizens need to be seen as stakeholders that are an active part of the development process. As services are built to serve the citizens, they should be built around them. Since the demands of the citizens evolve, cities are bound to providing smarter services. A service cannot be defined as a physical object, as it cannot be touched or smelled. It may be supplementary to a physical object, related to its performance or activity. The presence of the service can be identified online and it provides and gathers information [16]. These services may include solutions for smart industry, smart education systems, smart governance, etc. According to recent studies, cities are considered smart when the services are versatile, interconnected, adaptive, self-sufficient, and self-repairing [17]. A smart city is vast concept and there exist many dimensions to the provided services [18], such as the following:
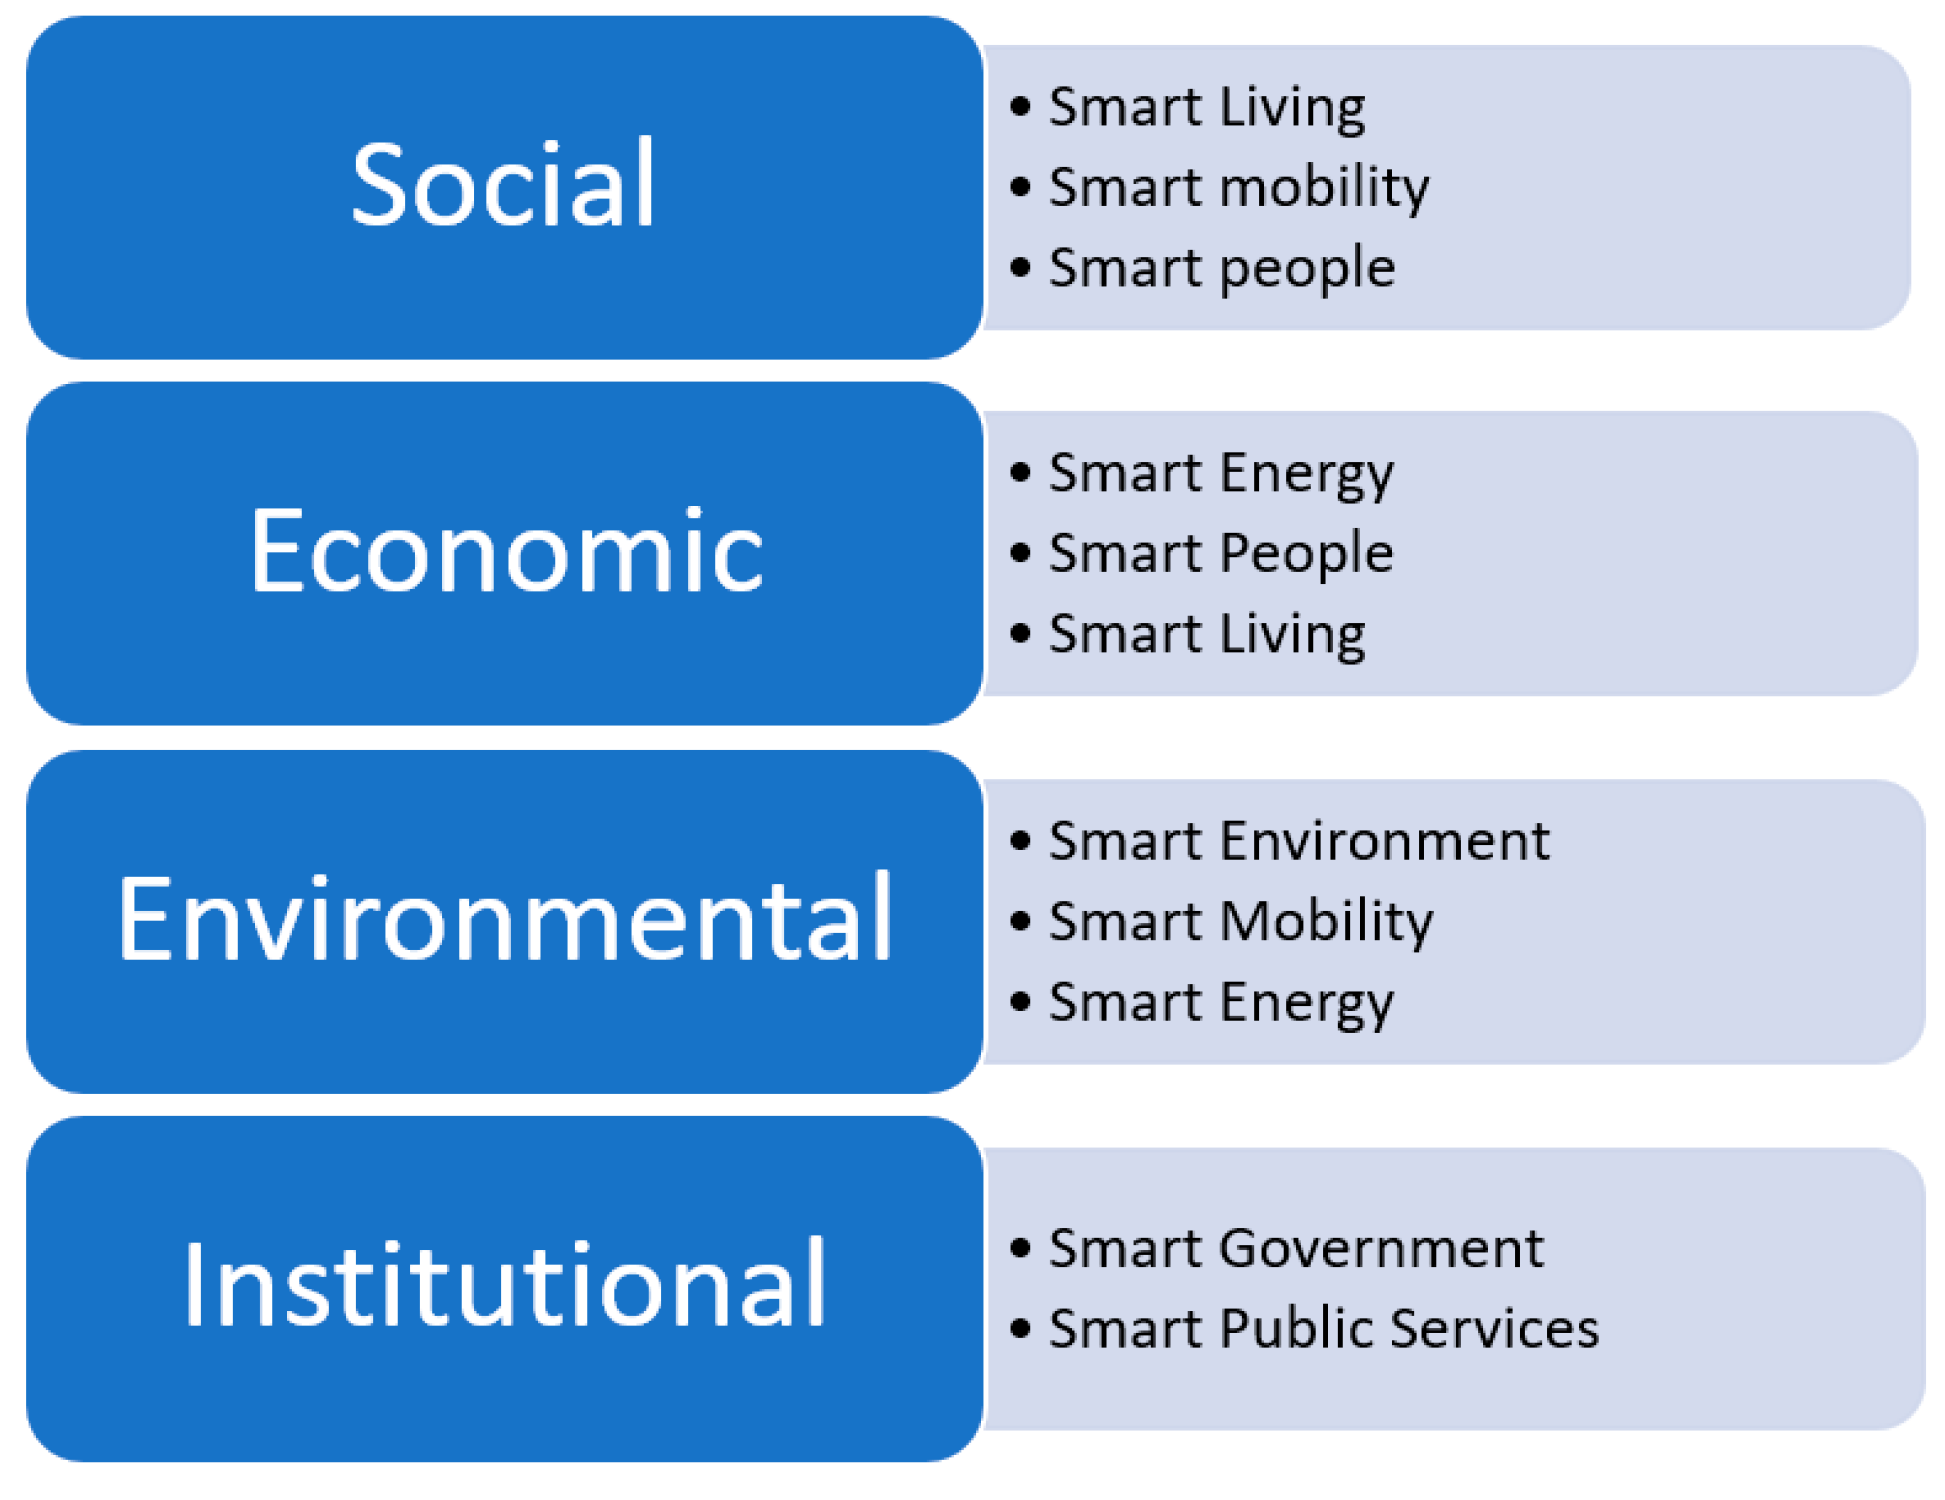
  • Smart City Governance: In the case of smart governance, citizens are active participators in decision-making and the government is transparent in its actions. Citizens have better knowledge of the functionalities in the city due to technology, which results in a well-connected governance system.
  • Smart Living: Citizens are offered a healthy and safe living environment, as well as personal medical assistance, efficient health care plans, and remote medical services, to ensure their personal safety.
  • Smart Mobility: Mobility services are combined with technology to provide actual information on the availability of transportation and decreases redundant rotation of public transport by following citizen usage patterns.
  • Smart Environment: By monitoring environmental change, smart services can provide real-time information on pollution growing in the cities. Governments and citizens can be made aware of the adverse effect, to change their behavior toward utility services such as electricity, water, and gas.
Figure 1 presents a list of example application areas in a smart city [17]. For example, in smart buildings, heating can be controlled according to the presence of inhabitants; sensors can monitor the busy hours and keep the building intelligently heated. Autonomous control ensures maximum use of resources by distributing them across different areas. On the other hand, with proper data from public services, developers can create efficient applications for citizens to get accurate schedules for buses or trains.
Technological solutions lie at the core of a smart city. However, in every modern conceptualization, insightfulness goes past the sort of knowledge that can be reduced to the utilization of new ICTs. This is the reason for both social and natural measurements being fundamental components of the keen city idea [19]. The idea behind a smart city grew from local communities where inhabitants, enterprises, and governments utilize information technology to fortifying and remodeling the communal administration level to provide jobs and equality, as well as enhance the nature of social life [20]. Smart cities should not be realized as a service, product, or innovation, as it is a combination of beliefs making new changes in urban systems and policies. It provides a framework for public sectors to promote city services in an intelligent manner [21].
Applications in smart cities are not simple to design and develop. These applications must make a connection between the city resources and the citizens. Transforming physical systems to online services is a complex task. In many cases, the applications are developed in the private sector and are provided to the public in addition to traditional services with a very low fee or free of cost. The services in smart cities need to be user friendly, adaptive to the city structure, and sustainable for the environment. Smart city services can be developed in different forms; for example, they can be web applications, mobile applications, or simple web services. The online services are researched and developed using data and information and communication technologies to improve the quality and standards of urban lifestyle [22]. Consistent and real-time information need to be provided to support the services in the city and to gain trust among the citizens. Developing and maintaining the services is costly; therefore, proper functionality of these services also ensures revenue in the future. City governance benefits from the services, as they can acquire actual data on citizen actions and behaviors, so that appropriate measures could be taken to handle complications long before they are generated [17].
However, building large-scale smart cities is criticized as well. In some cases, it is said that these developments are more focused on real estate than actually implementing smart technology [23]. In terms of using data from different smart devices, they also raise concerns regarding citizens’ rights to privacy. The connected devices in smart cities gather data on different levels. For example, the global positioning system (GPS) on our phones or cars tracks our movement. At first glance, it merely appears as simple coordinates; however, if combined with time, our presence can be identified in a particular area for a certain time. This information, if not protected, can be used for illegal activities [24]. Again, decisions in smart cities are made from various data collected from the citizens either actively or passively. Unfortunately, it not easy to identify the correctness and trustworthiness of these data [25], thus placing the services in a doubtful position. Using user data also requires the implementation of new rules and legislations [24]. Due to these complications, newly developed cities easily become technologically rich, but remain unsmart [23]. Therefore, it is beneficial to engage citizens during the development process of these services.

2.2. Living Lab Methodology

There are many ways of invoking innovation among citizens. Living labs are a modern solution offering an environment for harnessing innovation. A living lab is an environment and a process for fostering ideas and converting them into solutions. In other terms, living labs are considered as open spaces to discuss and nurture ideas. This open space of innovation is a common conception in private offices and institutions [26]. As of late, governmental associations began implementing open innovation methods, providing new avenues for development, enabling residents to propose answers for administrative issues in an open space [27]. Open advancement is, in this way, about allowing issue solvers to help rehash items, benefits, or even plans of action that may add to the survival of the association [26,28]. The living lab process thereby provides such an arrangement for open innovation.
There are two thoughts that motivate living labs. Firstly, customers are seen as co-makers of advancement and, secondly, testing is done in an actual environmental arrangement [10]. There are three main pillars of living labs, also known as the triangle framework. The pillars are the living lab environment, the living lab approach, and the innovation outcome. The living lab environment can be described in terms of the technical infrastructure, real-life context, community, scale, lifespan, level of openness, and the ecosystem approach. On the other hand, in the living lab approach, the main concerns are the evaluation, context, co-creation, and role of the user. In this case, users should have the ability to provide positive or negative reviews while interacting with developers and researchers through surveys or vocal interviews. The context of the user is also an influential element in such participatory methods. User roles should also be defined in the process, including roles such as informants, testers, contributors, or co-creators. The innovation outcome, which is the third pillar, evaluates the success of living labs [29]. It helps identify the best approaches and how the outcome is affected by the strategy, passion, knowledge, resources, and the living lab partners [30].
The research in this paper solely gives priority to an approach inspired by living lab methods to innovate sustainable smart city services with the inhabitants of a city as informants and testers. In general, living labs concentrate on supporting organizations and making an environment of development that benefits both privately owned businesses and open associations. Be that as it may, recently, according to researchers, citizens can also be considered for open innovation [31]. In the words of other researchers, “the experiments that these spaces facilitate open two symmetrical opportunities. One is the possibility for bottom-up social innovations to move faster in their trajectory from the first ‘heroic’ stage (when social inventions are still prototypes) to the following stages when more mature enterprises are created and, if necessary, when enabling products and services are conceived and enhanced” [32].
The open innovation methodology or, more specifically, the living lab methodology can be utilized in case of designing smart city services. The success of smart cities depends widely on the involvement of inhabitants in the city. In the words of Eriksson, Niitamo, and Kulkki, the idea of a living lab is a “user-centric research methodology for sensing, prototyping, validating, and refining complex solutions in multiple and evolving real-life contexts” [33]; therefore, it establishes a good ground on the idea of implementing the living lab methodology in designing smart city services. In the end, it can be understood that living labs work as an idea that can be actualized into a process, a methodology, a framework, or even a space, which relies on the nature of the requirement [34,35,36].
In this research, a modified version of a user-centric approach Form IT model is used (see Figure 2). It is an iterative process consisting of three main cycles that all aim to engage users. In this living lab process, user preferences are evaluated at each step to ensure the usability of the innovation. The design process engages users from the preliminary stages of planning to understand their requirements and to maintain the correlation between usability and features of the application [16].
In Cycle 1, ground knowledge is gathered and a concept is constructed on the basis of that knowledge, before being evaluated through users—in this case, the people living in the city. The outcome of the first cycle is a validated concept that is based on some real needs. In the second cycle, the requirements of the stakeholder are analyzed for the prototype design. The survey outcome from the previous cycle is combined at this stage to produce a visual representation of the service to demonstrate it to the users who are the inhabitants of that certain area. The outcome of the second cycle is a visual prototype that should be easy and intuitive to use and that would serve the needs of the users. The third cycle focuses on the implementation of the prototyped concept. Users and other stakeholders play an important role during each cycle for the evaluation and validation of outcomes.

2.3. Sustainability and Smart Cities

According to the Brundtland report [37], “humanity has the ability to make development sustainable to ensure that it meets the needs of the present without compromising the ability of future generations to meet their own needs”. The definition of sustainable development does not entail the progress of mankind by setting certain rules; however, it promotes development at a steady pace, in order to let the environment and technology be mature enough to mitigate the effects of human activities. Developing in a sustainable manner is often challenging for countries, especially those in a poor financial state, considering the cost of maintaining continuous growth and ensuring natural safety. In this state, sustainable behavior is expected in rich communities to provide an example and to set a strategy for others to follow, by investing more capital and technology in overall development to maintain use of natural resources for sustainable development. Therefore, achieving sustainability is a long-term and, in many cases, exhausting procedure. It is a process of change, where resources, investments, trends of technology, and governance are continuously exploited to keep harmony between the present needs and future aspirations [37]. Smart cities are often considered as deployers of an enhanced quality of life by enabling advanced technologies through decreasing disruption to natural space. Inclining to that idea, researchers suggest that smart cities will use data and information technologies to “provide more efficient services to citizens, to monitor and optimize existing infrastructure, to increase collaboration amongst different economic actors, and to encourage innovative business models in both private and public sectors” [10].
According to Bakici et al. (2012), a “smart city is a high-tech intensive and advanced city that connects people, information, and city elements using new technologies in order to create a sustainable greener city, a competitive and innovative commerce, and an increased life quality” [3]. Many application areas for sustainable development in smart cities were referred to above. Sustainability could be achieved in any of these areas. Consolidating supportable advancement and urbanization issues, regions of reasonable urban areas can employ enthusiasm, training, strategy making, and organizations, an intrigue shown in all parts of society. In the scholarly world, it can be seen in journals, college instructions, and projects particularly dedicated to tending to reasonable urban improvement. People responsible for approaching the apparent requirements for maintaining capable urban improvement can be found in worldwide discussions, sanctions, and associations, in national projects and focuses, and also in neighborhood far-reaching designs and natural projects [38]. Sustainable development was also defined by researchers as “achieving a balance between the development of the urban areas and protection of the environment with an eye to equity in income, employment, shelter, basic services, social infrastructure, and transportation in the urban areas” [39]. Moreover, alongside sustainable development, researchers stated a city as being smart “if its conditions of production do not destroy over time the conditions of its reproduction” [40].
Quick-paced urbanization resulted in urban communities representing over 75% of worldwide vitality utilization and 80% of the aggregate greenhouse gas (GHG) emissions, due to the arrangement of general worldwide asset utilization occurring in urban communities. Urban communities with supportable improvement demonstrated noticeable quality, and the idea of practical urban areas received noteworthy political force worldwide as the focal concentration in driving overall maintainability [3]. Although in most cases sustainability is described in terms of the environment, one should not forget the other dimensions, e.g., economical and social. The areas of smart cities are also diverse; thus, they should be properly mapped with the appropriate dimension of sustainability. In a previous paper [3], the traditional dimensions of sustainability (ecological, economical, and social) were modified to meet the challenges of a smart city by also considering the institutional dimension (see Figure 3). It can be seen that the same areas of smart cities are related to different dimensions of sustainability. For example, smart living influences the development of social life, as well as economic factors, as smart buildings help reduce energy costs.
Integrating sustainability in smart cities through ICT was the main agenda for many smart communities. It was indicated in studies that applications and services developed by the NSA are created following the instructions from experts rather than by including all parties of a smart city, thus shifting the goal of the applications to a different level. On the other hand, citizen-centric systems can successfully measure social behavior, personal satisfaction, happiness of local areas, and communal satisfactory impression [41,42]. In the words of other researchers, “the label ‘smart city’ should refer to the capacity of clever people to generate clever solutions to urban problems” [23]. It can be realized that ICT-enabled smart city services are important for sustainability and it is equally necessary to design these services.
Previously, different standards were followed to develop individual components of smart cities, for example, smart meters, smart grids, smart living, and many others. Recently, the strategies for developing smart city services changed horizontally, following unified standards for accessibility, environment monitoring, and others. However, in the unified system, standards are more of a requirement than a conventional method; they additionally provide more usability and reduce unnecessary costs of cross-platform problem development [43]. Inclining to this strategy, researchers also define cities as smart “when investments in human and social capital and traditional (transport) and modern (ICT) communication infrastructure fuel sustainable economic growth and a high quality of life, with a wise management of natural resources, through participatory governance” [44]. Generally, it can be abridged that there are two standards in the present smart city discourse: (1) the ICT- and innovation-centered approach, and (2) the general-population-arranged approach. A measurement of shrewd urban communities is how they go from methodologies that describe the productivity and mechanical progression of a city’s core foundations (i.e., transport, water, squander, and vitality) to those concentrating on the delicate framework and individuals. Other illustrations used to classify smart cities are seen as top-down versus bottom-up activities, and supply-driven versus request-driven methodologies [45].

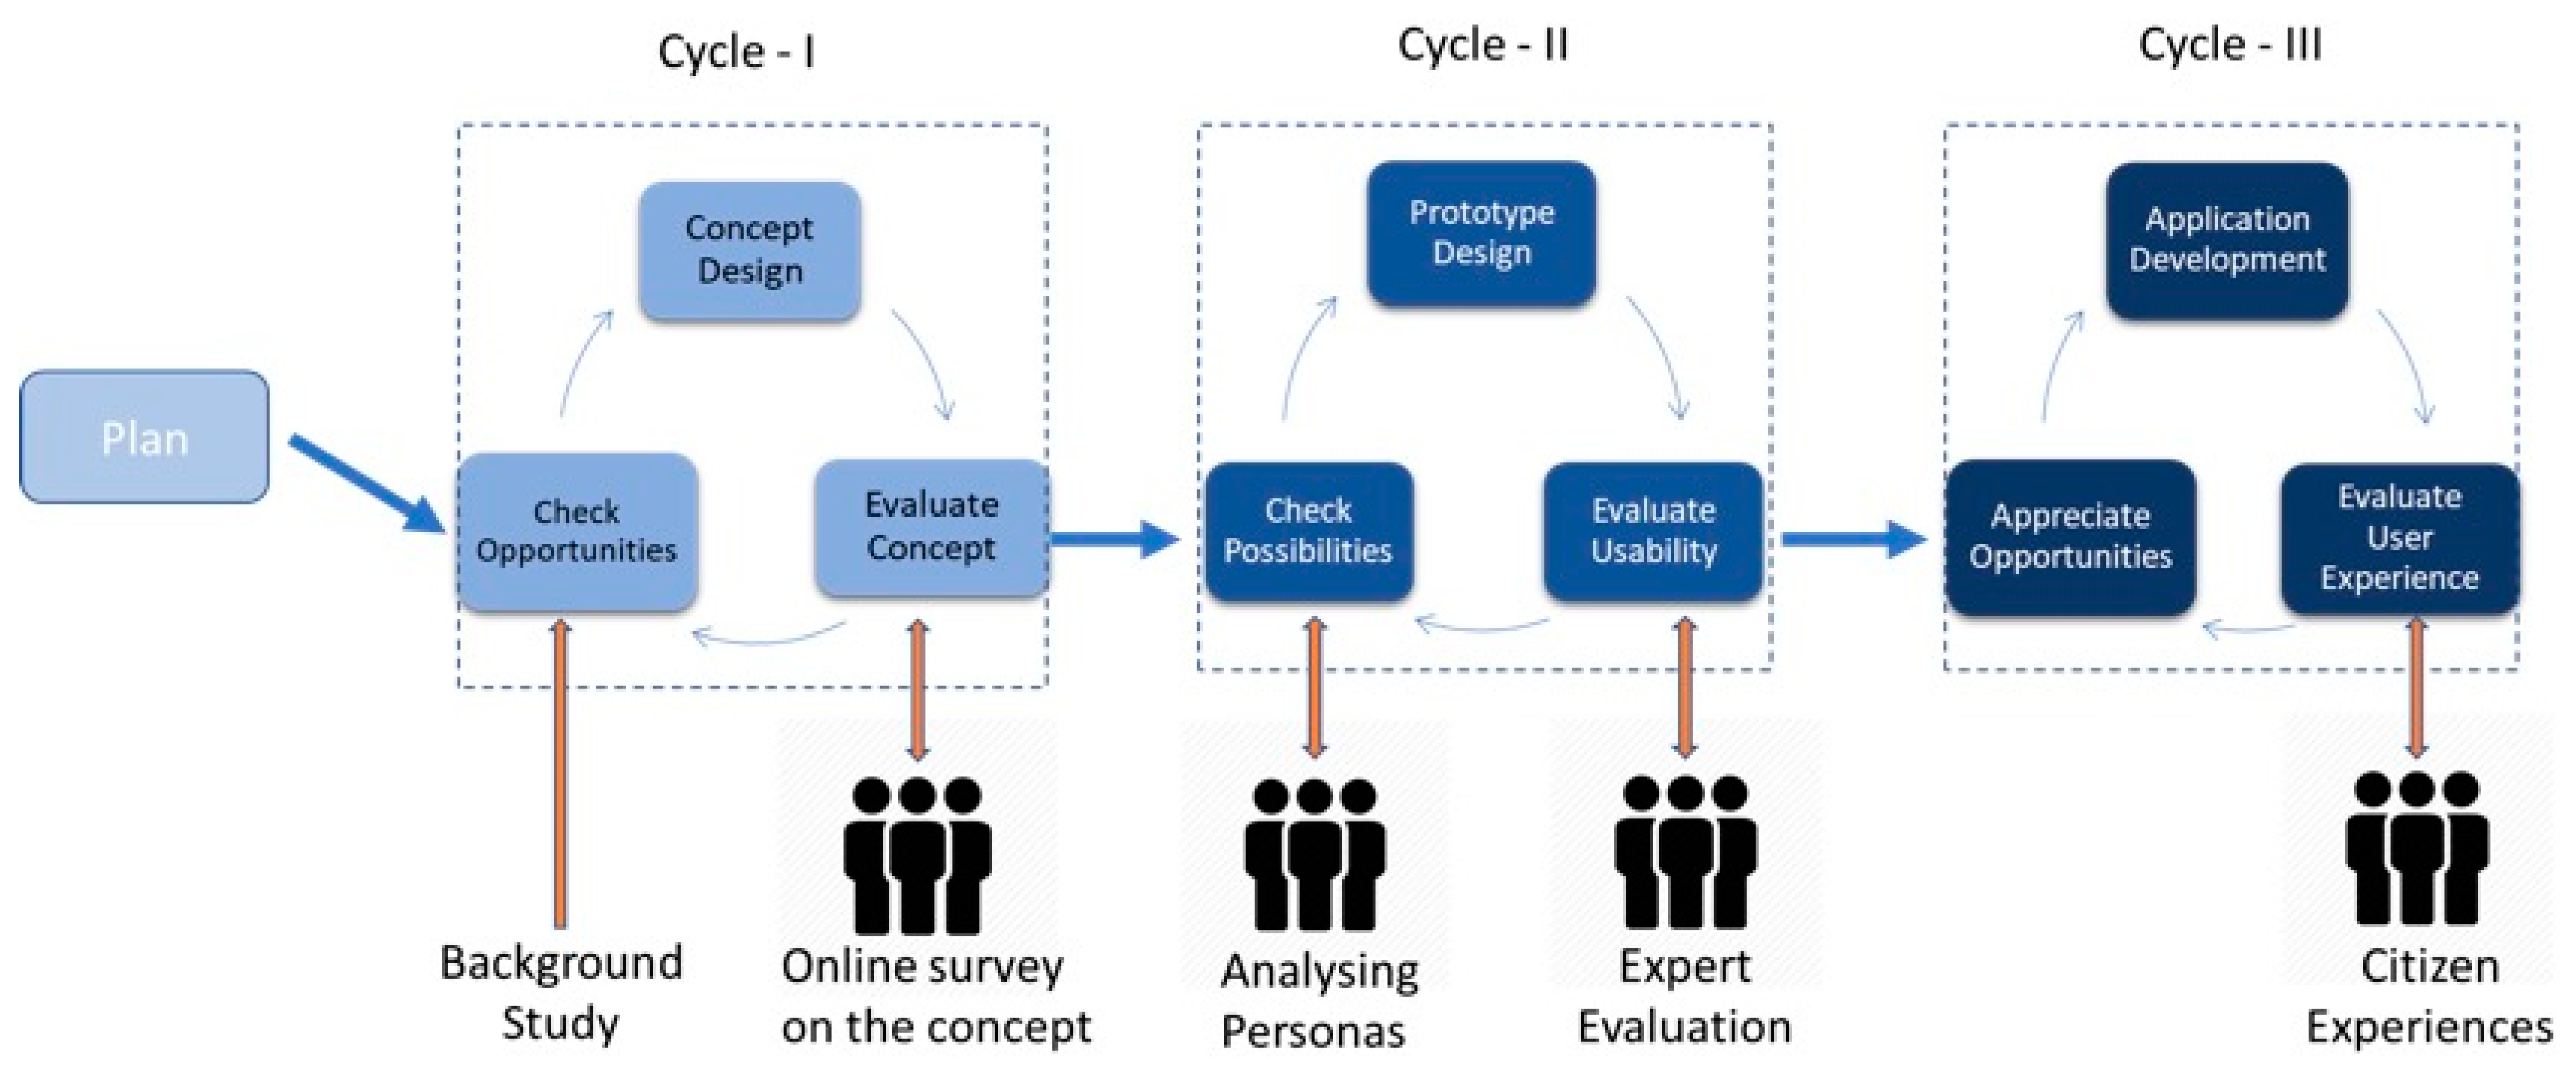
3. Engaging Citizens in Designing Smart City Services

This section presents the design and development of a web application, named “Green Commute” that provides data related to human actions toward the environment, along with regular services in a smart city. The smart city context is such a vast concept that it is difficult to represent it in a single application. Thus, this research focuses on the application of sustainable commuting in the city. The design and implementation of the web application is explained through the cycles of the Form IT model [16]. Each of the cycles is explained in the context of the selected application.

3.1. Cycle 1

Cycle 1 focuses on concept design by firstly looking at the state of the art in literature, before creating a concept based on the needs or research gaps, and finally, validating this concept. The outcome of the first cycle is a rough idea of the concept and some validation, i.e., establishing a concept that is of interest to the users.

3.1.1. Check Opportunities

In this phase, information is gathered through different resources, such as scientific research articles, reports from national organizations, and government and university websites. Based on the discussions in earlier sections, a smart city has many application areas and, for this research, only one area was chosen to demonstrate the approach. The topic in this case was emissions due to passenger vehicles in the city. The literature revealed that, in 2015, road transport was the cause of 70% of carbon emissions, of which almost 45% was caused by passenger cars [46]. In recent years, cities became major consumers of energy and resources, making them one of the largest emitters of greenhouse gases (GHGs). Among the main six elements of GHGs, carbon dioxide (CO2), methane (CH4), and nitrous oxide (N2O) have adverse effects on the environment. Early actions to reduce these gas emissions may result in savings of 5% of global gross domestic product (GDP), and if 1% GDP is spent in a proper manner, this may limit the temperature rise below 2 °C [47]. Among the GHGs, CH4 has a more adverse effect on the environment, but CO2 is found in much larger quantities in our surroundings. Thus, the focus is on reducing CO2, more specifically, carbon, which is then addressed as the carbon footprint [48]. For many years, carbon footprinting was used as a life-cycle impact for global warming [49]. In this case, the carbon footprint is considered as a potential indicator of global warming. Researchers Wiedmann and Minx explained carbon footprint as the total amount of CO2 emissions caused by the collective action over the life cycle of a product directly or indirectly [50]. In later studies, it was suggested that GHGs other than CO2 should be included in the calculation of carbon footprint. A dispute with regards to direct and indirect emission was identified in the process of calculating footprint, thus making the calculation complex. The carbon emitted from burning fossil fuels such as gasoline is counted as direct emission. Contrary to that, electric cookers using electricity produced through burning coal is considered as indirect or embodied emission [47]. The term “carbon footprint” plays an important role in understanding the individual contribution to carbon emissions. Carbon footprint also provides a quantified expression to people who are not aware of the GHG emissions, and its importance can be identified in various sectors. Due to the quantified values of carbon emission, governments can organize their rules on carbon emission taxes, and individuals can understand the effect by measuring the impact of their daily usage of energy products. It is also helpful for researchers to evaluate certain decisions in terms of their environmental impact. For example, Piecyk and McKinnon identified fuel consumption and projection in road freight transport in Britain, which was forecast as 1.93 × 10⁷ tons of CO2 business-as-usual for 2020 [51]. The measurements led to a better understanding of GHG emissions and built awareness among people. However, the various choices of carbon footprint calculators leave users confused about the results, thus minimizing the benefits of the service it provides.
The challenge for the Green Commute smart city service was to find suitable datasets or services to be linked to the actual implementation. As the target area of the web application is the Helsinki region, web resources were chosen to cover this area. Many forms of open data sources were found that provide information relating to the environment, for example, air quality data, carbon footprint data, and weather data. Table 1 lists some of the open data resources related to the environment. These were considered in the design phase as possible sources for the selected smart city service.
In addition to the environmental data, many services and application programming interfaces (APIs) were found relating to carbon footprint calculation and transportation in smart cities.
In Table 2, only a few could be presented, but there exist a large number of applications or services. Though the number is noticeable, none of these applications have a direct relation to presenting the impacts on environment. Therefore, it seems that there is a need and gap for a sustainable transportation smart city service. Transport services available in many European cities are smart in terms of providing the best travel routes, proper timing, vehicle monitoring, and ticketing facilities. The applications do not provide carbon footprint calculations in terms of different modes of transport; therefore, concerned users tend to move toward separate applications or services to calculate it themselves. Unfortunately, the missing relationship between regular smart city services and environmental services causes less use of these services or applications. In addition, researchers added that there is a lack of awareness of the smart services that promote sustainability in a city [52]. Finally, in this phase, it can be perceived that there is a divergence in people’s awareness of sustainable services in cities and they do not feel the necessity to use additional services to achieve sustainability.

3.1.2. Concept Design

The literature-based knowledge of the previous stage was considered while designing the concept of the smart city service (Figure 4). It was understood in the previous step that there exist a good number of smart applications and a good number of environmental services. However, a relationship between these two types of services is very important for them to be successful in user involvement. Therefore, the concept of Green Commute was based on three ideas: the available data sources, integration of these data sources with regular smart city services, and presentation of these data sources to its users. To explain this concept, an example of a transport service can be considered, in which case the service or application provides users living in a city with information on local transport, the ticketing system, and maps of local areas. Environmental data, such as air quality in the surrounding areas and measuring carbon footprint of different transport choices, were selected to be presented in the application. In order to establish a connection with users, there should be an understandable relationship with the results provided in the regular smart city service and the environmental data, which is the requirement of integration concept. Later, the data should be presented in an interactive format able to receive attention from users. The concept promotes the development of sustainable smart city services where environmental data can be tracked with the regular services available in the city.

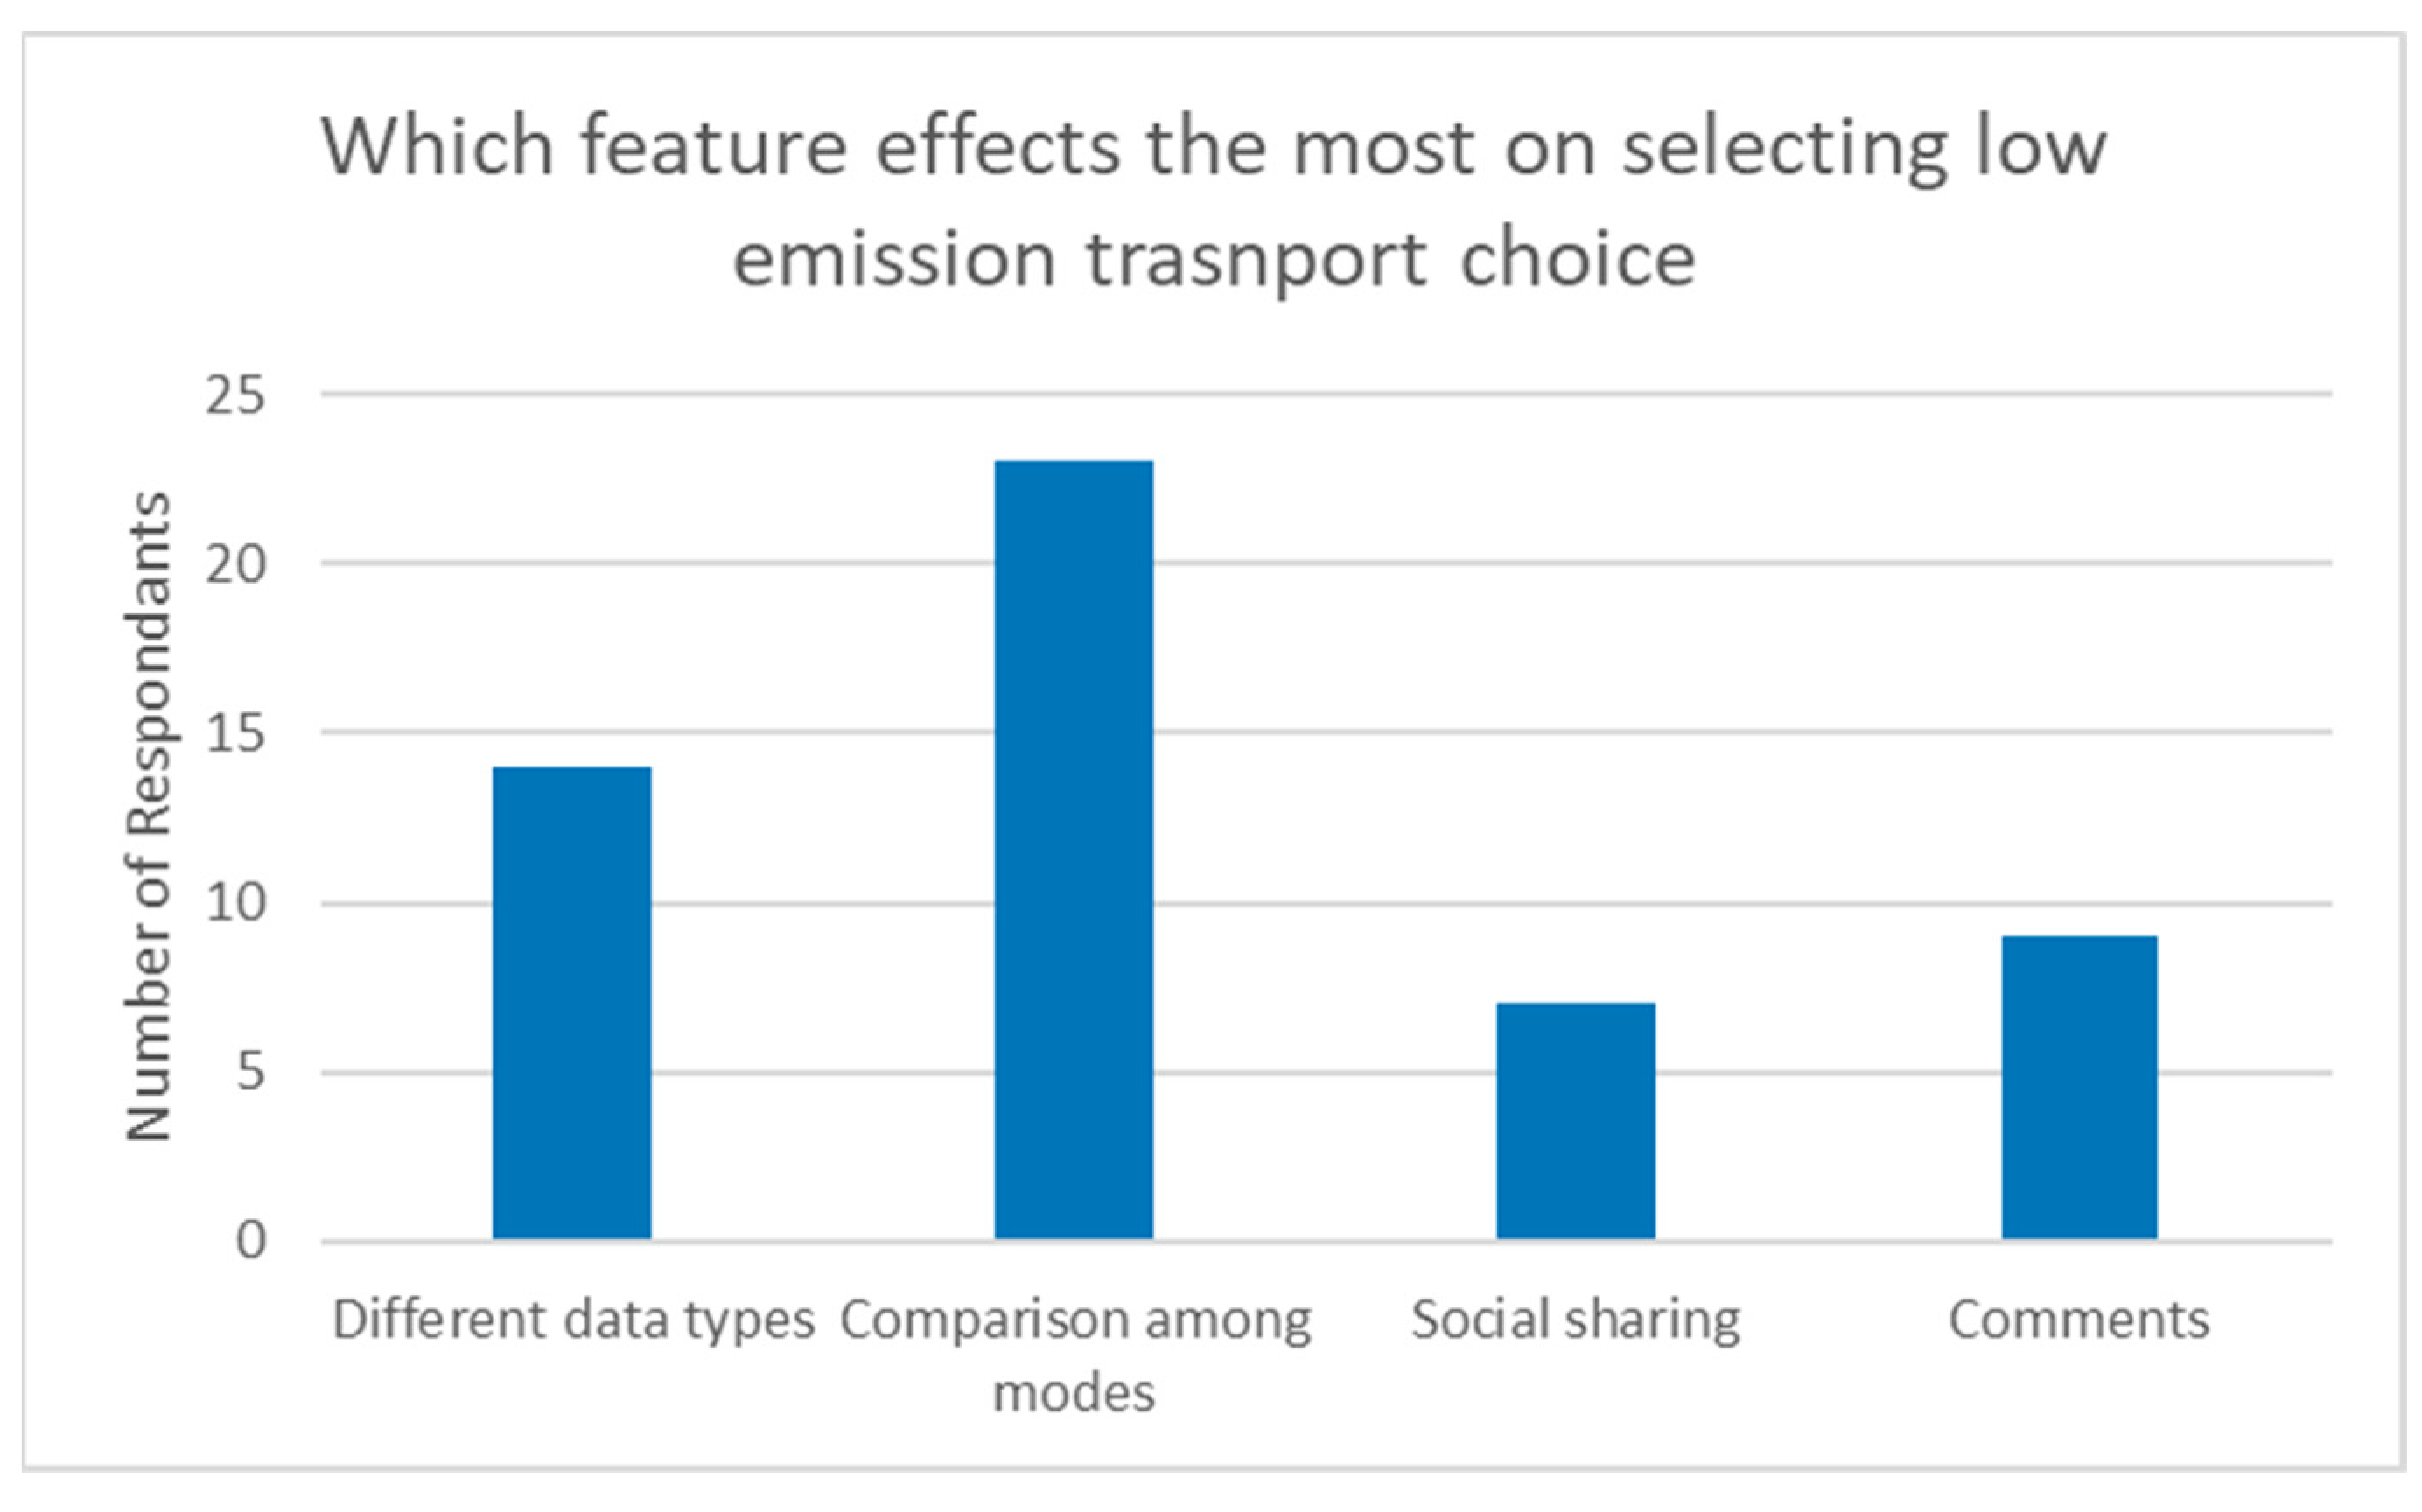
3.1.3. Concept Evaluation

The living lab methodology includes stakeholders or prospective users throughout the process to achieve best results. It is valuable to include stakeholders from the beginning of the project to reach an aggregated solution, which is the main focus of living lab innovation. In such a process, people from the public and the government are invited to participate in the co-creation. Although most of the stakeholders do not feel the professional motivation to take part in such voluntary work, a connection should be developed with the people from a problem or an envisioned solution so that the stakeholders find it relevant [53]. For the Green Commute application, the primary concept was evaluated through an online survey to gain maximum knowledge of the people who are expected to use the service. The survey was conducted in the Helsinki, Espoo, and Vantaa areas through social media and a Google form. The questions were constructed to get a view on the following points:
  • Knowledge of carbon footprint;
  • Apps or services used to calculate or monitor carbon footprint;
  • Views on application usage.
The survey was run for two weeks and 31 people completed the survey. According to the results, 72% had the concept of carbon footprint but never calculated it. Of those who had knowledge of carbon footprint and calculated it, 70% of them did it only once. Most people also responded that it would be easier to have this environmental information on their regular applications. Among the respondents, only one-fourth of them were 35 years or older. The survey was not limited to a student network; rather, it was spread out to the public. Thus, responses from private jobholders, show owners, and government workers were received. It was also noticeable that, although Helsinki has a well-connected public transportation system, around two-thirds of the respondents use personal cars for daily commute.

3.2. Cycle 2

The second cycle focuses on prototyping with the stakeholders—in our case, people living in Helsinki region. The (survey) outcome from the previous cycle was utilized at this stage to produce a visual prototype of the service. The outcome of this cycle is a validated prototype design that fulfills the user’s needs.

3.2.1. Check Possibilities

A broad knowledge of the needs was received through the survey in the previous cycle; however, to understand the specific requirements, a detailed analysis of the personas for the users were required [54]. Phone interviews were conducted with people living in the target region to get an overall idea about their interests, needs, and goals. The respondents represented different age groups and professions. For example, one person was a student who was a part-tine worker in the city, while another person had a well-established business in the city. Involving people with various backgrounds allowed us to gather a wide variety of requirements. Key requirements that were identified during this stage are as follows:
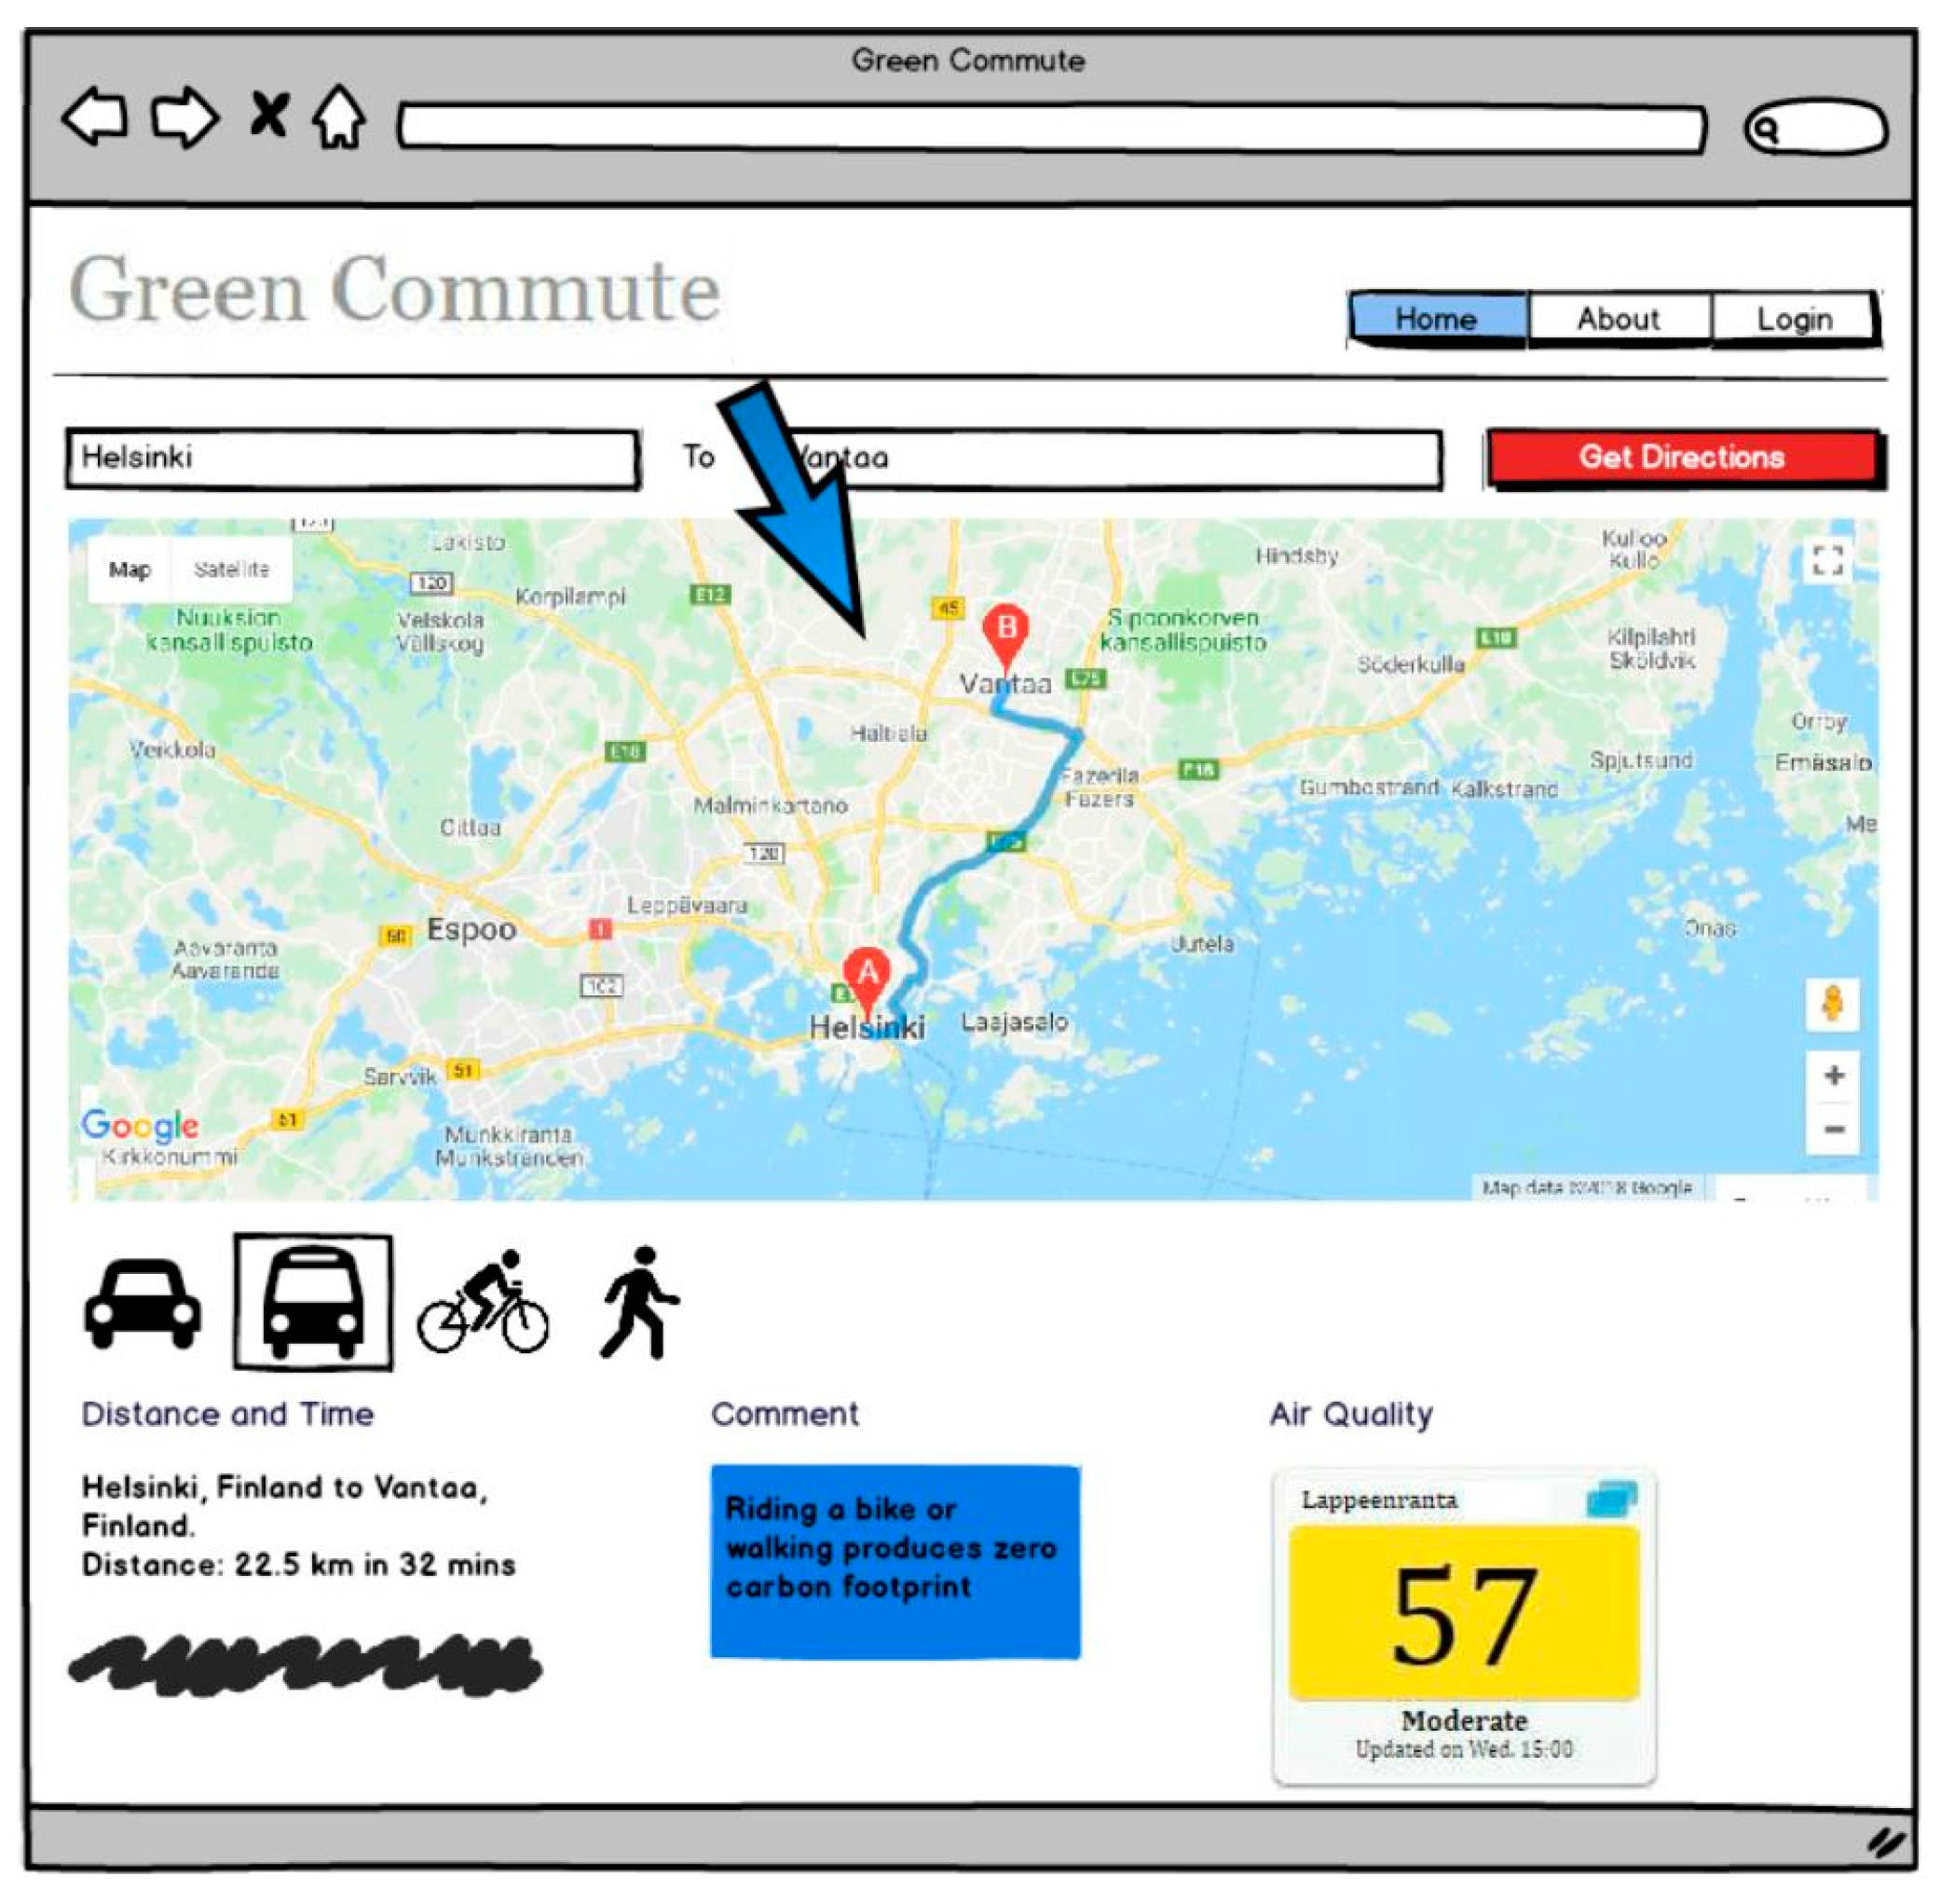
  • Directions from one place to another;
  • Directions for different modes of transport;
  • Time and distance for each mode of transport;
  • Weather conditions in start and end places;
  • Public transportation information;
  • Saving a trip for future.

3.2.2. Prototype Design

Prototyping is an approach for visualizing an application or a software or a service prior to its development. It is used to interact with the system, and to understand the point-to-point navigation of a software system. It is not necessarily an exact replica of the final product, but it is an early design scheme to feel the end result [55]. Effective prototyping consists of four steps: planning, detailing, designing, and results. During the planning of the prototyping, user requirements were verified, as they were established during Cycle 1. According to researchers, “a digital prototype is almost a digital version of the paper prototype. Except, digital prototypes can range from a series of low-fidelity, narrative click-through screens for quick visualization of a design concept to a high-fidelity interactive portrayal of an evolved design which can be used as a user interface specification” [55]. In our Green Commute web application, the Balsamiq prototyping tool was used to develop a mid-level digital prototype. Jakob Nielsen proposed many ideas for designing a product to increase usability. In this case, 10 heuristic principles of Jakob Nielsen were followed to design the prototype [56]. Figure 5 represents the prototype in the form of a website with basic features to validate the stakeholder requirements. It was designed following the Google maps application, along with additional information concerning environmental data.

3.2.3. Evaluate Usability

Just like at the end of Cycle 1, the outcomes of Cycle 2 were evaluated and validated. The purpose of the validation of the digital prototype was to understand the task flows and contexts of use. The validation was performed following the cognitive walkthrough approach by asking four evaluation questions on the prototype [57]:
  • Does the action match the user’s goal at that point?
  • Will the user see the action is available?
  • Will the user recognize the action is the one they need?
  • Will the user understand the feedback they receive?
In our Green Commute application prototyping, three usability experts (one professor, one post-doctoral researcher, and one doctorate student from Lappeenranta University of Technology (LUT)) judged the prototype based on the collected user requirements. Each expert individually evaluated the prototype following a preset scenario with goals and tasks. The task list for the experts was as follows:
  • Search for direction between two places;
  • Read the directions;
  • Change the mode between different transport choices;
  • Check the amount of carbon footprint for your transport;
  • Save your journey after login.
The experts each took around 20–25 min to analyze the task in detail. They individually noted the good and bad design choices of the prototype. To summarize, from this phase, issues with colors and data presentation were identified and were further improved over the cycle.

3.3. Cycle 3

The purpose of the third cycle is to develop the actual service based on the feedback received from the previous cycle. Cycles 1 and 2 provided validation for the concept and usability of the prototype; as such, they provided a good starting point for the actual development. The outcome of this third cycle should be the Green Commute web service that is found usable and beneficial for the users.

3.3.1. Appreciate Opportunities

The motivation for this step-by-step approach was to understand the needs of the inhabitants of the city and to involve their choices throughout the design and development phase. Appreciating the survey results and usability evaluation, it was understood that, in the case of the Green Commute service, the expected user’s primary requirement was the use of an existing service, and the secondary requirement was the environmental data (carbon footprint, air quality, weather) that best matches with the primary requirement.

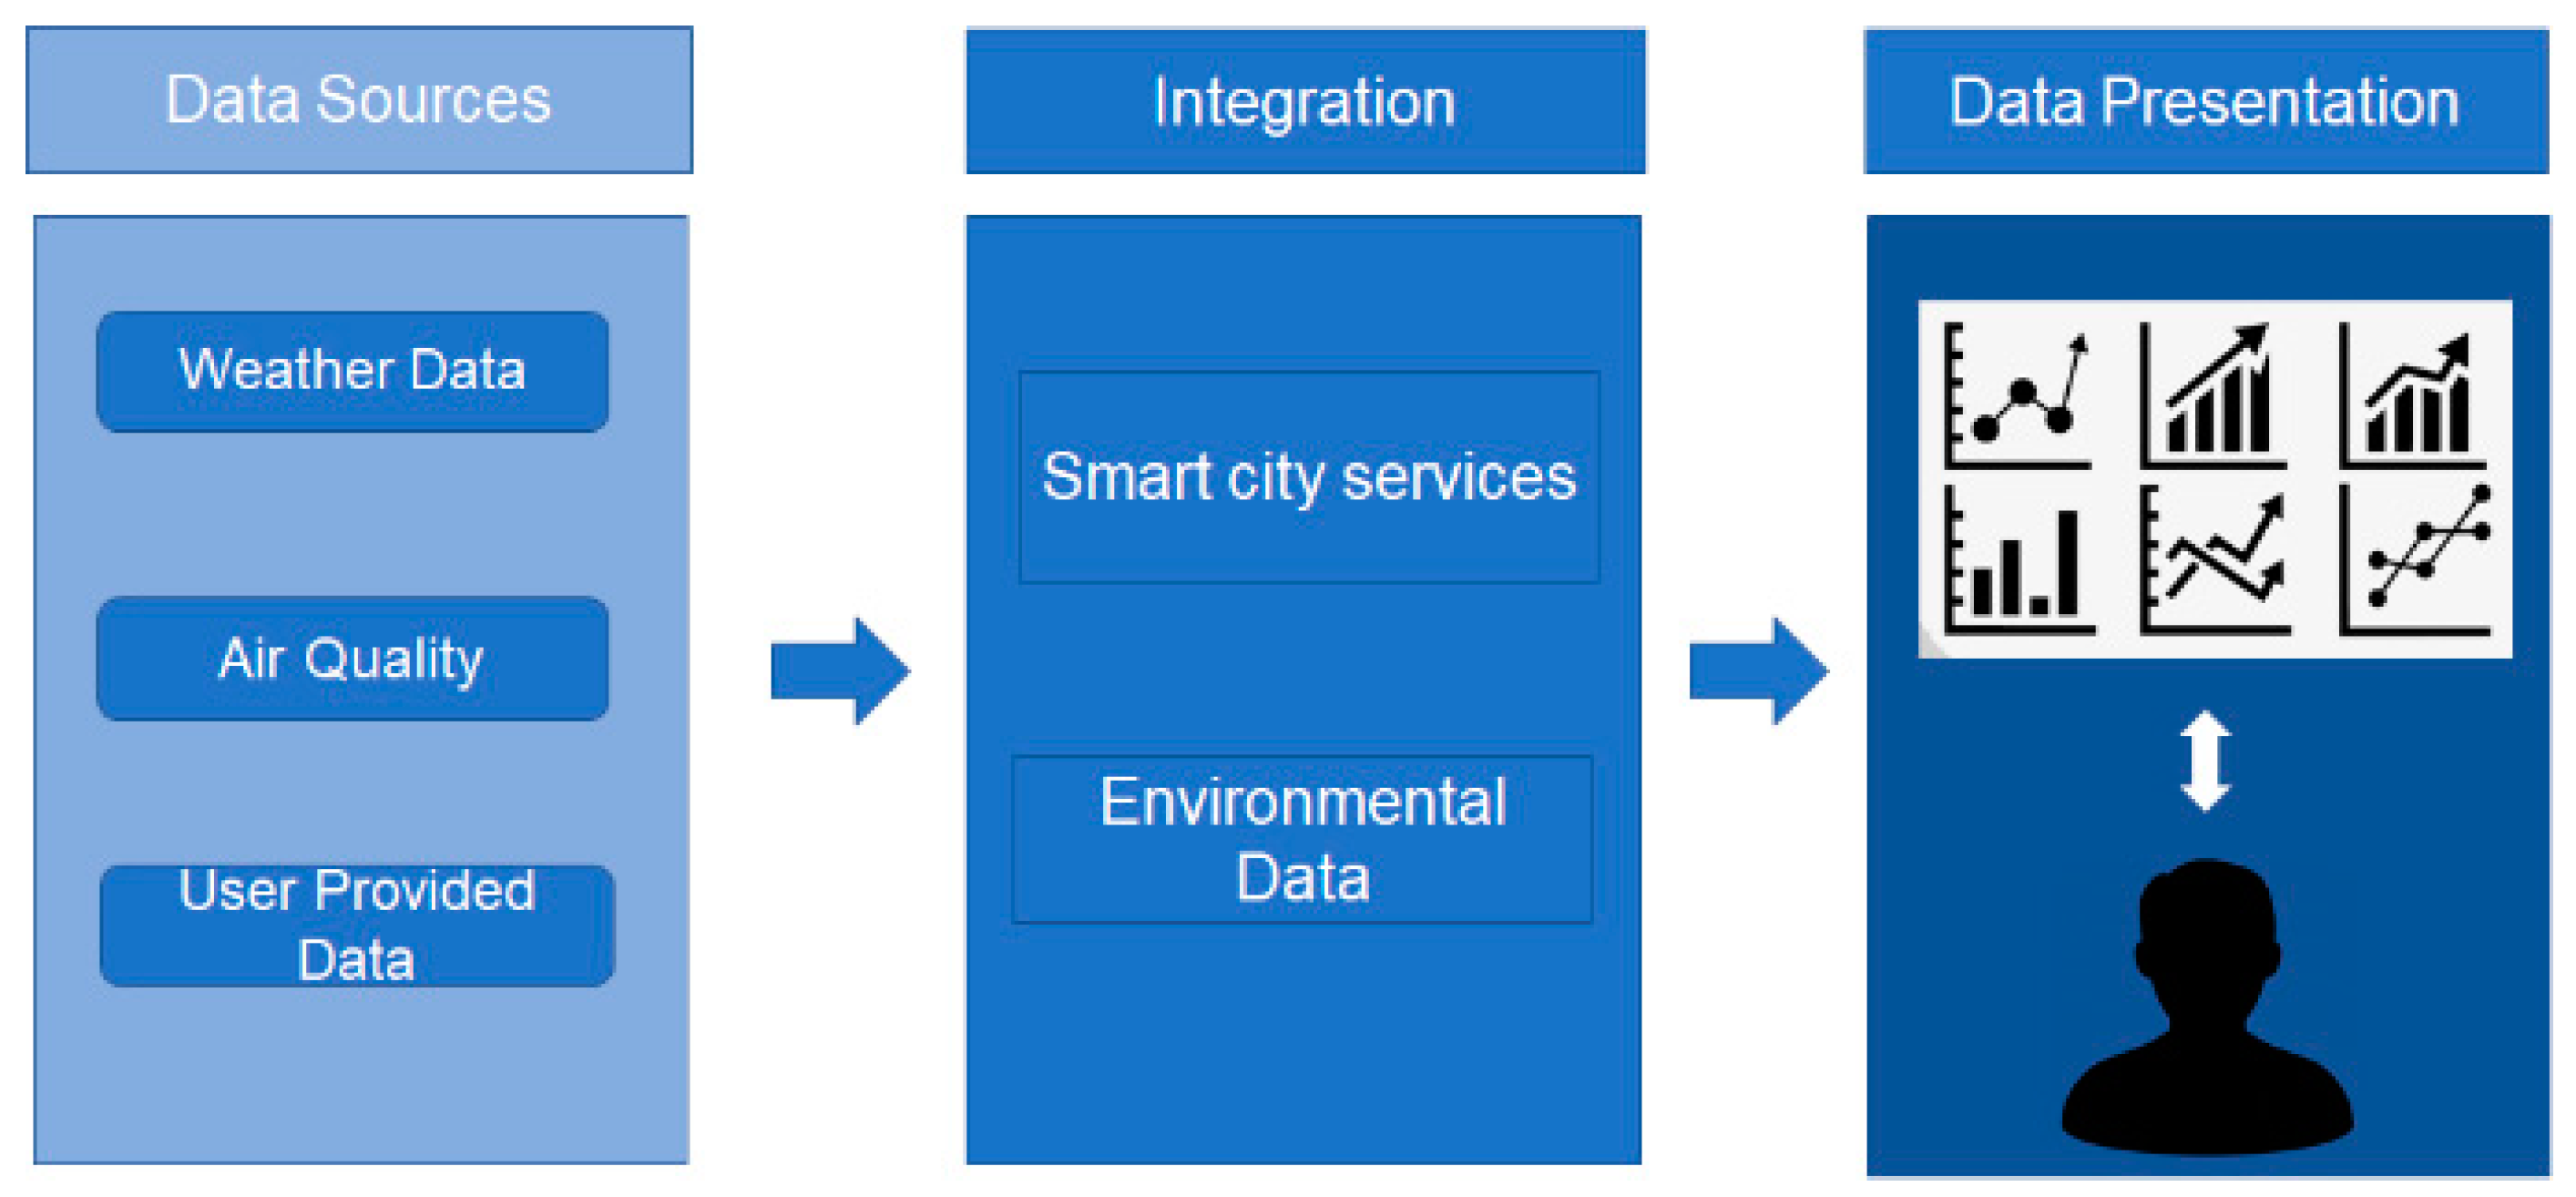
3.3.2. Application Development

The Green Commute application was developed in this phase based on the requirements collected in the previous stages. The application was developed by the authors with PHP on the server side, HTML, CSS, and JavaScript on the client side, and a MySQL database to store user data. The AWS (Amazon Web Services) Cloud9 IDE (integrated development environment) was used as the development platform. The following elements were included in the application:
  • The Google map direction service was used in the application to search for directions. The service takes in two places, and responds with the distance between two points, and the direction from the source to the destination. It also provides best possible routes for cars, public transport, cycling, and walking. JavaScript is used to send requests and processes the responses from the service. In order to get the distance between two places, the Google distance matrix service is used. This service provides the actual distance for different modes of transport between the source and the destination. The service helps determine the path covered by the user and the time to cover that distance using that transport.
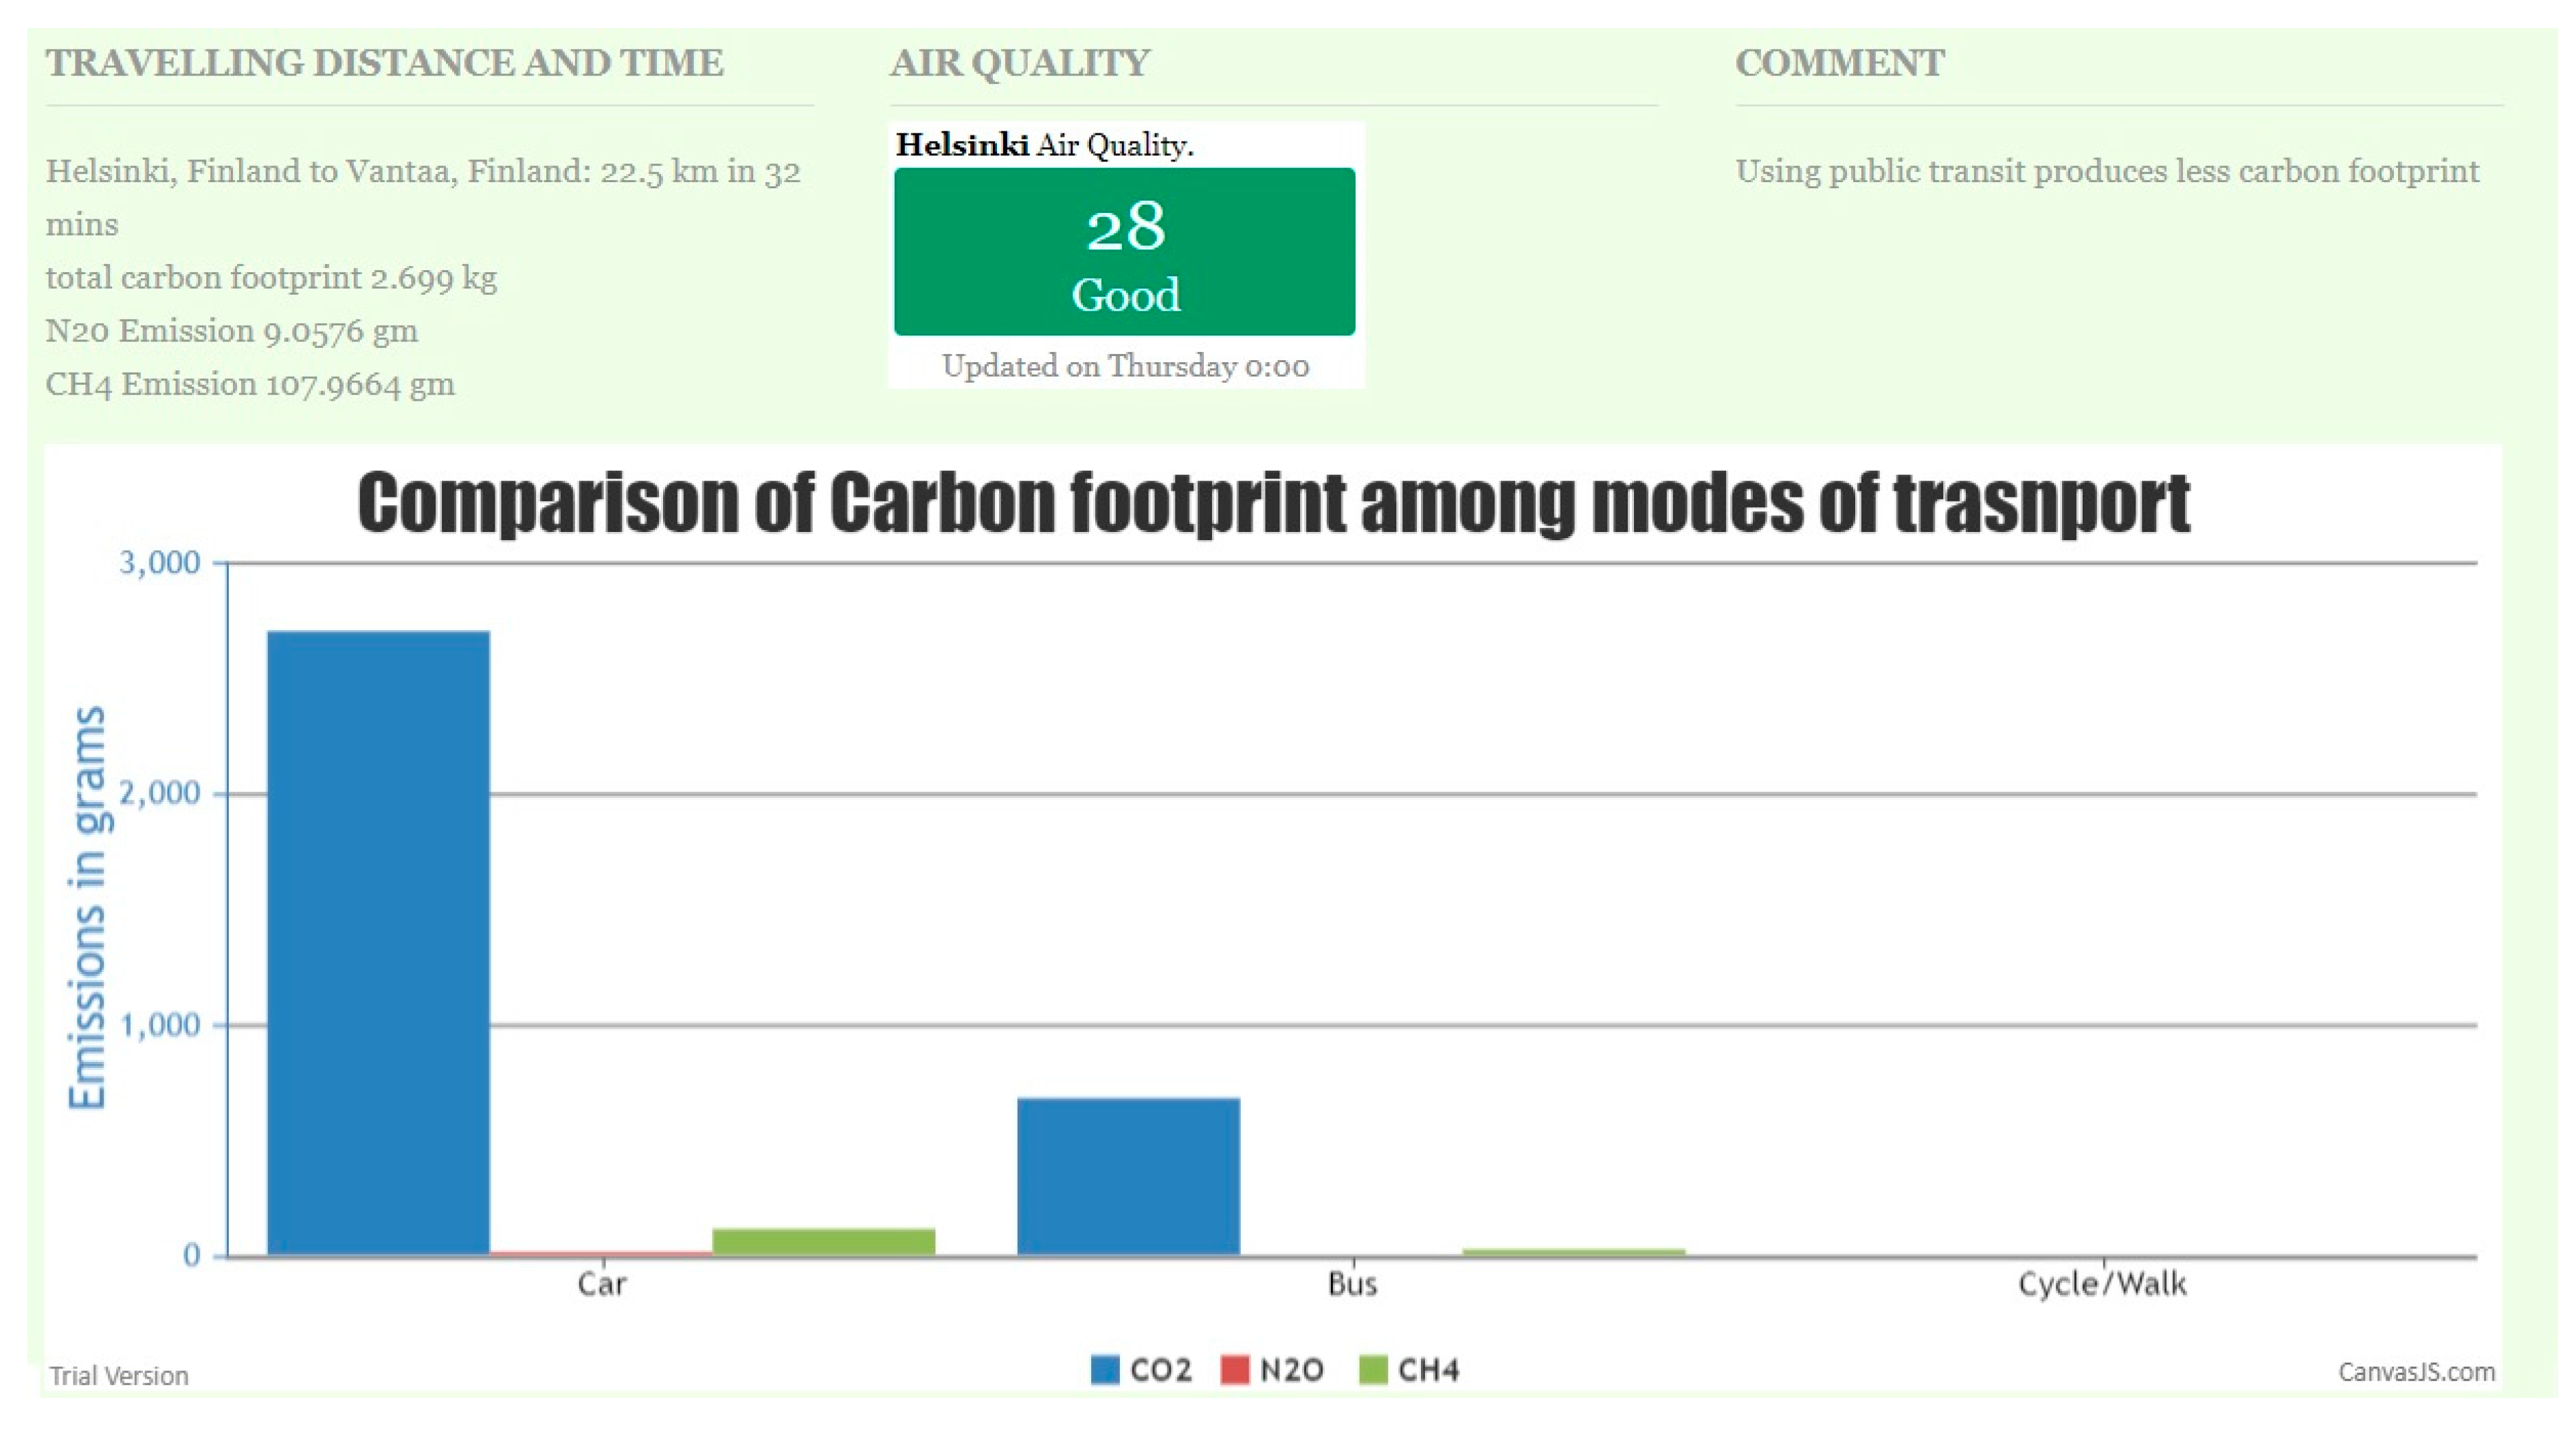
  • The air quality (aqicn.org/api/) API provides results according to the request sent from the users. It provides information on pollutants such as PM2.5, PM10, NO2, CO, SO2, and ozone. It can also provide air quality of a specific area if the correct latitude/longitude is given. The API provides air quality forecast for 3–8 days, along with world ranking and trends. A widget function is also provided where the condition of an area is shown with color codes and a value that notifies users with a health hazard if the air quality is in a certain range.
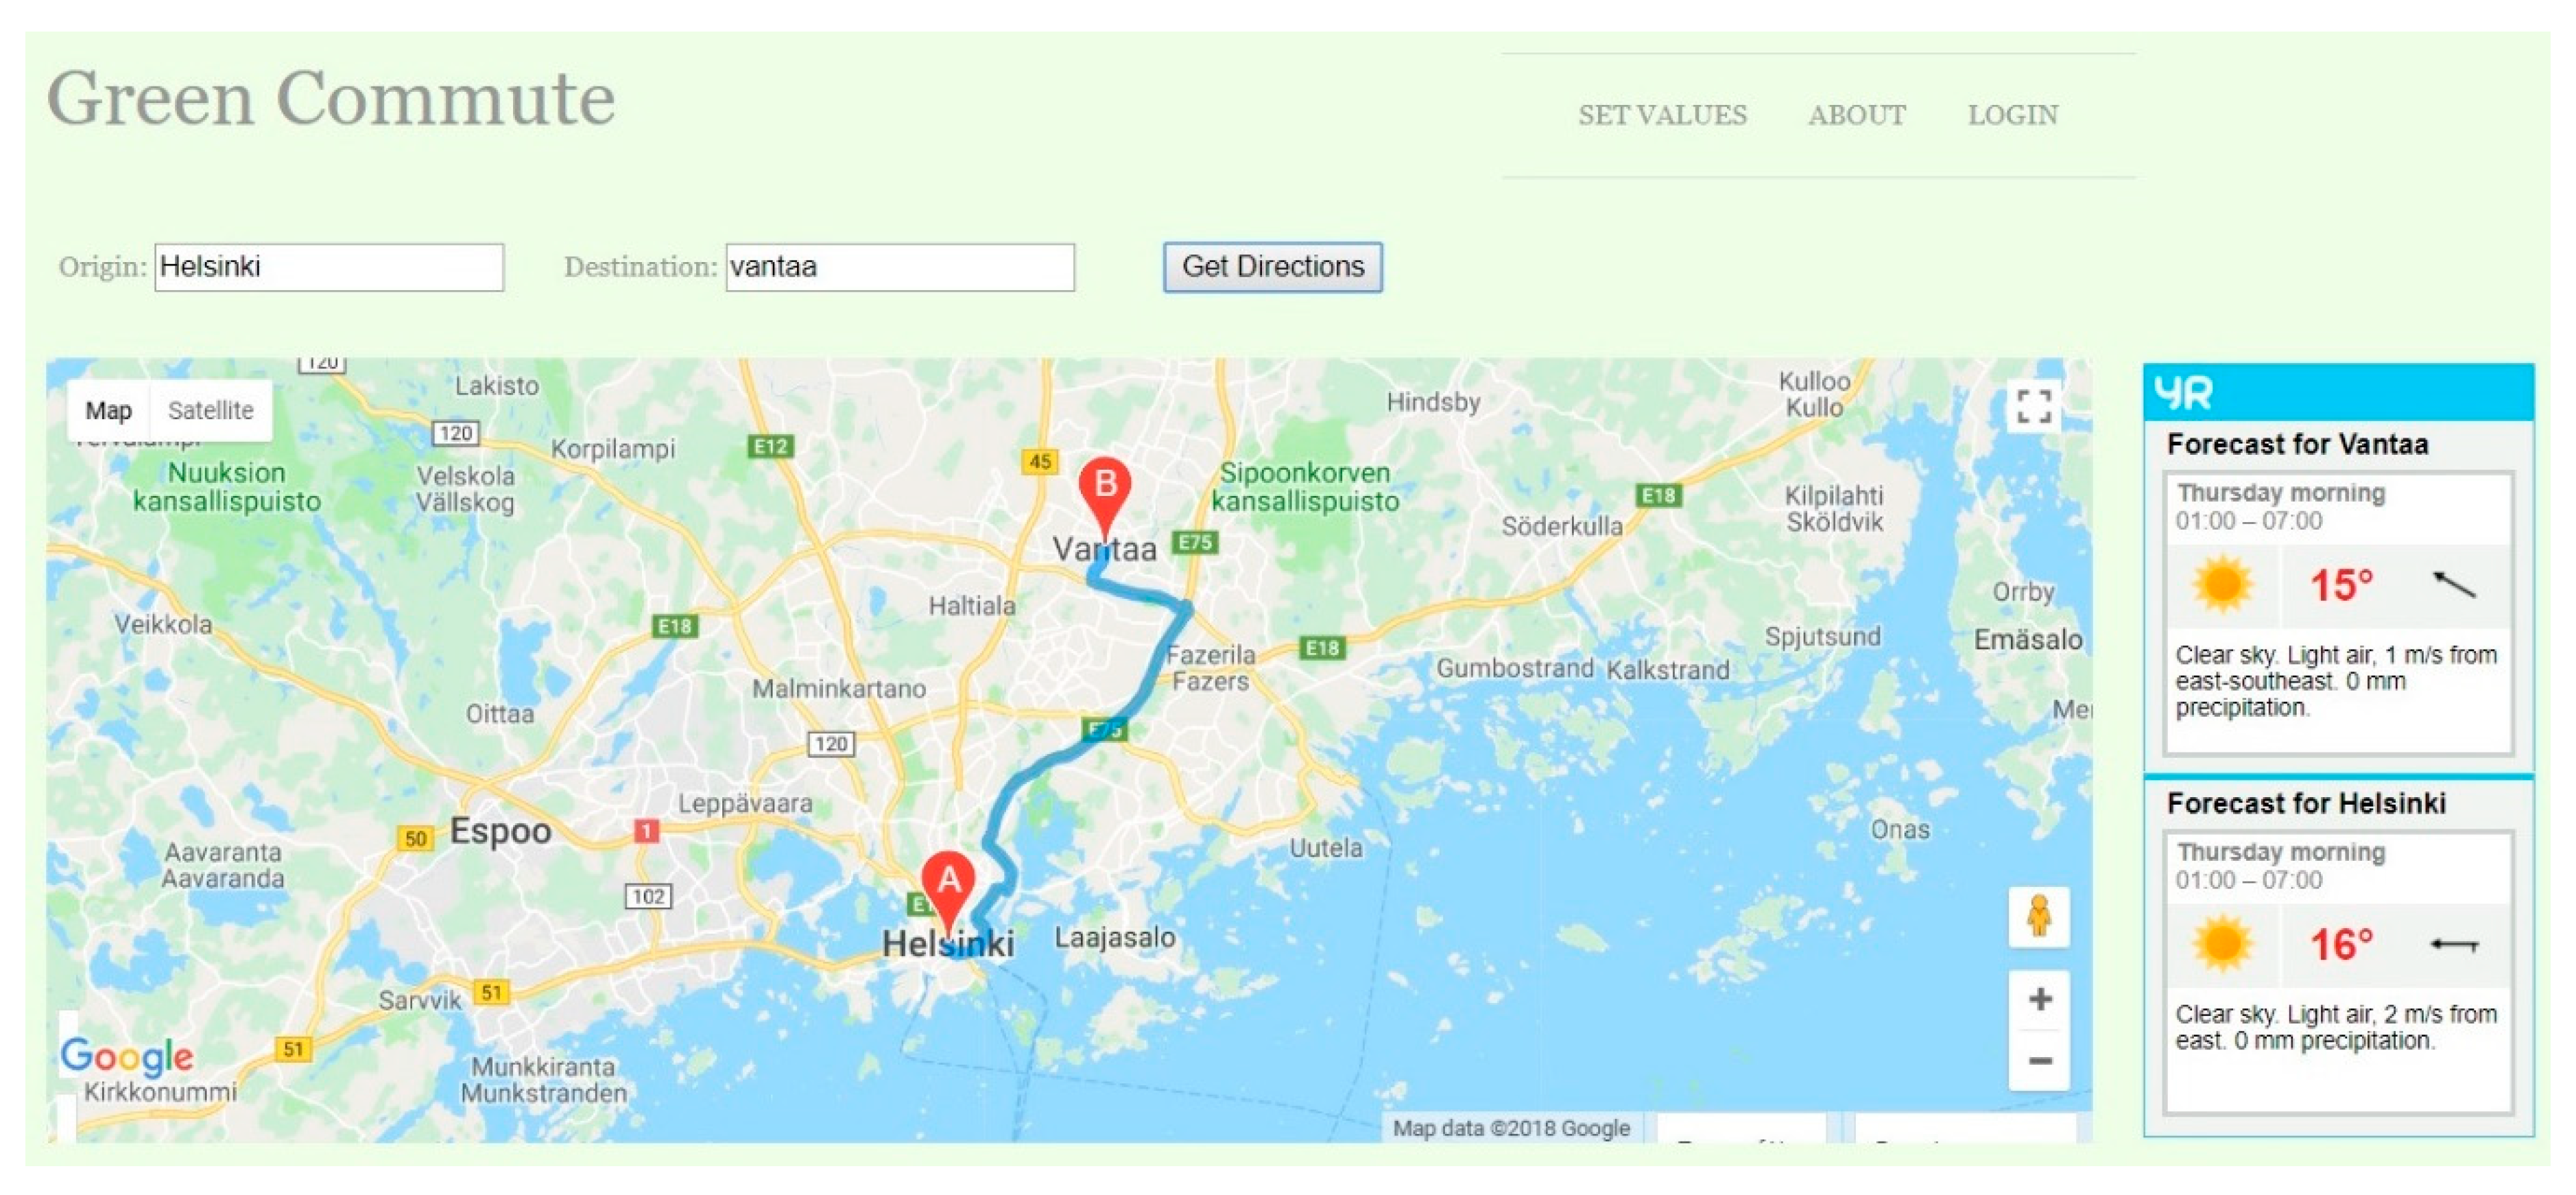
  • The weather API used was yr.no. It provides a weather forecast and a pollen forecast, and data on snow depths and forest fires in a given area. The idea to include a weather forecast in the transport application was to inform users on the road conditions, so they could choose their mode wisely. For example, they may choose to cycle to a place rather than drive if the weather is sunny.
  • The calculation of carbon footprint was done using two methods. In one method, average values of carbon emission factor were used, so that users who are not aware of their average mileage can easily get an average value of their carbon footprint. The average CO2 emission factor for passenger cars in Finland in 118 g/km. The calculation of total emission, which is considered equivalent to the carbon footprint, is done using the following equation:
    Carbon Footprint = Carbon emission factor × Distance covered by the vehicle.
On the other hand, the application also had the option for manually providing values, in which case the following formula was used [58]:
CO2 emissions from a gallon of gasoline = 2421 g × 0.99 × (44/12) = 8788 g = 8.8 kg/gallon;
Total Carbon footprint = (Total Distance/Kilometers per Gallon) × 8.8 kg/gallon.
Figure 6 presents the main landing page of the Green Commute web application. It resembles the main outlook of a Google map, while additionally providing special tabs in the top right corner. Users can write in their source and destination to get directions. Later, the weather forecast of both the source and the destination is presented in the right column and the best routes are presented on the map with a highlighted blue line. Users can log in or register to the system to store their journey and carbon footprint information. They can also set values such as fuel consumption or emission rates of their personal vehicles. The about section describes the methods and functionalities of the system.
The second section of the application is visualized in Figure 7. In this section, the details related to the journey are presented. It provides the time and distance of the journey. The air quality widget is also shown, enabling the users to understand the possible health hazards in the area. Clicking on the widget shows quantitative values of air pollutants in that area. A graph is also presented to view the possible air pollutant emitted by the mode of transport chosen by the user. This graph creates a connection with the air quality widget, as one shows the current situation and another shows the possible addition to the environment. The integration of such data is expected to make people living in the city understand their part in air pollution. The comment sections provide notes to users on their choice of mode to easily realize the environmentally friendly option to travel on the basis of carbon emission.

3.3.3. Evaluate User Experience with Green Commute App

In the last phase, the web application was evaluated by users in the target region. The application was shared through social media websites such as Facebook groups allowing people in Helsinki to use it. Later, a survey was made on their experience. According to Jakob Nielson, there are many ways to evaluate a user interface for an application; however, in most cases, due to a lack of time and experienced evaluators, researchers tend to do a heuristic evaluation. It is a good approach to identify cosmetic and functional problems of a system. The method does not require training users; they can simply find out their likes and dislikes just by looking at or using the application and then answering a set of question or giving points to particular features of the application [59]. To be more specific, a heuristic evaluation is a relaxed usability engineering method to evaluate user interfaces to detect issues with the system interface. Actually, to perform this evaluation, a set of design principles are followed [60]. In this research, to collect user experience, 10 design principles of Jakob Nielson were considered [56]. The principles are explained below.
  • Visibility of application status: The status of the application should always be visible to the users. It should provide appropriate replies within understandable time to keep them interested.
  • Correlation with the real world: The application should not visualize such content that cannot be correlated by the user with real-world context. It should produce results in common language with words, phrases, and ideas understandable to the user group, in a logical and natural order.
  • Access control and openness of users: It is common that users will make mistakes during their functions and will require a plainly stamped “emergency exit” to leave the unwanted state without roaming around the site unnecessarily. The application should support undo and redo.
  • Consistency and standards: It should not be the case that users have to investigate the meanings of the results and situations in different forms and actions that may have a similar meaning.
  • Error prevention: An application is much better when it acknowledges the problems and provides understandable error messages to the users. There should be confirmation messages before important actions being set in the system.
  • Acknowledgment instead of review: Limit the client’s memory stack by making items, activities, and alternatives unmistakable. Directions for utilization of the framework ought to be unmistakably or effortlessly retrievable at whatever point suitable.
  • Adaptability and effectiveness of utilization: Accelerators—concealed by novice users—may regularly accelerate communication for regular users with the end goal that the framework can take into account both unpracticed and experienced users. Enable clients to tailor visit activities.
  • Stylish and moderate plan: The comments and information should not contain irrelevant data. Irrelevant data mixed with actual information reduces the visibility of the results produced by the application, thus decreasing user appeal.
  • Support to identify, diagnose, and recover from errors: Messages to the users during an action or in the case of an error must be explained in simple language, directly indicating the problem with a possible solution.
  • Help and documentation: In most cases a good application would be one that does not require documentation. However, it is necessary to provide an explanation of the system to help users get across the application and receive the best results by following appropriate steps.
The principles were formulated into questions and statements during the evaluation period to receive the best results from the users. During the evaluation, the main target was to know more about the experience using the new idea of combining environmental data with a regular map application. Thus, rather than search out problems, it was more to justify the design approach.
The result of this research was achieved through two individual surveys. The first survey, which was part of the heuristic evaluation, was completed by 53 people living in the Helsinki region. The second one was a closed questionnaire conducted with eight developers working in the IT industry in Helsinki. Although the results of these surveys are part of the process, they are presented in the results section due to the fact that they evaluate the final outcome of the process.

4. Results and Discussion

Results of this work can be divided in two different categories: answers to the research questions (RQs) and the impact of the presented Green Commute application. These are further discussed in the subsequent subsections.

4.1. RQ1—How to Integrate Sustainability into Smart City Services by Following the Living Lab Methodology?

The living lab methodology used in this research followed the Form IT model proposed by [16]. The implementation of the model has been presented in previous section in detail for the development of the Green Commute web application. As presented in Figure 2 the stakeholders were actively engaged during the development process; first in concept development, then in prototyping and finally in application evaluation. Concerning the methodology used a set of 8 software developers and engineers were surveyed of the usability of the used Form IT model. The survey was conducted over online voice calling service. Their point of view is presented in the Figure 8. Based on the answers the approach would be useful to get attention of the people living in the city, as inhabitants of the city will be involved in the innovation and design and they can learn about the service beforehand its deployment. On the other hand, it is expected from the respondents that the developers or engineers would have to give special attention and need extra training to follow this process to develop sustainable smart city services.

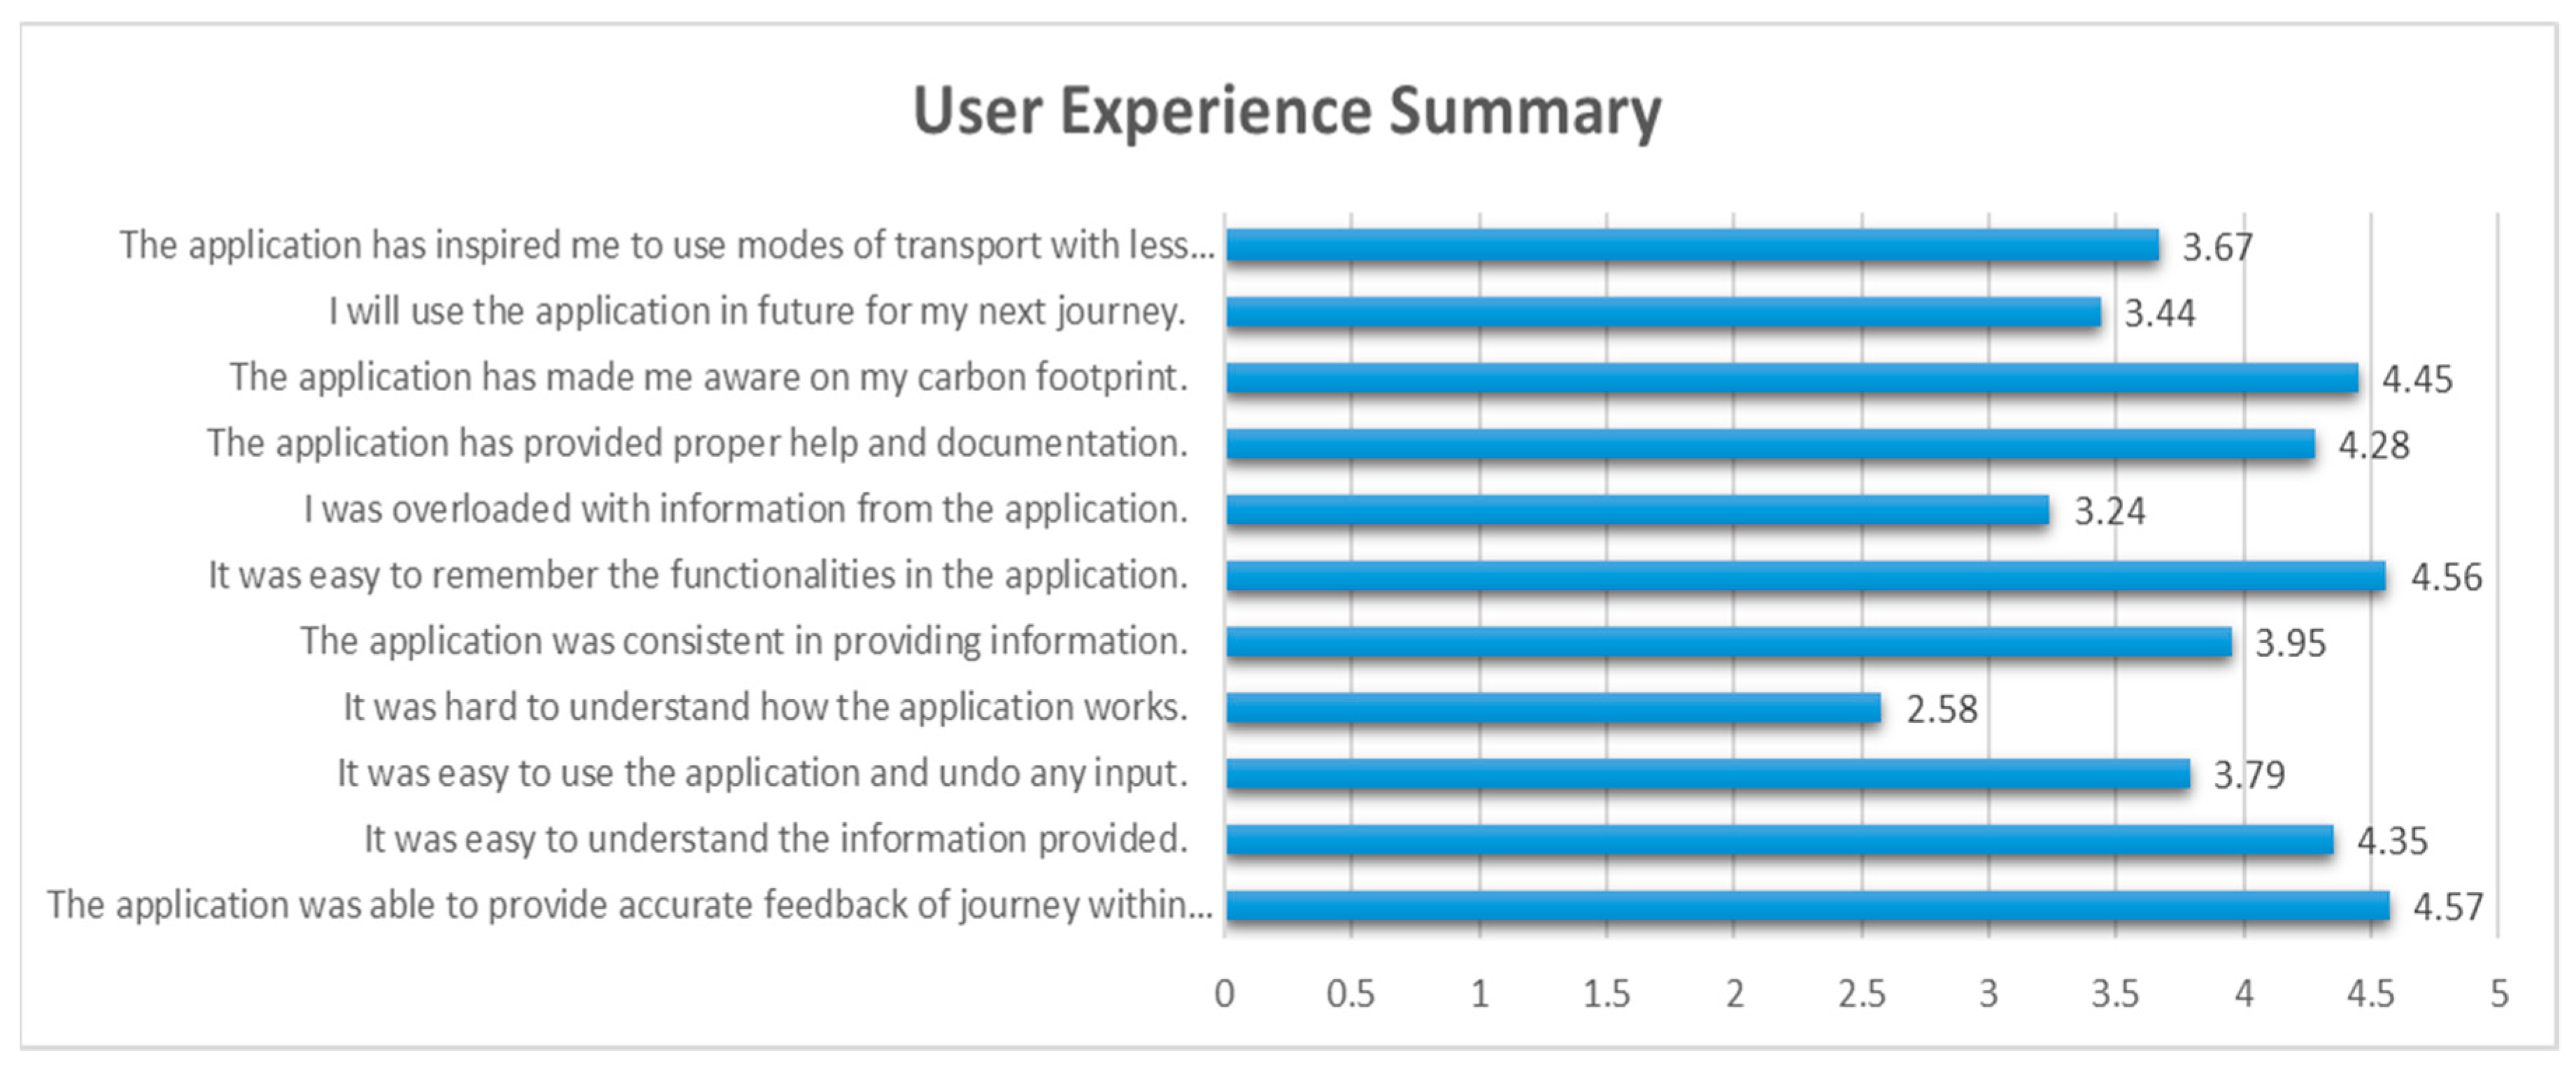
4.2. RQ2—What Is the Experience of the Users in Terms of Viewing Environmental Data in the Case of the Service Presented in This Research?

The second research question focuses on the experiences of the users with the actual application and their improved sustainability knowledge. Figure 9 explains the overall user experience with the developed application, which represents the combination of environmental data with the smart city application. Users were given a set of 11 statements, and they had choices to mark the statements on five levels based on their feelings regarding the application—level 1, strongly disagree; level 2, disagree; level 3, neutral; level 4, agree; level 5, strongly agree. According to the design principles explained earlier, a system should provide information within a reasonable amount of time and, from the summary, it can be inferred that most users agreed that the feedback on the journey was received in time. Although users had a neutral feeling about the access control of the application, they agreed that the information provided was easy to understand. The application also had good correlation with the real world and it was developed with inspiration from a map application. Thus, it was not hard to understand the work procedure of the application, and the users disagreed on the statement that the application was tough to follow. The consistency of the application was also admirable, as users agreed that it was understandable, as the results of the service depend on various open source APIs, which have their own criteria and specification of providing information. Later, it could be perceived that users were positive in recalling the functionalities of the application and its resources. Alongside user experience, it was also verified whether the idea of such a service would be helpful to allow inhabitants of the city to choose a better mode of transport in terms of environment sustainability, and most users were positive in this regard.

4.3. Impact of the Green Commute Application and Sustainability

Although it was impossible within the timeframe of the research to evaluate the long-term impact of the Green Commute application as such, it was still possible to see the effect of environmental data on the users participating in the evaluation process. Alongside user experience, respondents were also asked to choose, according to them, the most effective feature to motivate them to select the mode of transport with low carbon emissions. The Green Commute application has four features that passively motivate sustainable behavior: different data types on the surrounding environment, comparison among different modes of transport according to their quantity of air pollutant emission, social sharing of personal choice, and comments provided through the system. It is noticeable from Figure 10 that users tend to actualize real data and comparisons rather than social sharing and static comments. They prefer visualization of pollutant levels for different modes; as the graphical representation used in the system was best suited for both experienced and inexperienced users, the result was obvious.
The sustainability effect can be seen from two different dimensions: sustainability of the application and sustainability through the application. Sustainability in software can present itself in different ways. A sustainable software has to endure changes in circumstances, as well as having good effects in the long run. Sustainability in software does not concern only the environment; it also has effects on individuals and society. In addition, technical sustainability is a concern in software systems to ensure their endurance. In general, software practitioners tend to focus on ensuring long-term service of the software [61]. It is inevitable that software systems have great impact on our daily life. It can be expected that the three dimensions of sustainability, (social, economic, and environmental) are likely to be affected by it [62]. Although desirable, the sustainability of the Green Commute application was not the main perception in this work; rather, the goal was to enable the effects of the Green Commute application.
The sustainability impact of software can be analyzed using the Becker et al. (2016) model [61]. The model has five dimensions for analyzing impact: economic, technical, environmental, social, and individual. The impacts are categorized into three sections: immediate, enabling, and structural. The web application was expected to be used individually by users in their daily life as they use their map applications; thus, it can be assumed that it will have an immediate effect on people. The application also provides information on the environment, which increases personal knowledge. Thus, the immediate impact of the service is that it provides environmental information depending on the choice of journey. Therefore, it enables users to choose modes of transport with fewer carbon emissions, thereby reducing their individual carbon footprints. Moreover, the structural impact would lead to a sustainable lifestyle. Then, with the increase in personal knowledge, people living in the society would become conscious of the social impact of low-carbon-emission transport, which, in the long run, may lead to a more sustainable community. Economic sustainability can be achieved as this service enable users to make a choice from personal vehicle, public transport, cycling, or walking, through which money can be saved. Maintaining such activity over the long term may also have an impact on increasing the use of public transport, thus increasing government revenue. Although the environmental impact is passive, due to its dependence on user motivation, increasing personal awareness is an immediate effect on environmental endurance. Technically, the application also remains sustainable, through its use of modular architecture. Additional data APIs and sources can be integrated with the application to modify or update the service.

5. Conclusions

In terms of the previous findings discussed in Section 2 of this paper, it was highlighted that a lack of awareness of existing smart city applications is a major drawback in achieving sustainability through smart city services. The use of individual applications for different tasks and getting familiar with them was also one of the hurdles. Therefore, user experiences show that people can easily understand the functioning of such services and are not interrupted in their daily tasks. In the future, this may influence them to use sustainable services regularly. Smart city services can be designed in many ways; however, it is a challenge to integrate sustainability, specifically with regards to environmental data, into these services. Researchers followed an innovative approach to design the service involving stakeholders who, in this case, were inhabitants living in a smart city. In each step of the process, acceptability of the service was considered by following standard design guidelines and taking user perception into account.
The process shifted from the traditional stages of software development and involved future users in the development process. This thesis shows an overall path from requirement analysis to testing the smart city service with real users. It helps understand the perspective of people living in the city toward sustainability. In the beginning, many were unaware of the effect of carbon footprint, despite having a basic concept of it. Throughout this process, by involving them in the system development and by integrating environmental data into the smart city service, their acceptance was impacted through additional data along with information on regular transportation services. The findings that can be passed on for future reference would be three key factors in designing sustainable smart city services.
  • Firstly, referring to an earlier chapter, people living in the city are considered as the main users of smart city services. Therefore, users should be involved in the development process in an active manner.
  • Secondly, prototyping from the very early stage is necessary when dealing with novice users. It is easy for them to understand the target and provide valuable feedback for the future product.
  • Thirdly, evaluation from users at each step or each rotation helps acquire knowledge of the service, such as good features, bad designs, what is needed, and what is not.
The research focused on the acceptability of the service by following standard design guidelines and taking user perception into account in each step of the process. It contributed to the field by infusing sustainability into smart city services. Combining environmental data with regular smart city services is a new approach for informing citizens of the emerging natural occurrences. People are more attracted to visual representations than static information. Therefore, the application provided important data for inexperienced users in an easy and understandable way, which was well appreciated. All in all, the quality experience of the application’s functionalities was achievable by taking into measure appropriate guidelines for understanding user requirements throughout the process.
As discussed earlier, the research focused on presenting an idea of bringing together smart city services and services or data sources related to the environment. Although the demonstration of the service centered on the transportation system of a city, the research can be deployed for other areas of a smart city. For instance, in the case of smart buildings or houses, different data sources can be used to provide house residents on their daily activities to take on sustainable decisions. In addition to combining these two different services with individual functionalities, the research also focused on adapting the user involvement approach known as the living lab methodology. By following this methodology, the idea was successfully implemented; however, there were some issues that bounded the research. The inclusion of inhabitants of Helsinki city was not consistent and it was not possible to include many users. The assumptions made in the results point to a small number of people, and a larger number of participants could have ensured appealing results. On the other hand, a limited number of data sources were used in the final developed service. The selection of data sources or services depends on the features they provide, and whether those services can be integrated into the application to provide understandable results. Dependency on the availability of these services limited the application to providing only information regarding transportation and air quality.

Author Contributions

Conceptualization, J.P.; Data curation, M.T.A.; Funding acquisition, M.T.A.; Investigation, M.T.A.; Methodology, M.T.A. and J.P.; Project administration, M.T.A. and J.P.; Resources, M.T.A.; Supervision, J.P.; Validation, J.P.; Visualization, M.T.A.; Writing—original draft, M.T.A.; Writing—review and editing, M.T.A. and J.P.

Funding

This research was funded by the Erasmus Mundus PERCCOM Program of the European Union grant number PERCCOM—FPA 2013-0231 [63].

Acknowledgments

The research idea was initially given by Ahmed Seffah of Lappeenranta University of Technology. Later, the research shifted its course to a new perspective and was carried out by the authors. Special thanks are given to Annika Wolff and Shola for their valuable input to this research.

Conflicts of Interest

The authors declare no conflict of interest.

References

  1. United Nations. Department of Economic and Social Affairs, Population Division. In The World’s Cities in 2016—Data Booklet (ST/ESA/SER.A/392); United Nations: New York, NY, USA, 2016. [Google Scholar]
  2. Harrison, C.; Eckman, B.; Hamilton, R.; Hartswick, P.; Kalagnanam, J.; Paraszczak, J.; Williams, P. Foundations for Smarter Cities. IBM J. Res. Dev. 2010, 54, 1–16. [Google Scholar] [CrossRef]
  3. Komeily, A.; Srinivasan, R. Sustainability in Smart Cities: Balancing Social, Economic, Environmental, and Institutional Aspects of Urban Life. In Smart Cities: Foundations, Principles, and Applications; John Wiley & Sons, Inc.: Hoboken, NJ, USA, 2018; pp. 503–534. [Google Scholar]
  4. Penzenstadler, B.; Bauer, V.; Calero, C.; Franch, X. Sustainability in Software Engineering: A Systematic Literature Review. In Proceedings of the 16th International Conference on Evaluation & Assessment in Software Engineering (EASE), Ciudad Real, Spain, 14–15 May 2012; pp. 32–41. [Google Scholar]
  5. Trindade, E.P.; Hinnig, M.P.F.; da Costa, E.M.; Marques, M.J.; Bastos, R.C.; Yigitcanlar, T. Sustainable development of smart cities: A systematic review of the literature. J. Open Innov. Technol. Mark. Complex. 2017, 3, 11. [Google Scholar] [CrossRef]
  6. Afgan, N. Sustainability assessment of hydrogen energy systems. Int. J. Hydrogen Energy 2004, 29, 1327–1342. [Google Scholar] [CrossRef]
  7. Lee, J.H.; Hancock, M.G.; Hu, M.-C. Towards an effective framework for building smart cities: Lessons from Seoul and San Francisco. Technol. Forecast. Soc. Chang. 2014, 89, 80–99. [Google Scholar] [CrossRef]
  8. Yeh, H. The effects of successful ICT-based smart city services: From citizens’ perspectives. Gov. Inf. Q, 2017, 34, 556–565. [Google Scholar] [CrossRef]
  9. Palacin-Silva, M. Understanding Civic Participation in Environmental Sensing. In Proceedings of the Extended Abstracts of the 2018 CHI Conference on Human Factors in Computing Systems-CHI ’18, Montreal, QC, Canada, 21–26 April 2018; p. DC16. [Google Scholar]
  10. Gascó, M. Living labs: Implementing open innovation in the public sector. Gov. Inf. Q. 2017, 34, 90–98. [Google Scholar] [CrossRef]
  11. Sørensen, E.; Torfing, J. Enhancing Collaborative Innovation in the Public Sector. Admin. Soc. 2011, 43, 842–868. [Google Scholar] [CrossRef]
  12. Schaffers, H.; Turkama, P. Living Labs for Cross-Border Systemic Innovation. Technol. Innov. Manag. Rev. 2012, 2, 25–30. [Google Scholar] [CrossRef]
  13. Tran, T.; Saguna, S.; Droegehorn, O.; Porras, J. Visualizing captured user activities in relation to energy use-An Approach for Motivating and Aiding People to Change Their Behavior to be More Sustainable. In Proceedings of the International SEEDS Conference, Leeds, UK, 13–14 September 2017. [Google Scholar]
  14. Dameri, R.P.; Cocchia, A. Smart City and the Digital City: Twenty Years of Terminology Evolution. Proceedings Itais 2013. Available online: http://www.cersi.it/itais2013/pdf/119.pdf (accessed on 29 October 2018).
  15. Benevolo, C.; Dameri, R.; D’Auria, B. Smart Mobility in Smart City. In Lecture Notes in Information Systems and Organisation; Springer: Cham, Switzerland, 2015; pp. 13–28. [Google Scholar]
  16. Ståhlbröst, A.; Holst, M. The Living Lab Methodology Handbook; Vinnova: Lulea, Sweden, 2012. [Google Scholar]
  17. Novotný, R.; Kuchta, R.; Kadlec, J. Smart City Concept, Applications and Services. J. Telecommun. Syst. Manag. 2014, 3, 117. [Google Scholar] [CrossRef]
  18. Hendy, M.; Miniaoui, S.; Atalla, S.; Hashim, K. A survey on smart city technologies, initiatives and global technology providers. In Proceedings of the Second International Conference on Internet of things, Data and Cloud Computing, Cambridge, UK, 22–23 March 2017; p. 84. [Google Scholar]
  19. Anttiroiko, A.; Valkama, P.; Bailey, S. Smart cities in the new service economy: Building platforms for smart services. AI Soc. 2013, 29, 323–334. [Google Scholar] [CrossRef]
  20. Eger, J.M. Smart growth, smart cities, and the crisis at the pump a worldwide phenomenon. J. E-Gov. Policy Regul. 2009, 32, 47–53. [Google Scholar]
  21. Hollands, R. Will the real smart city please stand up? City 2008, 12, 303–320. [Google Scholar] [CrossRef]
  22. Marsal-Llacuna, M.; Colomer-Llinàs, J.; Meléndez-Frigola, J. Lessons in urban monitoring taken from sustainable and livable cities to better address the Smart Cities initiative. Technol. Forecast. Soc. Chang. 2015, 90, 611–622. [Google Scholar] [CrossRef]
  23. Albino, V.; Berardi, U.; Dangelico, R. Smart Cities: Definitions, Dimensions, Performance, and Initiatives. J. Urban Technol. 2015, 22, 3–21. [Google Scholar] [CrossRef]
  24. Elmaghraby, A.S.; Losavio, M.M. Cyber security challenges in Smart Cities: Safety, security and privacy. J. Adv. Res. 2014, 5, 491–497. [Google Scholar] [CrossRef] [PubMed]
  25. Alkhelaiwi, A.; Grigoras, D. The Origin and Trustworthiness of Data in Smart City Applications. In Proceedings of the IEEE/ACM 8th International Conference on Utility and Cloud Computing, Limassol, Cyprus, 7–10 December 2015; pp. 376–382. [Google Scholar]
  26. Chesbrough, H. Open Innovation: The New Imperative from Creating and Profiting from Technology; Harvard Business School Press: Boston, MA, USA, 2006. [Google Scholar]
  27. Mergel, I. Opening government. Designing open innovation processes to collaborate with external problem solvers. Soc. Sci. Comput. Rev. 2015, 33, 599–612. [Google Scholar] [CrossRef]
  28. Chesbrough, H. The era of open innovation. MIT Sloan Manag. Rev. 2003, 44, 35–41. [Google Scholar]
  29. Veeckman, C.; Schuurman, D.; Leminen, S.; Westerlund, M. Linking Living Lab Characteristics and Their Outcomes: Towards a Conceptual Framework. Hdl.handle.net. 2013. Available online: http://hdl.handle.net/1854/LU-4217623 (accessed on 20 April 2018).
  30. Westerlund, M.; Leminen, S.; Kortelainen, M.J. A Recipe for Innovation through Living Lab Networks. In Proceedings of the XXIII ISPIM Conference, Barcelona, Spain, 17–20 June 2012; p. 1. [Google Scholar]
  31. Serra, A. Three problems concerning living labs: A European point of view. Revista Iberoamericana de Ciencia Tecnología y Sociedad 2013, 8, 283–298. (In Spanish) [Google Scholar]
  32. Manzini, E.; Staszowski, E. Public and Collaborative. Exploring the Intersection of Design, Social Innovation and Public Policy. United States of America. 2013. (DESIS Network). Available online: http://nyc.pubcollab.org/files/DESIS_PandC_Book.pdf (accessed on 29 October 2018).
  33. Eriksson, M.; Niitamo, V.; Kulkki, S. State-of-the-Art in Utilizing Living Labs Approach to User-Centric ICT Innovation—A European Approach; Luleå Univeristy of Technology: Lulea, Sweden, 2005; pp. 1–13. [Google Scholar]
  34. BERGVALL-KÅREBORN, B.; Hoist, M.; Ståhlbröst, A. Concept design with a Living Lab approach. In Proceedings of the 42nd Hawaii International Conference on System Sciences, Big Island, HI, USA, 5–8 January 2009; pp. 1–10. [Google Scholar]
  35. Følstad, A. Towards a living lab for the development of online community services. Electron. J. Org. Virtualness 2008, 10, 47–58. [Google Scholar]
  36. Svensson, J.; Eriksson, C.; Ebbesson, E. User contribution in innovation processes—Reflections from a Living Lab perspective. In Proceedings of the 43rd Hawaii International Conference on System Sciences, Honolulu, HI, USA, 5–8 January 2010; pp. 1–10. [Google Scholar]
  37. Report of the World Commission on Environment and Development: Our Common Future. Available online: http://www.un-documents.net/our-common-future.pdf (accessed on 29 October 2018).
  38. Höjer, M.; Wangel, J. Smart Sustainable Cities: Definition and Challenges. In ICT Innovations for Sustainability, Advances in Intelligent Systems and Computing; Springer: Cham, Switzerland, 2015; pp. 333–349. [Google Scholar]
  39. Hiremath, R.; Balachandra, P.; Kumar, B.; Bansode, S.; Murali, J. Indicator-based urban sustainability—A review. Energy Sustain. Dev. 2013, 17, 555–563. [Google Scholar] [CrossRef]
  40. Castells, M. Urban sustainability in the information age. City 2000, 4, 118–122. [Google Scholar] [CrossRef]
  41. Morse, S.; Fraser, E.D. Making ‘dirty’ nations look clean? The nation state and the problem of selecting and weighting indices as tools for measuring progress towards sustainability. Geoforum 2005, 36, 625–640. [Google Scholar] [CrossRef]
  42. Hardi, P.; Zdan, T. Assessing Sustainable Development: Principles in Practice; The International Institute for Sustainable Development: Winnipeg, MB, Canada, 1997. [Google Scholar]
  43. SSCC-CG Final Report Smart and Sustainable Cities and Communities Coordination Group. Available online: https://studylib.net/doc/14899179/sscc-cg-final-report-smart-and-sustainable-cities-and-com... (accessed on 29 October 2018).
  44. Caragliu, A.; Del Bo, C.; Nijkamp, P. Smart Cities in Europe. J. Urban Technol. 2011, 18, 65–82. [Google Scholar] [CrossRef]
  45. Ahvenniemi, H.; Huovila, A.; Pinto-Seppä, I.; Airaksinen, M. What are the differences between sustainable and smart cities? Cities 2017, 60, 234–245. [Google Scholar] [CrossRef]
  46. “Greenhouse Gas Emissions from Transport”, European Environment Agency, 2018. Available online: https://www.eea.europa.eu/data-and-maps/indicators/transport-emissions-of-greenhouse-gases/transport-emissions-of-greenhouse-gases-10 (accessed on 1 April 2018).
  47. Pandey, D.; Agrawal, M.; Pandey, J. Carbon footprint: Current methods of estimation. Environ. Monit. Assess. 2010, 178, 135–160. [Google Scholar] [CrossRef] [PubMed]
  48. Brewer, R. Literature Review on Carbon Footprint Collection and Analysis. Available online: https://www.researchgate.net/profile/Robert_Brewer/publication/238622341_Literature_Review_on_Carbon_Footprint_Collection_and_Analysis/links/00463537a6f85e5cdc000000.pdf (accessed on 29 October 2018).
  49. Finkbeiner, M. Carbon foot printing—Opportunities and threats. Int. J. Life Cycle Assess. 2009, 14, 91–94. [Google Scholar] [CrossRef]
  50. Wiedmann, T.; Minx, J. A Definition of Carbon Footprint; ISAUK Research Report 07-01; ISAUK Research & Consulting: Durham, UK, 2007. [Google Scholar]
  51. Piecyk, M.; McKinnon, A. Forecasting the carbon footprint of road freight transport in 2020. Int. J. Prod. Econ. 2010, 128, 31–42. [Google Scholar] [CrossRef]
  52. Peng, G.; Nunes, M.; Zheng, L. Impacts of low citizen awareness and usage in smart city services: The case of London’s smart parking system. Inf. Syst. e-Bus. Manag. 2016, 15, 845–876. [Google Scholar] [CrossRef]
  53. Steen, K.; Bueren, E.V. Urban Living Labs: A Living Lab Way of Working; AMS Institute: Amsterdam, The Netherlands, 2017. [Google Scholar]
  54. Billestrup, J.; Stage, J.; Bruun, A.; Nielsen, L.; Nielsen, K. Creating and Using Personas in Software Development: Experiences from Practice; Springer: Berlin/Heidelberg, Germany, 2018. [Google Scholar]
  55. Arnowitz, J.; Arent, M.; Berger, N. Effective Prototyping for Software Makers; Elsevier Science: Amsterdam, The Netherlands, 2007. [Google Scholar] [CrossRef]
  56. “10 Heuristics for User Interface Design: Article by Jakob Nielsen”, Nielsen Norman Group, 2018. Available online: https://www.nngroup.com/articles/ten-usability-heuristics/ (accessed on 1 May 2018).
  57. Sears, A.; Hess, D. Cognitive Walkthroughs: Understanding the Effect of Task-Description Detail on Evaluator Performance. Int. J. Hum.-Comput. Interact. 1999, 11, 185–200. [Google Scholar] [CrossRef]
  58. Emission Facts: Average Carbon Dioxide Emissions Resulting from Gasoline and Diesel Fuel; United States Environmental Protection Agency: Washington, DC, USA, 2005.
  59. Nielsen, J.; Molich, R. Heuristic evaluation of user interfaces. In Proceedings of the SIGCHI Conference on Human Factors in Computing Systems Empowering People-CHI ’90, Seattle, DC, USA, 1–5 April 1990. [Google Scholar]
  60. Nielsen, J. Heuristic evaluation. In Usability Inspection Methods; Nielsen, J., Mack, R.L., Eds.; John Wiley & Sons: New York, NY, USA, 1994; pp. 25–64. [Google Scholar]
  61. Becker, C.; Betz, S.; Chitchyan, R.; Duboc, L.; Easterbrook, S.; Penzenstadler, B.; Seyff, N.; Venters, C. Requirements: The Key to Sustainability. IEEE Softw. 2016, 33, 56–65. [Google Scholar] [CrossRef]
  62. Penzenstadler, B. Software Engineering for Sustainability (SE4S) Habilitation. Available online: http://web.csulb.edu/~bpenzens/pdf/2015-01_Habil_Penzenstadler.pdf (accessed on 29 October 2018).
  63. Porras, J.; Seffah, A.; Rondeau, E.; Andersson, K.; Klimova, A. PERCCOM: A Master Program in Pervasive Computing and COMmunications for Sustainable Development. In Proceedings of the 29th IEEE Conference on Software Engineering Education and Training, Dallas, TX, USA, 6–8 April 2016. [Google Scholar]
Figure 1. Different application areas in a smart city [17].
Technologies 06 00099 g001
Figure 2. Diagram of the process (adapted from the Form IT model) [16].
Technologies 06 00099 g002
Figure 3. Dimensions of sustainability versus areas in a smart city [3].
Technologies 06 00099 g003
Figure 4. Preliminary concept of the smart city service.
Technologies 06 00099 g004
Figure 5. Digital protype of the sustainable smart city service.
Technologies 06 00099 g005
Figure 6. Sustainable smart city service in the form of the Green Commute application.
Technologies 06 00099 g006
Figure 7. Sustainable smart city service in the form of the Green Commute application.
Technologies 06 00099 g007
Figure 8. Perspective from Software Professionals on the method.
Technologies 06 00099 g008
Figure 9. User experience summary on the usability of the application.
Technologies 06 00099 g009
Figure 10. User view on most effective feature to promote low carbon emission vehicle choice.
Technologies 06 00099 g010
Table 1. List of open data services for environmental monitoring. GHG—greenhouse gas; UV—ultraviolet.
NoNameServicesCoverage
1.Air QualityReal time air quality of a city, by providing values of CO2, N2O, SO2, and O3Worldwide
2.Lake & Sea WikiFinnish lake and sea monitoringFinland
3.Helsinki Region InfoshareAir quality, noise pollution, GHG emissionsHelsinki, Espoo, and Vantaa in Finland
4.Open Weather MapRain, heat forecastWorldwide
5.yrUV, pollen and snow forecast, forest fire.Worldwide
6.Keli ForceaSnow conditions on highwaysFinland
7.European Environment AgencyCO2 emissions, losses due to climate change, air pollutants from transportEurope
Table 2. List of smart city applications or services. UK—United Kingdom.
NoApplication/Service NameServicesCoverage
1.HSLProvides transportation information, ticketing service in HelsinkiHelsinki Region, Finland
2.SLProvides transportation information, ticketing service in StockholmStockholm, Sweden
3.Brighter PlanetCarbon and energy impact quantification in the cloudOpen
4.Carbon Benchmark ApiThe administration gives assessments of normal generation of CO2 and GHGs as a pointer of run-of-the-mill carbon impressions for different exercises.Open
5.ParkRight AppService to find free parking spacesLondon, UK

