1. Introduction
Medical implants (MIs) have received significant attention from both academia and industry because of the improvements that they offer to an increasing amount of patients. Conventional MIs use the radio frequency (RF) band, which is bandwidth (BW) saturated [
1], and transmission power in the order of some 10 s of mW [
2]. Consequently, when operating with reasonable transmission power, they are unable to achieve the high data rates required for the emulation of human organs [
3,
4]. Another disadvantage of conventional MI appliances is the interference from other sources operating in the same band, which can significantly degrade their performance. As a result, RF MIs are considered a mediocre solution [
5,
6].
To overcome these barriers, it is necessary to examine the feasibility and effectiveness of transdermal wireless links that operate in non-standardized frequency bands and are characterized by a large BW availability. In this context and due to the partial transparency of skin at infrared (IR) wavelengths as well as the extremely high immunity to external interference, the use of optical wireless communications (OWCs) has been reported as an innovative alternative (see, for example, [
7,
8] and references therein). Consequently, a great amount of research effort was put into identifying the particularities of the transdermal optical wireless links (TOLs) [
9,
10,
11] and experimentally validating its feasibility [
5,
12,
13,
14,
15,
16,
17]. In more detail, in [
9], in vitro measurements of the optical properties of human skin are presented in the range of visible and infrared wavelengths, while, in [
10,
11], the authors analyzed the optical properties of skin and subcutaneous tissues measured in a wide wavelength range. In the aforementioned works, the channel models used are based on the numerical results to accommodate the impact of the transdermal propagation loss. Consequently, it is difficult to evaluate the TOL’s performance as well as to provide the appropriate design guidelines and tools.
Furthermore, in [
12], TOLs have been used to establish transdermal high data rate communications between the internal and external unit of the medical system, whereas, in [
15], the authors presented experimental results of direct and retroreflection transdermal link configurations. Additionally, in [
13], the optical transdermal link’s fundamental design parameters and their interaction have been quantified, while, in [
14], the authors demonstrated the tradeoffs revolving around the design of OWC medical systems. Finally, the authors of [
16] evaluated the system model of a transdermal optical link with regard to tissue thickness, data rate and transmitted power.
Most of the previously reported published works have neglected the effect of pointing errors caused due to the light emitting diodes’ (LEDs) and photo-detectors’ (PDs) directional behavior. On the contrary, in [
5,
15,
17], the authors examined its impact on the TOL’s error performance. Particularly, in [
5], a low power, high data rate TOL was evaluated in terms of energy consumption and bit error rate (BER), for a given pointing errors tolerance. Finally, in [
17], the in vivo feasibility of the TOL is verified, proving that high data rate can be delivered with BER of
, in the presence of pointing errors. The findings verify the feasibility of high-reliable low-power consumption transdermal optical wireless links.
However, in all of these contributions, deterministic models have been employed to accommodate the impact of pointing errors. Thus, the stochastic nature of the pointing errors due to the relative motion between the transmitter (TX) and the receiver (RX) is not taken into account. Of note, this relative motion is unavoidable in several biomedical applications, due to the biological functions. Motivated by this, in this paper, we quantify the impact of pointing errors in terms of average SNR. Specifically, the technical contribution of this paper can be summarized as follows:
A novel system model for the TOL is formulated, which accommodates the characteristics of this type of links.
A novel easily-computed channel model is extracted by employing experimental results concerning the pathloss and a stochastic process for the pointing errors between the TX and the RX. The utilization of this model in the analysis for the transdermal channel introduces a accurate but tractable alternative to the existing models, in terms of the signal propagation and the pointing errors.
Closed form expressions are derived for the instantaneous and average SNR, which take into account the transdermal channel particularities, the transceivers characteristics and the intensity of pointing errors.
Illustrative results reveal important technical insights that can be utilized in the design of OWC transdermal systems.
The rest of this paper is organized as follows.
Section 2 is devoted in presenting the system model and the characteristics of the transdermal optical channel.
Section 3 focuses on providing the theoretical framework, which quantifies the TOL’s quality in terms of average SNR. Respective numerical results and discussions are provided in
Section 4. Finally, closing remarks are summarized in
Section 5.
Notations: Unless stated otherwise, in this paper,
denotes absolute value,
represents the exponential function, and
and
stand for the binary logarithm and the natural logarithm, respectively. In addition,
denotes the probability of the event
, and
denotes the error function [
18].
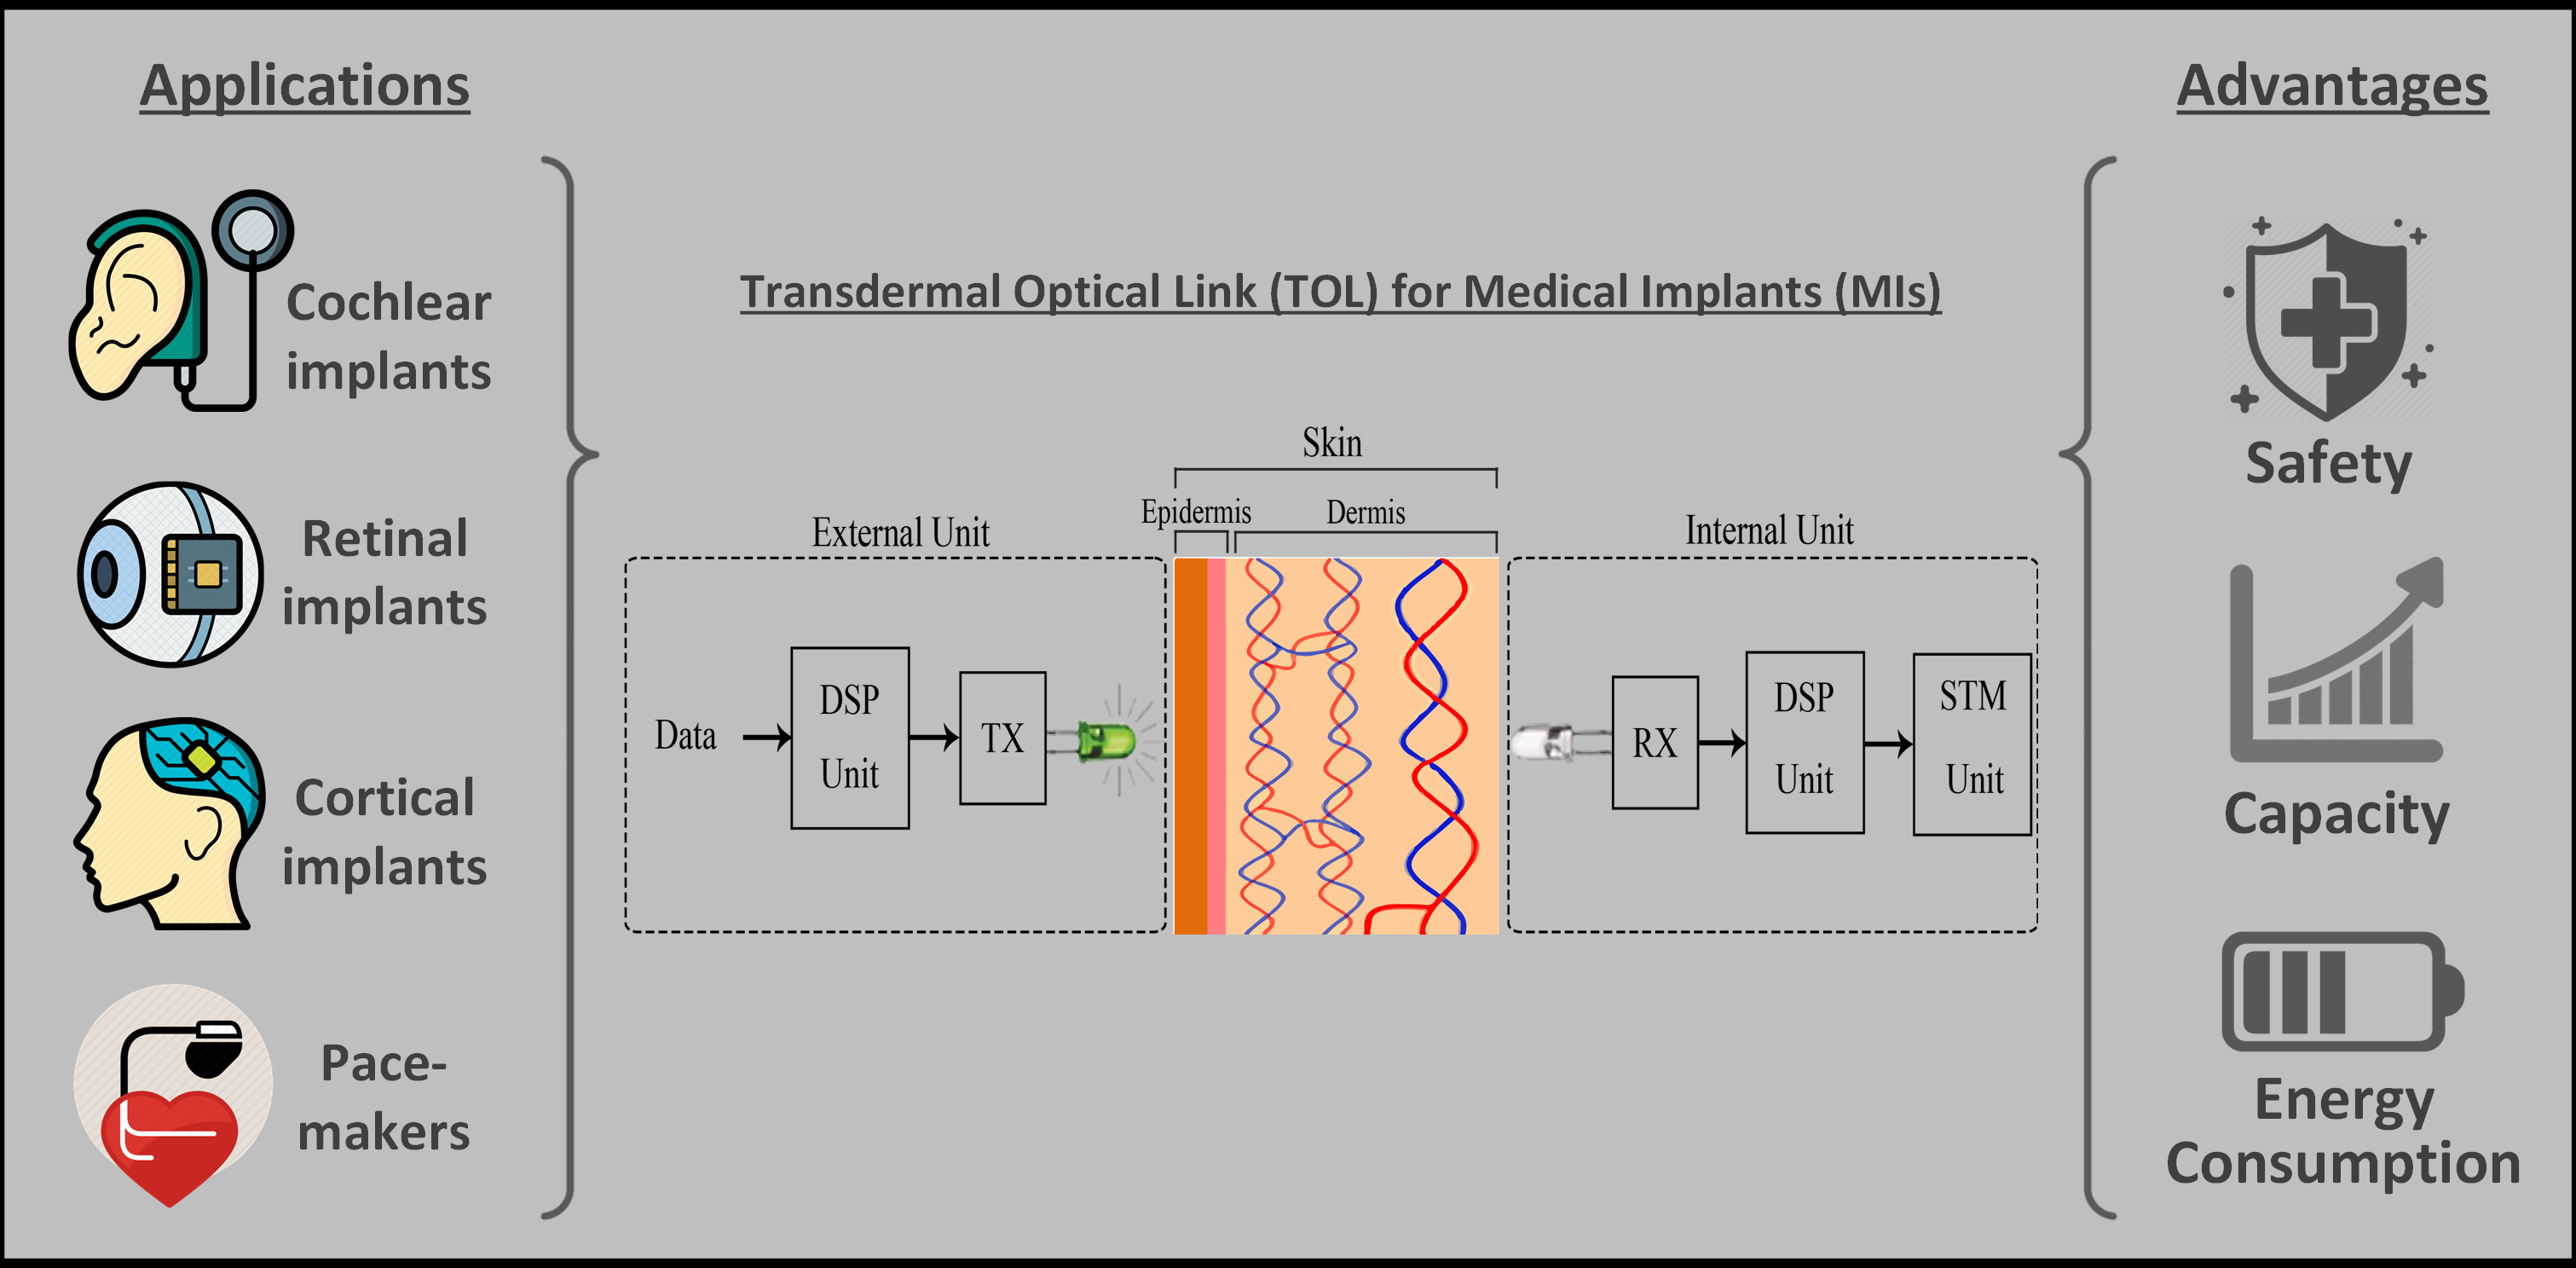
2. System Model
As demonstrated in
Figure 1, the main components of a transdermal MI are the out-of-body unit, the channel (skin) and the in-body unit. The out-of-body unit consists of a data capturing unit that converts external stimulations into electrical signals, followed by the the digital signal processing (DSP) unit that digitizes and compresses the data into modulated signals. In turn, these signals are transmitted by the TX to the RX of the in-body unit. The received signal is processed via a DSP stimulation (STM) unit that are responsible for generating the appropriate stimulations.
We assume that the transmitted signal,
x, conveys over the optical wireless channel,
h, with additive noise
n. Hence, the baseband equivalent received signal can be obtained as
where
R stands for the responsivity of the RX’s PD and can be expressed as
with
being the quantum efficiency of the PD,
e the electron charge,
the photons’ frequency and
p the Planck constant.
Next, we provide the channel model under consideration. The baseband equivalent channel,
h, can be written as in [
15,
19]
where
and
, respectively, represent the deterministic channel coefficient, due to the path gain, and the stochastic process that models the geometric spread, because of the pointing errors. We assume a Gaussian spatial intensity profile of
on the RX plane at distance
from the TX and circular aperture of radius
. Likewise,
represents the fraction of the collected power, due to geometric spread with radial displacement
r from the origin of the PD. By assuming that the elevation and the horizontal displacement (sway) follow independent and identical Gaussian distributions, a usually employed assumption used in OWCs [
20], we observe that the radial displacement at the RX follows a Rayleigh distribution. Thus, the probability density function (PDF) of the random variable
can be obtained as [
21]
where
stands for the the fraction of the collected power in case of zero radial displacement [
22] and
with
A and
, respectively, denoting the RX’s PD effective area and the beam waste (radius calculated at
) on the RX plane at distance
from the TX. Meanwhile,
is the square ratio of the equivalent beam radius,
, and the pointing error displacement standard deviation at the RX, which can be obtained as
where
is the pointing error jitter variance at the RX. Finally,
can be evaluated as
Based on Equation (
4), the cumulative distribution function (CDF) of
can be obtained as
or, by substituting Equation (
4), as
By employing ([
18], equation 2.01/1), Equation (
10) can be rewritten as
The deterministic term of the channel coefficient can be expressed as ([
8], Equation (10.1))
where
and
represent the skin attenuation coefficient in the wavelength
, and the total dermis thickness, respectively.
Of note, the value of
depends on the optical properties of the skin and can be obtained numerically from experimental results from [
10,
11]. Based on these values and, by employing the trust region method (the interested reader can find more information about this method in [
23,
24,
25]), we can extract a novel closed-form expression for the skin attenuation coefficient in the region of
as
where the values of
,
and
, with
, are provided in
Table 1, and
is given in
.
Note that the accuracy of this expression has been evaluated higher than by utilizing the coefficient of determination (R-squared). R-squared is the square of the correlation between the response values and the predicted response values and can be expressed as the ratio of the sum of squares of the regression and the total sum of squares.
The noise component can be analyzed as
where
, and
stand for the background and dark current shot noises, respectively, which can be modeled as zero-mean Gaussian processes with variances
and
with
B,
and
, respectively, being the communication bandwidth, the background optical power, and the intensity of the dark current. Finally,
stands for the thermal noise, which can be also modeled as a zero-mean Gaussian process with variance
. Note that, since
,
, and
are zero-mean Gaussian processes,
n also follows zero-mean Gaussian distribution with variance [
15]
4. Results and Discussion
In this section, we evaluate the performance of the transdermal OWC link by illustrating analytical and Monte-Carlo simulation results for different insightful scenarios. The simulation results were obtained using the software tools Matlab and Mathematica. In more detail, we assume that the photodiode effective area,
A, is defined as
and is equal to
, while the divergence angle,
, equals
. Additionally, unless otherwise stated, the skin thickness,
, is assumed to be equal to
, while the noise optical PSD,
, is set to
[
27]. The beam waist in distance
is calculated as
Moreover, according to Gil et al. [
15], the OWC link shows extremely high immunity to external interference; hence, the background optical power can be omitted, i.e.,
. Furthermore, the photodiode’s dark current,
, is set to
, whereas,
[
8]. Finally, unless stated otherwise, we assume
,
and
.
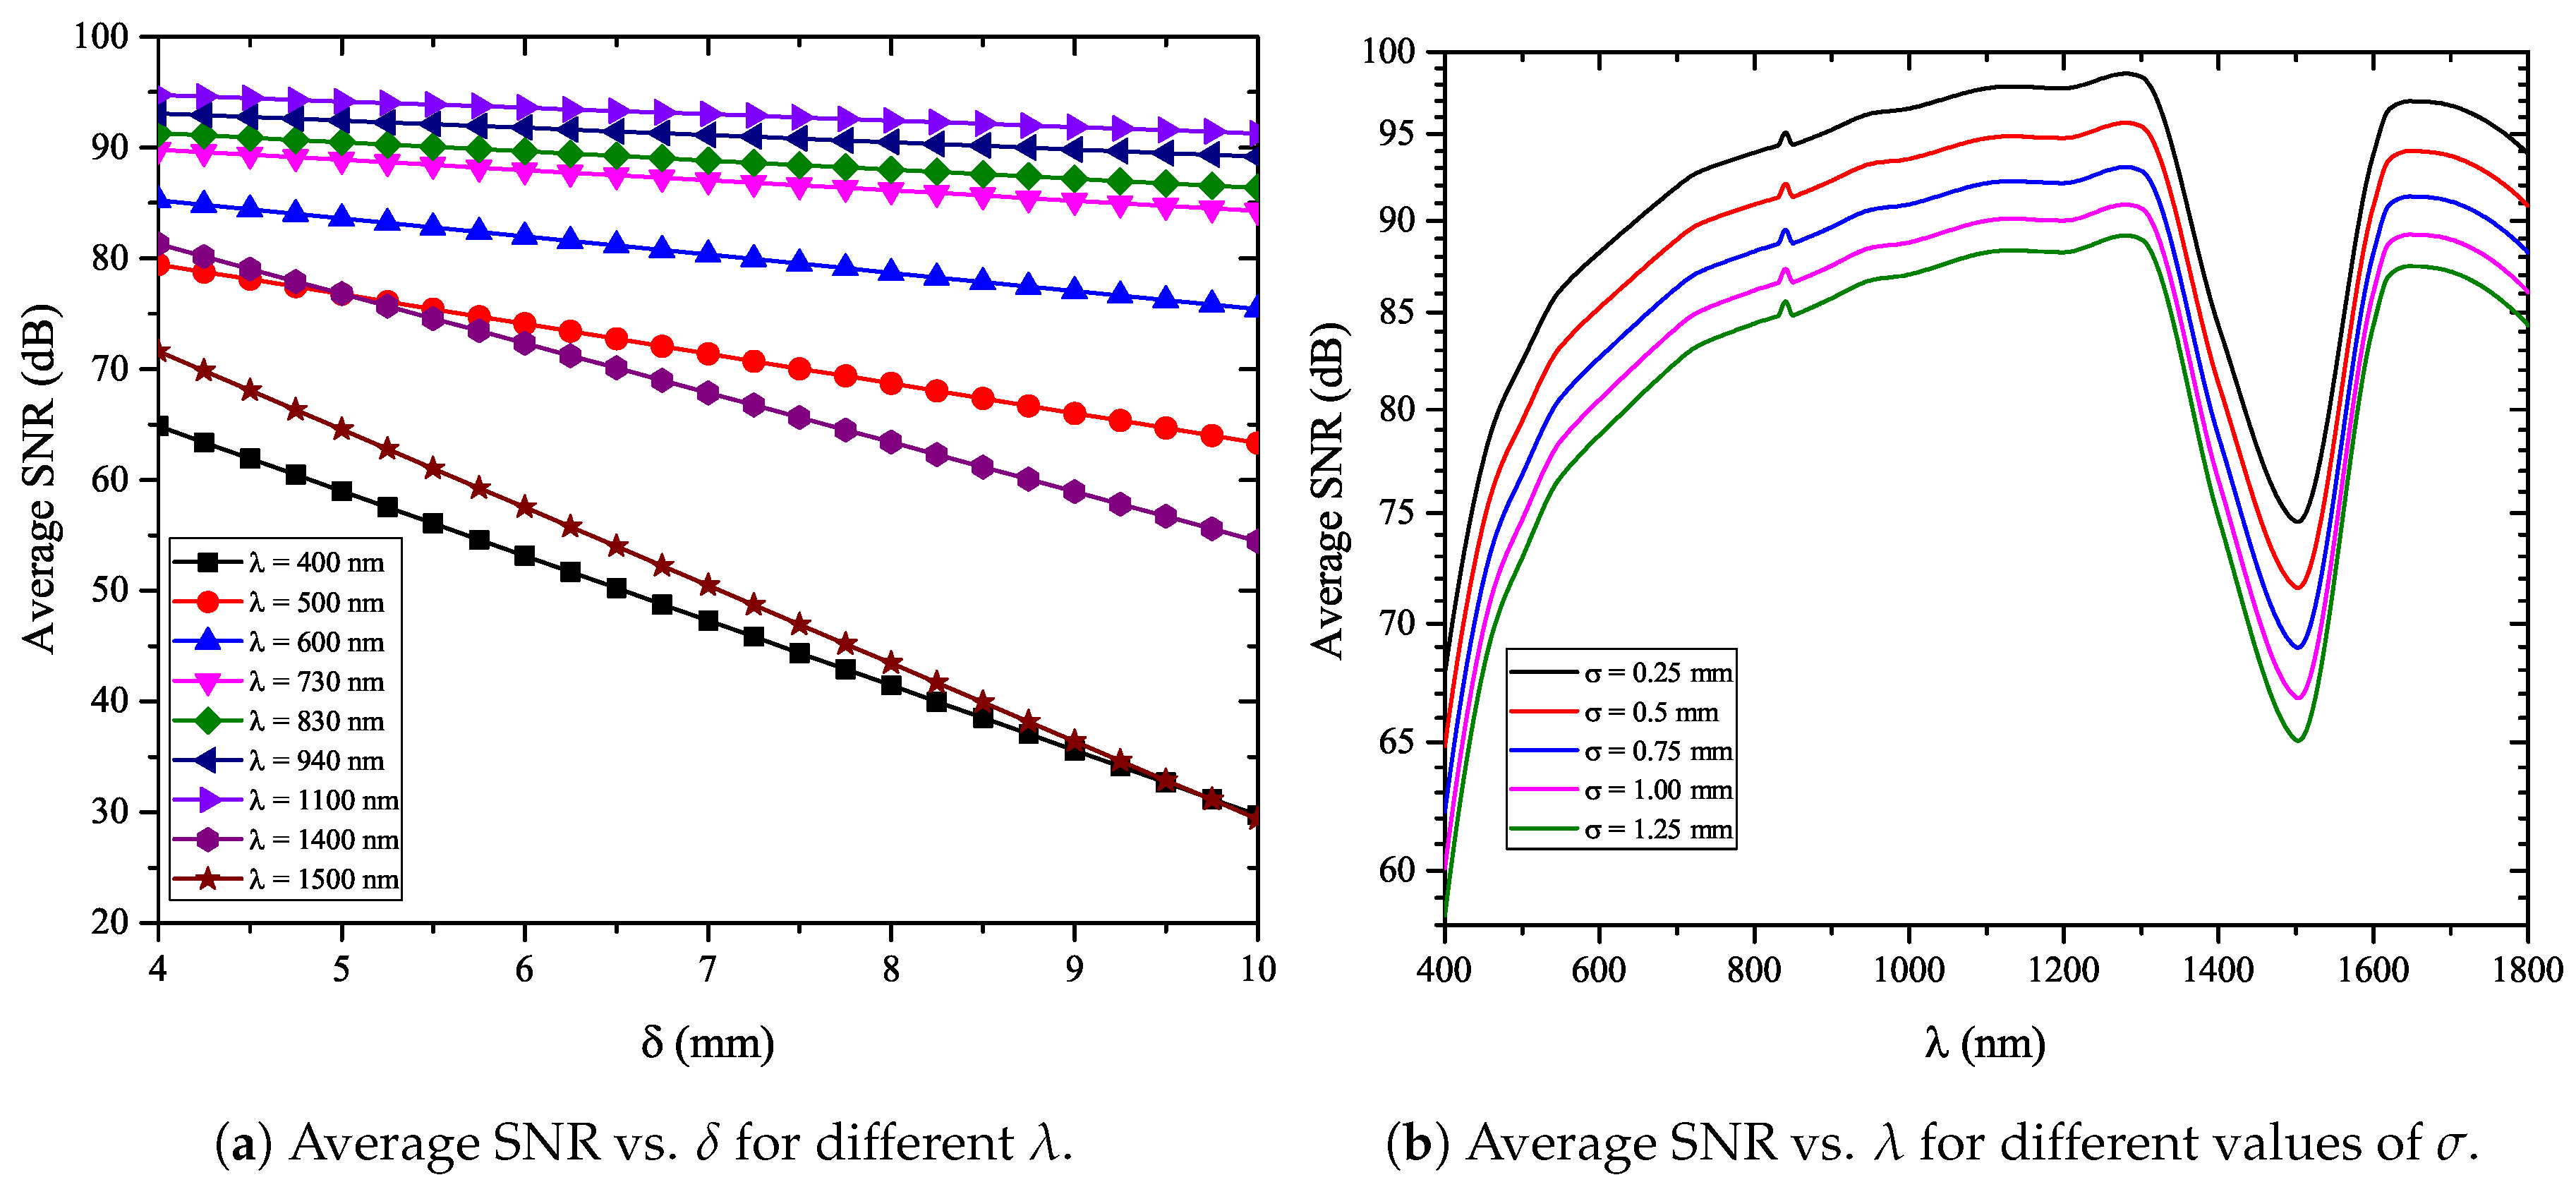
Figure 2a demonstrates the impact of skin thickness on the received signal quality in the OWC link operating in different wavelengths. We observe that the analytical and simulation results coincide; therefore, the analytical framework for the derivation of the average SNR is verified. As expected, for a given wavelength, as the skin thickness increases, the average SNR decreases, i.e., the received signal quality degrades. This degradation is caused due to the pathloss. Additionally, we observe that, for a given skin thickness,
, the average SNR depends on the wavelength. For example, for
mm and
nm, the average SNR equals
dB, whereas, for the same
and
nm, the average SNR is
dB. In other words, the 100 nm variation of the wavelength, from 1500 to 1400 nm, resulted in a
signal quality improvement. On the other hand, for the same
, when
changes from 400 to 500 nm, the average SNR increases about
. This observation indicates the wavelength selectivity of the transdermal link, as well as the importance of appropriately choosing the wavelength, when designing the link. Finally, for
mm, we observe that a 1500 nm OWC link outperforms the corresponding link operating in 400 nm, while, for
mm, the opposite is valid. This is because, in these scenarios and for skin thicknesses less that
mm, the factor that determines the received signal quality degradation is mainly the RX’s responsivity, whereas, for
, the dominant factor is the skin attenuation coefficient.
Figure 2b depicts the average SNR as a function of the wavelength for different values of the jitter standard deviation,
. We observe that, although the signal PSD in the OWCs is much lower than the one when RF link is used, the average SNR is surprisingly high, i.e., in the order of 90 dB. This indicates that the OWCs can achieve much higher energy efficiency compared to the corresponding RF link. Moreover, for a fixed wavelength, as
increases, the average SNR decreases. For
, the average SNR decreases approximately
as
is changed from
to
. Additionally, from this figure, it is evident that a transmission window exists for wavelengths between 700 and
. Note that, in this wavelength region, several commercial light emitting diodes (LEDs) and photodetectors (PD) exist (see, for example, [
28,
29]). Finally, we observe that the wavelength windows from 400 to
and around
are not optimal for TOLs, whereas the optimal transmission wavelength is
.
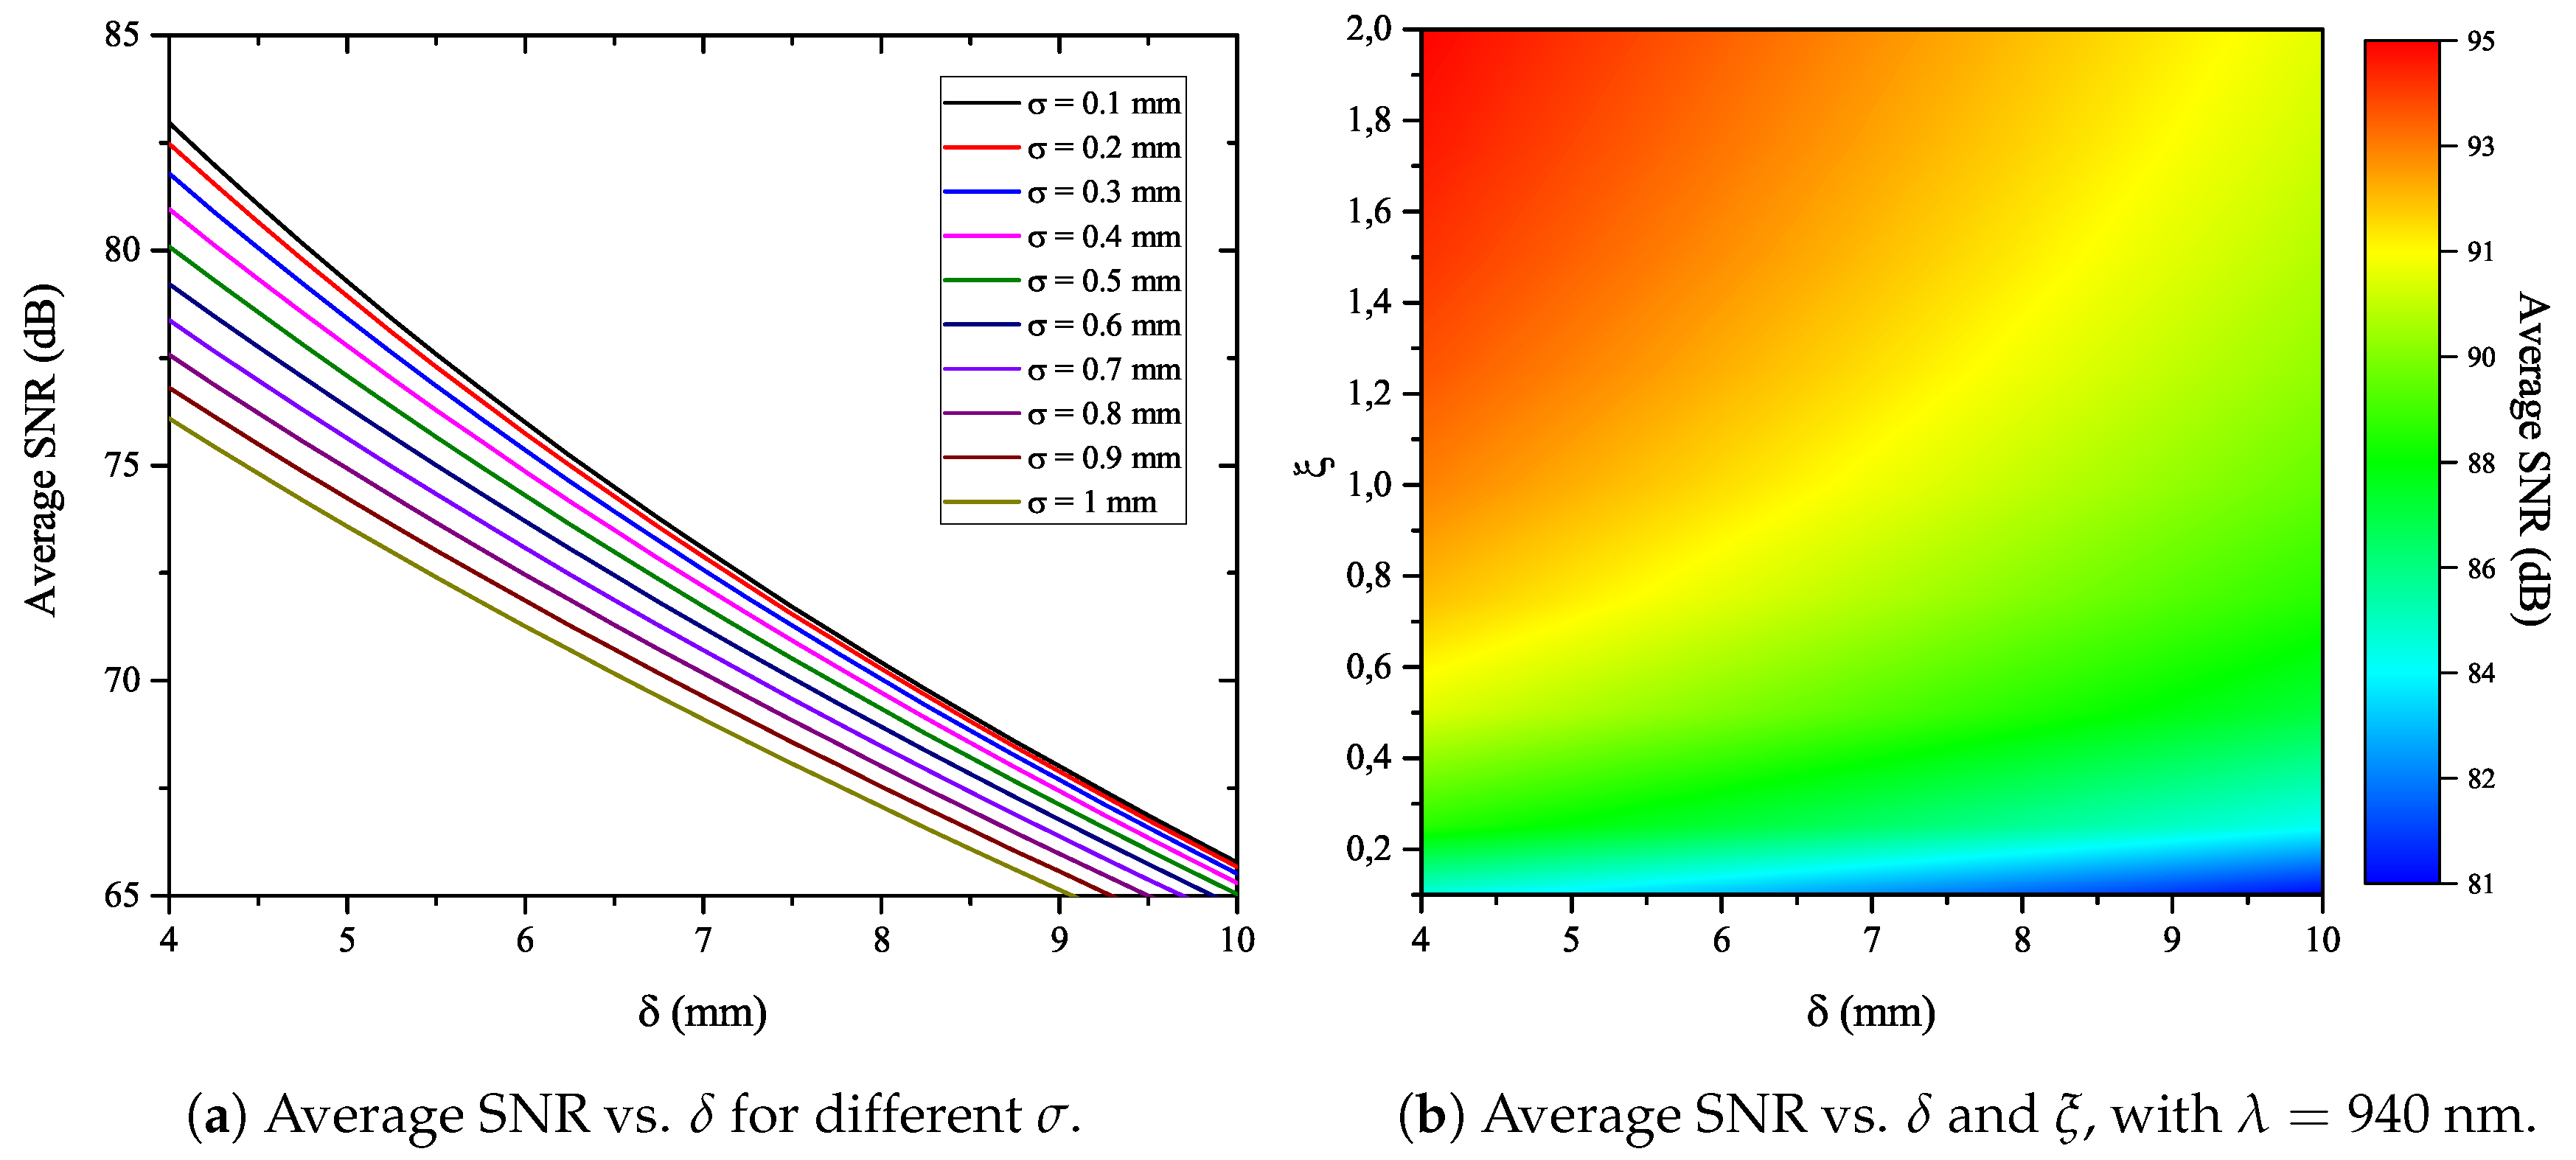
In
Figure 3, the impact of pointing errors in the received signal quality is quantified. In more detail, in
Figure 3a, the average SNR is illustrated as a function of the skin thickness for different values of the jitter SD. We observe that the value of average SNR decreases at an increase of the skin thickness and the jitter SD. For instance, for
, as jitter SD increases from
to
, the average SNR decreases by
. In addition, it is noticed that, for
, the average SNR decreases by approximately
as the skin thickness increases from
to
, while, for
, for the same skin thickness increase, the average SNR decreases about
. This indicates that, as
increases, the signal quality becomes less severe to the skin thickness variation.
Figure 3b illustrates the effect of skin thickness and pointing errors in the received signal quality in terms of average SNR, for
. In this figure, it is evident that, for a fixed
, as the skin thickness increases, the average SNR decreases. For instance, for
, the SNR decreases from
to
dB, as the skin thickness increases from 5 to 9 mm, whereas, for
, the SNR decreases from
to
dB, for the same skin thickness increase. This indicates that the average SNR degradation, due to skin thickness increase, is independent of the intensity of the pointing errors. Additionally, in this figure, we see that, for a fixed skin thickness, as
increases, i.e., the intensity of pointing errors decreases, the average SNR increases. For example, for
mm, when
changes from
to
, the average SNR increases for about 10 dB, from
to
dB. Finally, we observe that, for practical values of
and
, i.e.,
mm and
, the achievable average SNR is very high, even though the transmission PSD is relatively low.
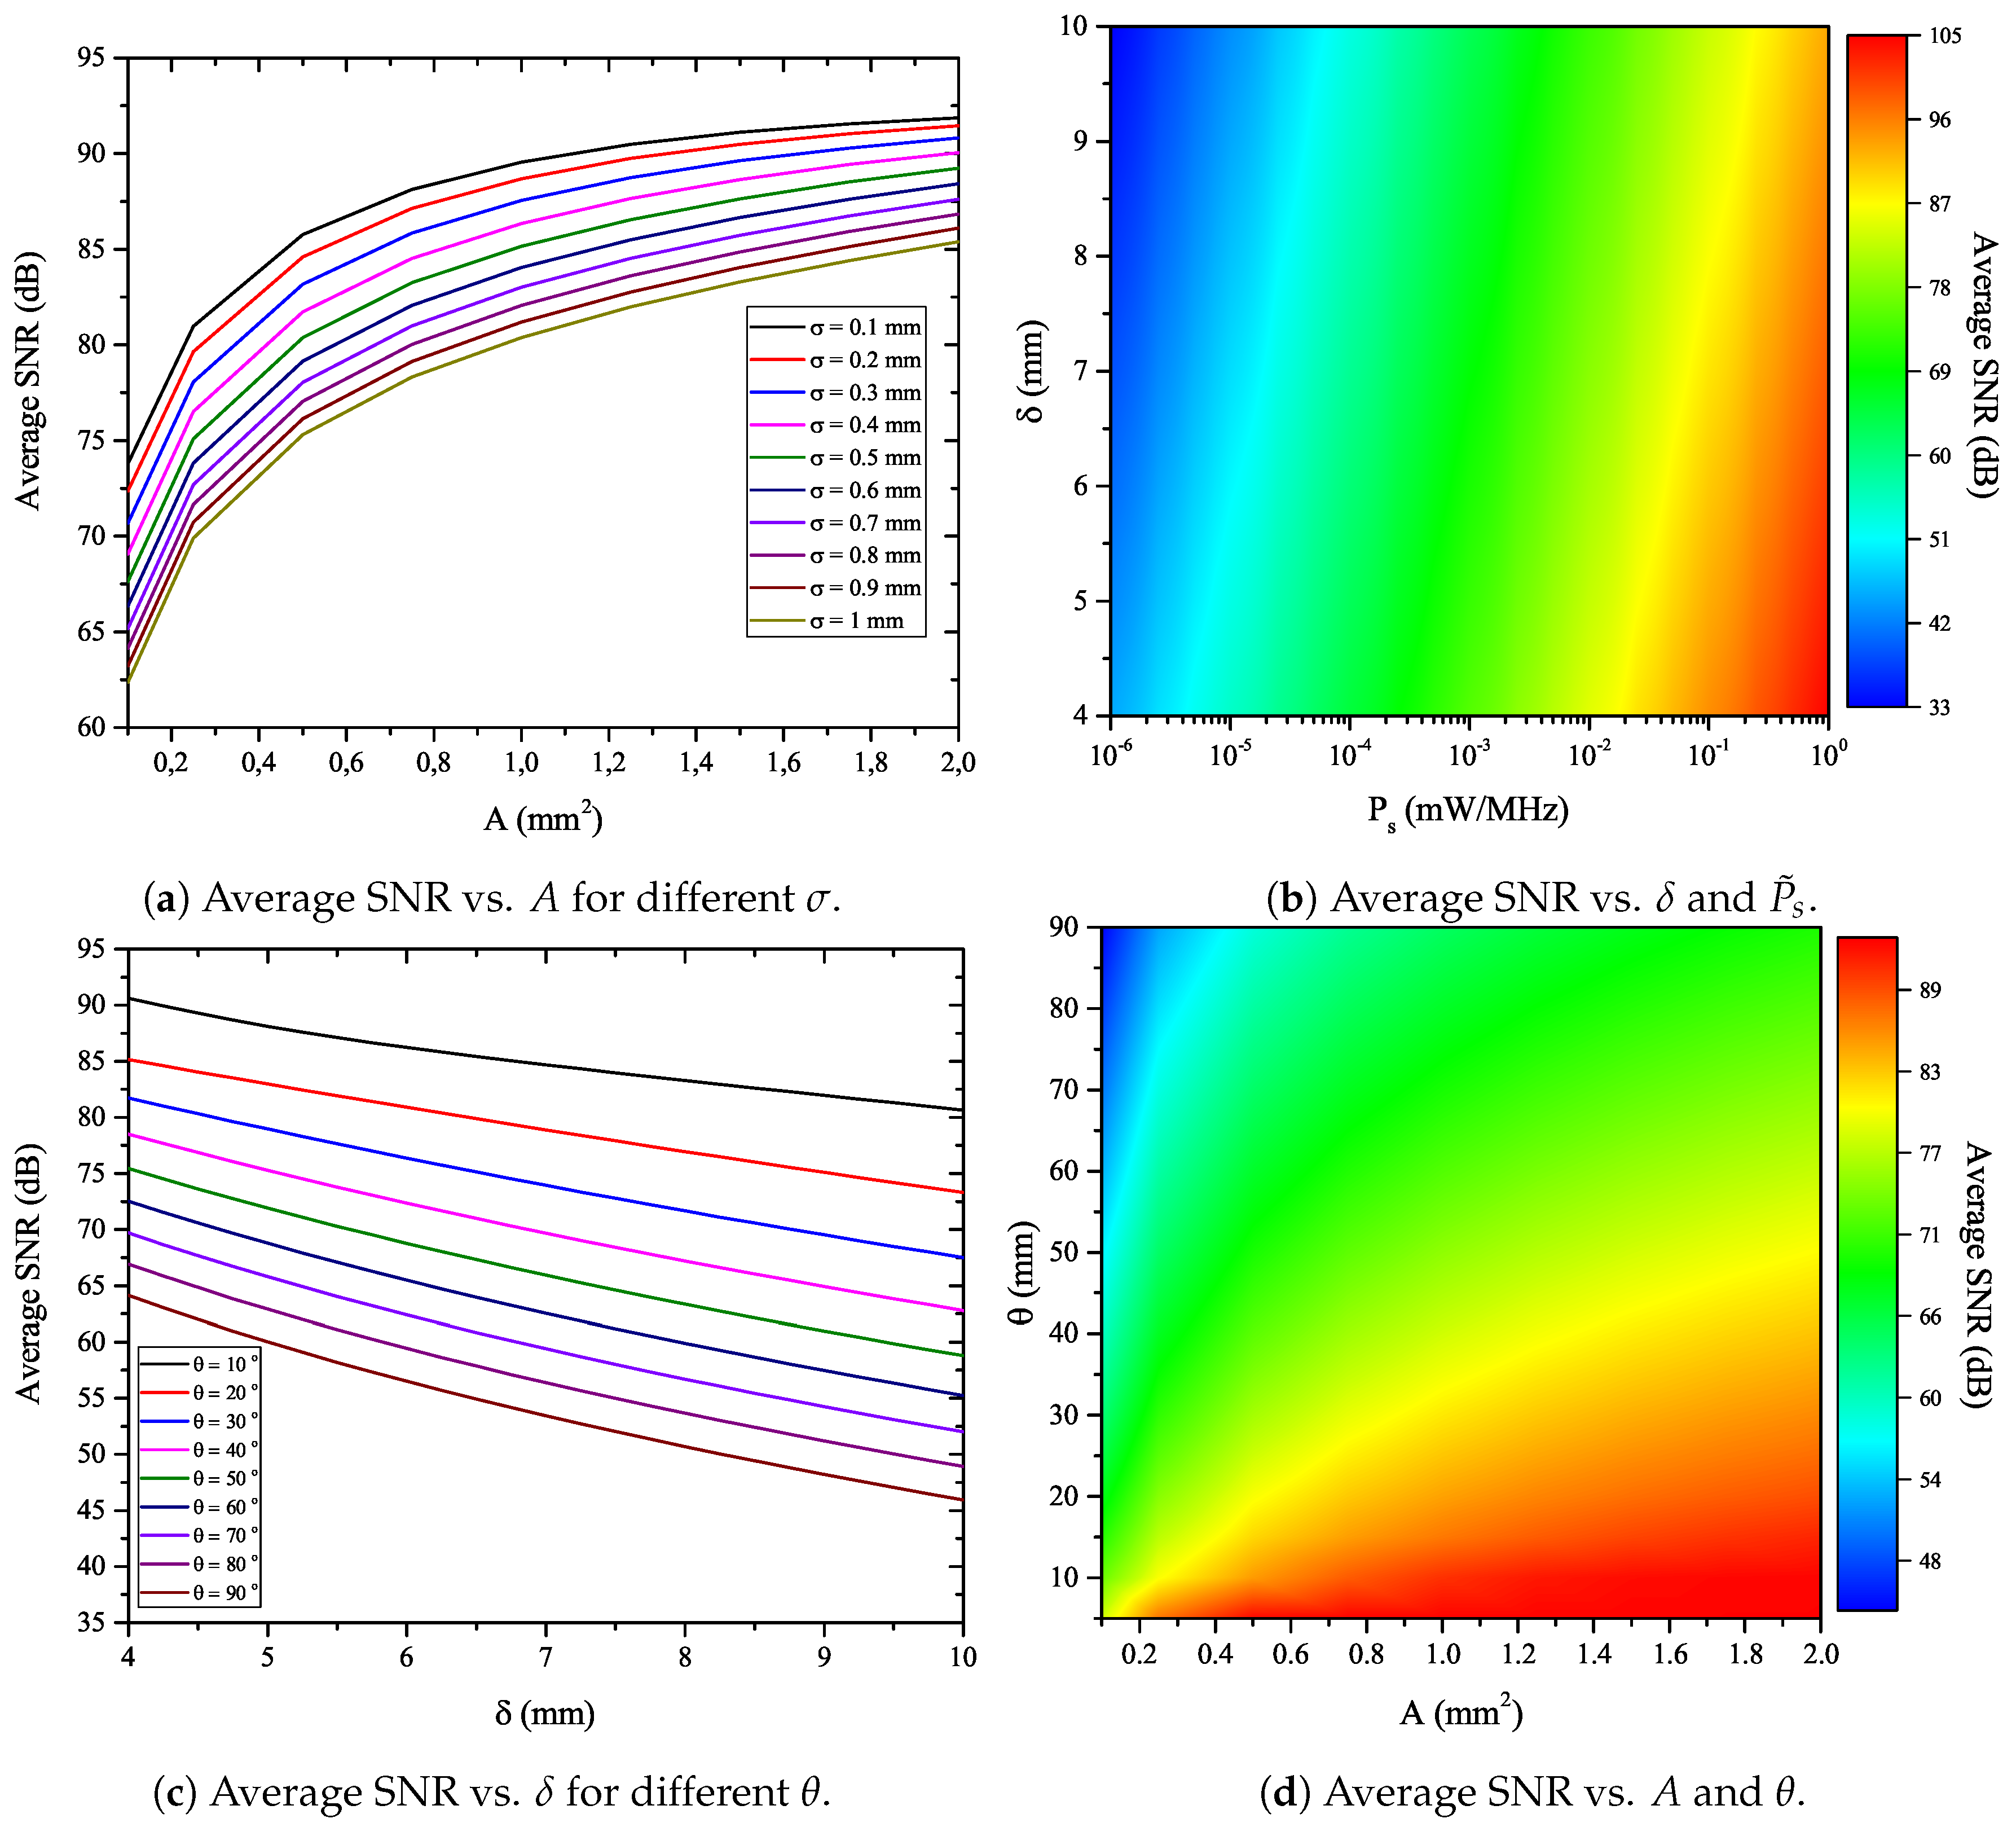
Figure 4a demonstrates the average SNR as a function of the PD effective area,
A, for different values of the jitter SD,
. It is evident that, for a certain
, as
A increases, the average SNR increases as well. Of note, for higher values of
A, the increase in performance becomes less severe. This observation indicates that, after a certain point, the impact of
A on the system’s performance becomes obsolete. Furthermore, for a given
A, as the jitter SD,
, increases, the signal quality degrades and thus the average SNR decreases.For example, for
, an increase in the jitter SD from
to
results in a
degradation of the signal quality. Note that
is a measure of the intensity of the pointing errors and, therefore, as the intensity of the pointing errors increases, the received signal quality is expected to decrease.
Figure 4b illustrates the average SNR as a function of the skin thickness and the PSD of the transmission signal. As expected, while the transmission PSD,
, increases, the average SNR increases as well. For example, for
, an increase of the transmission PSD from
to
results in a
increase of the corresponding average SNR. Moreover, we observe that, in the worst case scenario, in which the skin thickness is
, even with particularly low transmission signal PSD of about
, the achievable average SNR is in the order of
. This result highlights the fact that the transmission PSD can be utilized to countermeasure the impact of skin thickness.
In
Figure 4c, the average SNR is illustrated as a function of the skin thickness and the divergence angle. It is shown that, for a fixed
, the average SNR decreases as
increases. For example, for
and
, a
average SNR is achieved, whereas, for the same
and
, the average SNR is
. Therefore, a
average SNR degradation occurs when the skin thickness doubles. On the contrary, for a given
, the average SNR is inversely proportional to
. For instance, for the case of
, a
average SNR increase is achieved when the divergence angle changes from
to
. This reveals that, by decreasing the divergence angle, we can countermeasure the incurred path loss effect.
Figure 4d exhibits the proportionality of the average SNR with respect to the PD effective area,
A, for a given divergence angle,
. For instance, an
average SNR increase can be achieved at
, by increasing
A from
to
. On the contrary, the average SNR is inversely proportional to
for a fixed
A. For example, an
average SNR degradation occurs for
when
increases from
to
. Of note, this figure presents the combined effect of two design parameters,
and
A, on the signal’s quality, and it can be utilized for appropriately selecting the values of these design parameters. Finally, it is noticed that, regardless of the values of
and
A, the average SNR is in the range between 45 and
, which is extremely high.

 ,
, 


