1. Introduction
Body Mass Index (BMI) is a well-utilized measure to generally describe weight status [
1] based on the ratio between an individual’s height and weight. It is used to ultimately classify an individual as underweight, normal weight, overweight, or obese [
2]. Within dissemination and implementation research in particular, measuring BMI can be an obstacle that interferes with obtaining outcome data. First, reaching participants to physically measure BMI is unlikely when aiming to disseminate a program nationally due to limited time available and the resources needed by facilitators to accurately measure weight and height (a research quality stadiometer and scales) as well as carrying out the intervention [
3]. Further, relying on individuals to perform self-measurements may not be realistic or reliable, and measurements would often rely on corrective equations [
4,
5]. Nevertheless, self-reported measurements are typically used as a secondary measure when physical measurements are not feasible [
6]. Previous research has shown that participants tend to overestimate their height and underestimate their weight, resulting in inaccurate BMI data [
7]. Pursey et al. found that young adults tended to overestimate their height while underestimating weight [
6]. Similar findings from the National Health and Nutrition Examination Survey (NHANES) and the National Institutes of Health (NHI) data found younger (18–42 years) and older (>55 years old) adults inaccurately reported BMI, with over-reported height and under-reported weight [
8]. A solution to this problem may be the utilization of participant facial photographs to assess BMI.
With today’s ever-evolving technology, ‘selfies’, iPhone facial recognition, and social media sites enable users to easily take and display self-portraits. Recently, life insurance companies have begun offering the option of sending in a selfie to assess health and weight status for eligibility [
9]. When performing studies among a population that has grown up in a technology-based atmosphere, such as current college students, the ease of taking a portrait may entice them to participate in health interventions [
10]. This type of facial recognition software has been used for various reasons including by the Department of Defense, and for criminal investigations, protection, and emotional recognition [
11,
12]. However, increases and decreases in weight in a single participant can make it difficult for facial recognition technology to accurately identify an individual [
13].
Recent work has examined ways to address changes in weight to improve the accuracy of facial recognition software. Previous approaches have worked to examine changes in facial features due to weight fluctuation [
13]. Research has shown that facial adiposity demonstrated in photographs of participant faces has been positively associated with their BMI [
13], but there has been limited research on using this method to estimate an individual’s BMI. The current study will be an extension of testing for the method developed by Guo and colleagues in 2013, which uses a computational approach to determine an individual’s BMI from their facial features [
14]. As this has been the only study to develop this approach, further, updated investigation of this method is needed, aimed at improving the ease of dissemination of intervention programs that aim to capture health-based data. Guo et al.’s previous approach used over 14,500 facial images of people of different age, race, and gender to formulate BMI predictions [
14]. We propose now to utilize this method with a new cohort of individuals who have enrolled in a lifestyle intervention study and to predict their BMI from their facial photos.
The objective of the current study was to test the effectiveness and comparability of a facial image algorithm for detecting the BMI of participants enrolled in a health intervention, and to compare the predicted fBMI to their physically collected BMI measurement.
2. Methods
As part of a larger study, Get Fruved, three cohorts of participants consented as participants in this study and were enrolled and assessed [
15]. The cohorts included (1) upperclassmen college students (18 years or older), who were partners in the development of the Get Fruved peer-led social marketing campaign to increase healthier lifestyle among their incoming peers, (2) incoming freshmen at each university (four interventions and two control), and (3) a subproject of individuals enrolled in an 8-week dietary intervention aimed at increasing fruit and vegetable consumption. All individuals were physically assessed at baseline (August 2015) to capture anthropometrics of height, weight, and a facial picture by a trained researcher. Height was measured via stadiometer (SECA 213) in a standing position with shoes removed, shoulders relaxed, facing forward, with head up and back facing the wall. Weight was measured with minimal clothing on via a Tanita TBF-310GS Total Body Composition Analyzer (Garmin, Tanita Corporation of America, Arlington Heights, IL, USA). All measures were performed twice and averaged for reliability and accuracy. As eligibility criteria required participants to be 18 years or older, adult BMI measures were used [
16]. BMI was calculated by dividing measured weight in kilograms by height in meters squared. Classifications of BMI included: <18.5 BMI (underweight), 18.5–24.9 (normal weight), 25.0–29.9 (overweight), and ≥30 (obese). Facial images were simultaneously taken along with baseline assessments. Photos were taken with digital cameras at each assessment site with participants standing against a neutral background with a neutral face, all eyewear removed, and hair removed from in front of the face. Participants held a white paper with their participant ID in their photo and photos were saved by ID number to ensure anonymity of all enrolled.
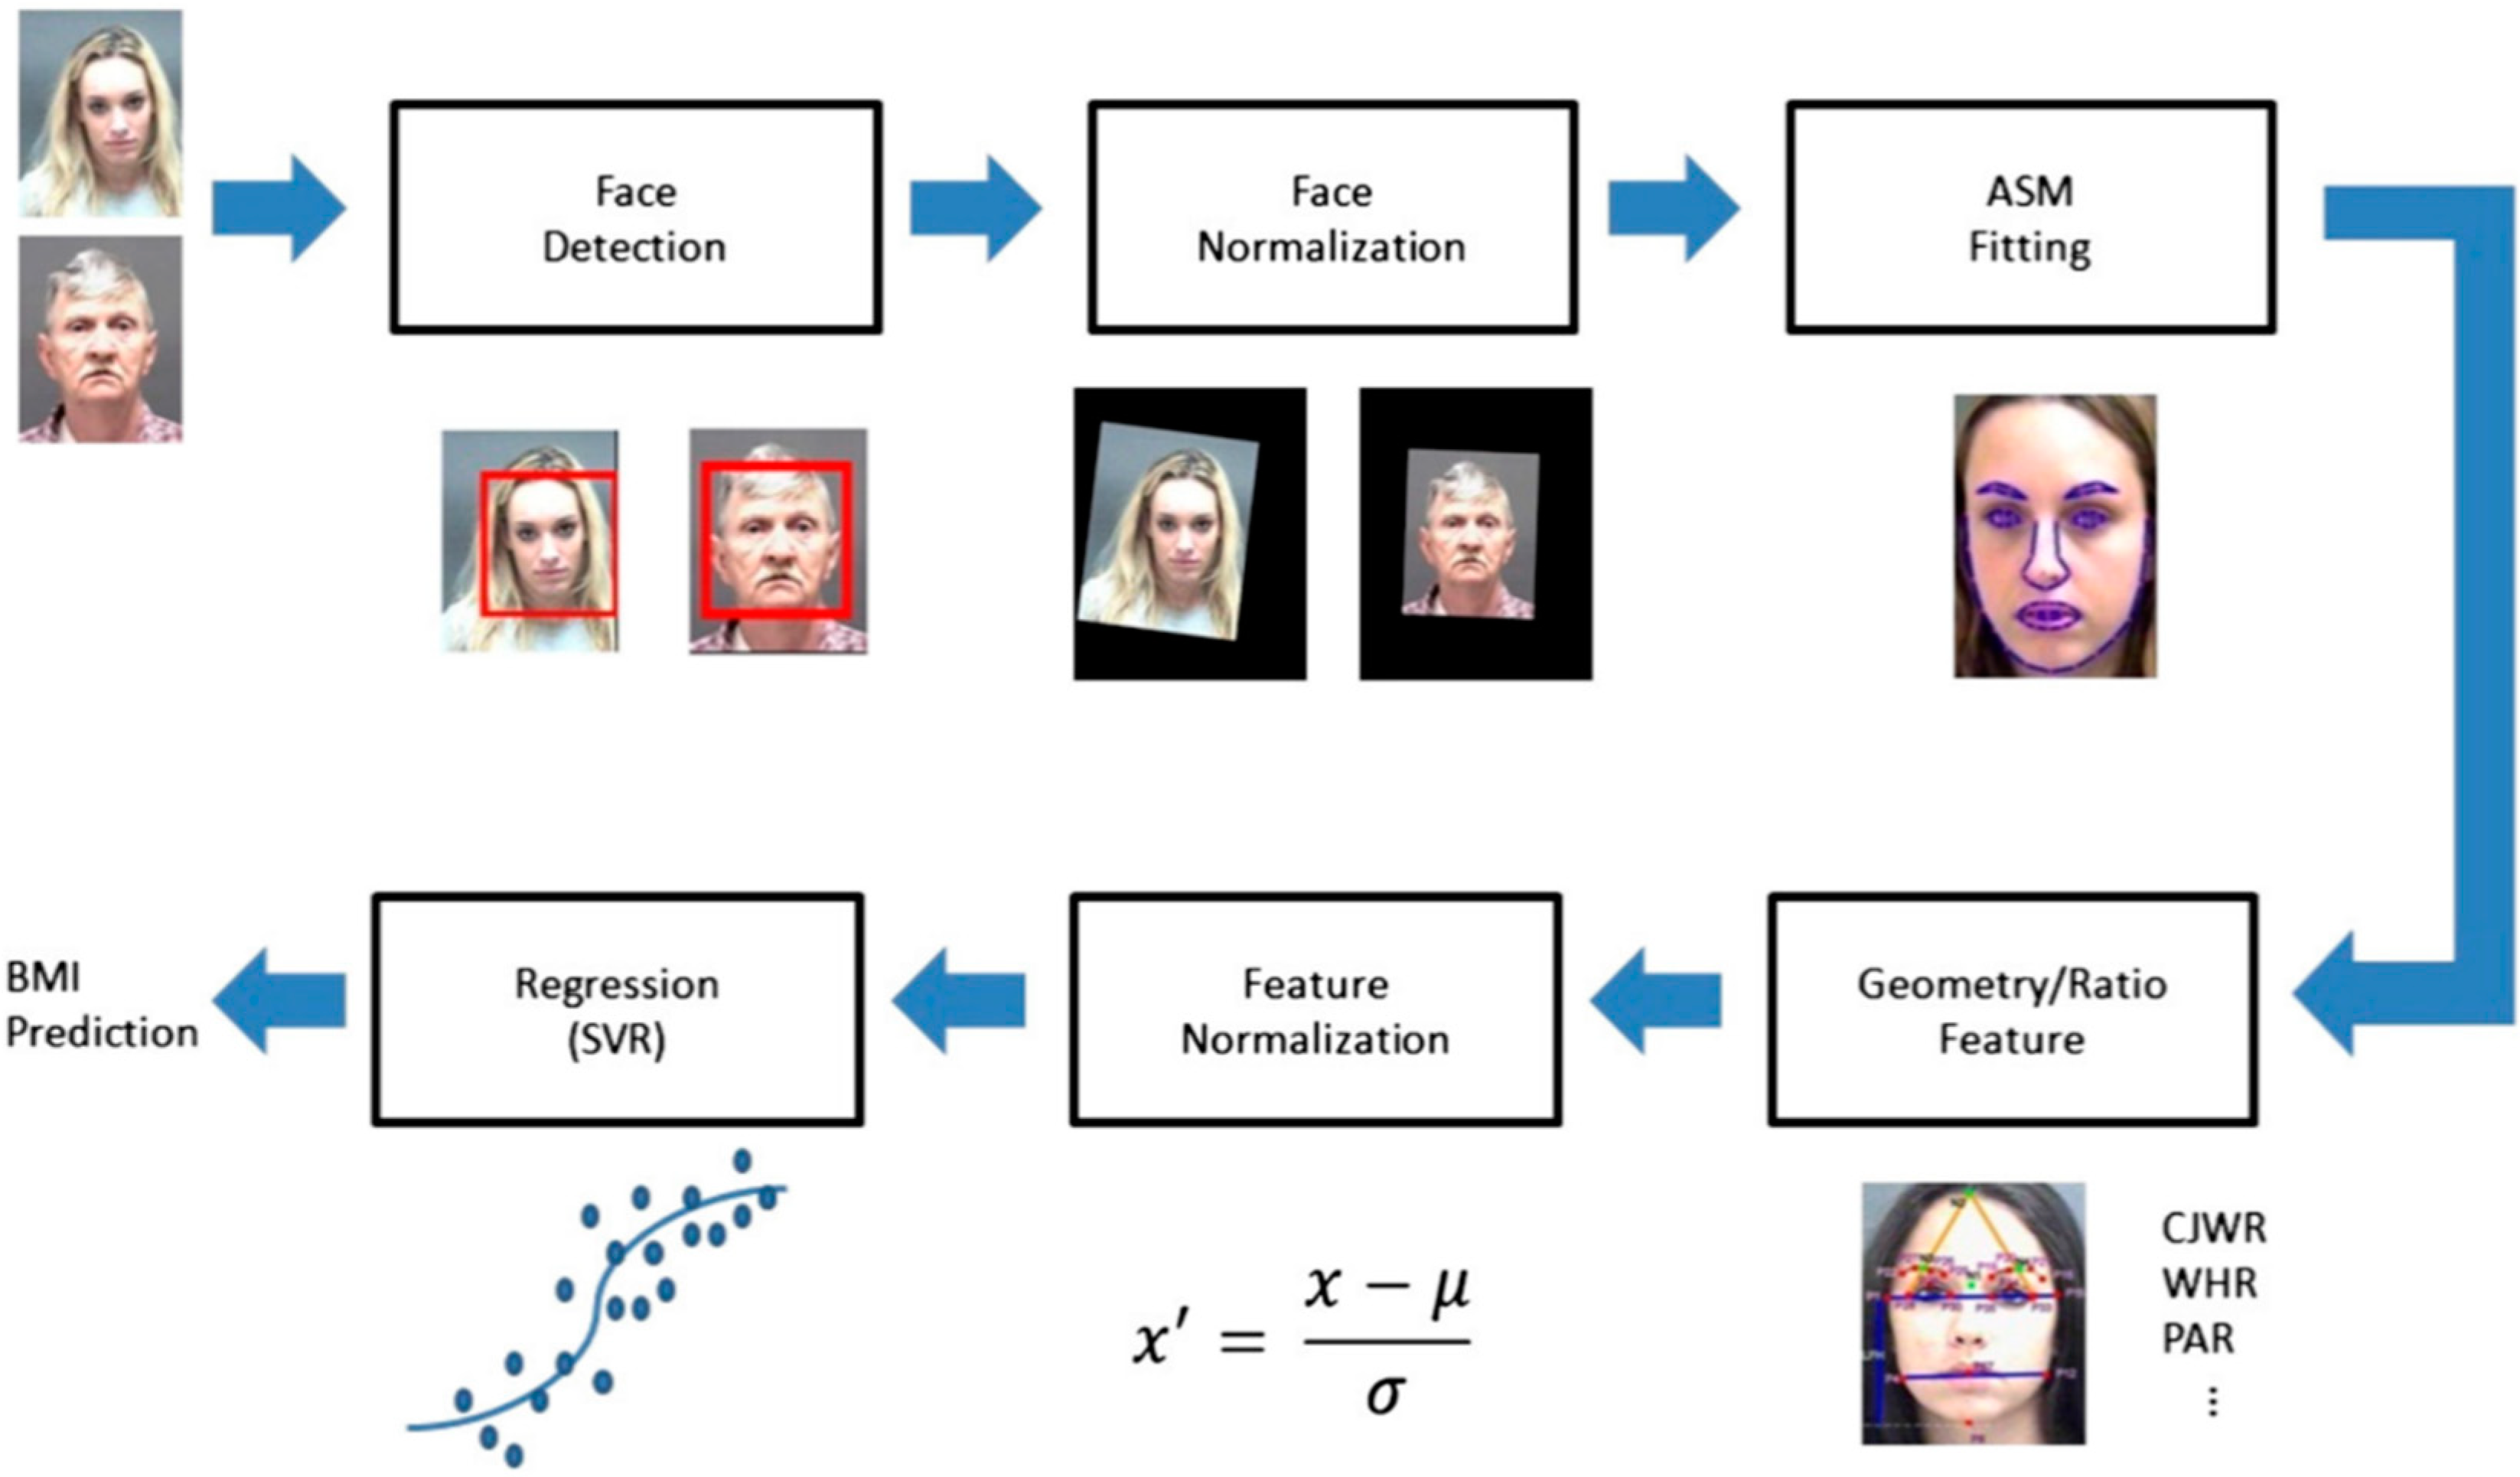
To test the algorithm developed by Wen and Guo, facial images were analyzed by a facial landmark detector to identify a number of facial fiducial points, which were then used to compute seven facial features. The seven facial features computed were automatically estimated and include cheek to jaw width (CJWR), width to upper facial height ratio (WHR), perimeter to area ratio (PAR), eye size (ES), lower face to face height ratio (FW/FH), and mean of eyebrow height (MEH). Feature normalization was executed and a regression function arrived at to represent the relation between facial measures and BMI values. This function was used to compute the BMI for each test face image. Computed facial BMIs (fBMI) were compared to physically measured BMIs (mBMI) through correlation analysis, matched pair comparisons, and adjusting the sensitivity of the algorithm to detecting the reliability of fBMI to mBMI. Methods of analyzing photos are explained in a previous manuscript, but are generally described in
Figure 1.
3. Results
A sample of 1412 young adults were assessed as part of a larger study. Sample size calculation from this population size at 95% confidence level is 292 participants. Completed facial algorithm data were available on 1210 participants of the larger cohort. Participants were predominately Caucasian (62.5%) and female (69.6%), and were average of 19 years of age. Participants were predominately in the normal weight range category, with an mBMI of 18.5–24.9 kg/m
2 (60.2%) (
Table 1). Likewise, with fBMI participants were primarily detected to be in the normal weight category of BMI (81.9%). Pairwise correlation of mBMI and detected fBMI was significant (r = 0.3070;
p < 0.0001). A regression model to predict fBMI from mBMI also found a significant relationship (F = (11,208) 125.7;
p < 0.0001).
Table 2 shows the count data of participants in each mBMI category and their placement using fBMI. Data indicate that participants in the normal weight category were likely to be placed into the correct category by fBMI. However, the accuracy of fBMI fell for extreme categories of underweight and obese, and participants were incorrectly placed. Contingency table analyses indicate that all 109 participants falling in the obese category of mBMI were placed into a lower category by fBMI (
Table 2). In comparing participant placement using mBMI and fBMI, we found that 60% of participants were placed in the correct category using fBMI.
Classifications of BMI included: <18.5 BMI (underweight), 18.5–24.9 (normal weight), 25.0–29.9 (overweight), and ≥30 (obese).
Cells include (1) count data, (2) total population percent, (3) column percent, and (4) row percent.
Total range: 14.73–49.74 kg/m
2 for mBMI and 16.29–28.85 kg/m
2 for fBMI. Average fBMI was 23.7 ± 1.5 kg/m
2 and average mBMI was 24.1 ± 4.5 kg/m
2. Difference in average BMI was 0.4 ± 3.0 kg/m
2. Matched pair comparison indicated that fBMI detected participant BMI as 0.4212 kg/m
2 less than mBMI (t(1209) = −3.39,
p < 0.0007). A matched pair plot shows analysis in
Figure 2. When examining the mean absolute error (MAE) between mBMI and detected fBMI, we found the MAE between the two results to be 3.2 ± 2.9 kg/m
2.
Matched pair data plot shown as difference between algorithm-predicted facial BMI (fBMI) and objectively measured BMI (mBMI). As gender is an important factor in BMI,
Figure 3 graph shows difference between gender average of algorithm predicted facial BMI (fBMI) and its relationship with objectively measured BMI (mBMI).
Both trajectories following a similar pattern analysis of MAE of mBMI and fBMI found no significant differences between genders (p = 0.1120).
4. Discussion
Determining weight status through BMI is a commonly utilized parameter in health-related research studies [
1]. When applying research outside the vicinity of one’s home university or research center, however, it may be challenging to obtain anthropometric data such as BMI. Our aim in this study was to use facial photographs and a previously developed algorithm to estimate BMI [
14]. We then compared the estimated facial BMI to our objective BMI calculated from measured participant anthropometrics to find fMBI correctly identified BMI in 58.4% of cases. fBMI was more accurate in normal weight and overweight categories than in underweight and obese categories. As stature is not included in the measurement for fBMI, it is possible that individuals who were considered obese by objective measurement were of short stature, although their fBMI detected their facial features only as appearing overweight. Furthermore, as our population was predominately in the ‘normal’ weight category, the algorithm had better odds at accuratelyn detecting this category.
Although the facial algorithm used in this study was nearly 60% accurate, reliability in research is vital for accurate results and drawing conclusions. Kocbey et al. [
17] examined social media profile pictures using both examined computer technology and actual human analyses of weight status to find that the computer and human judges detected similar results for BMI from the photos, with a tiny difference in results of less than 2%. This demonstration that the algorithm used was very similar to human visual judgment. A similar study by Dancheva et al. [
18] used single-shot facial images of predominately famous individuals to determine BMI, as compared to the current method used by Wen and Guo. Dancheva et al. found a smaller range of error (MAE) in their BMI predications compared to Wen and Guo. Comparing the accuracy of the Wen and Guo method, we find a MAE value slightly higher than Dancheva et al. (2.3 + 0.6), and at the high end of the range found by Wen and Guo in their previous work (2.65–4.29) [
14,
18]. Our findings show that when extending the usage of this algorithm to collaborative research efforts without the use of controlled photos, the error rate is within the range detected in previous studies. A method similar to Wen and Guo’s was used by Wolffhechel and colleagues testing principal components resulting from face shape and color features to find the best BMI predictor model using 2D principal components of both shape and color [
19]. Among more recent studies that have developed the use of facial imagery to estimate BMI, Pascali and colleagues examined 3D images of participants to estimate their BMI and found strong correlations between facial features and BMI [
20]. However, the study had a small sample size (n = 30) and participants were required to travel to the researchers to be scanned by the 3D technology [
20]. This burden to the participant is not feasible for dissemination of lifestyle interventions and this method does not further the use of simple photographs for detecting BMI, which remains the ultimate goal for improving the current method.
When looking into the dissemination and implementation of science and the ability to take current interventions out of the laboratory for use with the public, utilizing BMI as a simple measure can be vital to capturing data on participants. There are several methods used for measuring BMI which have been explained here: self-reported measures, an intervention facilitator physically measuring participants, or the proposed facial image prediction [
14]. The utilization of a simple ‘selfie’ from participants around the world participating in the dissemination of interventions may bridge the gap between scientists collecting data and community use of projects. However, along with further testing and improving of the fBMI algorithm, comparing the reliability of self-reported BMI to facial recognition BMI could be of interest in future research. Self-reported height and weight as well as BMI should be included in surveys and questionnaires and correlations between mBMI, fBMI, and self-reported BMI should be analyzed. Understanding the accuracy of both fBMI and BMI measurements and improving the fBMI algorithm can enhance the dissemination and implementation of research.
Our current study is not without limitations. As with retrospective analyses and data mining post intervention, bias can be found with significant results. However, the plan for this subproject was in place at the start of the overarching project. We understand the bias of BMI, but as a gold standard for quickly measuring weight status, this was used to test for future intervention dissemination. We had a wide spread of individuals enrolled in this project; however, they were at four separate sites and dealt with different researchers. Some photos were rendered illegible by the algorithm and unable to be used for analysis. However, to address potential poor quality of the photos and reliability of data capturing, researchers at all sites were trained for inter-rater reliability. When addressing this issue moving forward, especially in dissemination research, stressing the importance of quality photos with a clear face will be imperative. We also found considerable error of fBMI compared to mBMI. However, to our knowledge this was the first study using community researchers to capture and test their own participant photographs for use with the algorithm. This method needs further testing before it can be legitimately used by other researchers and the public outside of pure research.


