1. Introduction
Injury is a significant cause of death and disability [
1], accounting for 10% of global burden of deaths [
2]. A number of injury severity scoring systems have been reported to quantify the severity of injury by considering measurable or observable status of the patient’s medical condition [
3]. Trauma scoring systems can be beneficial for [
4,
5]: (i) triage: a procedure to assess severity of medical condition for the purpose of setting treatment priority; (ii) prognostic evaluation: a procedure to support predication and management of injury outcomes and (iii) research: studies to compare patient groups on the basis of injury outcomes and assessing medical care and treatments. Trauma scoring systems can be classed as anatomical, physiological and combined. Anatomical scoring systems quantify the extent of individual anatomical injuries, taking into account the injury site by appropriate weightings (coefficients) however these weightings are often not known when the patient presents to hospital after a civilian trauma where most injury mechanisms are blunt (e.g., falls and road traffic collisions) [
6]. Physiological scoring systems are based on cardiovascular, neurological and respiratory abnormalities. They provide mechanisms to determine the likelihood of mortality and inform triage; but can lack precision [
6]. Combined anatomical and physiological scoring systems integrate the strengths of the anatomical and physiological scoring systems to improve their estimation of the probability of survival [
7].
Trauma scores together with host factors such as sex, age and pre-existing medical condition are used in models to determine probability of survival [
8,
9,
10,
11,
12]. The aim of this study is to investigate the effectiveness of a Bayesian method called Predictive Statistical Diagnosis (PSD) to determine probability of survival in Traumatic Brain Injury (TBI).
TBI can be defined as impaired brain function or other evidence of brain injury resulting from an external mechanical force, commonly a blunt force [
13]. The injury mechanism could be classed as focal, diffuse and mixed [
14,
15]. Focal injuries result from blows to the head. These can result in laceration, contusion, and hemorrhage. Diffuse injuries are associated with stretching and twisting of axons and blood vessels by shear forces, resulting from acceleration, deceleration, and rotation of the brain. In mixed mechanisms both focal and diffuse mechanisms are present. Brain injuries resulting from incidents such as a blast could be mixed type. Brain injury can also be categorized as primary or secondary where primary injury is damage to the brain parenchyma as a result of the initial injury while the secondary injury occurs hours to days later as a result of the inflammatory effects that cause cerebral edema and cell depth [
13]. TBI is the leading cause of death among those aged less than 45 years and in children aged between 1 to 15 years [
15].
PSD was chosen as it is a robust statistical approach for developing models for differentiation between subject types. It has been successfully applied in studies for differentiating between healthy subjects and schizophrenic subjects based on a type of cognitive evoked potential extracted from the electroencephalogram (EEG) [
16] and to identify an EEG extracted visual evoked potential component called the lambda wave [
17]. In the following sections a brief explanation of current approaches to determine the probability of survival is provided, the concept of PSD is introduced, and our methodology and results are presented.
2. Trauma Scoring Systems
The Abbreviated Injury Scale (AIS) introduced in 1971 is a widely used anatomical injury severity scale [
18]. AIS has been revised in 1980, 1985, 1990, 2005, 2008 and 2015. Its 1990 version (AIS-90) classifies more than 2000 injury types into nine body regions consisting of head, face, neck, abdomen, spine, upper extremities, lower extremities, and external [
19]. An injury is given AIS scores in an ordinal scale from 1 (minor injury) to 6 (maximum injury, possibly lethal). In patients with multiple injuries, the maximum AIS score is used to describe the overall severity but this has been reported to not correlate linearly with probability of death [
4]. A derivative of AIS called Injury Severity Score (ISS) [
20] was introduced to facilitate combining anatomical injuries from multiple sites. The ISS has a range of 1 to 75 and is calculated by grouping the nine AIS body regions into six (head or neck, face, chest, abdominal or pelvic contents, extremities or pelvic girdle, and external) and then summing the squares of the highest AIS values for three most severely injured body regions [
21].
One of the most consistent features of TBI—impairment of brain function or other evidence of brain damage resulting from an external force is impairment of consciousness [
22,
23,
24]. Glasgow Coma Scale (GCS) was introduced by Jennett and Teasdale (1977) [
24] to assess the level of consciousness in a wide range of disorders and thus it has a role in grading TBI [
25,
26]. In the GCS, assessment is performed by examining the extent of eye opening, verbal response and motor response as indicated in
Table 1.
The GCS is the sum of its three components, i.e., eye opening score + verbal score + motor score. The eye-opening component examines the arousal mechanism of the brainstem; the verbal component examines the integration of cerebral cortex and brainstem and the motor response examines the integrity of cerebral cortex and spinal cord [
27].
TBI can be classed as mild, moderate or severe. TBI with GCS of 13 to 15 is graded as mild. TBI with GCS of 9 to 12 is graded as moderate and is associated with prolong loss of consciousness, abnormal neuroimaging, and neurological deficit. Patients in this category may need neurological evaluation and intervention [
26]. GCS of 8 or less is graded as severe TBI. These patients have significant neurological injury and typically have abnormal neuroimaging observed from Computed Tomography (CT) such as a skull fracture, traumatic intracranial hemorrhage, or cerebral contusion [
26,
28].
Although GCS is valuable for TBI assessment, it has some limitations. For example brain stem reflex eye movements are not considered [
29]. Champion et al. (1989) [
30] introduced a physiological trauma assessment system called Revised Trauma Score (RTS) that incorporates the GCS, systolic blood pressure and respiratory rate as shown in
Table 2. This index is determined by adding up the results from the values of the three components and multiplying them by their corresponding weights.
3. Approaches to Determine Probability of Survival
Trauma and Injury Severity Score (TRISS) is a method that combines anatomical and physiological scoring systems to determine the probability of trauma survival (
ps) for adults sustaining traumatic injuries from blunt and penetrating mechanisms [
31]. The probability of survival using this system is given by
where
i = 1 is for blunt mechanism and
i = 2 is for penetrating mechanism,
αi is a constant for mechanism
i,
βAGE,i is the coefficient related to age and mechanism
i,
βRTS,i is the coefficient associated with RTS and mechanism
i,
βISS,i is the coefficient associated with ISS and mechanism
i. RTS is obtained by
where
βRR is the coefficient associated with respiration rate (RR),
βSBP is the coefficient associated with systolic blood pressure (SBP), and
βGCS is the coefficient associated with GCS. TRISS however has a number of shortcomings related to calibration of its coefficients, variable inter-relationships or interactions and strong linear assumptions between predictor variable and survival outcome [
31,
32]. Adjustments to its coefficients result in performance variations by TRISS in predicting probability of survival for trauma patients [
33].
In 2004, the Trauma Audit and Research Network (TARN) [
34] proposed a Probability of Survival model called Ps04. This model uses age, gender, their interaction, ISS and GCS (including a variable for intubation). In 2014, TARN introduced the Ps14 model by incorporating the Charlson Comorbidity Index (CCI) [
35] to the assess Pre-Existing Medical Conditions (PMC). To predict probability of survival in Ps14, Ps04 parameters and CCI are required. It determines the percentage of probability of survival by performing retrospective measure of a new patient by comparison with those of a similar profile on the TARN database. For example, if
ps = 53%, then on average 53 out of every 100 patients have survived and 47 patients have not survived.
where
e = 2.718282 and
b is defined as the linear combination of the regression coefficients and the values of the corresponding patient’s characteristics (ISS, GCS, modified CCI, age and gender).
4. Predictive Statistical Diagnosis
Predictive statistical diagnosis (PSD) uses Bayesian statistics to determine to which of a given set of predefined types
t, a measurement expressed by a feature vector (
x) belongs [
36,
37]. It uses example cases of known types, represented in a training data set to obtain the values of its calibration parameters. Once these parameters are calibrated, it can classify an unknown case into the types represented by
t.
The probability that an observation vector
x and parameter vector
θ belongs to the type
t1 is given by Bayesian statistics as
where
p(
t1) is the prior probability of type
t1,
p(
x|t1,
θ) is the probability density function of
x for a given type
t1. Equation (4) can be rewritten as predictive density function for an observation
x on a case of type
t assessed on the training data
Z as [
36,
37].
To determine above,
q(
x|t1,
Z) can be replaced with [
37]
where there are
nt cases of type
t with feature vectors
x1,
x2, …
xn;
vt is the degrees of freedom given by
nt − 1,
mt and
St are the mean and the covariance matrices respectively.
Std represents a
d-dimensional student
t density determined as
where the variables
v,
b and
c relate to Equation (6) as
v =
vt,
b =
mt and
.
is the gamma function,
T and −1 represent matrix transpose and inversion operations, respectively. Using Equation (5),
p(
t1|x,
θ) is determined for the cases of known types. Then to compute the probabilities for the unknown cases (i.e., those on the validation data set), Equation (7) uses the observation vector
x for cases of known types but retains the mean (
mt) and covariance (
St) matrices to identify an unknown type. The parameters
mt and
St are calibration information for the PSD.
5. Methodology
The TBI data used in this study were provided by the TARN [
34]. They provided a subset of their very large database excluding the cases that were not relevant to this study. Only adults with TBI that had full record of age, GCS, AIS, respiration rate, pulse rate, systolic blood pressure and their associated Ps14 were selected for this analysis. Subjects aged less than 17 years were excluded as their injury survival characteristics were considered to be different from the adults and thus their inclusion with adults in a single model would have made the model more complex. The number of available cases aged less than 17 with TBI was considered insufficient for developing such a model. Trauma deaths for subjects who were less than 17 years old in the U.K. (where this study was carried out) is rare relative to the adults. Children in the TARN database were treated in different wards and hospitals to the adults. Furthermore, most organ systems are mature by 12 years, while bones can grow until age 21 years. However, this does not impact on trauma mortality. A statistical summary indicating sex, age and number of the cases included in the study is provided in
Table 3.
Calibration (training) and validation data sets were created. The calibration data set contained roughly 2/3 of the cases (number = 2676) and was used to calibrate the PSD. The validation data set contained the remaining subjects (number = 1448) and was used to determine PSD’s performance on cases not included in the calibration set. The decision to use roughly 2/3 of the cases for calibration and the rest for validation was based on including representative injury patterns for performing PSD calibration and to validate it on the remaining cases. Adult subjects whose full set of parameters for input to PSD were unavailable were excluded.
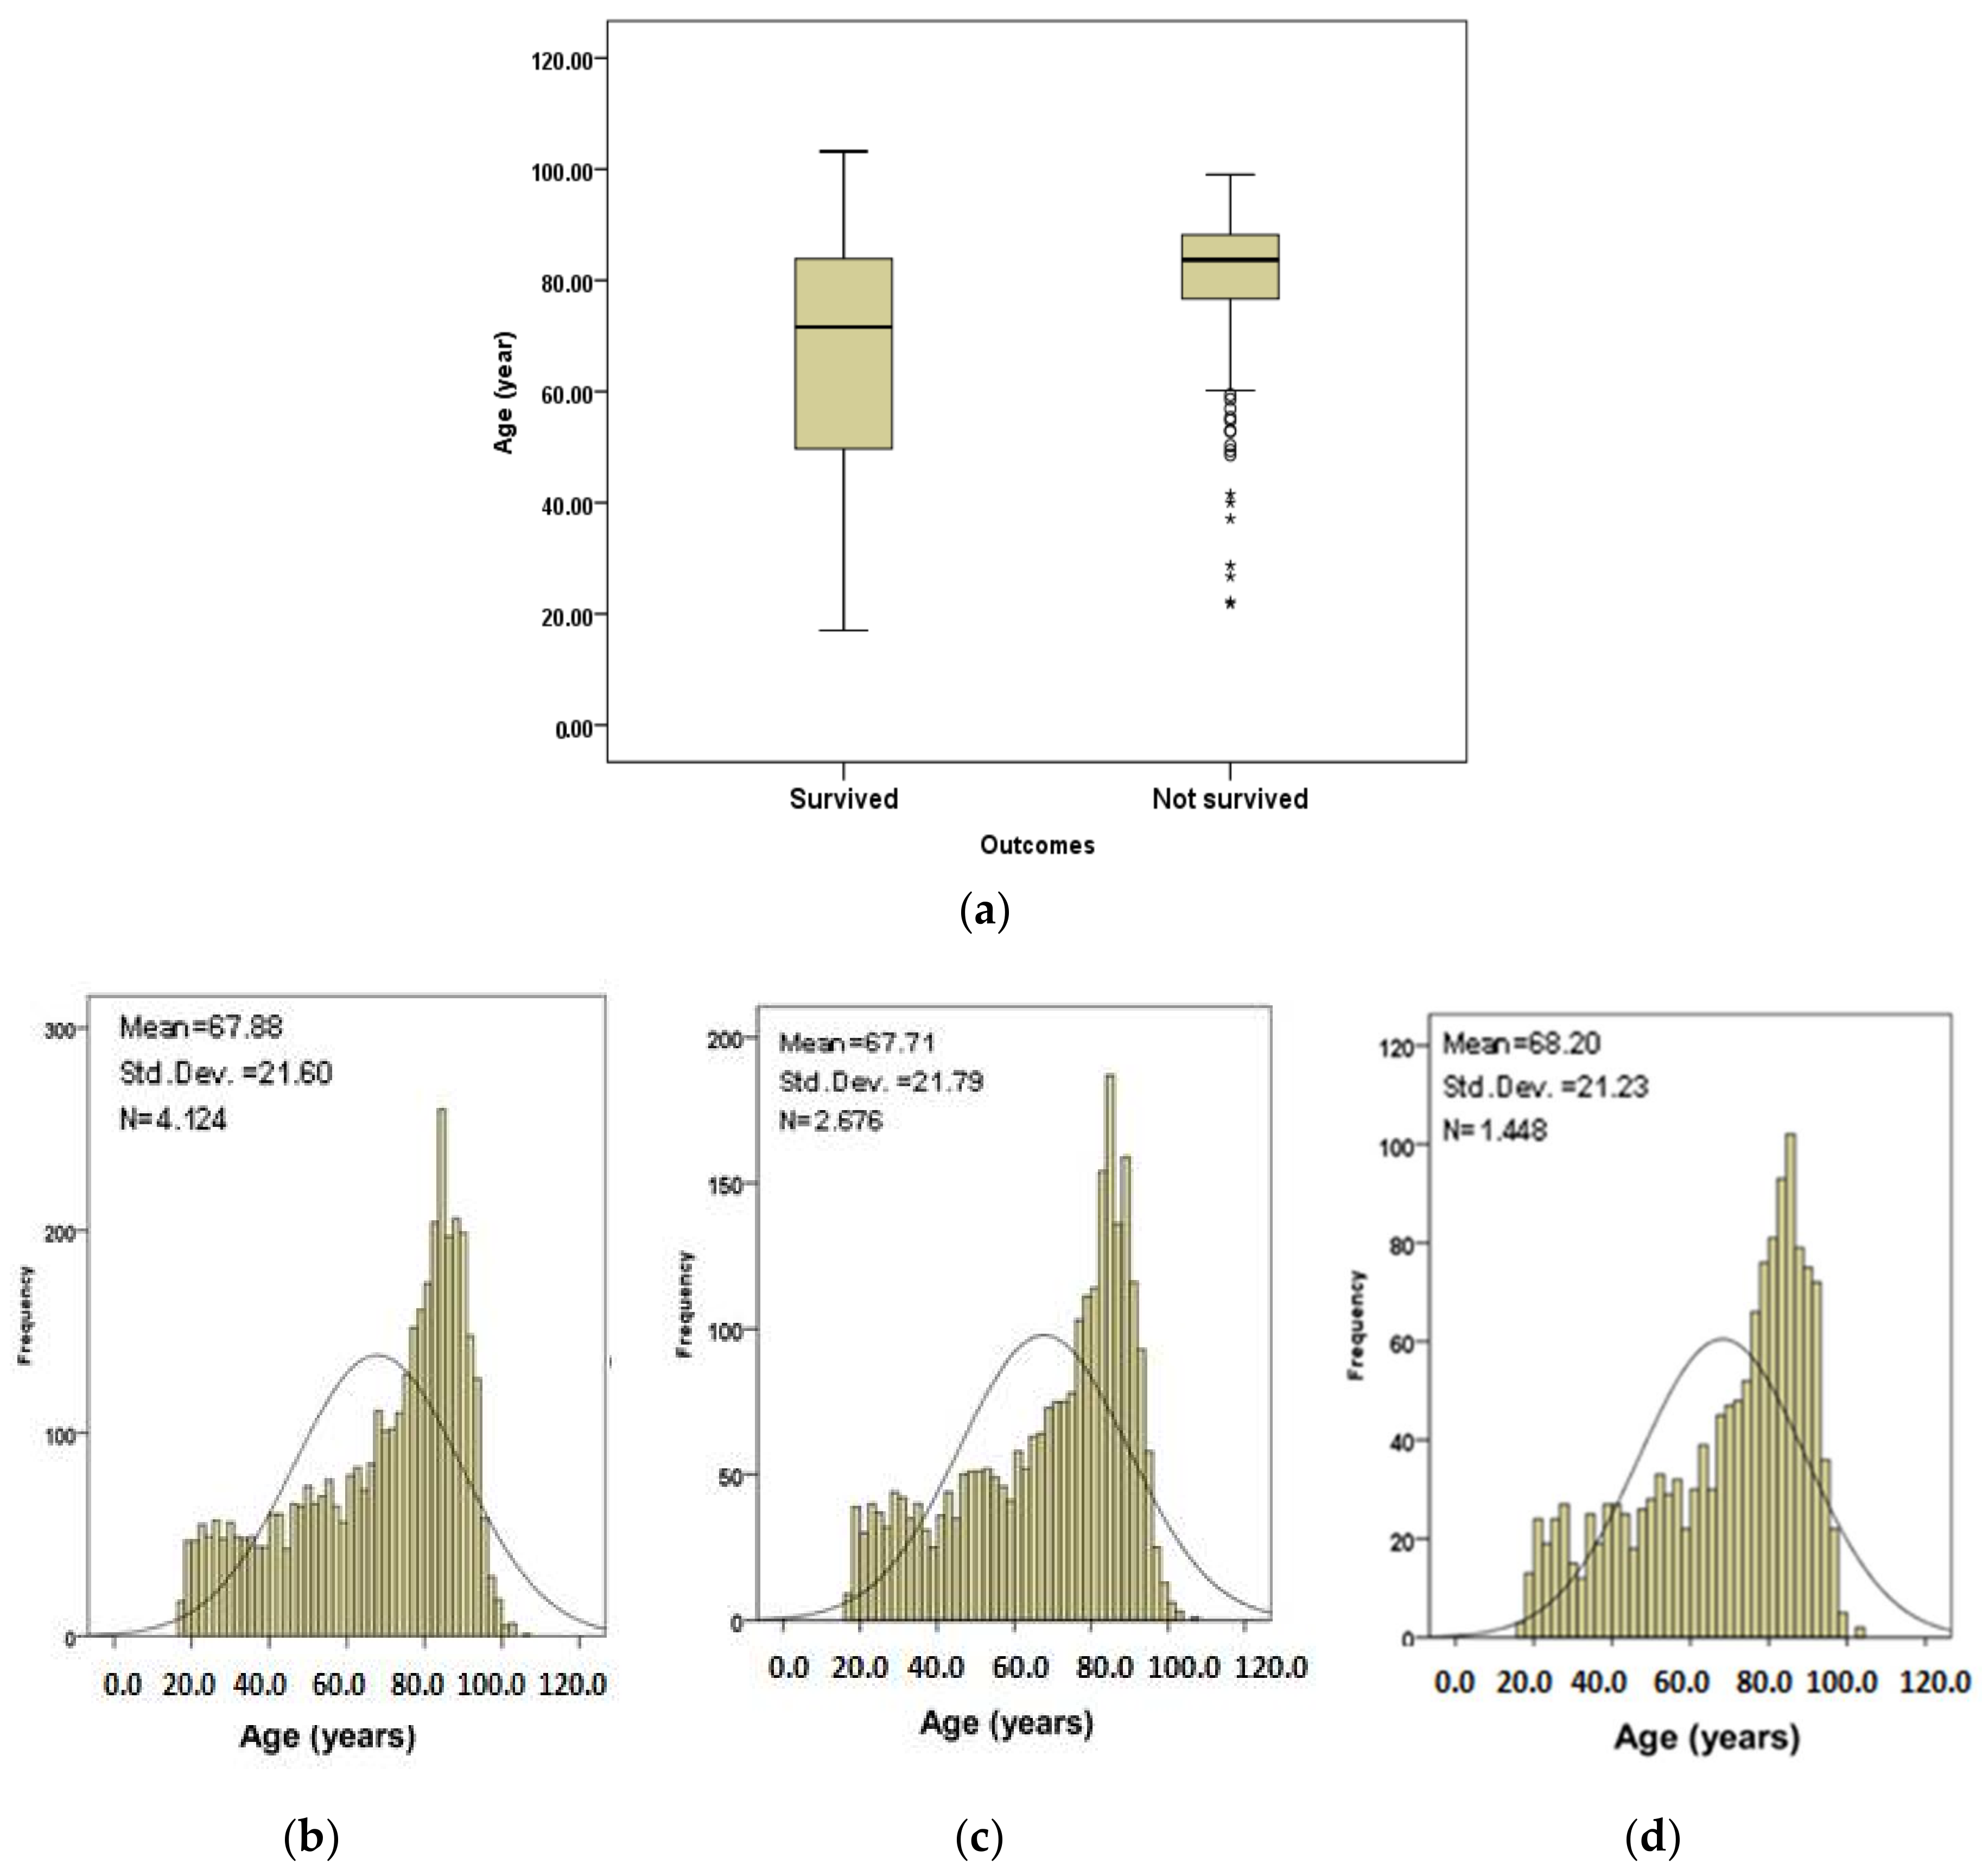
Figure 1 shows age information plots for the subjects.
Figure 1a shows the age boxplots for the subjects that survived and those that did not survive. The median of age (83.7 years) for subjects that did not survive is higher than for the subjects that survived (71.6 years).
Figure 1b shows the age distribution of all subjects.
Figure 1c,d show the age distributions for subjects that survived and those that did not survive respectively. The subjects in calibration and validation datasets were randomly selected from the complete set through a random number generator function. Therefore, the cases in each set had comparable age, AIS, GCS, respiration rate, systolic blood pressure and pulse rate values.
From here onward in the paper, the results relate to the subjects included in the validation dataset only as these subjects are basis for analyzing the performance of PSD.
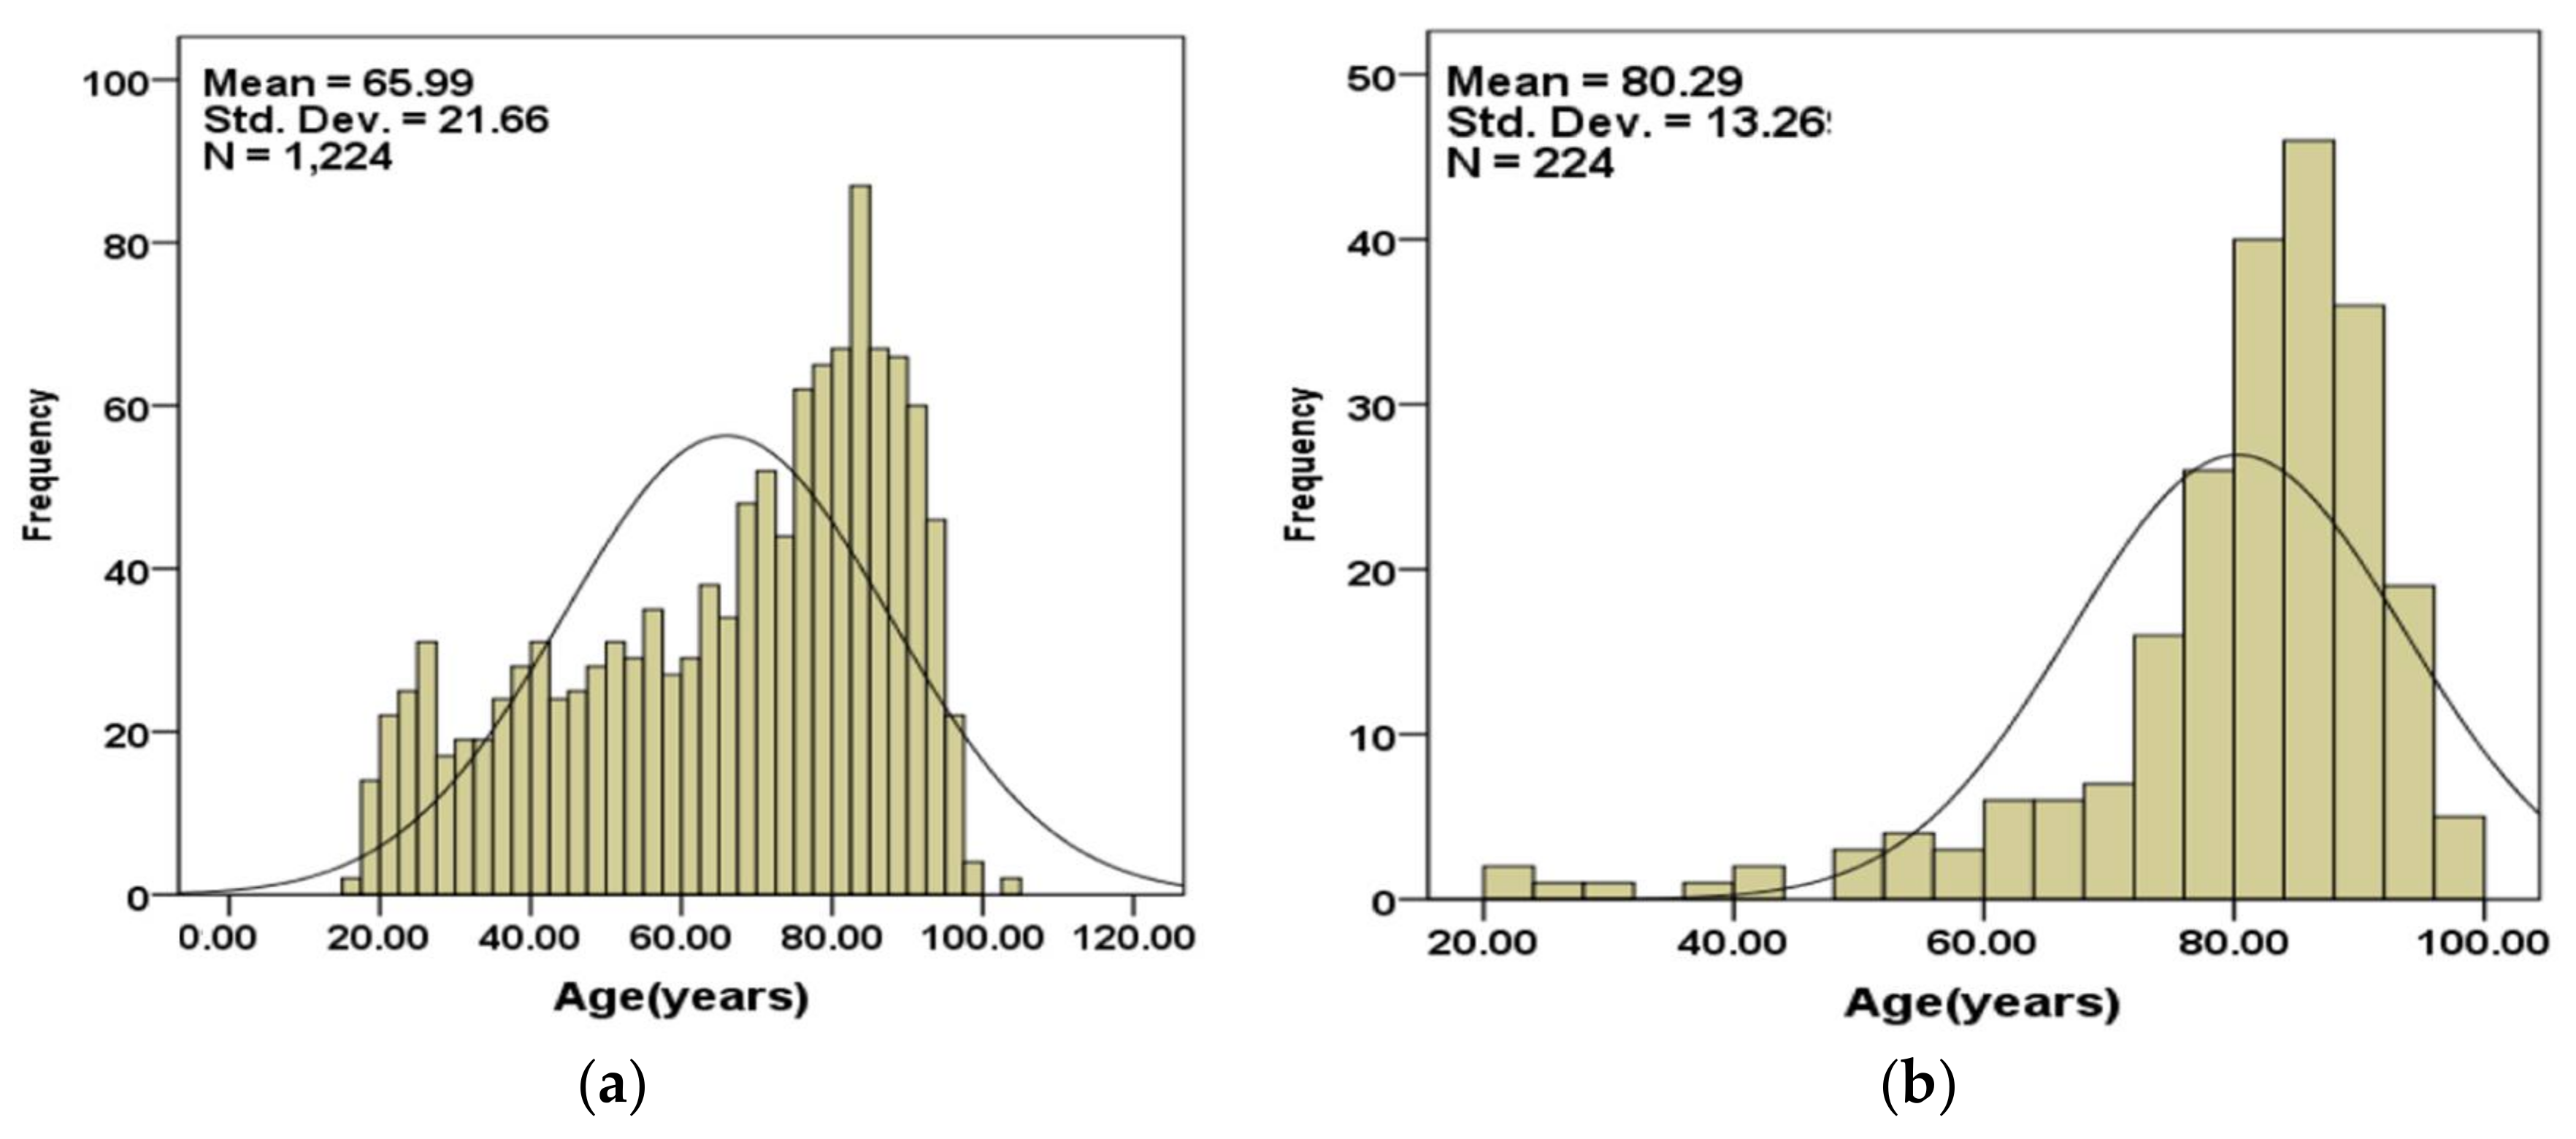
Figure 2a,b show the age distributions of the subjects that are included in the validation set separated into those that survived (
Figure 2a) and those that did not (
Figure 2b).
The age statistics for subjects included in the validation set is summarized in
Table 4.
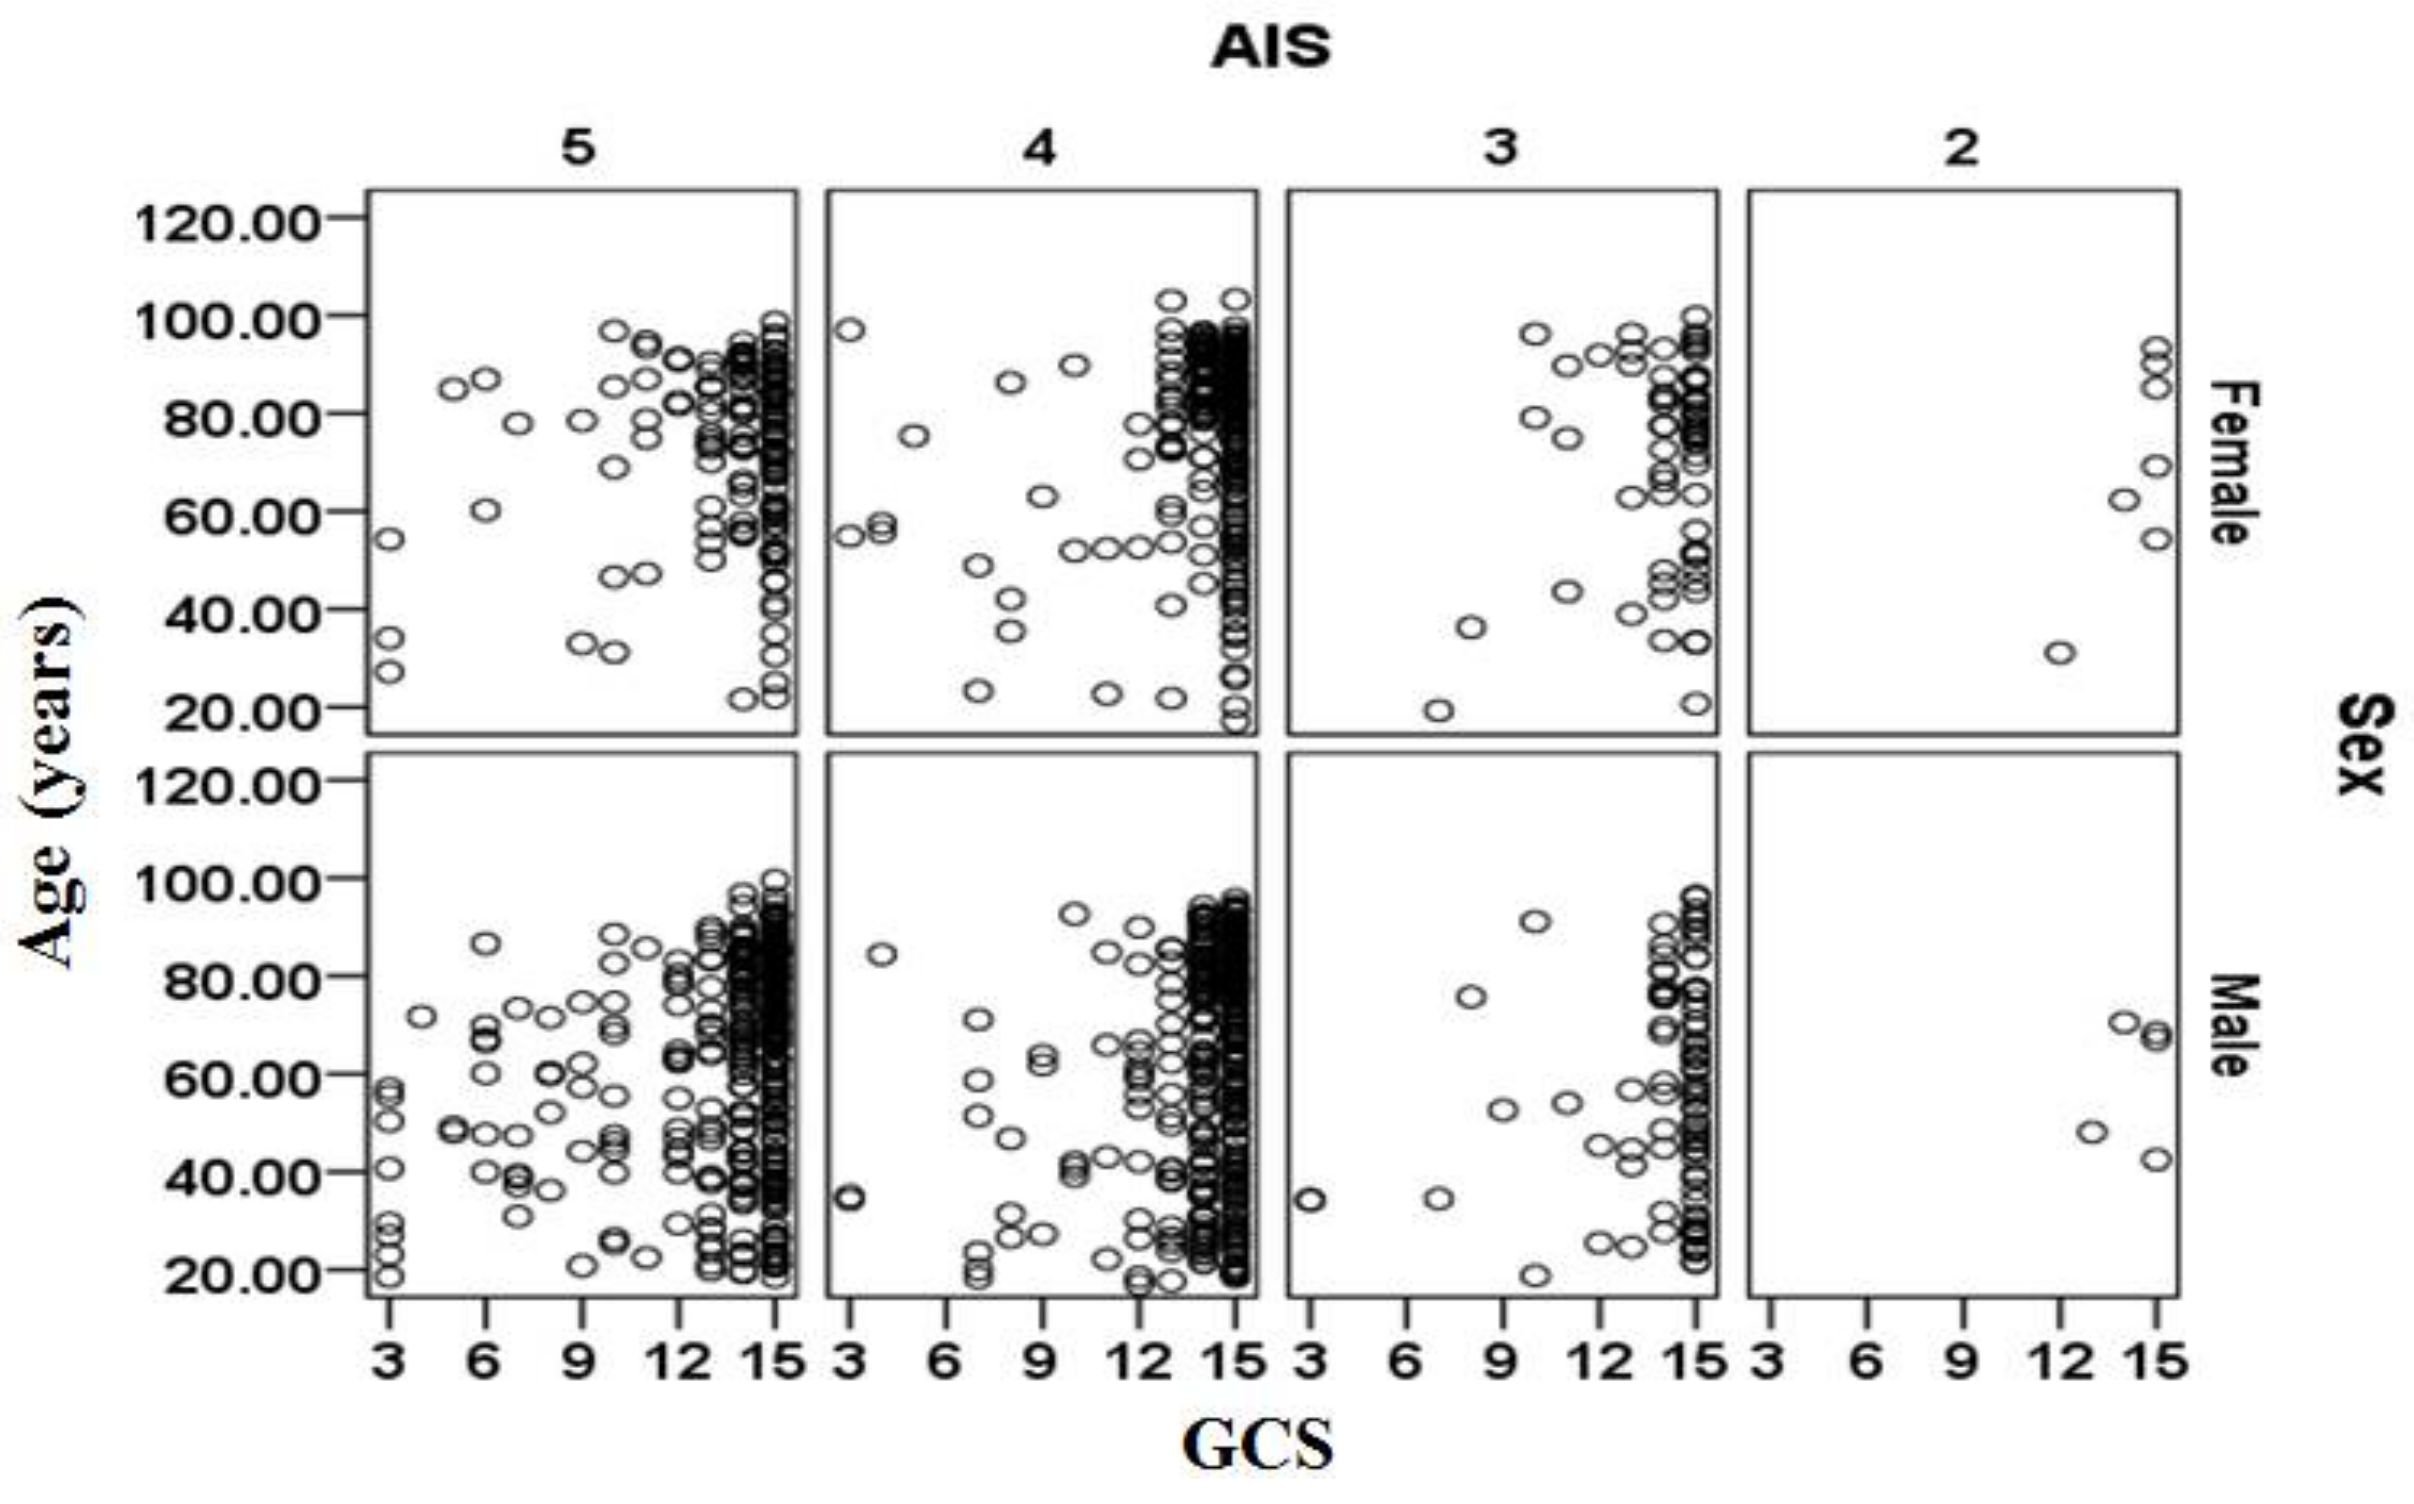
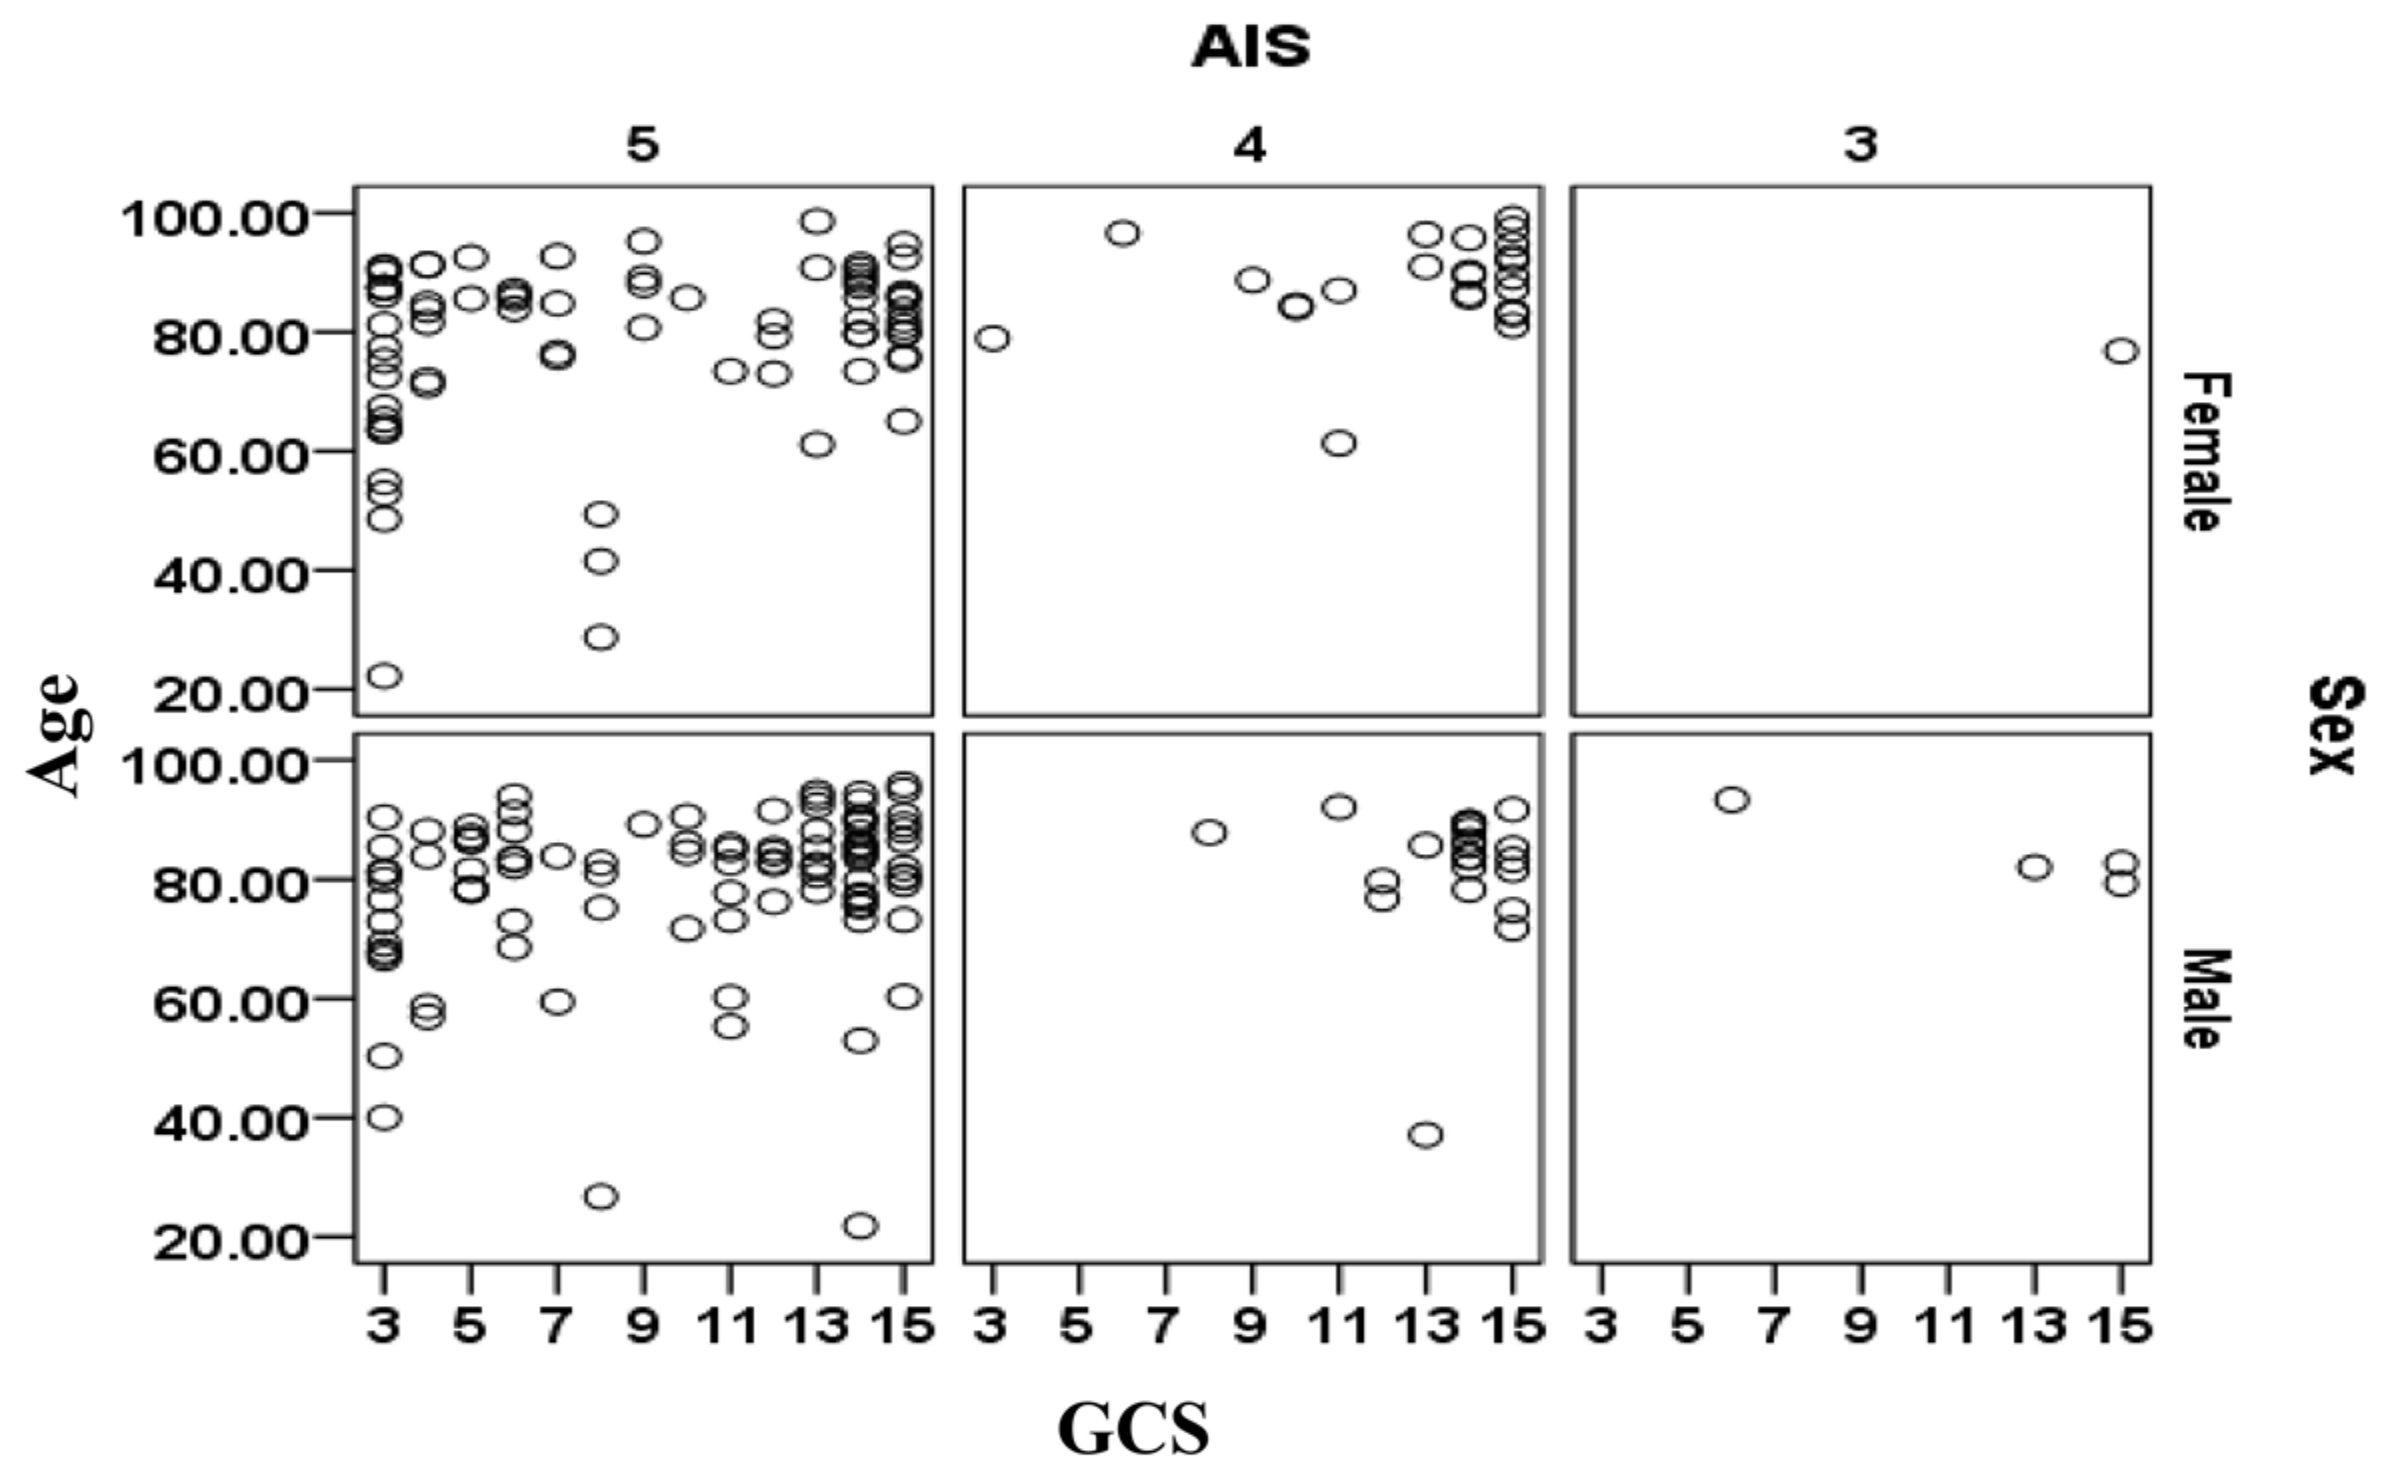
The relationships between age, sex, AIS and GCS for the cases included in the validation data sets are shown separately in
Figure 3 for the cases that survived and in
Figure 4 for cases that did not survive. There is a large cluster of surviving cases associated with AIS = 4 and 5 and GCS = 15 (mild injury severity). The subjects that did not survive are primarily clustered at AIS = 5 and tend to be more than 70 years. The relationship between sex (male/female) and survival outcomes from
Figure 3 and
Figure 4 should be treated with caution as the complete set contained 1.521 times more males than females (i.e., 2488 male cases and 1636 female cases).
The values of the Ps14 were already available from the TARN database and so we only used these existing values for comparison with PSD. The parameters considered as input to PSD were AIS, GCS, respiratory rate, pulse (heart) rate, systolic blood pressure (SBP), sex (male/female) and age. In order to be able to analyze these parameters more effectively, their values (except AIS) were categorized as shown in
Table 5 [
38]. The categorization allocated the values of these variables into predefined groupings, i.e., normal, abnormal mild, moderate severe. The advantages of this operation are that the inter-class variations within the measured variables could be reduced and the results could be interpreted more specifically into severity types. The disadvantage this categorization is, however, that actual readings are replaced by their category types.
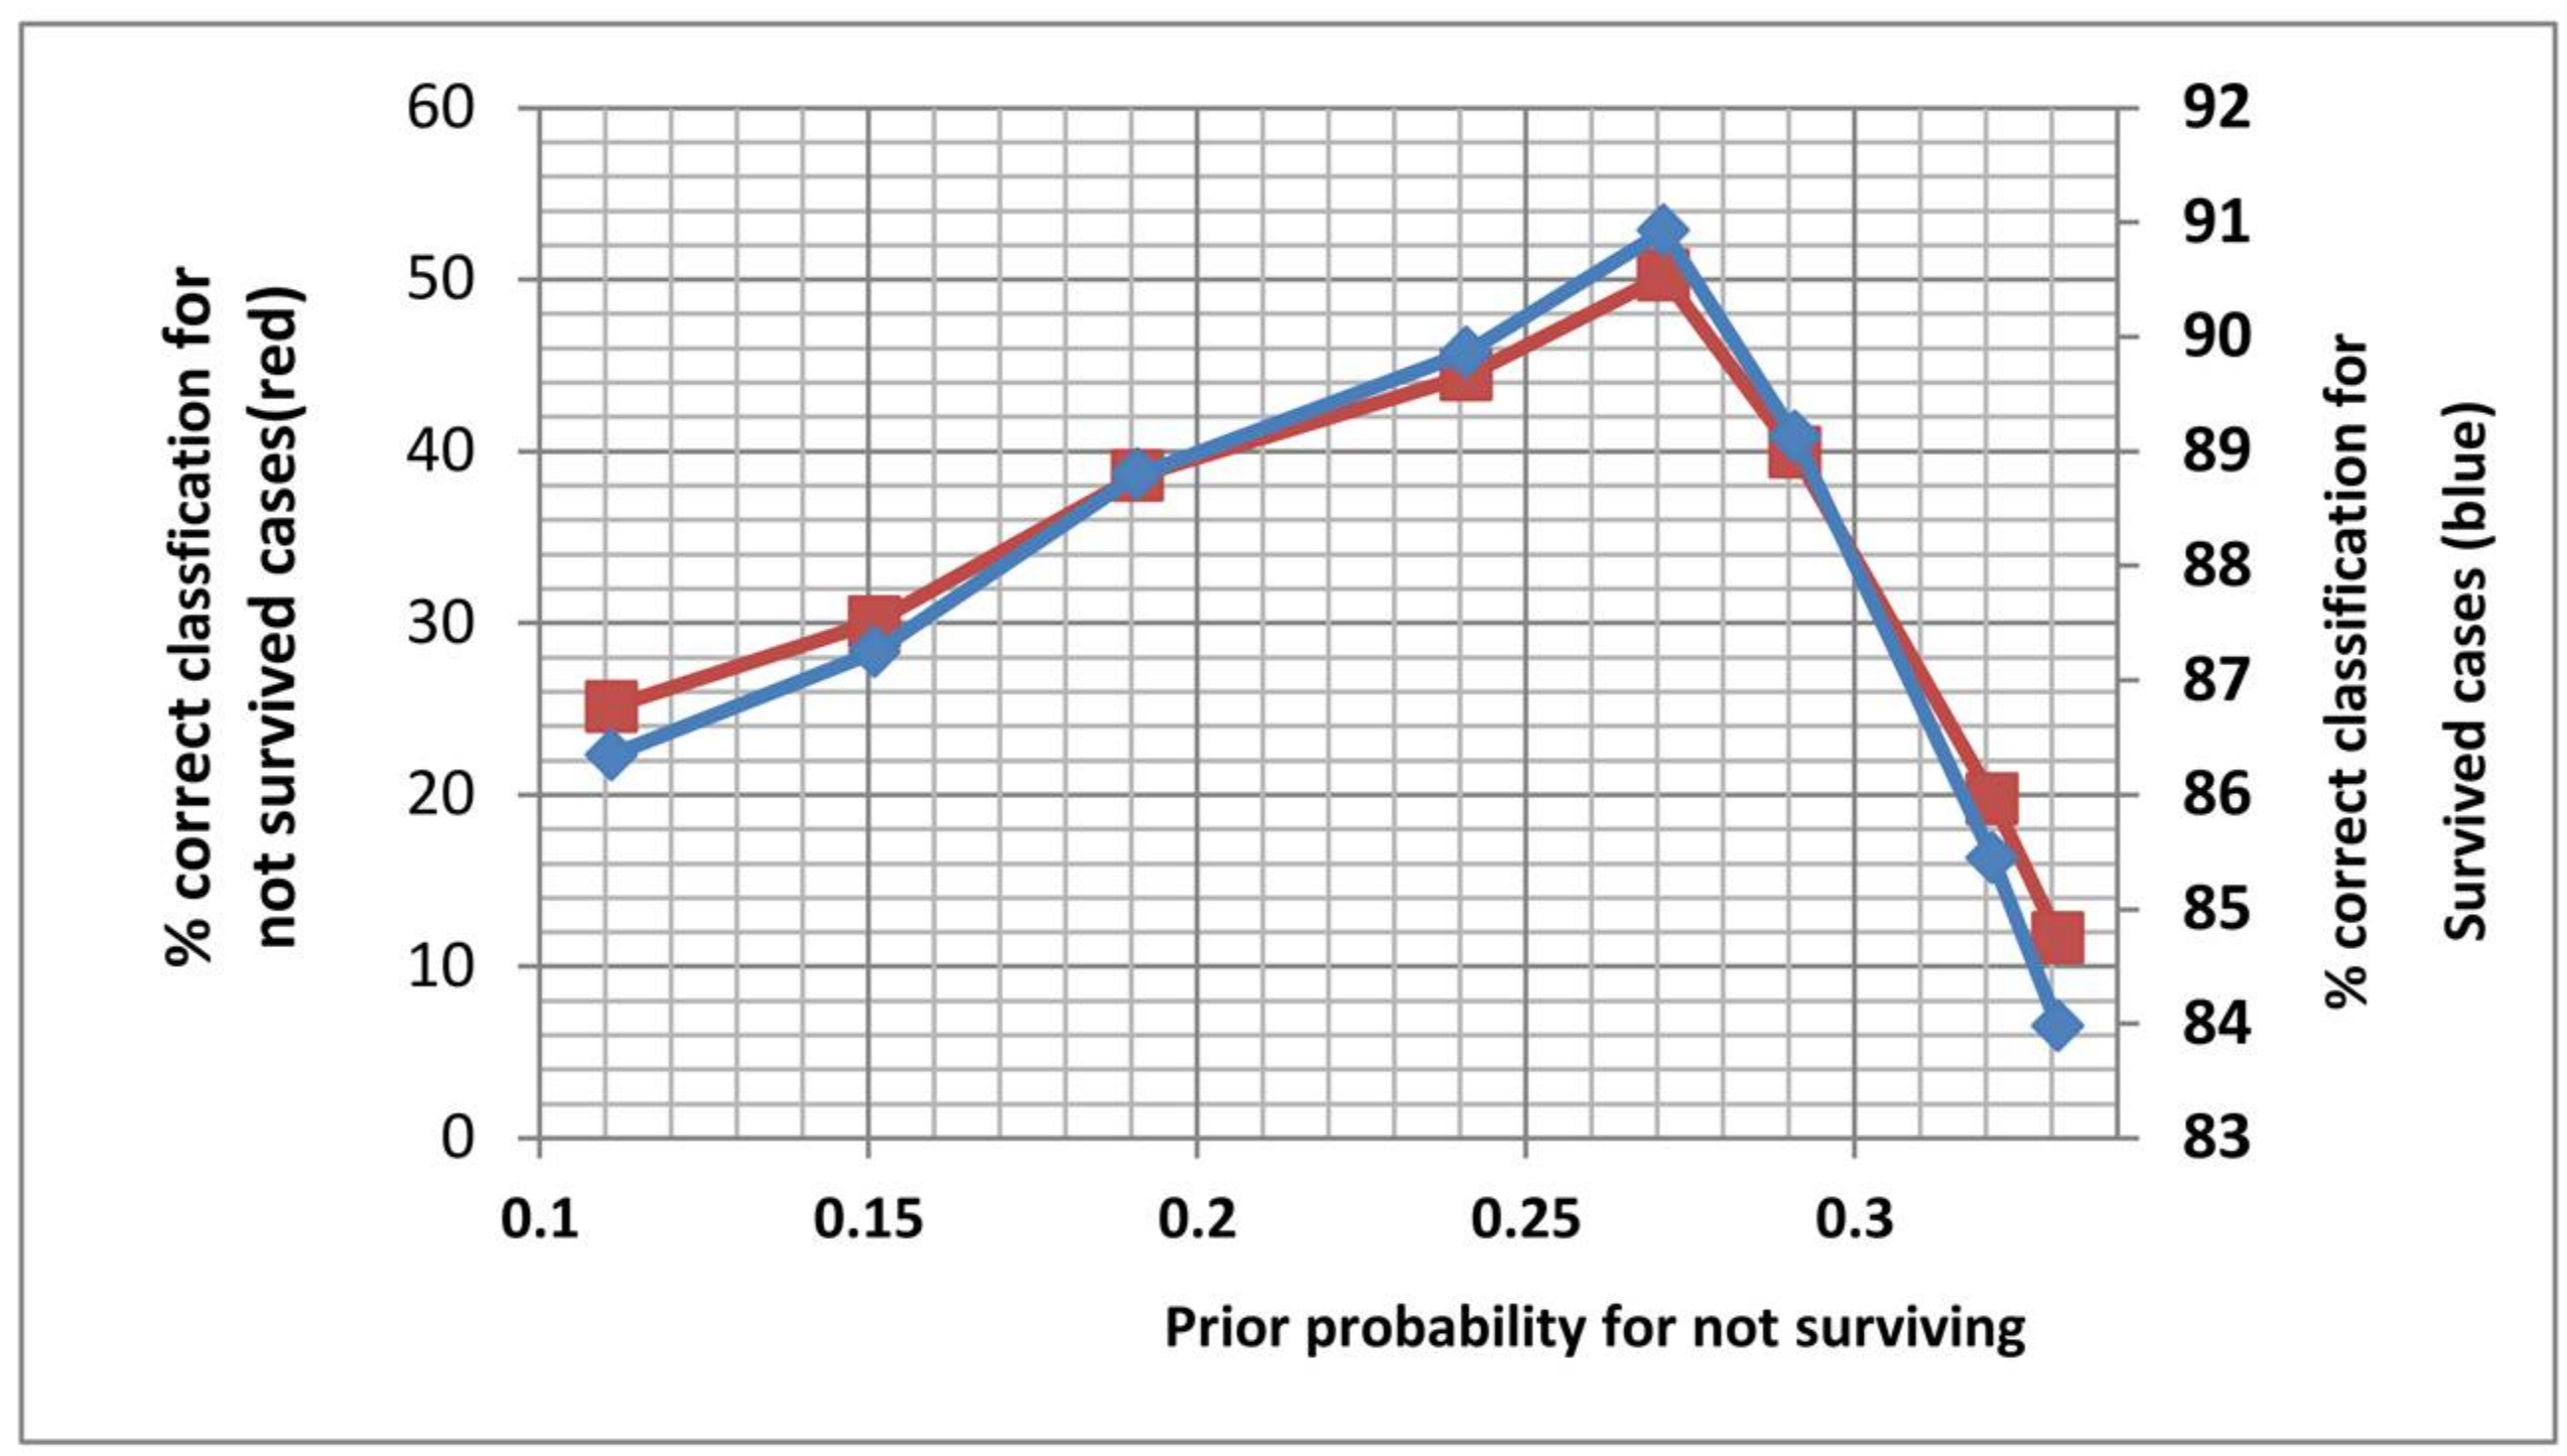
PSD required the prior probability for not surviving to be specified as part of its operation (prior probability of survival = 1-prior probability for not survival). To determine the most suitable value for this prior probability, prior probability values between 0 and 1 were experimented and for each value the percentage correct identifications for the survived and did not survive cases for the calibration (training) dataset were obtained.
Figure 5 shows the plot of these results. The graphs indicated that highest identification accuracy was for prior probability equal to 0.27 and this value was chosen for the rest of the analysis (only a section centered on 0.27 is shown in the figure).
6. Results and Discussion
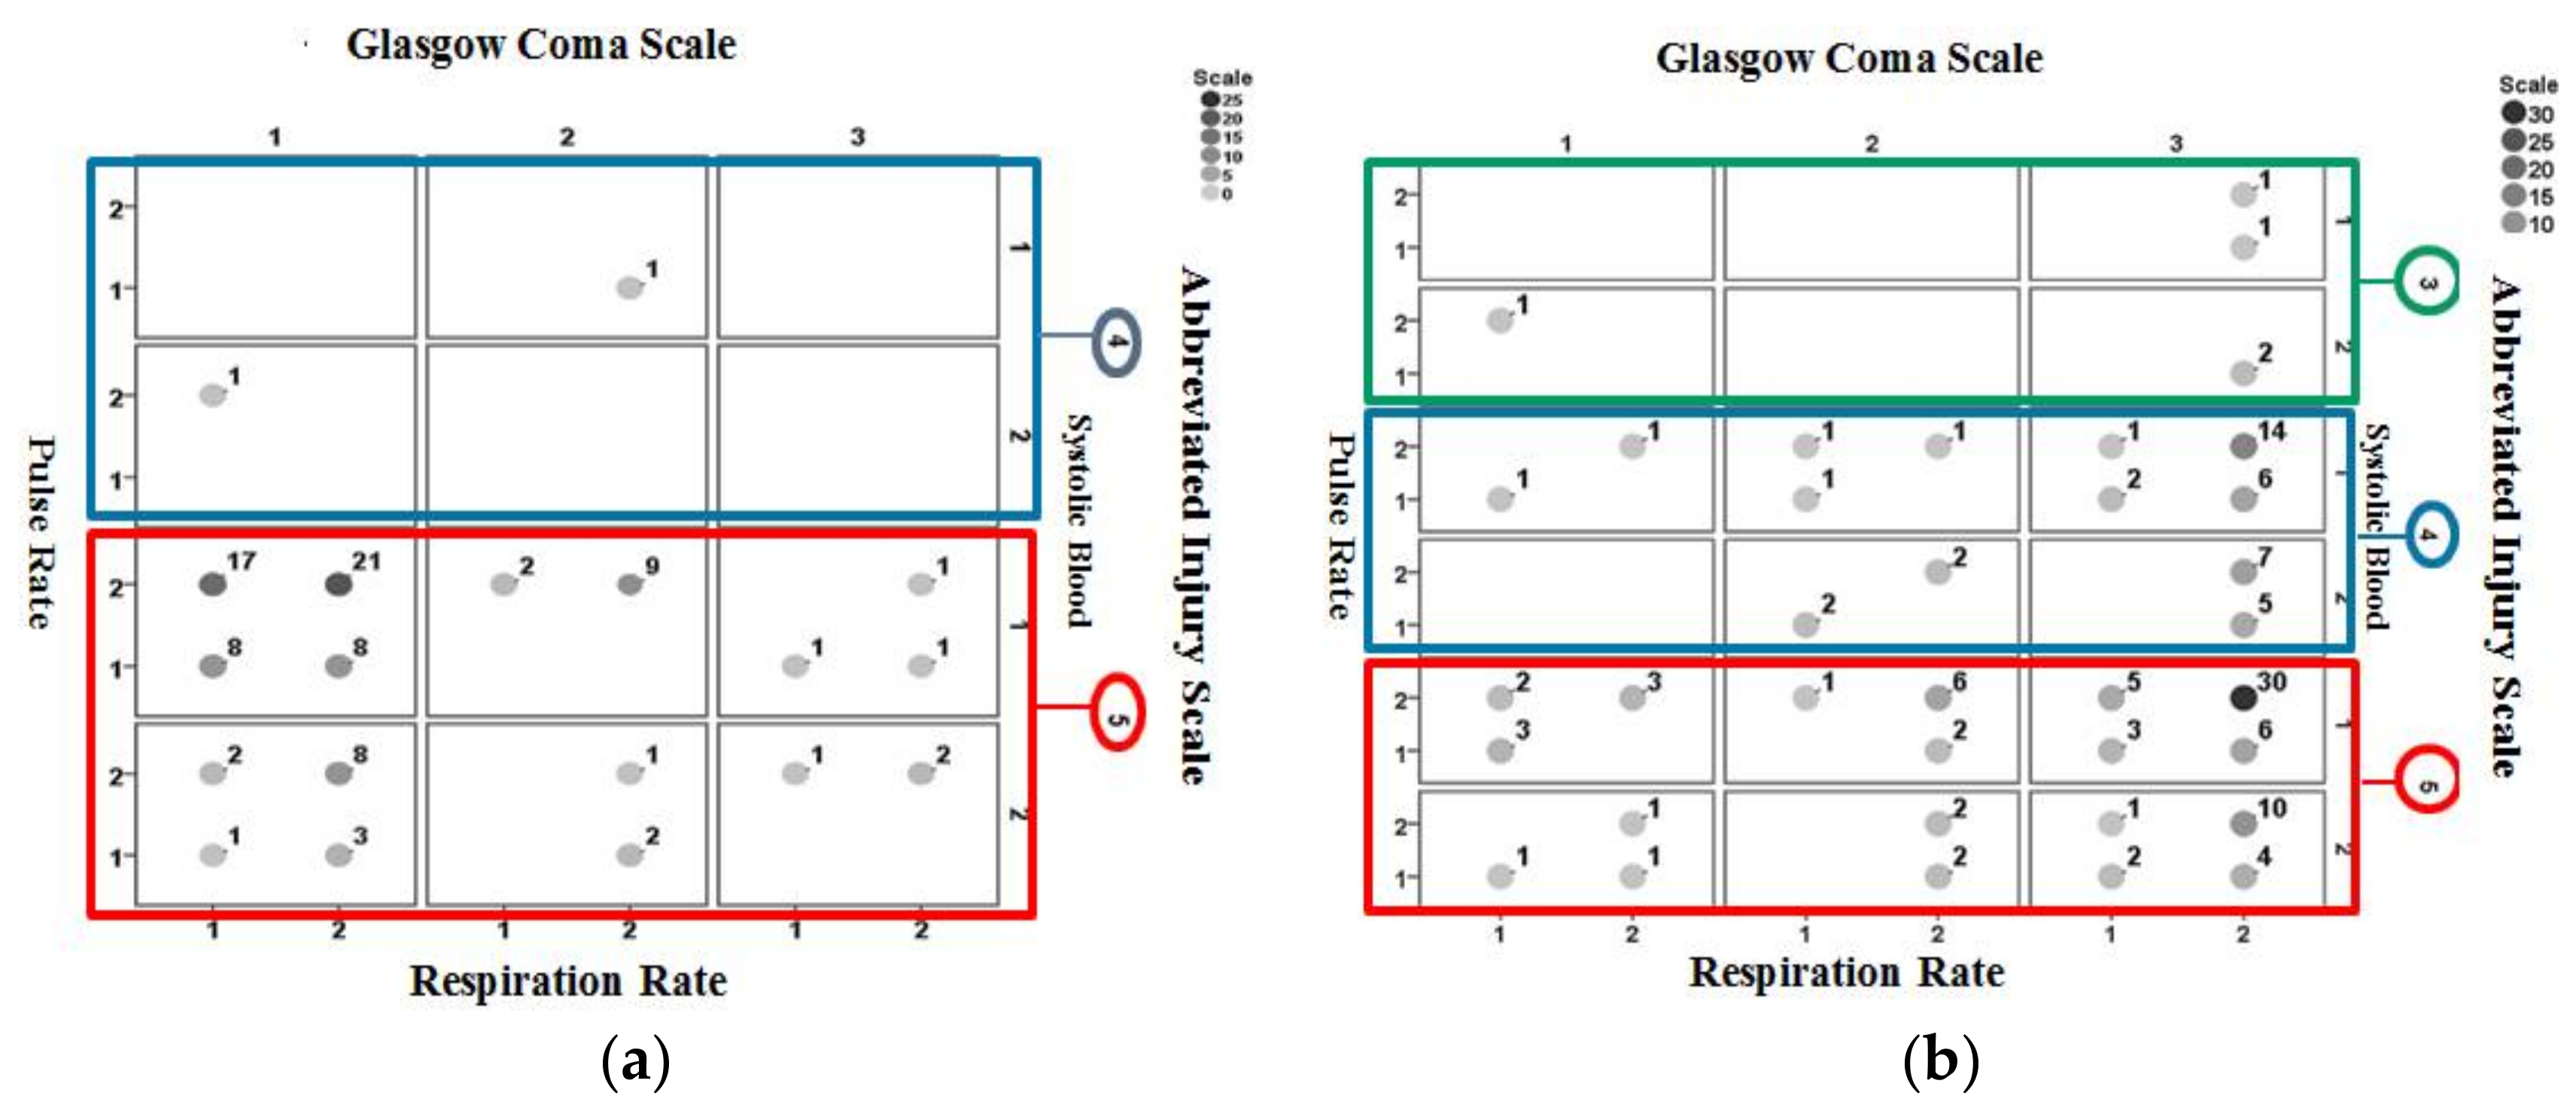
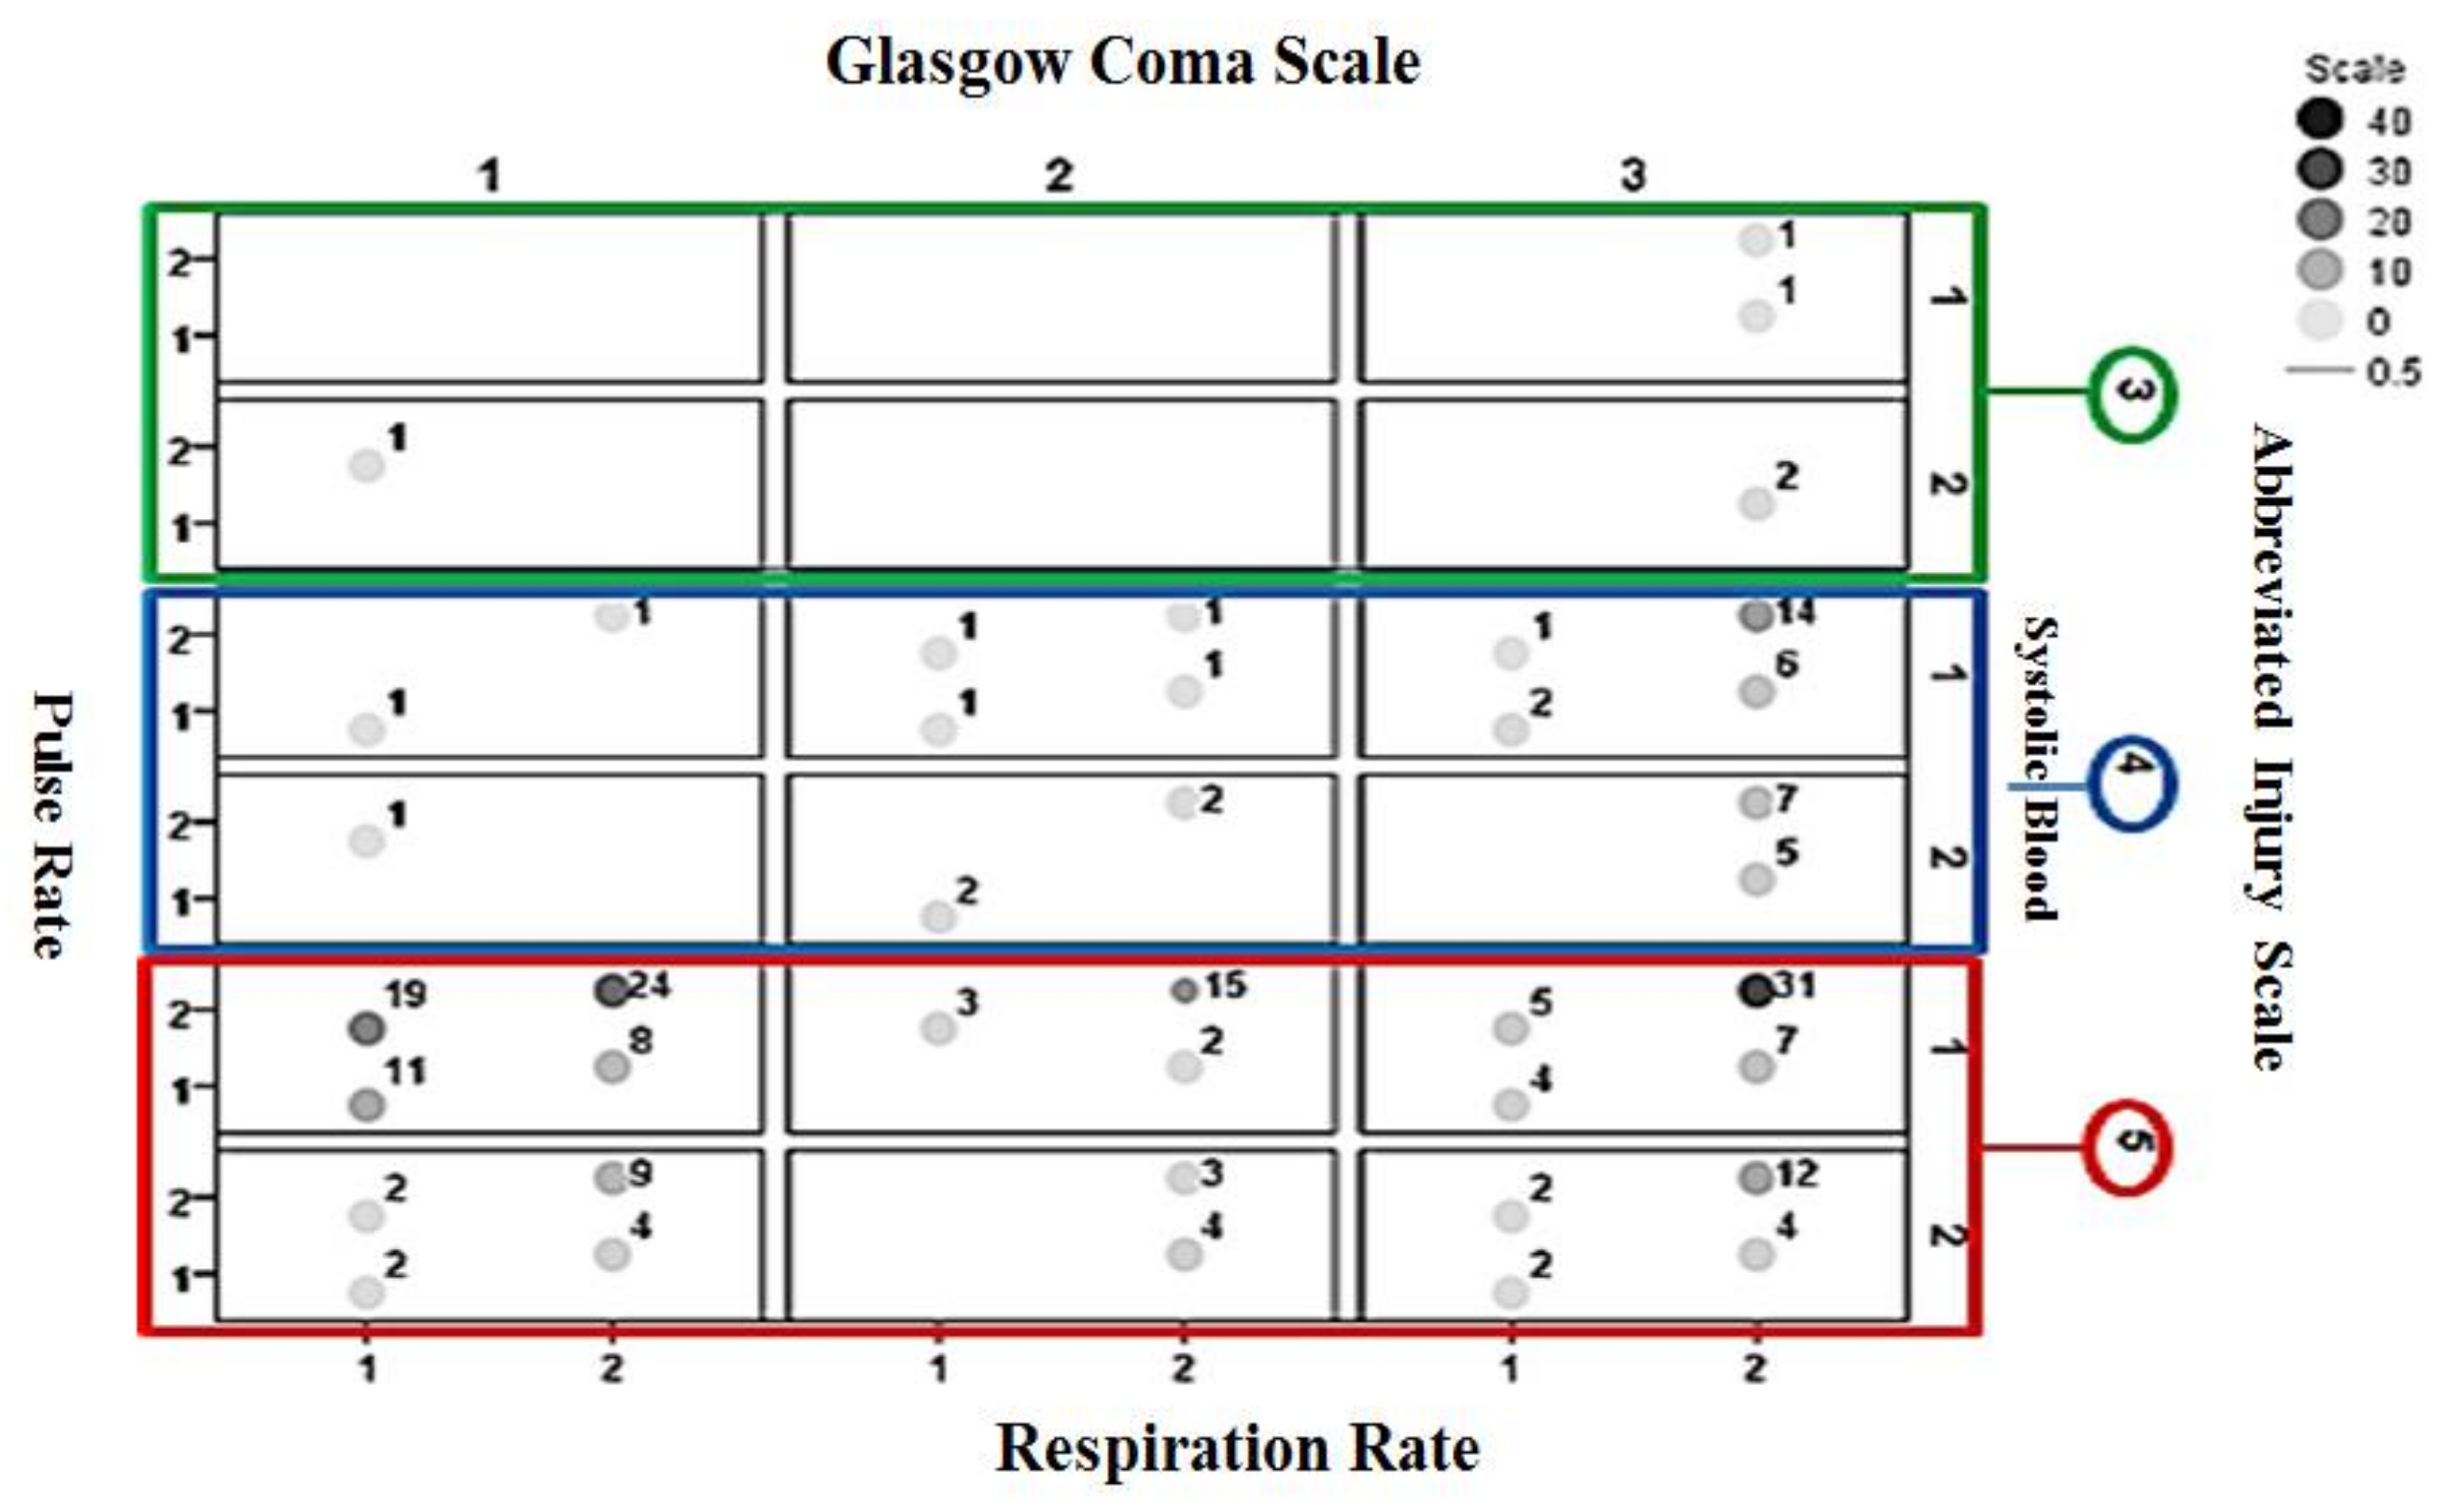
Figure 6 shows the interrelationships between pulse rate, systolic blood pressure, GCS, AIS, and respiration rate information for non-surviving cases included in the validation set. A large cluster of cases appears for AIS = 5, GCS = 1 (categorized as severe injury) and systolic pressure = 1 (categorized abnormal).
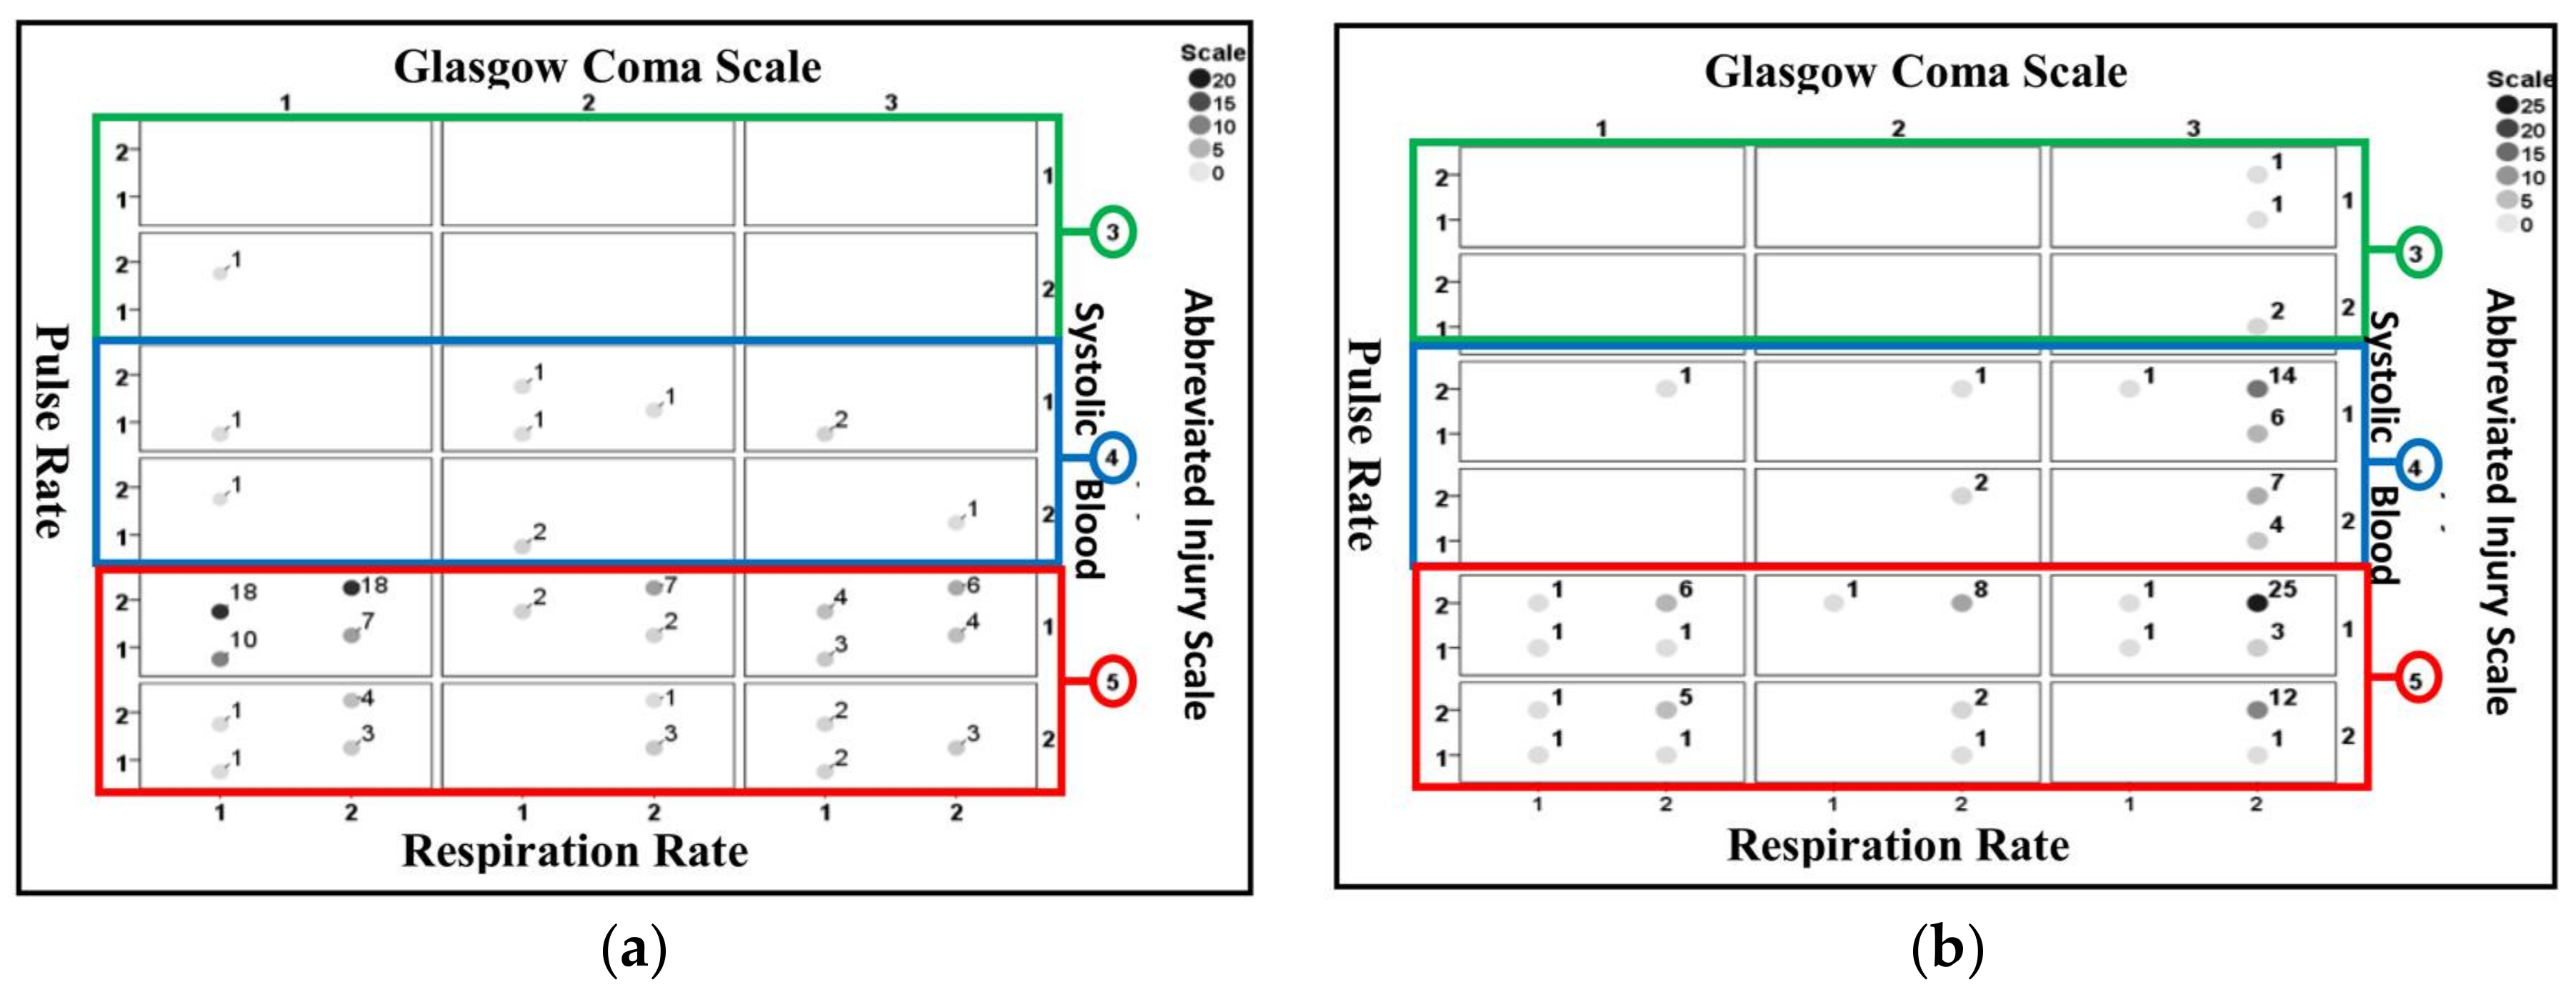
Figure 7 shows the identification results using Ps14 for non-surviving cases included in the validation dataset.
Figure 7a is for those correctly identified and
Figure 7b is for cases misidentified. A larger proportion of correctly identified cases are associated with AIS = 5, GCS = 1 (categorized as severe injury) and a large proportion of misidentified cases are associated with AIS = 5, GCS = 3 (categorized as mild injury).
Figure 8 shows the identification results obtained using PSD for non-surviving cases included in the validation dataset.
Figure 8a is for those correctly identified and
Figure 8b is for those misidentified. Results consistent to those from Ps14 are observed where a larger proportion of correctly identified cases are associated with AIS = 5, GCS = 1 (categorized as severe injury) and a large proportion of misidentified cases are associated with AIS = 5, GCS = 3 (categorized as mild injury).
Table 6 provides an analysis of injury patterns and performance of PSD and Ps14 in identifying non-surviving cases included validation dataset. An X in the last 5 columns of the table indicates the associated parameter is categorized as abnormal, serious injury (for AIS 3 to 5) or as severe injury (for GCS). The table shows that in some injury patterns Ps14 has performed better than PSD and vice versus. For example, the injury pattern resulting with the largest number of non-surviving cases (i.e., 31 cases, expressed as X
22153) is associated with pulse rate = 2 (categorized as normal category), respiration rate = 2 (categorized as normal category), systolic blood pressure = 1 (categorized as abnormal category), AIS = 5 (critical) and GCS = 3 (categorized as mild injury). Only one of the associated cases has been correctly identified by Ps14 however 6 were correctly identified by PSD. There were 24 cases associated with the injury pattern X
22151. For this injury pattern pulse rate = 2 (categorized as normal category), respiration rate = 2 (categorized as normal category), systolic blood pressure = 1 (categorized as abnormal category), AIS = 5 (critical) and GCS = 1 (categorized as severe injury). Ps14 has performed better than PSD by correctly identifying from 21 out of 24 cases while PSD identified 18 cases correctly. For some injury patterns the identification accuracy of the two models (PSD and Ps14) is 0%. An example for this is injury pattern X
22143. This associates with pattern pulse rate = 2 (categorized as normal category), respiration rate = 2 (categorized as normal category), systolic blood pressure = 1 (categorized as abnormal category), AIS = 4, and GCS = 3 (categorized as mild injury). The reason why PSD and Ps14 performance differ or in some injury patterns they fail to identify the outcome correctly requires further investigation.
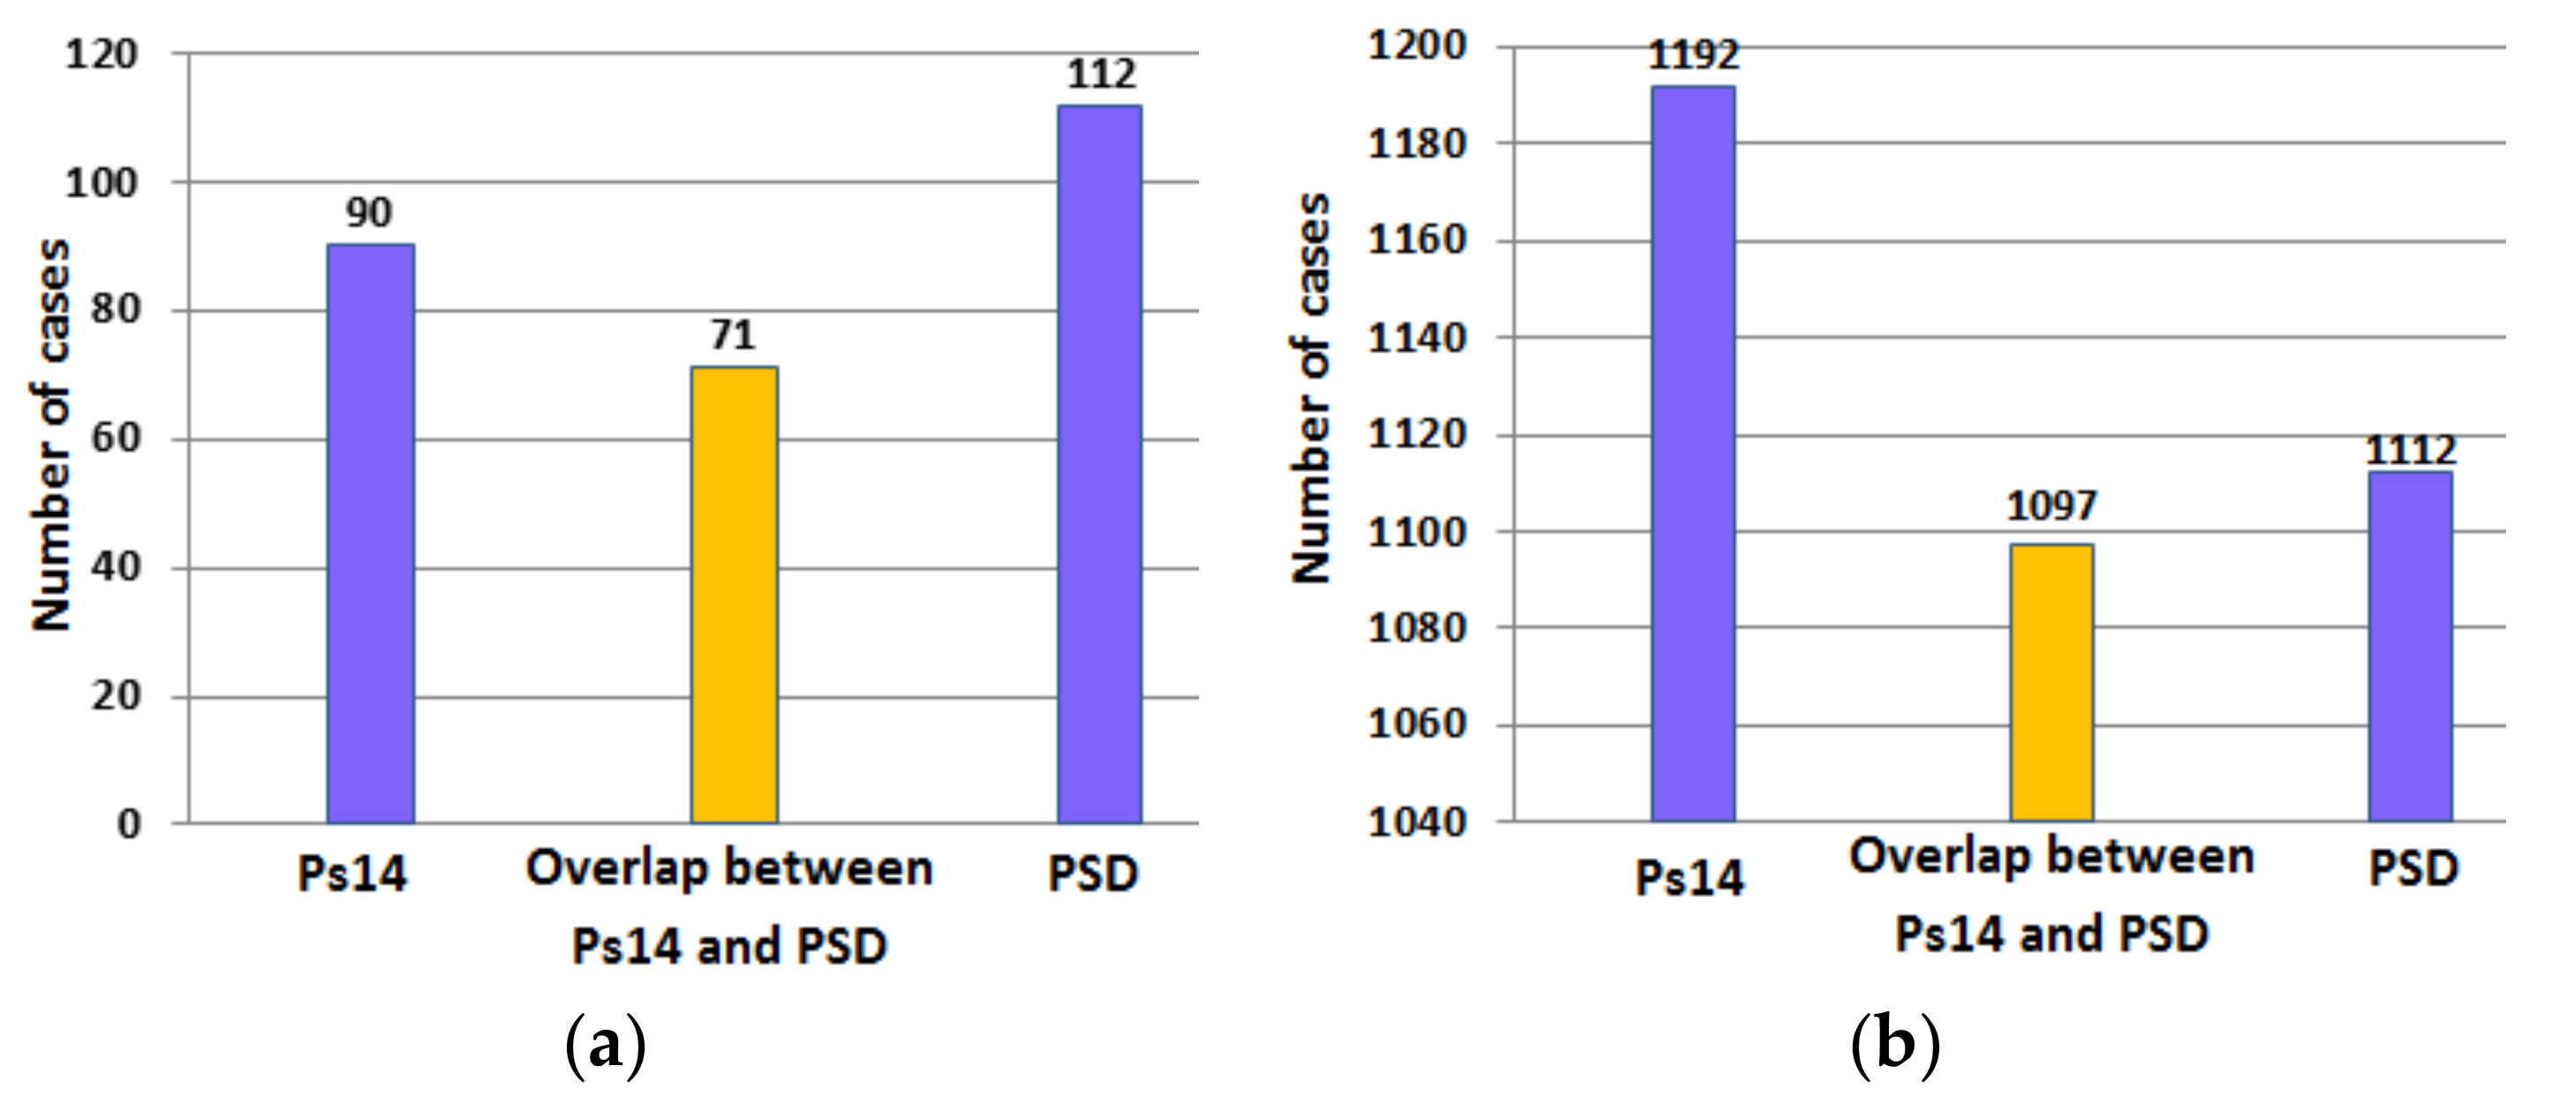
Table 7 compares the results obtained using PSD and Ps14 to determine the probability of survival in cases included in the validation dataset. The inputs to PSD were AIS, GCS, age, systolic blood pressure, respiration rate and pulse rate. Ps14 correctly identified 97.4% of surviving cases and 40.2% of the non-surviving cases. However PSD correctly identified 90.8% of the surviving cases and 50.0% of the non-surviving cases. These results indicate the main difference between the two methods relates to their abilities to identify the non-survivors.
Figure 9a,b provide a further analysis of the results in
Table 7. The figures indicate the number of surviving and non-surviving cases correctly identified by Ps14 and PSD and the overlap in the number of cases correctly identified by both methods.
The results in
Table 7 are taken further by considering the effect of age on the performance of PSD and Ps14. The cases included in the validation that did not survive were divided into two groups (i) those aged between 17 and 65 years and (ii) those aged above 65 years. Age 65 was considered as the boundary as criteria for immediate CT scan of the head in adults with traumatic brain injury include age more than 65 years and some loss of consciousness or amnesia since the injury [
39]. In the Canadian CT Head-Rules traumatic head injury patients aged 65 are classed as high risk that warrant a CT of the head [
40]. The results obtained are shown in
Table 8. PSD has higher identification accuracy for both age groups as compared with Ps14. Comparing the identification results for the two age groups; the performance of both models is influenced by the considered age ranges. Ps14 has been more accurate for cases aged above 65 years than those between 16–65 years. PSD on the other hand has been much more accurate for cases aged 17–65 years as compared with those aged over 65 years.
Table 9 provides an analysis of the relationship between injury parameters (categorized according to
Table 5) and the percentage of cases that survived (number 1224 cases) and those that had not survived (number 224 cases) in the validation set. Considering the cases that had not survive, 77.2% had AIS = 5, 37.1% were categorized as GCS = severe, 30.8% categorized as pulse rate as abnormal, 26.8% were categorized as respiration rate as abnormal and 71.4% were categorized as systolic blood pressure as abnormal. These results indicate that AIS, GCS and systolic blood pressure to be particularly sensitive indicators for identifying cases that did not survive.
Table 10 provides the mean and standard deviation of AIS and categorized GCS, pulse rate (PR), respiratory rate (RR) and systolic blood pressure (SBP) in cases included in the validation data set that had not survive. The results from this table confirm the conclusion derived from
Table 9 with regard to the particular significance of GCS, AIS and SBP. The mean (categorized) systolic blood pressure is close to the abnormal value while the mean GCS is close to moderate severity and AIS represent high injury severity.
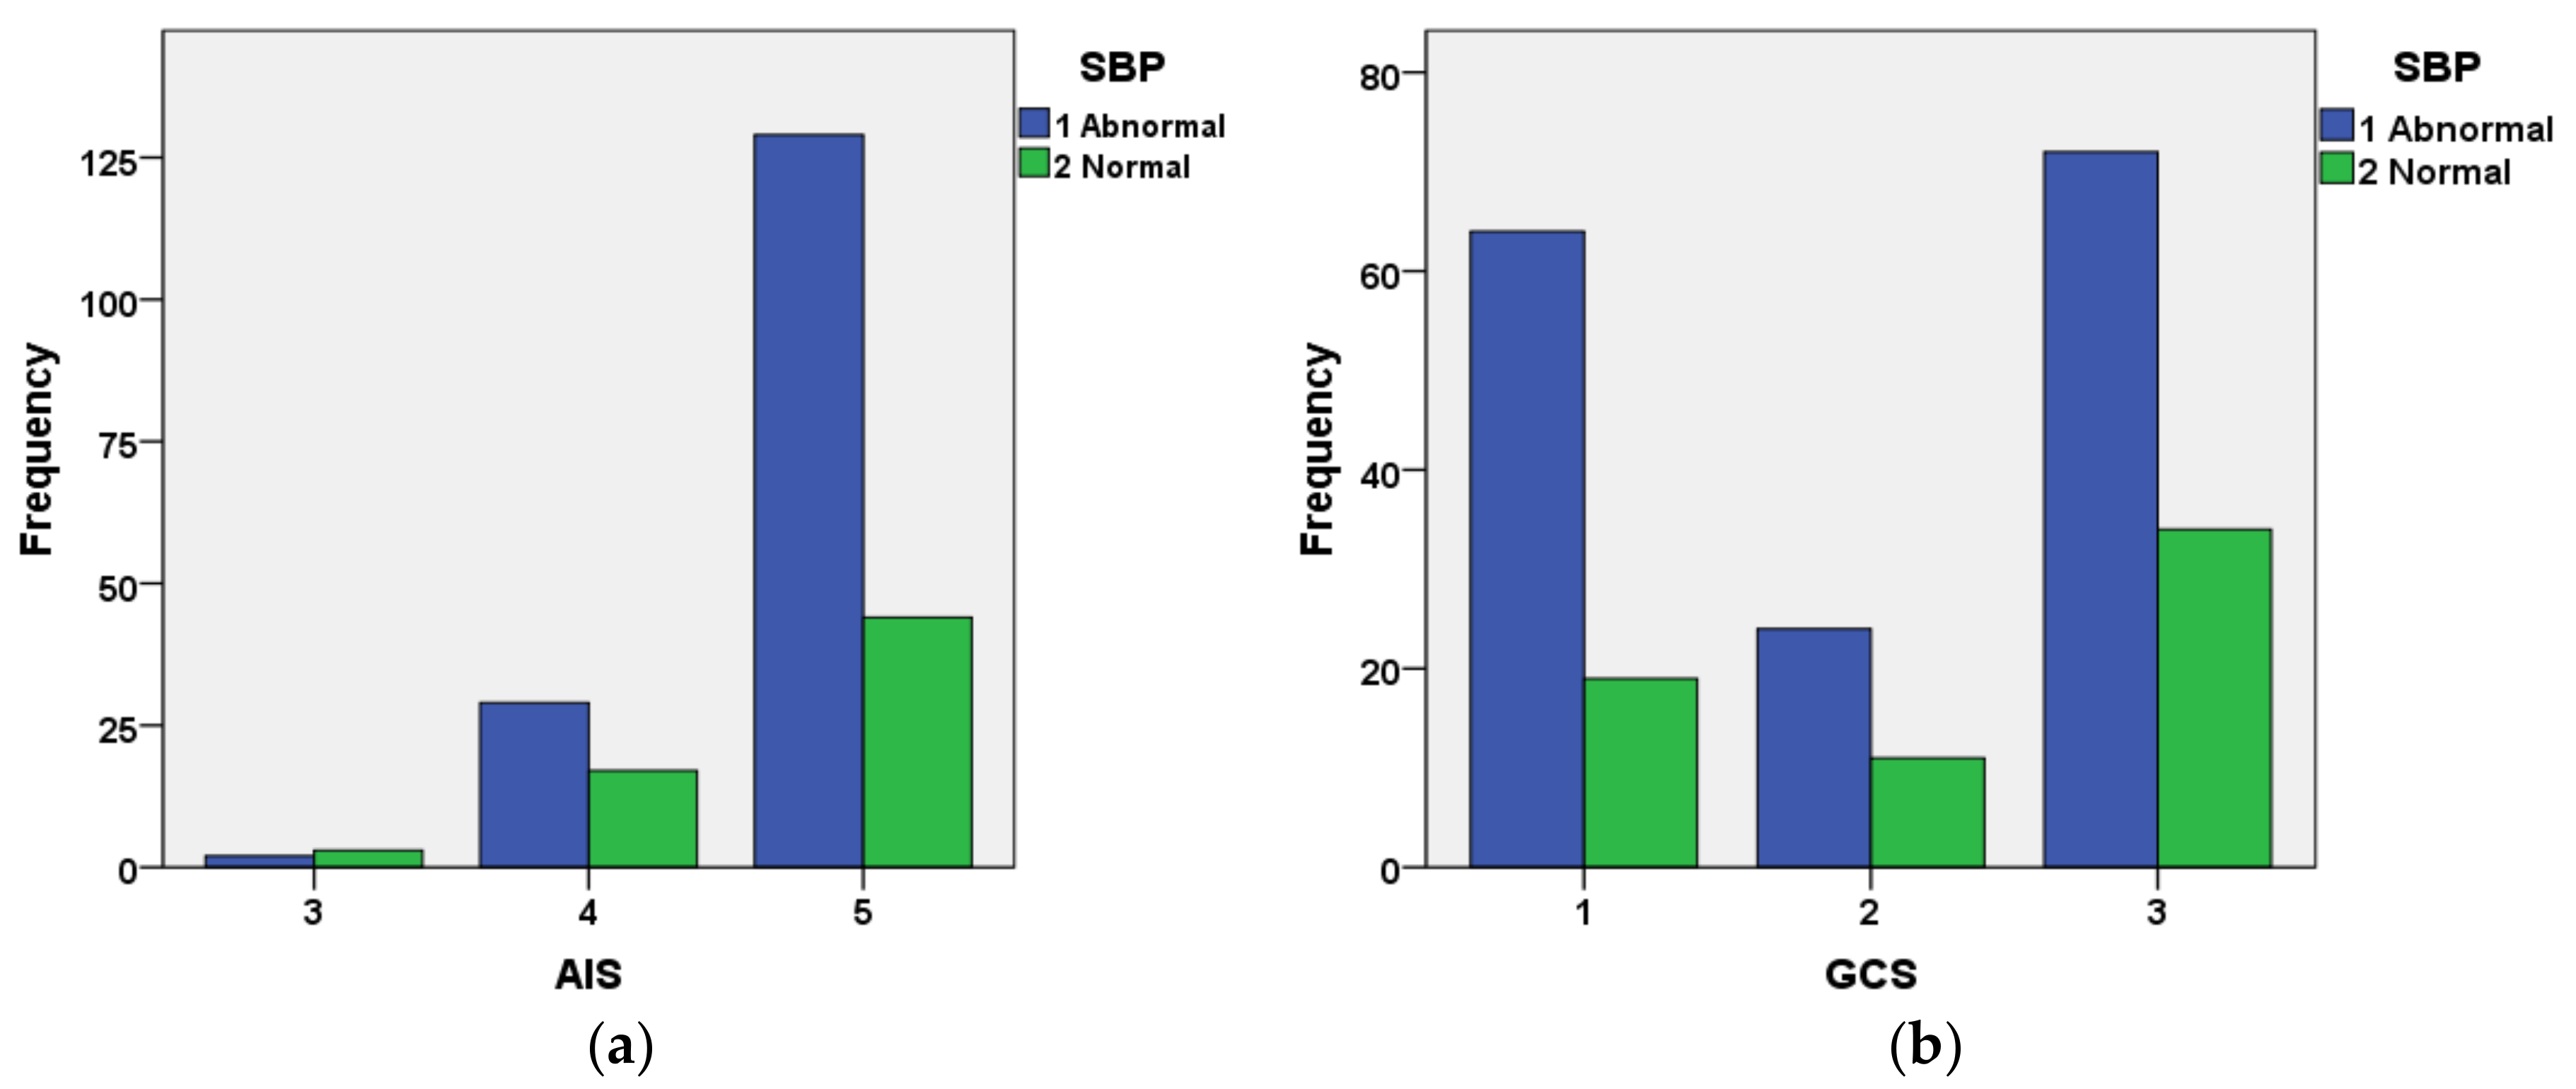
Figure 10 shows the interrelationship between AIS and categorized SBP (
Figure 10a) and GCS and categorized SBP for cases included in the validation dataset that had not survived. The figure indicates that the great majority of cases with AIS = 5 had abnormal SBP. The relationship between GCS and systolic blood pressure is not as well defined as that for AIS and systolic blood pressure.
In order to explore the effects of respiration rate, systolic blood pressure and pulse rate on the accuracy of PSD in identifying the cases included in the validation set, each parameter was separately excluded and PSD identification accuracy was determined. The results are summarized in
Table 11. The use of GCS and AIS on their own sharply reduced the effectiveness of PSD, resulting in 55.1% and 31.3% correct identification of the surviving and not surviving cases. Inclusion of the age with AIS and GCS significantly improved the PSD performance resulting in 82.4% and 65.2% correct identification for the surviving and not surviving cases. The inclusion of systolic blood pressure with age, AIS and GCS resulted in 83.3% and 64.3% correct identification of surviving and not-surviving cases.
The study evaluated the performance of PSD in determining the probability of survival in adult subjects with TBI. It highlighted some complexities in determining the probability of survival. An issue is related to the interrelationships of injury parameters and other factors such as age, sex, pre-existing medical conditions that can influence the probability of survival [
41]. AIS, GCS, age, respiration rate, pulse rate and systolic blood pressure play an important role in determining the probability of survival in TBI cases. We are currently working on improving the performance of models for injury outcome analysis. In this study PSD was compared with Ps14. The newer version of Ps14, i.e., Ps17, is similar to Ps14 but its coefficients were changed slightly. In this study we did not have access to Ps17 values from the TARN database but in future we will compare its performance with PSD when Ps17 values become available to us.
7. Conclusions
A comparison of predictive statistical diagnosis (PSD) and Ps14 for determining the probability of survival in adult subjects with traumatic brain injury (TBI) was carried out. PSD uses Bayesian statistics while Ps14 uses regression. Overall PSD gave an improved performance in identifying those that had not survived. However in some injury patterns, Ps14 was more accurate. The interrelationships between the parameters used in the models (Ps14 and PSD) and the manners they affected their identification accuracy were studied. The performance of the two models was different for the younger group (aged 17–65 years) than the older group (aged above 65). The input parameters to PSD, i.e., AIS, GCS, pulse rate, respiration rate, systolic blood pressure and age were found to be important indicators of TBI outcome (surviving or not surviving). The exclusion of any the parameters in the PSD model altered its performance. For example with all 6 parameters included, PSD identified 90.8% of the surviving and 50.0% of non-survivors but by excluding pulse rate and respiration rate, PSD identified 83.3% of the surviving cases and 64.3% of non-survivors.
The study showed that PSD can be valuable in analyzing TBI outcomes; however, the number of non-survivors included in the study may have not been sufficiently high to indicate the full potential of the PSD and thus a further study with a larger number of cases will be beneficial.


