Article

Utilization of Blended Waste Materials in Bricks

by
Muhammad Ekhlasur Rahman
1,*,
Phang Ji Ong
1,
Omid Nabinejad
1,
Sumaiya Islam
1,
Neamul Ahsan Noman Khandoker
1,
Vikram Pakrashi
2 and
Kazi Md. Shorowordi
3
1
Faculty of Engineering and Science, Curtin University, Malaysia, Miri 98009, Malaysia
2
Dynamical Systems and Risk Laboratory, School of Mechanical and Materials Engineering, University College Dublin, Belfield, 4 Dublin, Ireland
3
Faculty of Engineering, Bangladesh University of Engineering & Technology, Dhaka 1000, Bangladesh
*
Author to whom correspondence should be addressed.
Technologies 2018, 6(1), 20; https://doi.org/10.3390/technologies6010020
Submission received: 22 November 2017 / Revised: 9 January 2018 / Accepted: 25 January 2018 / Published: 29 January 2018
(This article belongs to the Section Construction Technologies)

Abstract

:
Cement is considered a key raw material for brick production. However, excessive use of cement leads to a negative environment impact. Cement replaced with locally available waste materials has a significant potential to address this environmental impact, especially in the construction industry by contributing to cleaner production. The objective of this research is to investigate the performance of brick where cement is replaced by fly ash and palm oil fuel ash, waste materials typically available in Malaysia, where the construction industry is on the rise. To determine the performance of these bricks, a compressive strength test, a water absorption test, and a thermogravimetric analysis were carried out at different percentage combinations of fly ash and palm oil fuel ash. The results from the tests reveal that both fly ash and palm oil fuel ash incorporated bricks satisfy Class 1 and Class 2 load-bearing brick requirements according to the Malaysian Standard MS76:1972 along with water absorption requirements as per ASTM C55-11. The thermogravimetric analysis study confirms that the Ca(OH)2 gradually decreases due to the increase of pozzolanic material contents (fly ash and palm oil fuel ash). Moreover, these newly developed bricks cost less than the conventional bricks.

1. Introduction

Bricks tend to be one of the most important elements in the construction industry. There are various forms of bricks available [1], and among them fired bricks and cement bricks are usually popular for their perceived reliability. Malaysia uses both fired bricks and cement bricks, and these bricks are popular throughout the Association of Southeast Asian Nations (ASEAN) region. Significant quantities of cement are required to produce large quantities of cement bricks, but this approach also leads to environmental impacts from increased carbon emission to the atmosphere. The incorporation of more sustainable materials in the production of bricks can partially address this large issue, and the use of waste materials for this purpose can be an attractive option due to their natural availability and the aspect of recycling.
Malaysia produces and exports a large quantity of palm oil [2], and it was found that approximately 4 kg of waste materials are produced to obtain 1 kg of palm oil [3]. Consequently, waste materials, including empty fruit branches, oil palm shell, and Palm Oil Fuel Ash (POFA), are generated in significant amounts and it is expected that 100 million tonnes of dry waste materials will be generated by 2020 [4]. Empty fruit branches and oil palm shell are usually burnt to produce POFA for disposal. However, the reuse of this POFA in brick industries can lead to the construction industry partially addressing its problems around environmental impact [5,6].
The potential use of POFA, fly ash, and similar waste material as a partial substitute for cement in concrete and bricks is related to their high pozzolanic content and the demand for environmental sustainability [6,7,8,9,10,11]. Previous research data has explained that there are several applications for using different types of waste materials, such as POFA, Fly ash, lime-stone powder, rice husk, sugarcane bagasse, and date palm fibre [5,8,9,12,13], and some of them have been utilized specifically for brick production. Studies on brick production typically led to the production of light-weight brick with high compressive strength [14,15,16,17,18,19,20,21,22].
For commercial production, it is important to maintain a proper proportion of waste materials to replace cement. However, there is a lack of adequate standard guidelines for the commercial production and application of such sustainable bricks. Further research is required to be conducted to develop proper guidelines for incorporating natural waste materials in brick [6,23].
Based on the existing literature discussed in this section, it is observed that a specific knowledge gap lies in in measuring the performance of bricks utilizing blended POFA and fly ash. This paper thus explores the technical background for the development and implementation of such bricks leading to cleaner production in the construction industry sector, leading from some relevant previous works [6,24,25]. In this research, blended fly ash and POFA are utilized as pozzolanic materials to improve the overall quality of the bricks and also reduce the environmental impact of these waste materials. The research data is also helpful for development of appropriate guidelines for brick production.

2. Methodology

2.1. Materials

Locally available water, cement, POFA, fly ash, and river sand were used for the production of the bricks. The POFA and fly ash are free of cost and are treated as waste materials.

2.1.1. Ordinary Portland Cement (OPC)

Ordinary Portland Cement (OPC) of grade 42.5 produced in Sarawak, Malaysia, was used in this project. The OPC satisfied the quality requirements of ASTM C150/C150M-12 [26]. Particles retained on 45 μm for OPC is 0.33% with a specific surface area of 17,106 g/cm3.

2.1.2. Palm Oil Fuel Ash (POFA)

POFA was obtained from the palm oil industry located at Lambir, Miri, Malaysia, and was subsequently subjected to laboratory ball milling to achieve acceptable fineness. In order to reduce the particle size to 300 µm, the process of grinding was conducted for 6 h. Sieve analysis was then carried out and it was used to reduce the particle size to 75 µm or smaller. All sieved POFA were then kept in clean, dry, and airtight containers and stored in a humidity-controlled room.

2.1.3. Fly Ash (FA)

Fly ash was obtained from a coal-fired power plant at Kuching, Sarawak, Malaysia. Fly ash used in this research conforms to the Class F requirements set by the ASTM C618-12a [27]. Chemical Specifications [28]. Particles retained on 45 μm for FA is 11% with a specific surface area of 21,948 g/cm3.

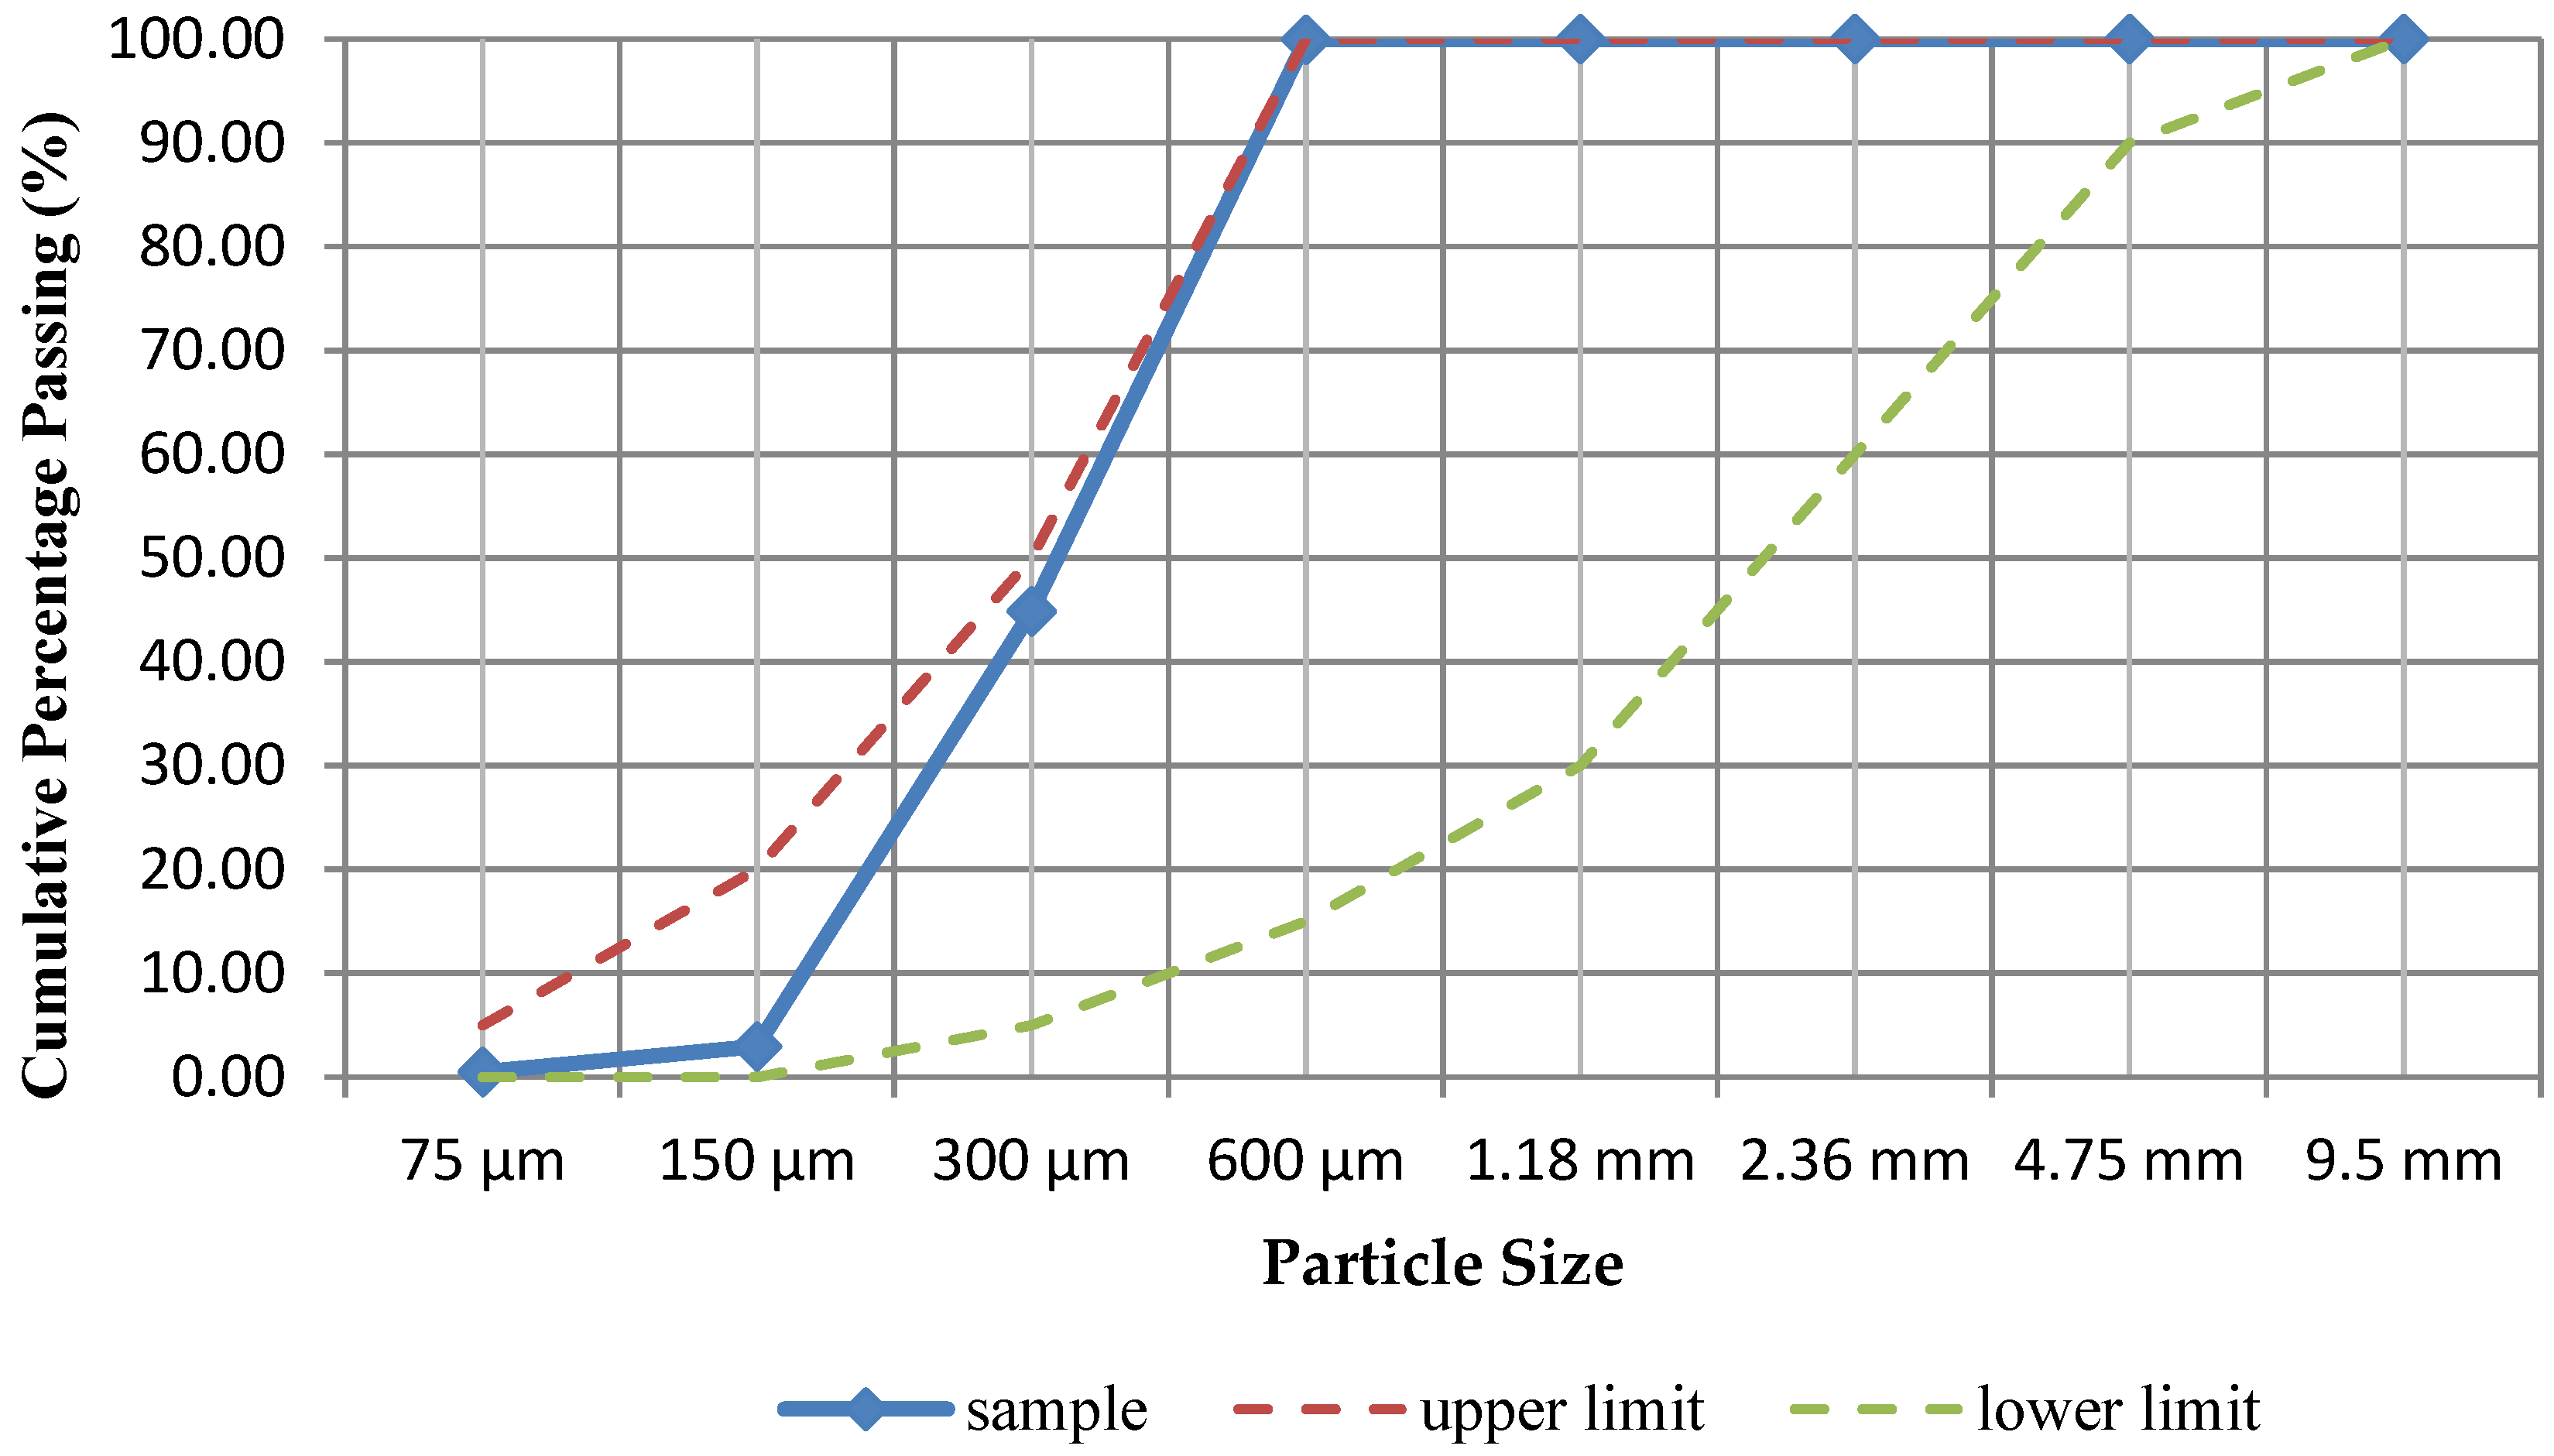
2.1.4. Local River Sand

The sand used in the production of the brick was collected from a local river. In order to satisfy the grading requirement of AS 2758.1 [29], a sieve analysis was carried out. The fineness modulus of the sand was 1.52. Figure 1 shows that the grading curve of the sample falls within the upper limit and the lower limit recommended by AS 2758.1 [29]. Consequently, the sand is deemed suitable for brick production.

2.2. Brick Mix

Five batches of bricks with dimensions 200 mm long, 100 mm wide, and 70 mm thick were prepared for this research, and each batch of brick underwent a curing process. Curing periods were planned for 28 days and 90 days in order to achieve potential strength and durability. Table 1 shows the five different ratios of brick mixtures used in this study. For this research, a compressive strength test, a breaking load test, a water absorption test, and a thermogravimetric analysis (TGA) were carried out. These tests were conducted in accordance with ASTM C67-11 [30], the standard test method for the sampling and testing of brick and structural clay tile, except for thermogravimetric analysis (TGA), which is based on ASTM E1131-08 [31].

2.3. Preparation of Bricks

The traditional method of brick production was employed with a water to cement ratio of 0.5. First, the Portland cement and sand were measured and blended using a Hobart A200 mixer for 3 min to obtain a homogeneous mixture. The sieved POFA and fly ash were then measured and added into the mixture. At the same time, water was constantly added into the mixture until the substances in the mixture were equally distributed. The entire mixing process took approximately 6 min.
The mortar mix from the mixture bowl was then placed into a 200 × 100 × 80 mm timber mould in three equal layers. Each layer was then manually compacted using a timber plate. The moulds were then slightly overfilled with the mixtures, leaving not more than a 5-mm-thick layer. Again, the mixtures in the mould were placed in the hydraulic press machine and pressed with a force of up to 7 MPa for further compaction. The specimens were finally dismantled from the mould and cured. Once the bricks were made, they were wrapped with plastic and kept in the lab for either 28 days or 90 days [6].

2.4. Testing Methods

The laboratory tests were divided into two categories: soaked and unsoaked conditions of bricks. The distinction between the two categories is that the soaked bricks underwent the water absorption test.
The experimental program began with the water absorption test after the curing periods of 28 days and 90 days were completed. Following the water absorption test, the bricks were tested for compressive strength and breaking load [6]. At the end of the compression test, the unsoaked bricks were crushed into a fine powder and then heated by the TGA instrument.

2.4.1. Compression Test

To obtain the compressive strength of the bricks for 28 days and 90 days, the compression tests were carried out using a Universal testing machine (UTM). First, the brick specimens were placed on the top of the steel plate, then the vertical loads were applied to the upper surface of the specimen. During the test, the loading rate was maintained at 1.25 mm/min and was applied until failure occurred in the bricks. The failure load of the specimen was recorded and the compressive strength of each specimen was calculated in terms of MPa.

2.4.2. Water Absorption Test

Before the compression test, a total of 39 brick specimens were subjected to a water absorption test. First, the brick specimen was weighed, then it was immersed in water at room temperature for 24 h, and finally it was removed from the water tank and patted dry with a lint-free cloth. After their removal from the water, these specimens were weighed again.

2.4.3. Thermogravimetric Analysis Test

A thermogravimetric analysis was performed to determine the mass change in the powder samples. These powder samples are taken from brick specimens after undergoing curing for 28 days and 90 days. A total of 10 brick specimens were tested with the thermogravimetric analysis. The tests were carried out using the Mettler Toledo TGA/DSCI Star System. After the compression test, the brick was placed in the mortar (bowl). A downward pressure was then applied to the crushed brick with a pestle (pounder) until it became a fine powder. The powder samples were tested from 35° to 1100 °C at heating rates of 10 °C/min under a nitrogen atmosphere. The signal produced from the TGA instrument was used to calculate the weight loss of the powder sample during heating and to estimate the content of calcium hydroxide Ca(OH)2. In essence, the Ca(OH)2 content was calculated from the weight loss at 400–500 °C and 600–750 °C [32].

3. Results and Discussion
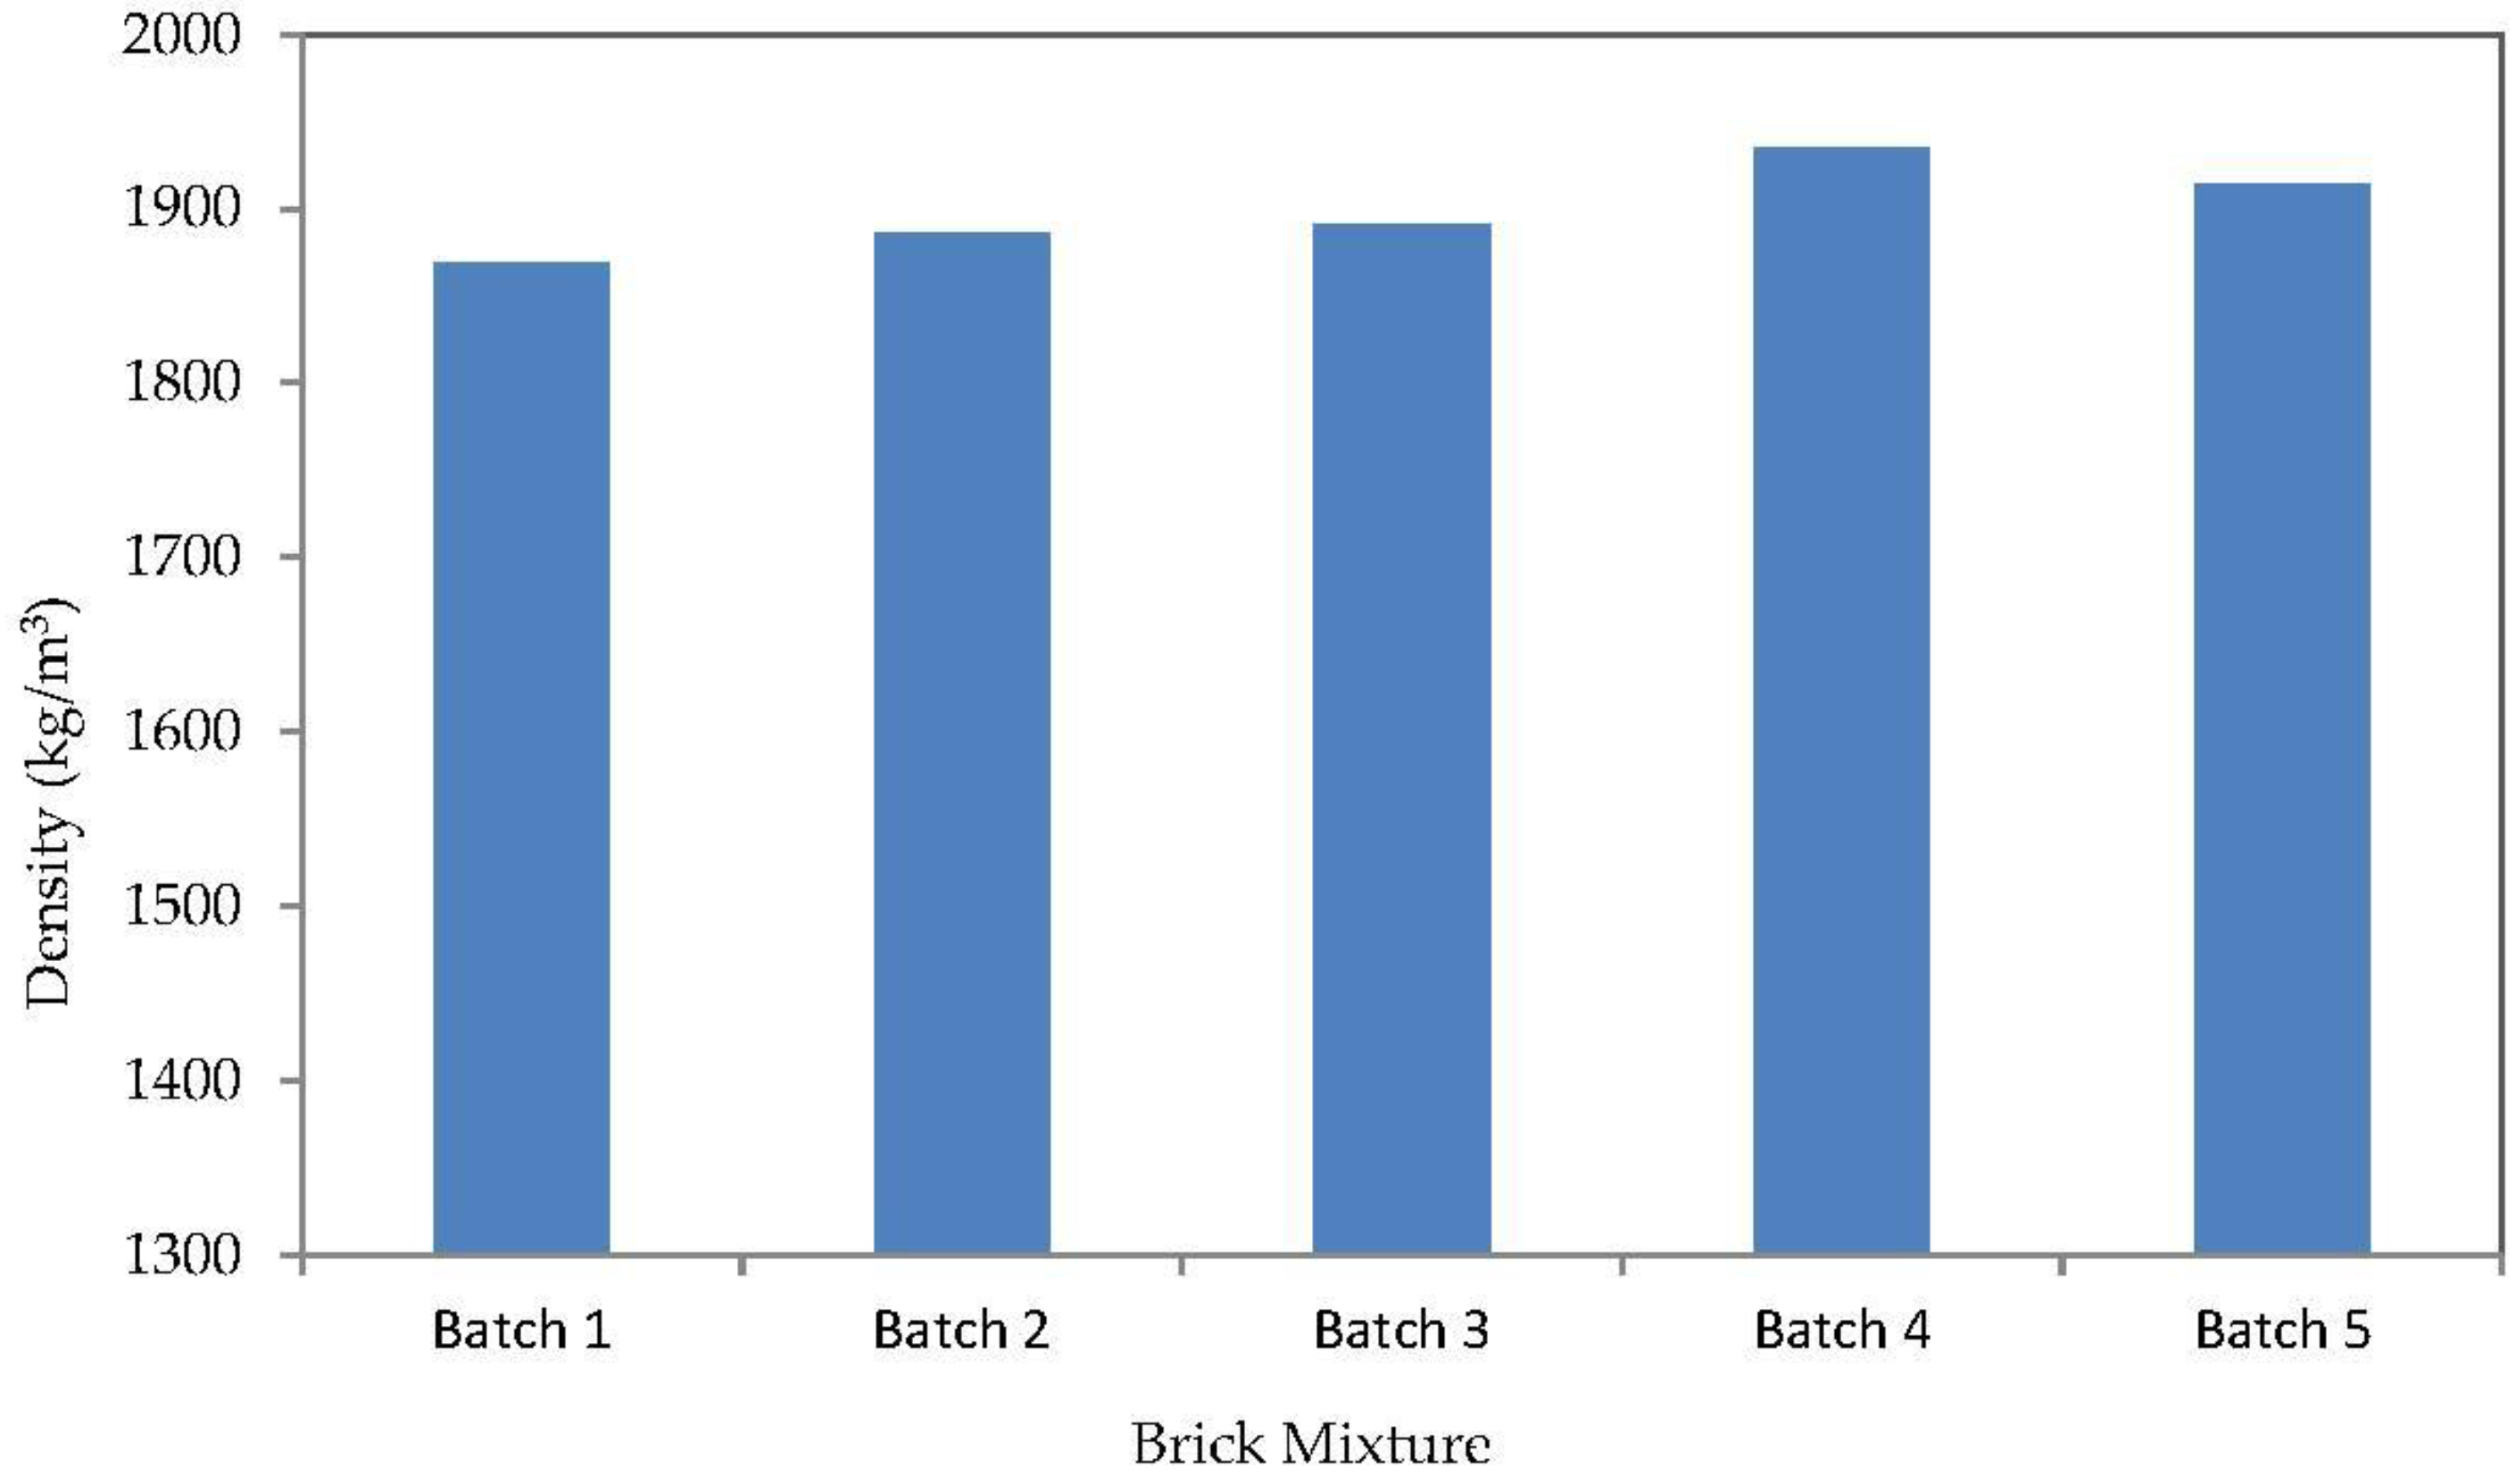
3.1. Density

The average densities of the bricks from each batch are shown in Figure 2. It can be seen that the density of the brick increases moderately with the replacement of fly ash because of its fineness. However, the density of Batch 5 is slightly less than that of Batch 4 and this may be due to human error. Fine spherical fly ashes were able to fill the void between the particles, which results in denser packing [33]. The increase in dry density indicated that the substitution of fly ash for Portland cement in the brick made it possible to produce a denser brick. All bricks were in the ranges of 1680–2000 kg/m3, and according to ASTM C55-11 [34] all were considered as medium-weight bricks. Overall, the density of blended POFA and fly ash based bricks were significantly higher than that of the control bricks.

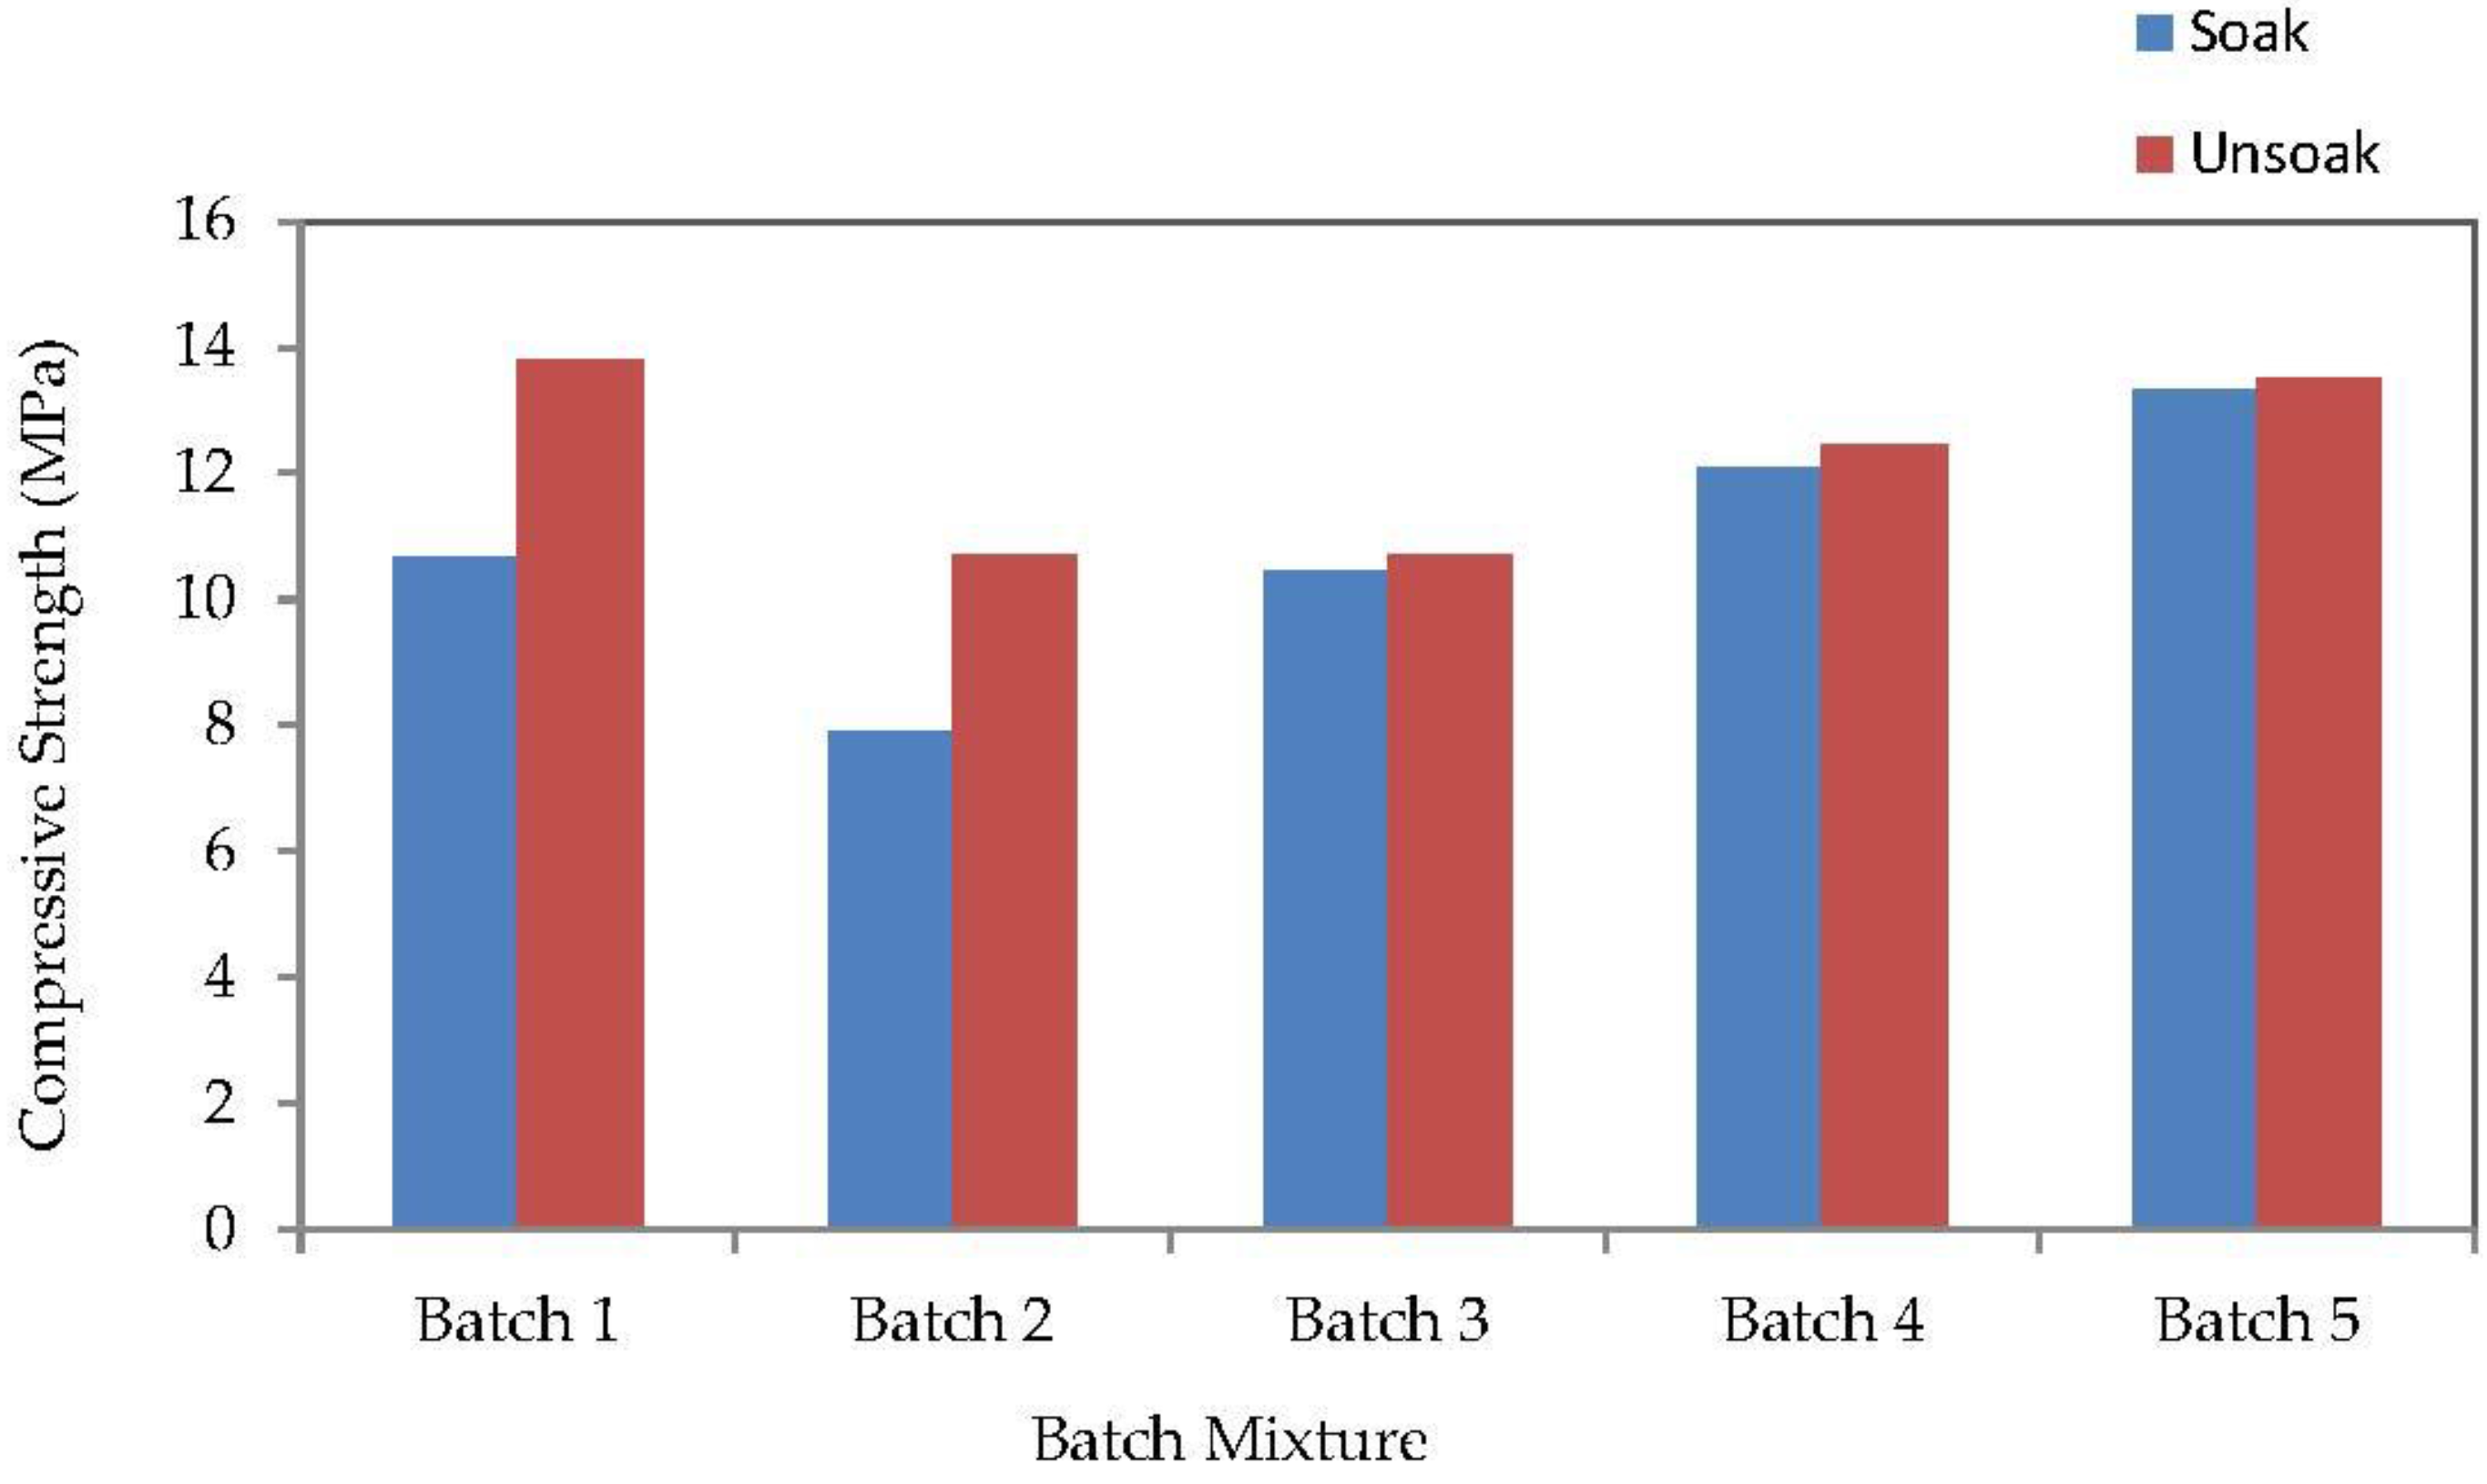
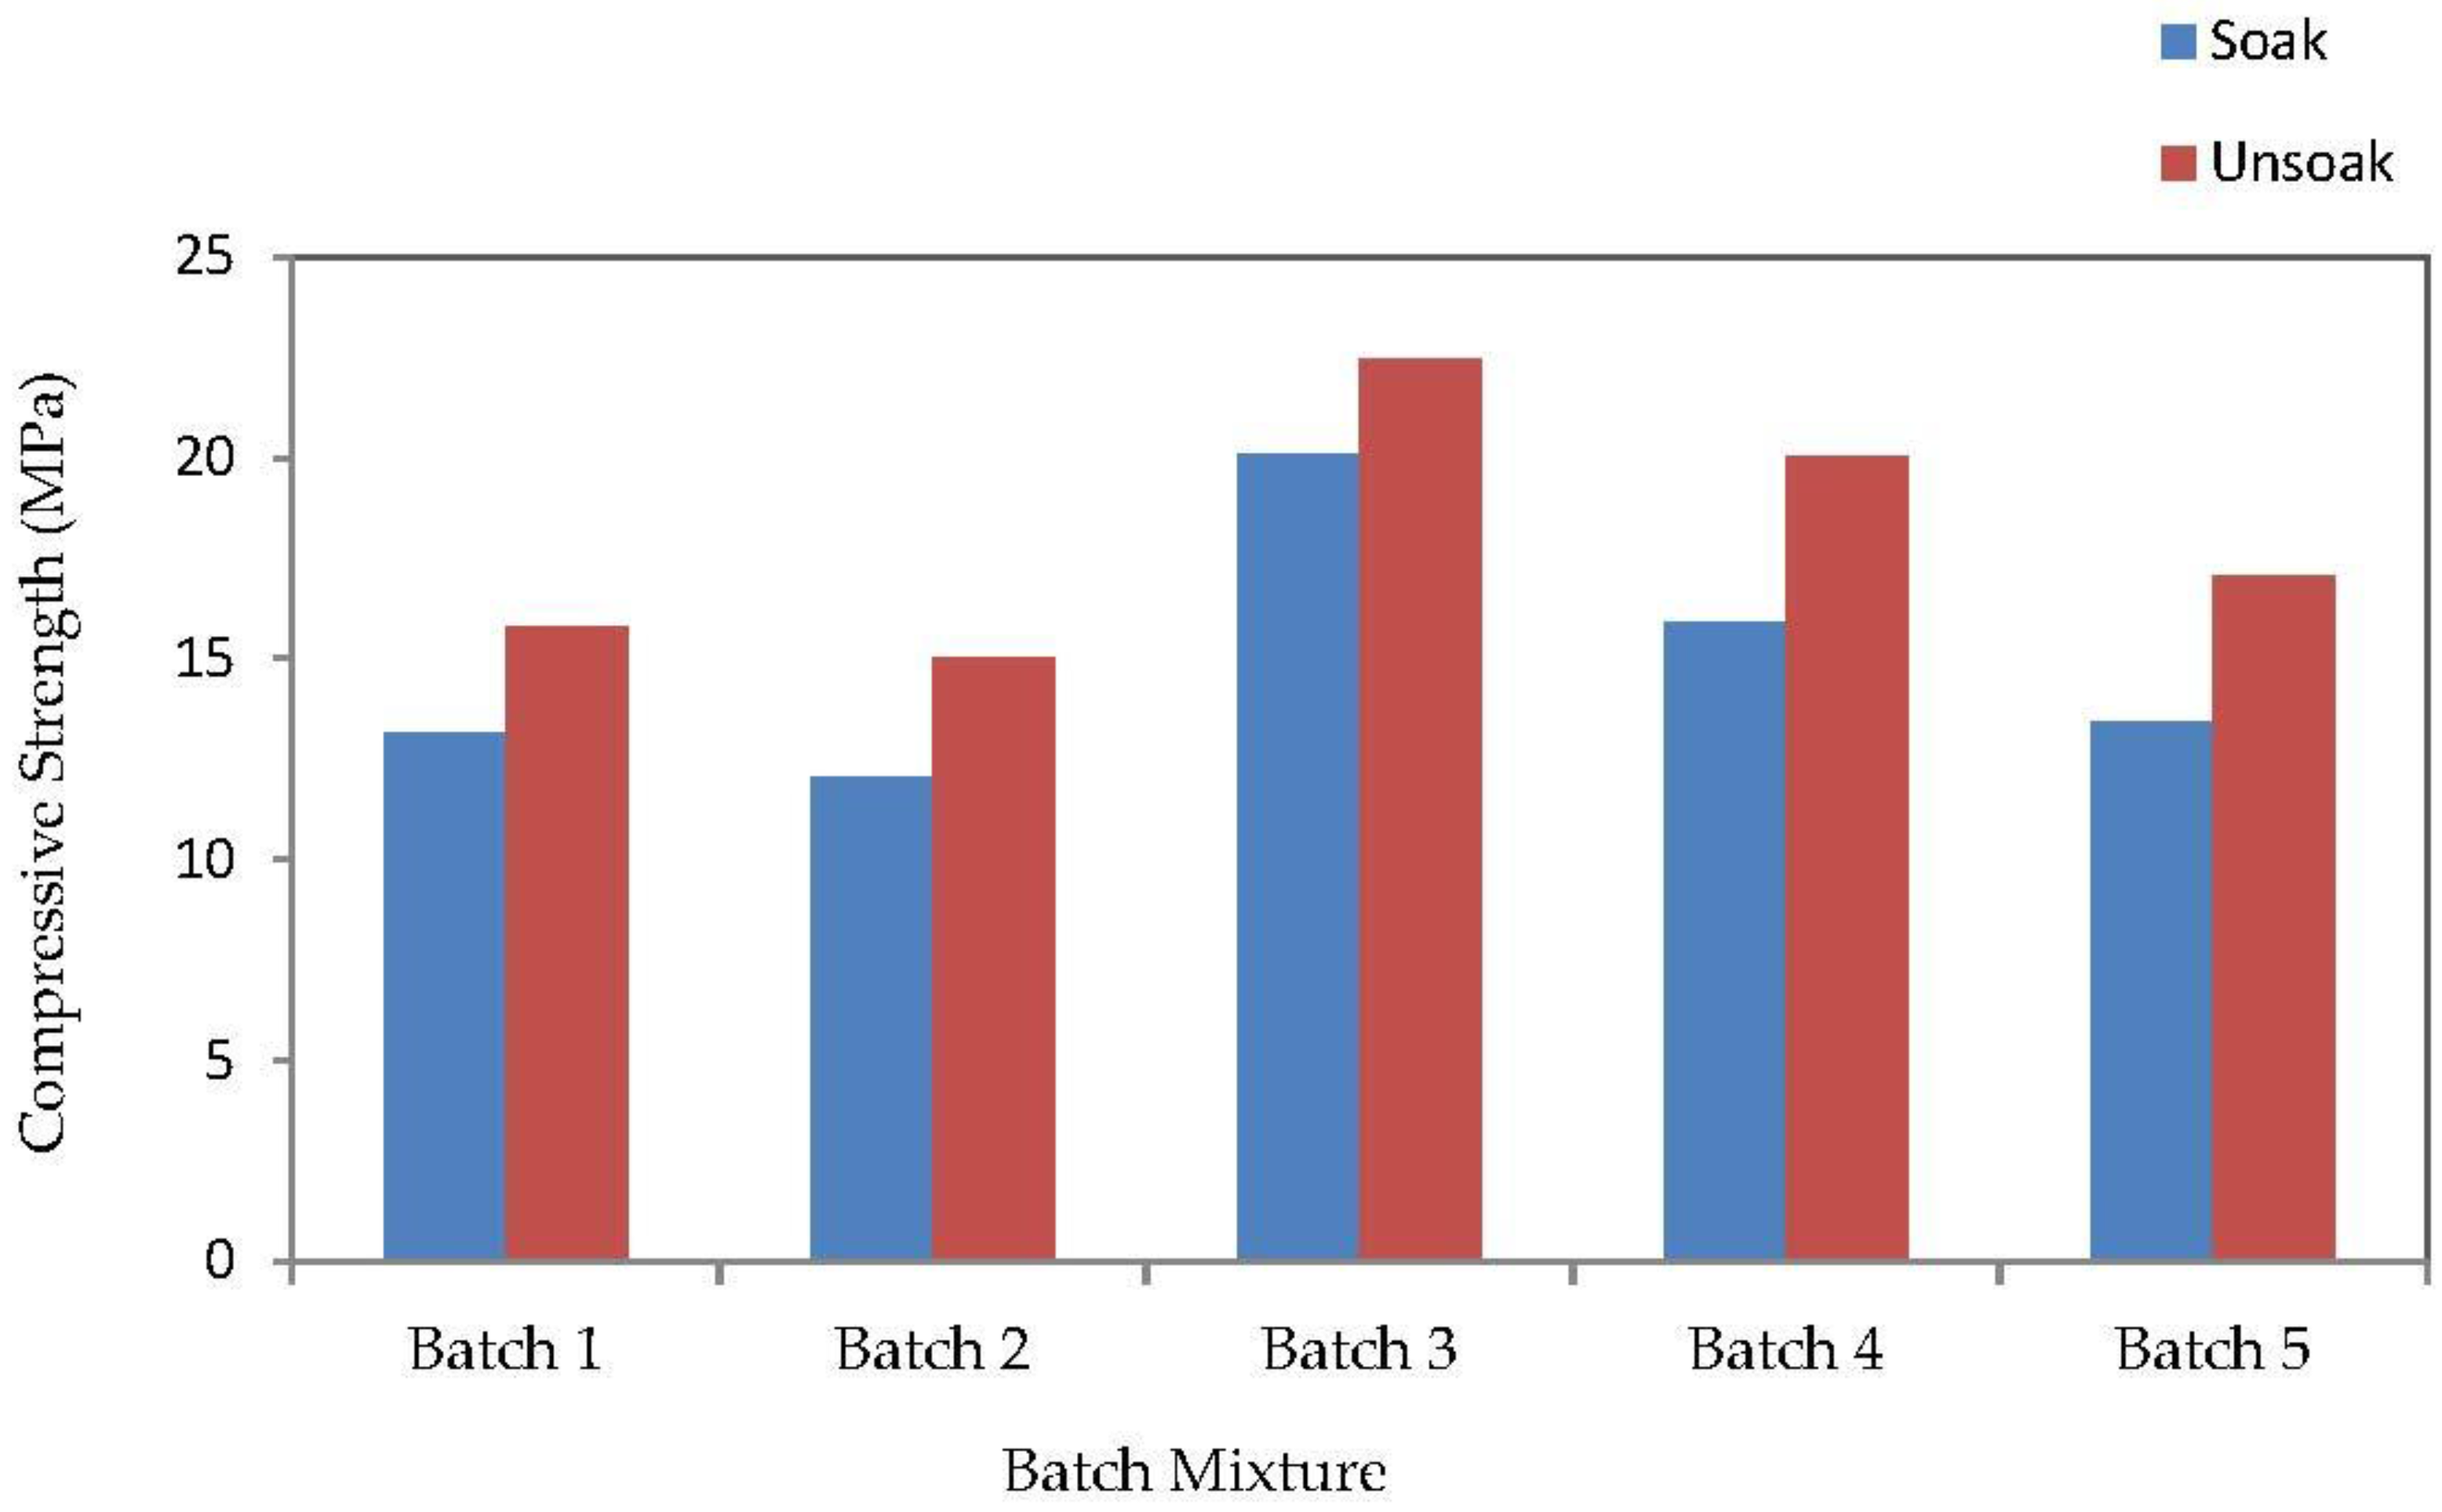
3.2. Compressive Strength

The compressive strength of the bricks for 28 days and 90 days of curing are presented in Figure 3 and Figure 4, respectively. It can be observed that the compressive strength of the bricks is improved by the blended POFA and fly ash replacement and by immersion.

3.2.1. Effect of Blended POFA and Fly Ash Replacement

Figure 3 shows the average results obtained from the compressive strength tests after curing for 28 days. The amount of blended ash is limited to 0% POFA and 0% fly ash, 10% POFA and 0% fly ash, 10% POFA and 10% fly ash, 10% POFA and 20% fly ash, and 10% POFA and 30% fly ash by mass of the total cementitious material in the brick, respectively. It is observed that the compressive strength decreased with the adding of blended ash. This is caused by the slow rate of the pozzolanic reaction of ash. The compressive strength results of bricks after 90 days of curing are shown in Figure 4. This figure shows that Batch 3, which contained 10% of POFA and 10% of fly ash, achieved the highest strength of all of the mixtures (22.5 MPa). However, the addition of further fly ash content resulted in the reduction of the strength of the bricks. The possible reason for the decreasing strength is due to the low content of Portland cement in the cement–mortar mixture. The decrease of the Portland cement content would cause a low calcium hydroxide content being generated from the cement hydration, and this would also reduce the binding component calcium-silicate-hydrate (C-S-H gel) [35]. Previous research shows that the shape of ground POFA particles is irregular and angular. Therefore, it requires a higher water demand in order to maintain a given workability of a cement–mortar mixture [36]. In contrast, fly ash consists of particles that are spherical in shape and thus requires less water to lubricate to maintain the given workability of the cement–mortar mixture. Consequently, these results showed that the combination of POFA and fly ash with the same cement replacement level in the cement–mortar mixture achieved a lower water-to-binder ratio compared to only a POFA replacement.

3.2.2. Effect of Immersion

The compressive strength of the bricks at 28 days and 90 days is categorized into soaked and unsoaked groups, as shown in Figure 3 and Figure 4. It is observed that the wet specimens produced a lower compressive strength compared to the air dry specimens because of the higher water absorption in the bricks during the submersion in water. As a result, this softens the fine aggregates slowly, leading to lower strength [6].

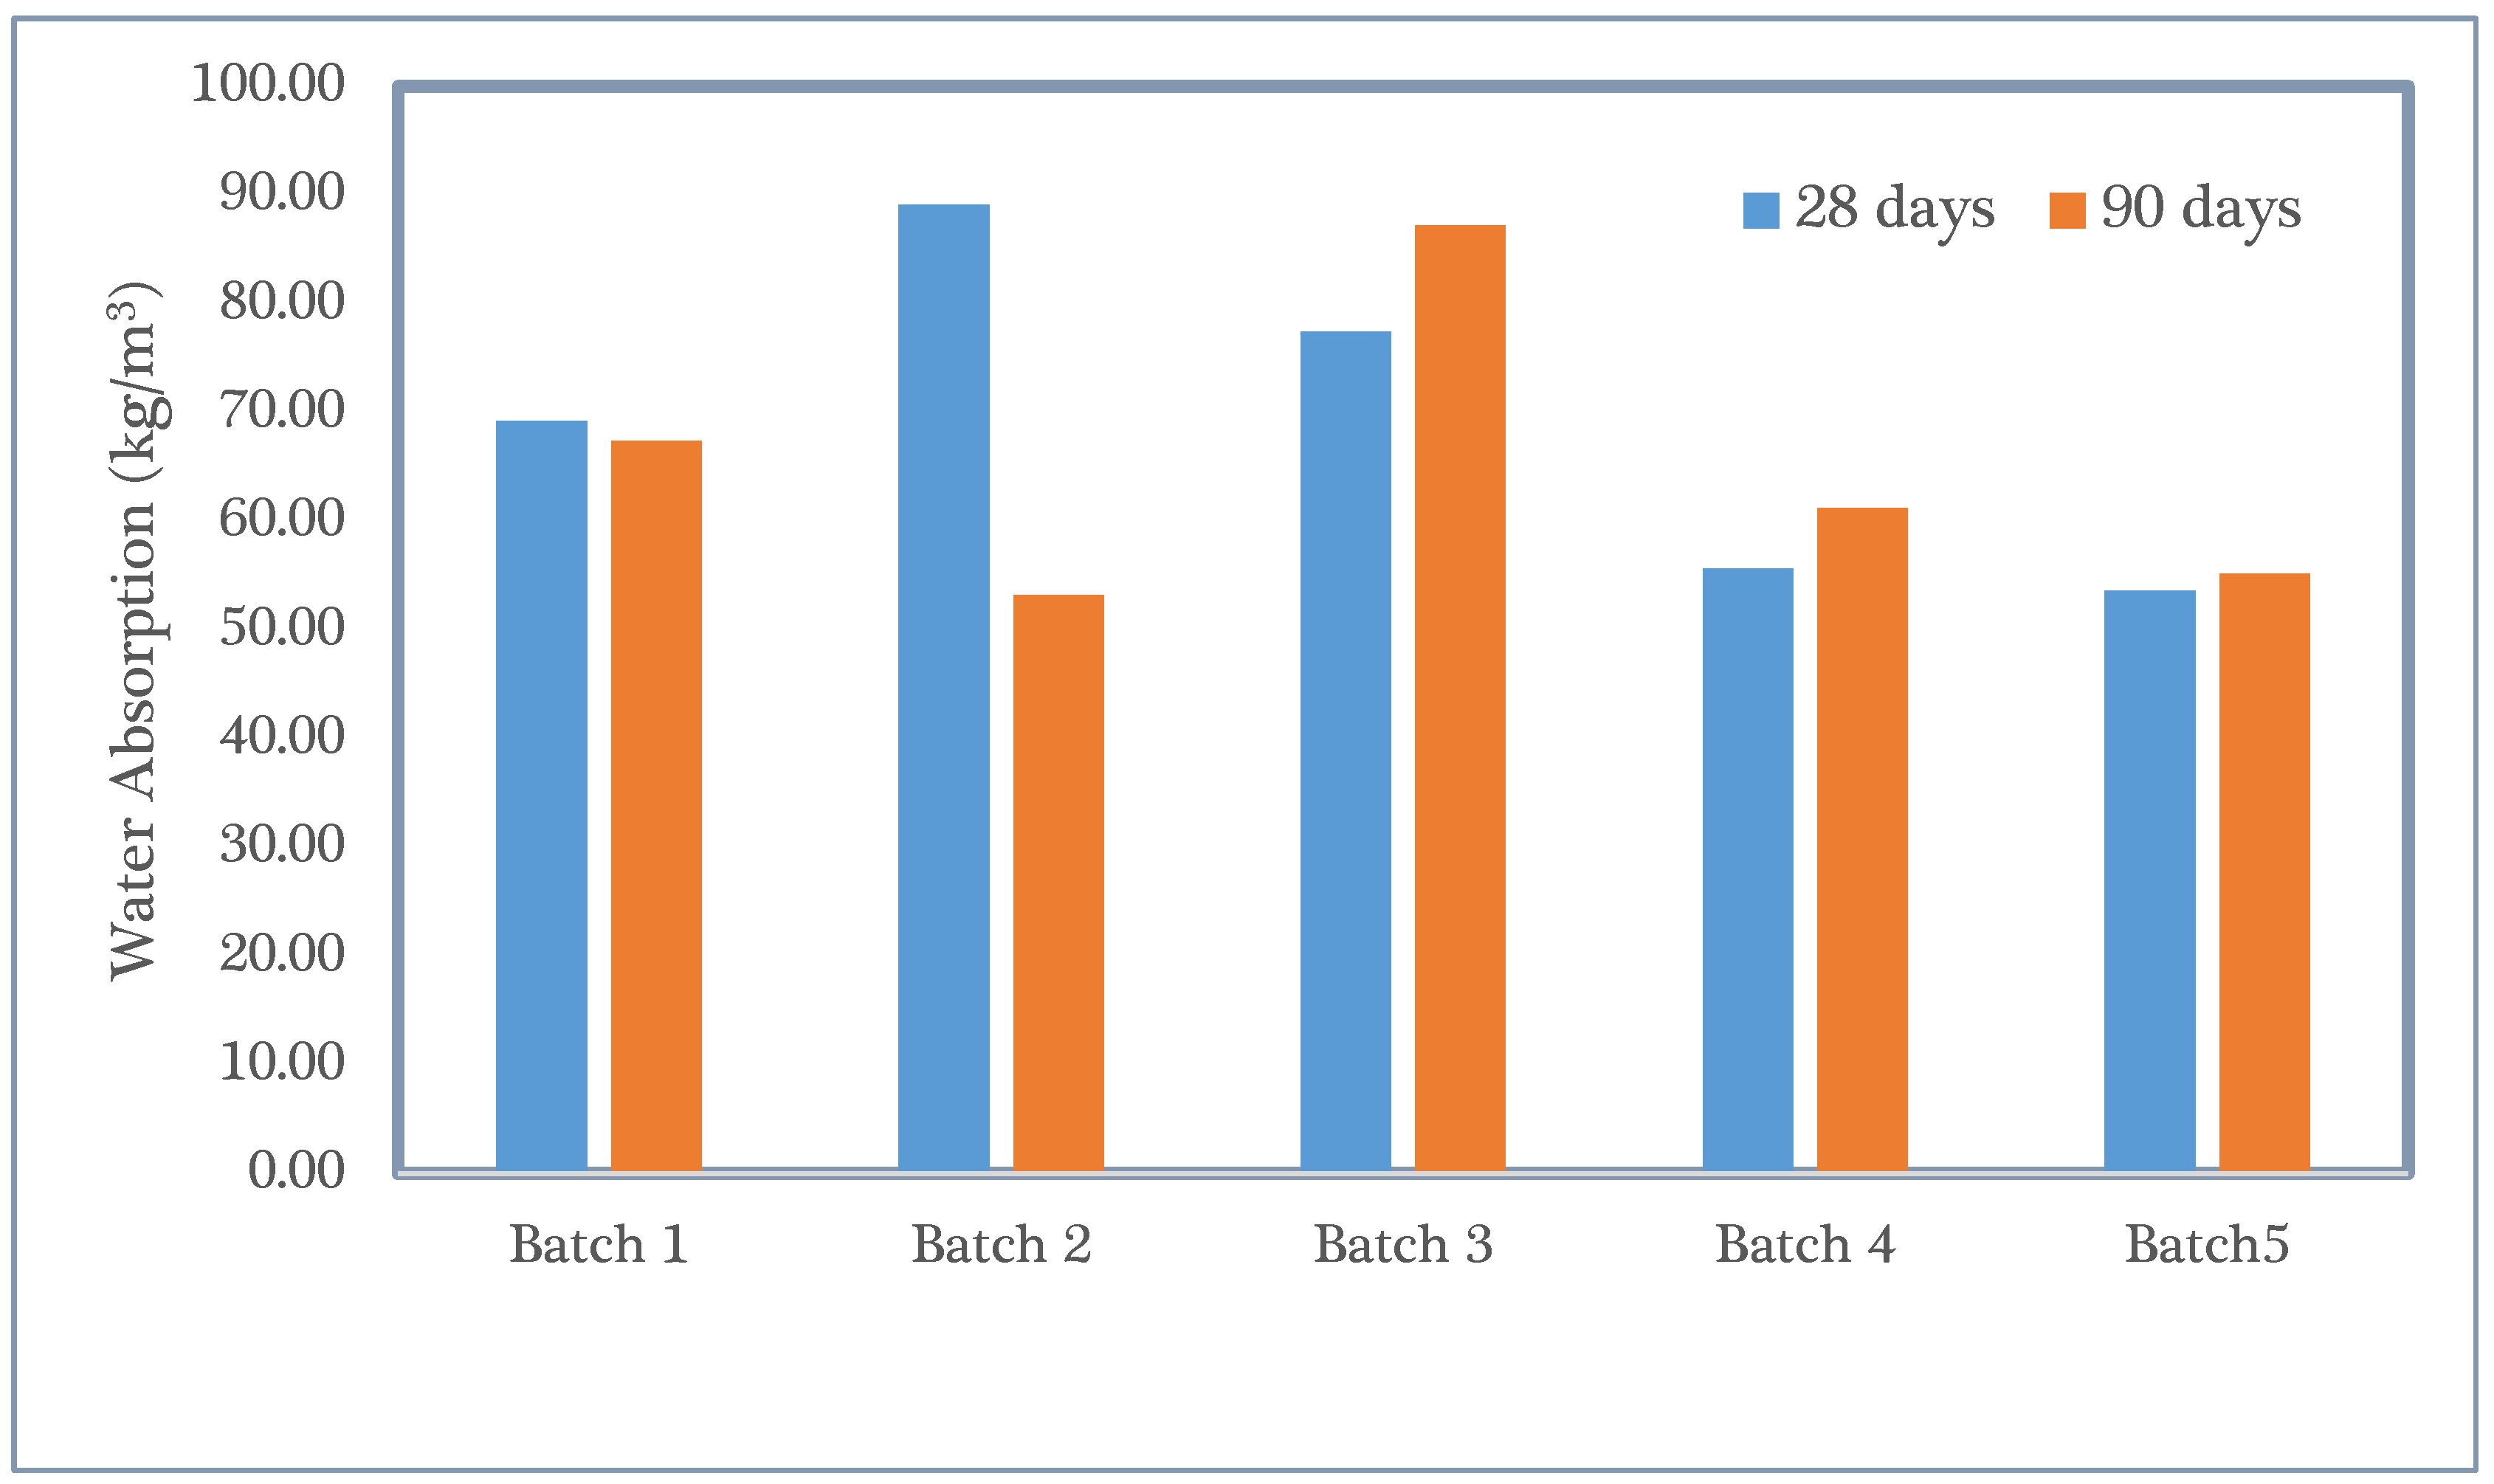
3.3. Water Absorption

The water absorption results for after 28 days and 90 days of air curing are presented in Figure 5. It is observed that the water absorption of all batches of brick samples is lower than the requirements set by ASTM C55-11 [34]. The requirements set under ASTM C55 state that the maximum water absorption is 208 kg/m3, 240 kg/m3, and 288 kg/m3 for normal-weight brick, medium-weight brick, and light-weight brick, respectively. Hence, in terms of water absorption, all batches of brick samples are classified as normal-weight bricks.
As seen in Figure 5, the rate of water absorption decreases significantly with increasing percentage of fly ash replacement and these results are consistent with the published results by Naganathan and Linda [37]. Based on these findings, it can be concluded that small particles of spherical fly ash are able to fill the voids, thereby making a denser packing which leads to the lower water absorption of the bricks.

3.4. Thermogravimetric Analysis

Table 2 presents the Thermogravimetric Analysis (TGA) and Derivative Thermogravimetric analysis (DTG) as a cumulative mass loss of the powder samples, taken from brick specimens, while the temperature increases. The step analysis of cement pastes obtained from the TG analysis indicates that all of the samples experienced mass losses in four different steps. The first mass drop in the TG curve, which is related to distinct peaks before 150 °C in the DTG curves, are referred to the moisture evaporation of the concrete paste samples. Table 2 illustrates the mass losses of the next three steps of all batches taken from the TGA test. Gabrovseka et al. [38] showed that the dehydration of portlandite started from 414 °C and completed at 470 °C with a decomposition temperatures peak at 451 °C for 7 days of hydration. It has also been reported [38,39,40] the decomposition of carbonates shows two peaks in the DTG curve. The first peak appears between 470 °C and 720 °C, with a maximum at 651 °C corresponding to the amorphous calcium carbonate. The second peak appears between 720 °C and 950 °C, with a maximum at 754 °C related to the de-carbonation of well-crystallized calcite.
Based on Table 2, the de-hydroxylation stage occurs in the range of 415–442 °C for all batches without any significant changes in the degradation temperature range. In addition, the broad peak in the third stage, which occurs due to the de-carbonation of amorphous calcium carbonate, is shortened due to the addition of POFA and fly ash. Table 2 also illustrates the mass losses of well-crystallized calcite (fourth stage), which occurs in the range of 720–950 °C, and declines by increasing POFA and fly ash content for the 90-days-cured samples. Samples with 28 days of curing show a fluctuation in this stage, which might be due to the low cement hydration compared to the 90 days curing time.

3.4.1. Hydrated Phase of Cement Pastes Containing Blended POFA and Fly Ash

Based on the TG and DTG results, the percentage of mass loss of calcium hydroxide Ca(OH)2 can be calculated by using the equation from Mohammed et al. [41]. The equation for calculating the total amount of calcium hydroxide in the powder samples is shown in Equation (1):
Amount of Ca(OH)2 = CH% de-hydroxylation + CH% de-carbonation = 74/18 dhloss + 74/44 dcloss
where dhloss = total mass lost due to the de-hydroxylation of calcium hydroxide at a temperature between 400 and 500 °C
Ca(OH)2 CaO + H2O (de-hydroxylation of calcium hydroxide)
and dcloss = total mass lost due to the de-carbonate reaction at a temperature between 500 and 733 °C
CaCO3 CaO + CO2 (de-carbonation of calcium carbonate)
and where 74, 18, and 44 are the molecular weights of CH, H2O, and CO2, respectively.

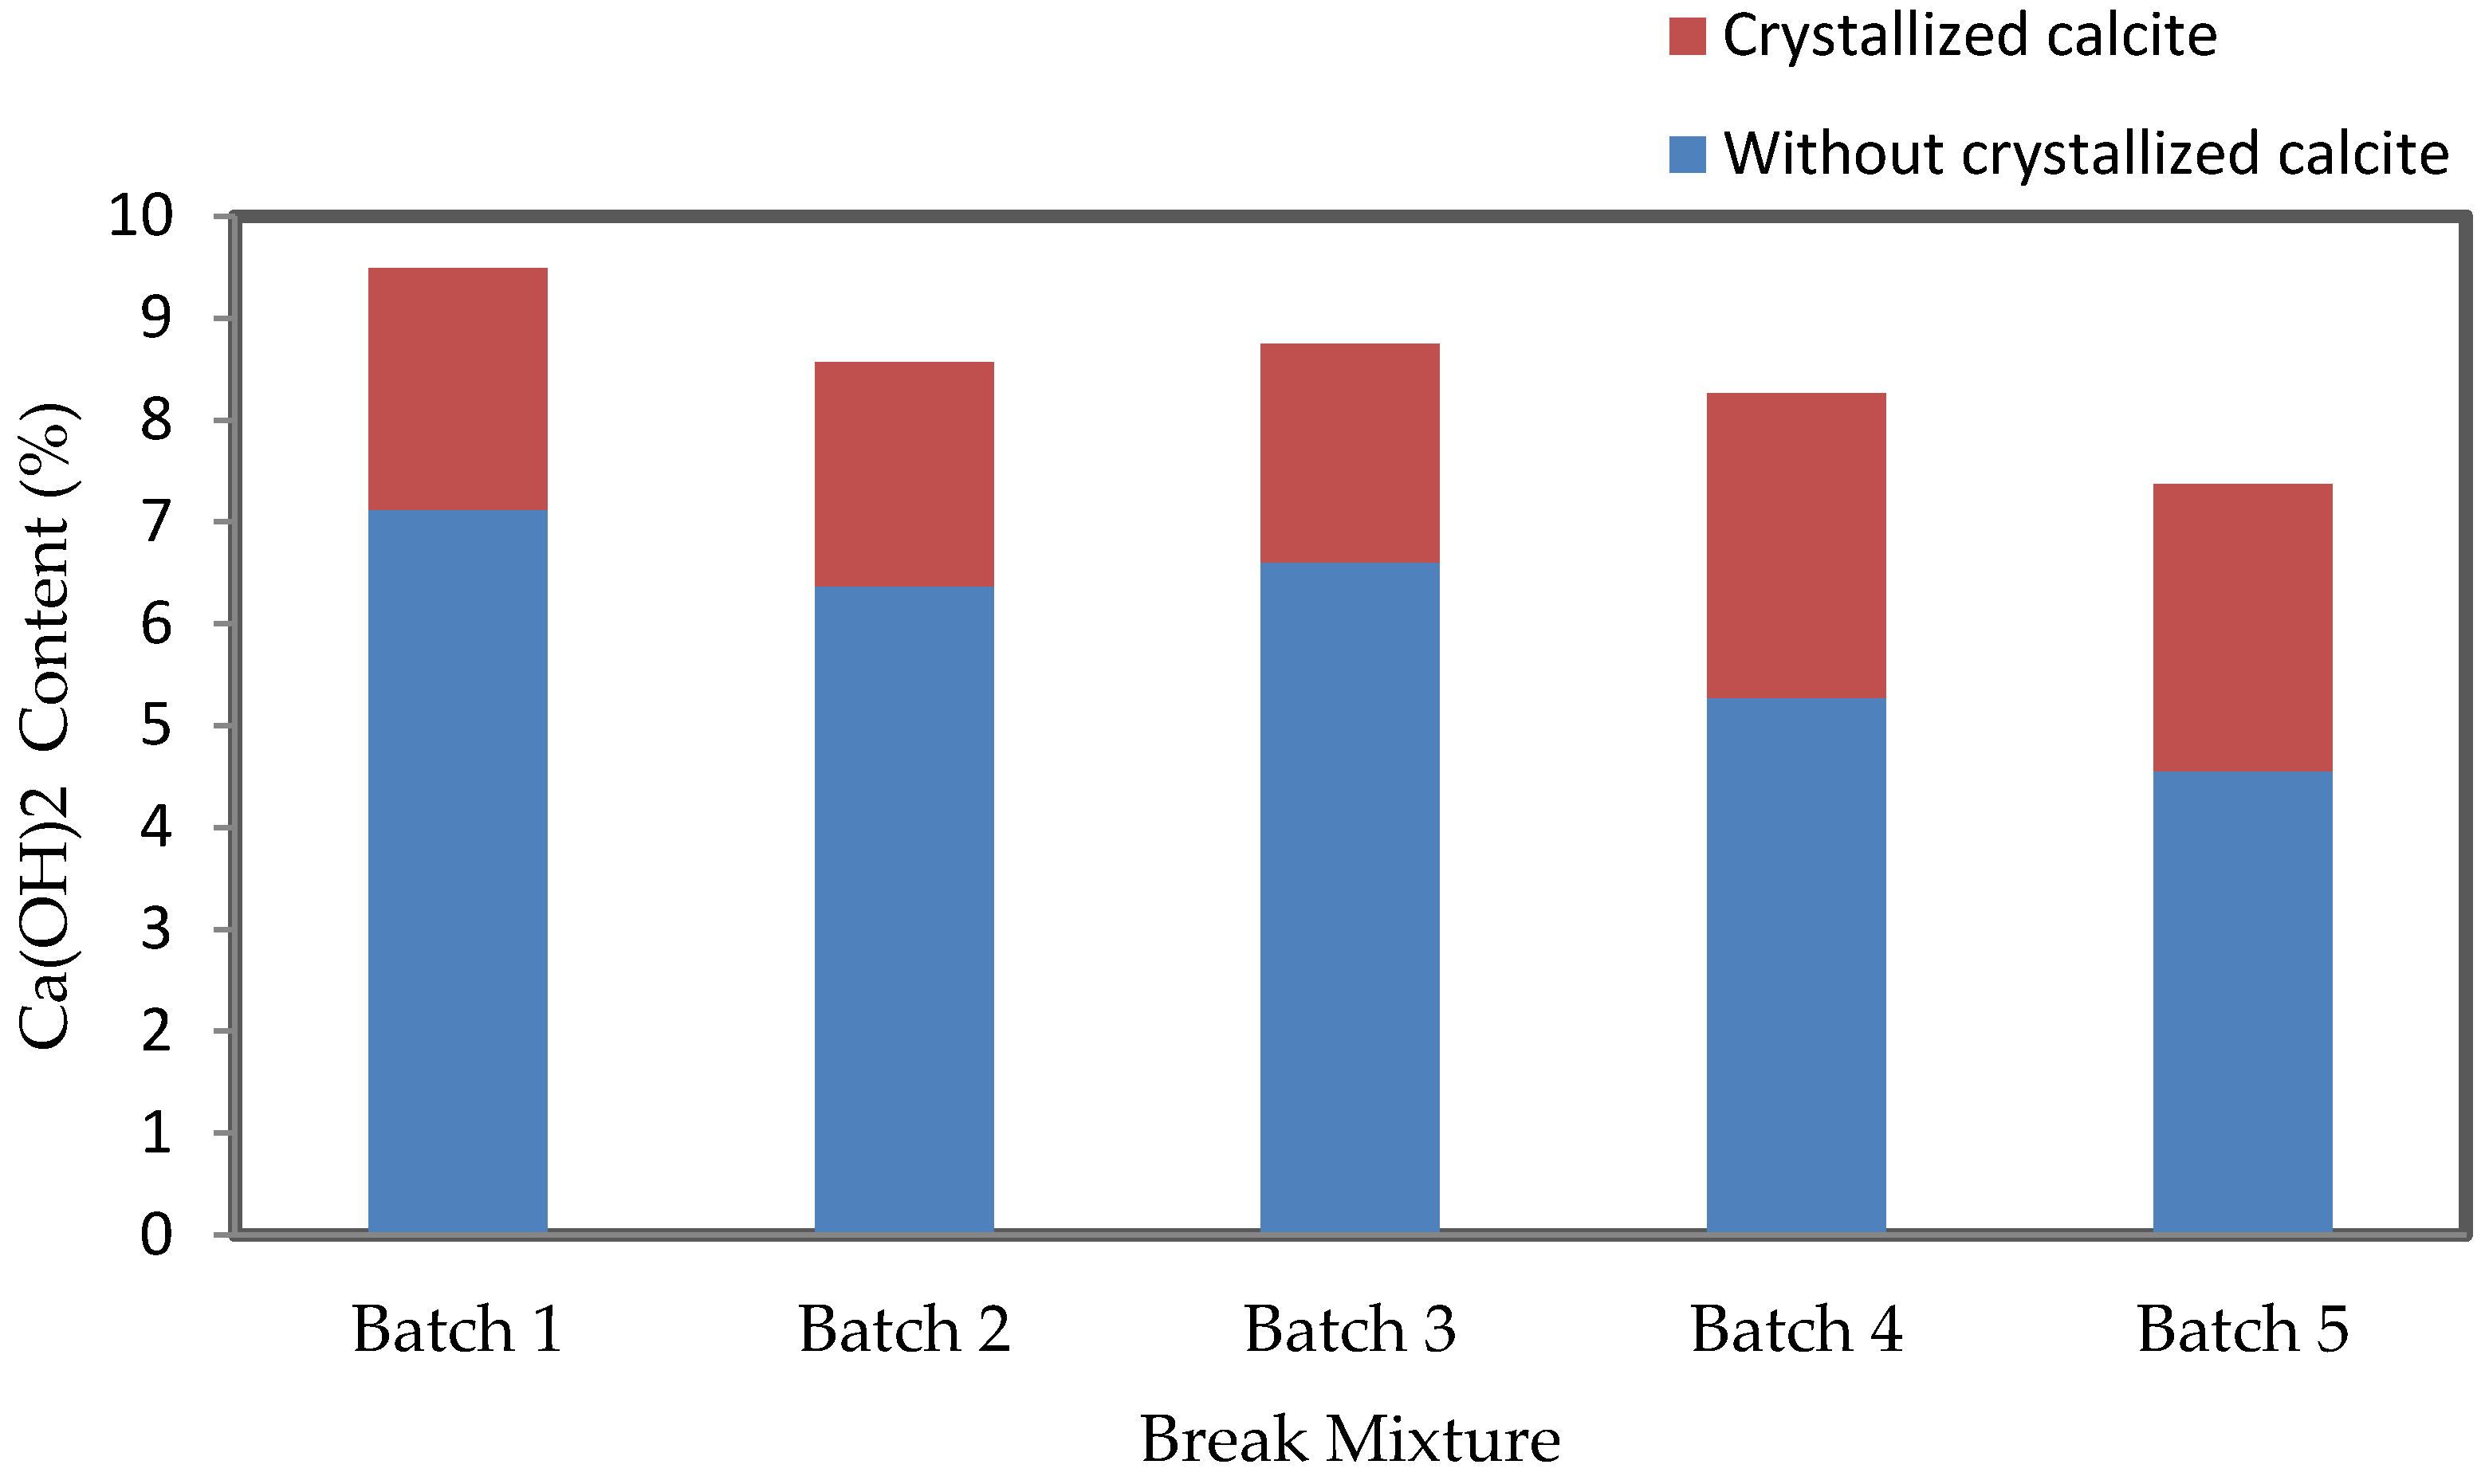
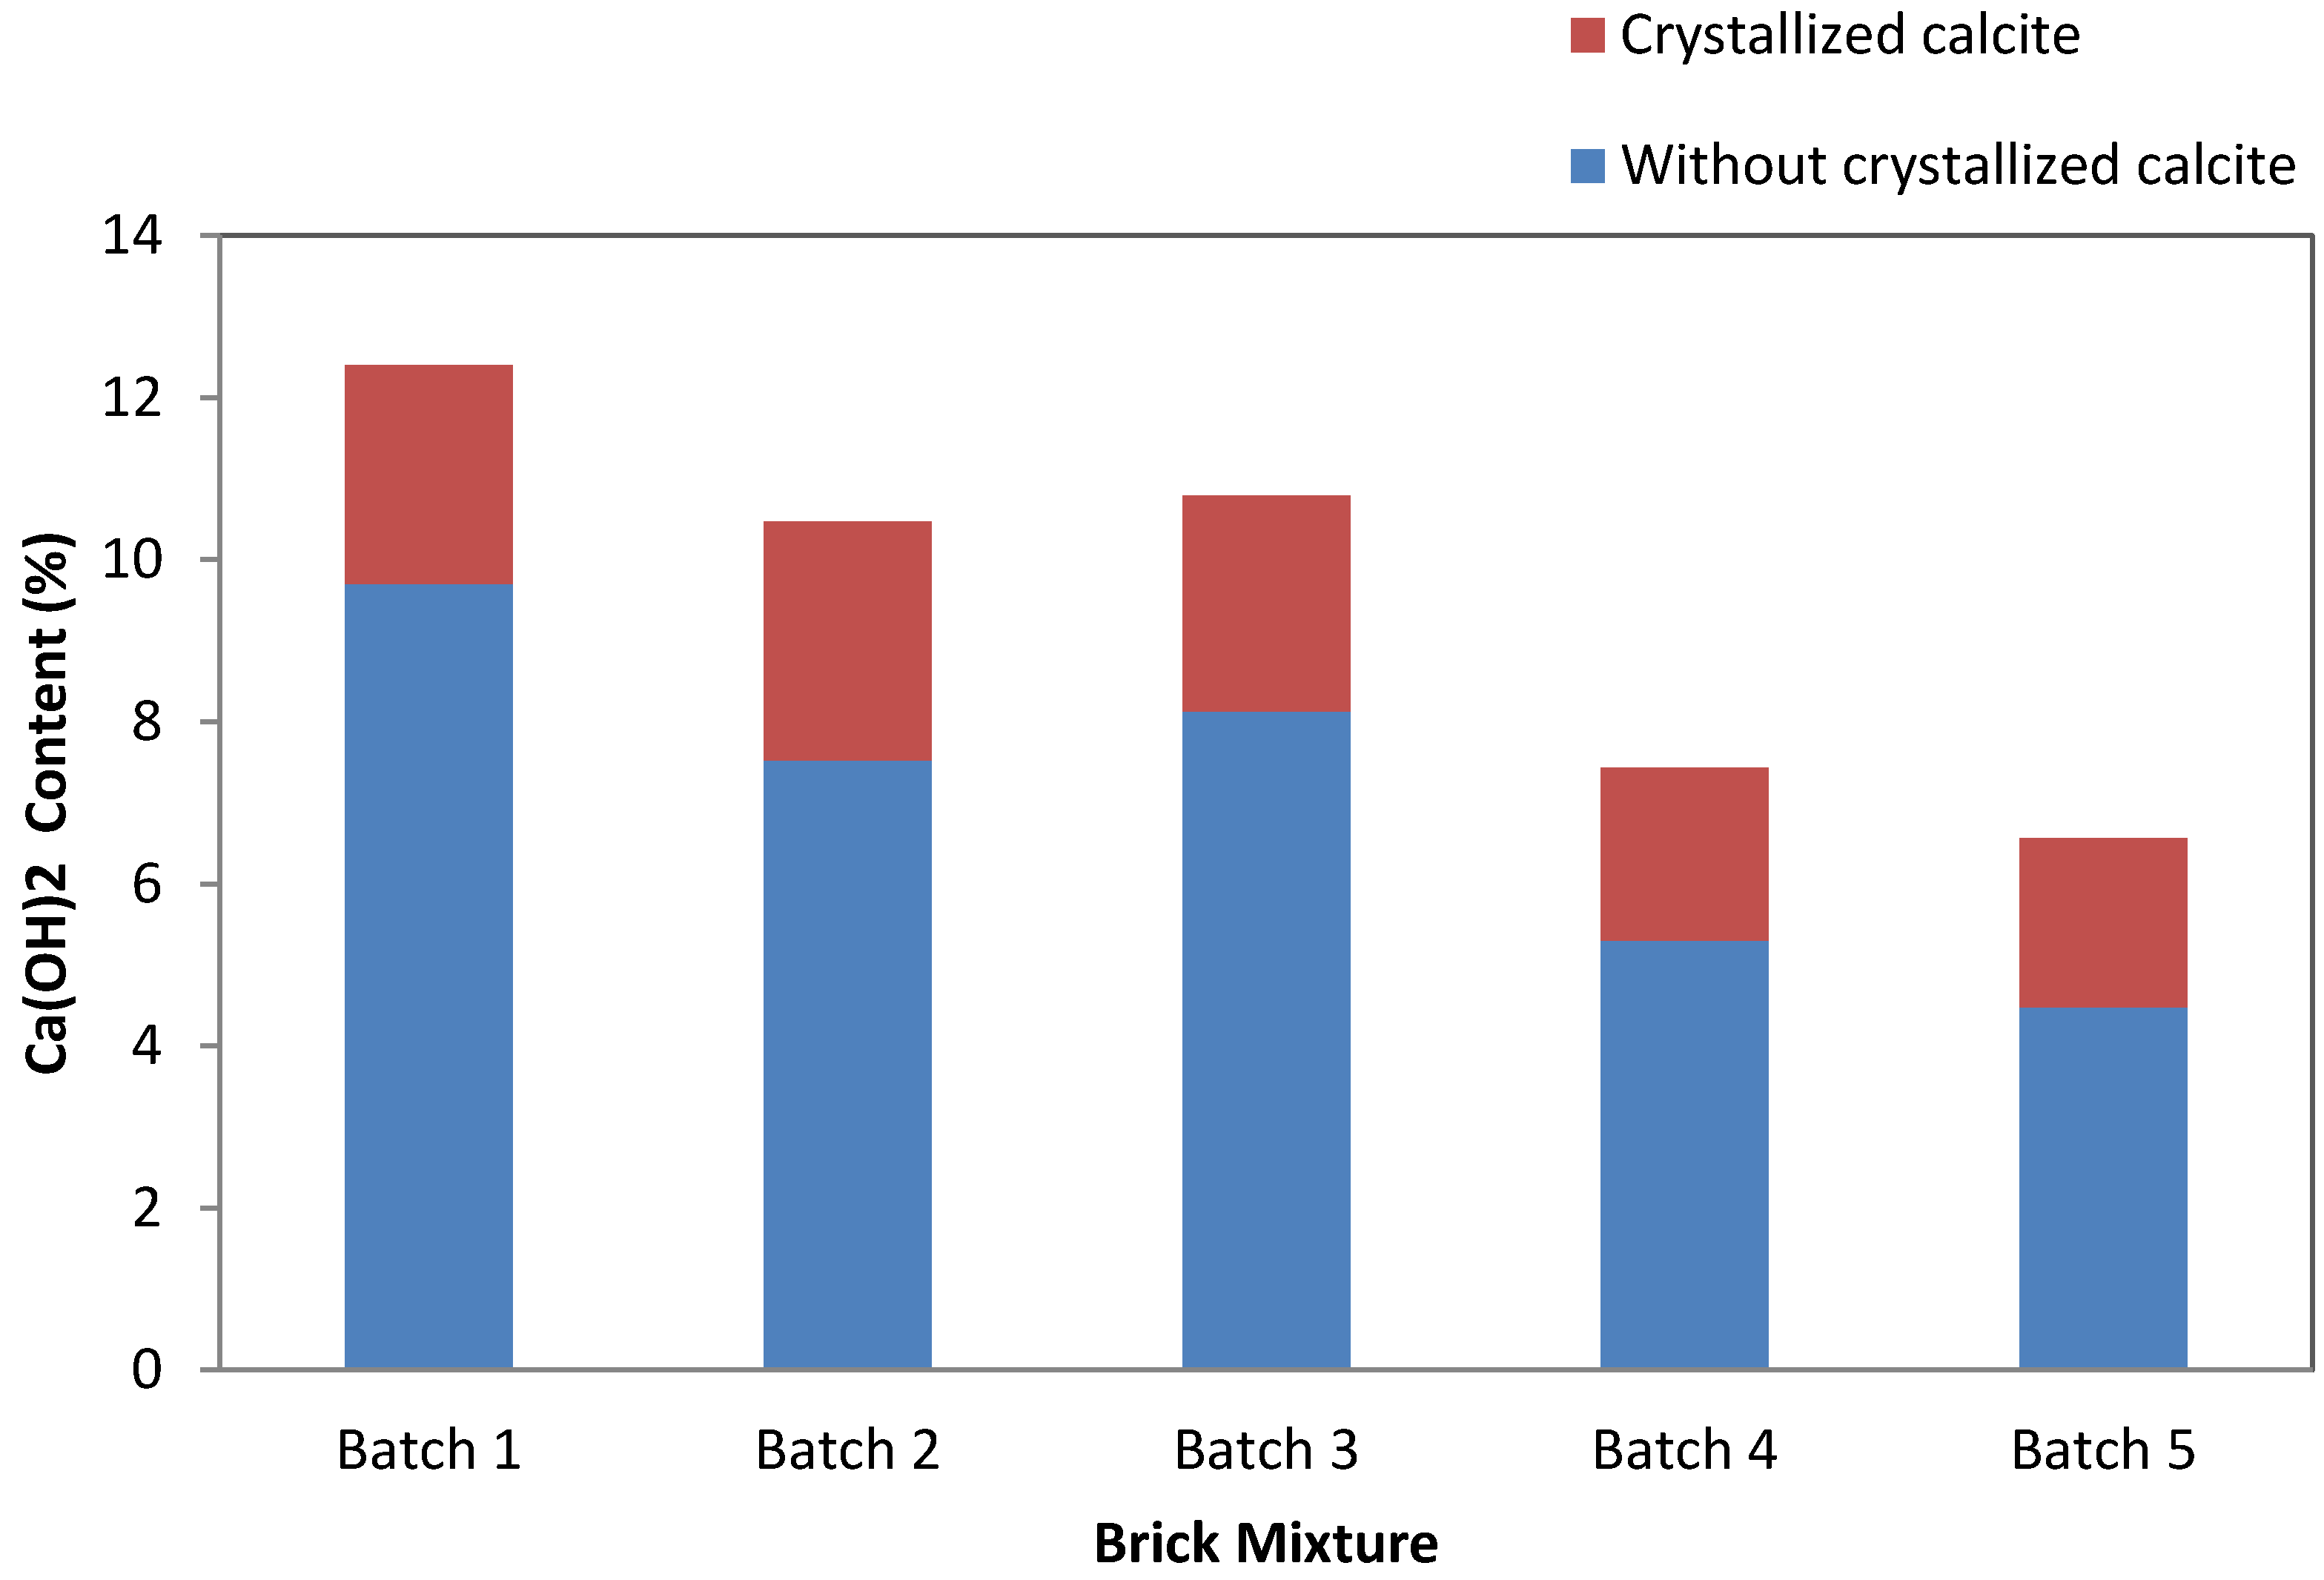
3.4.2. Ca(OH)2 Content
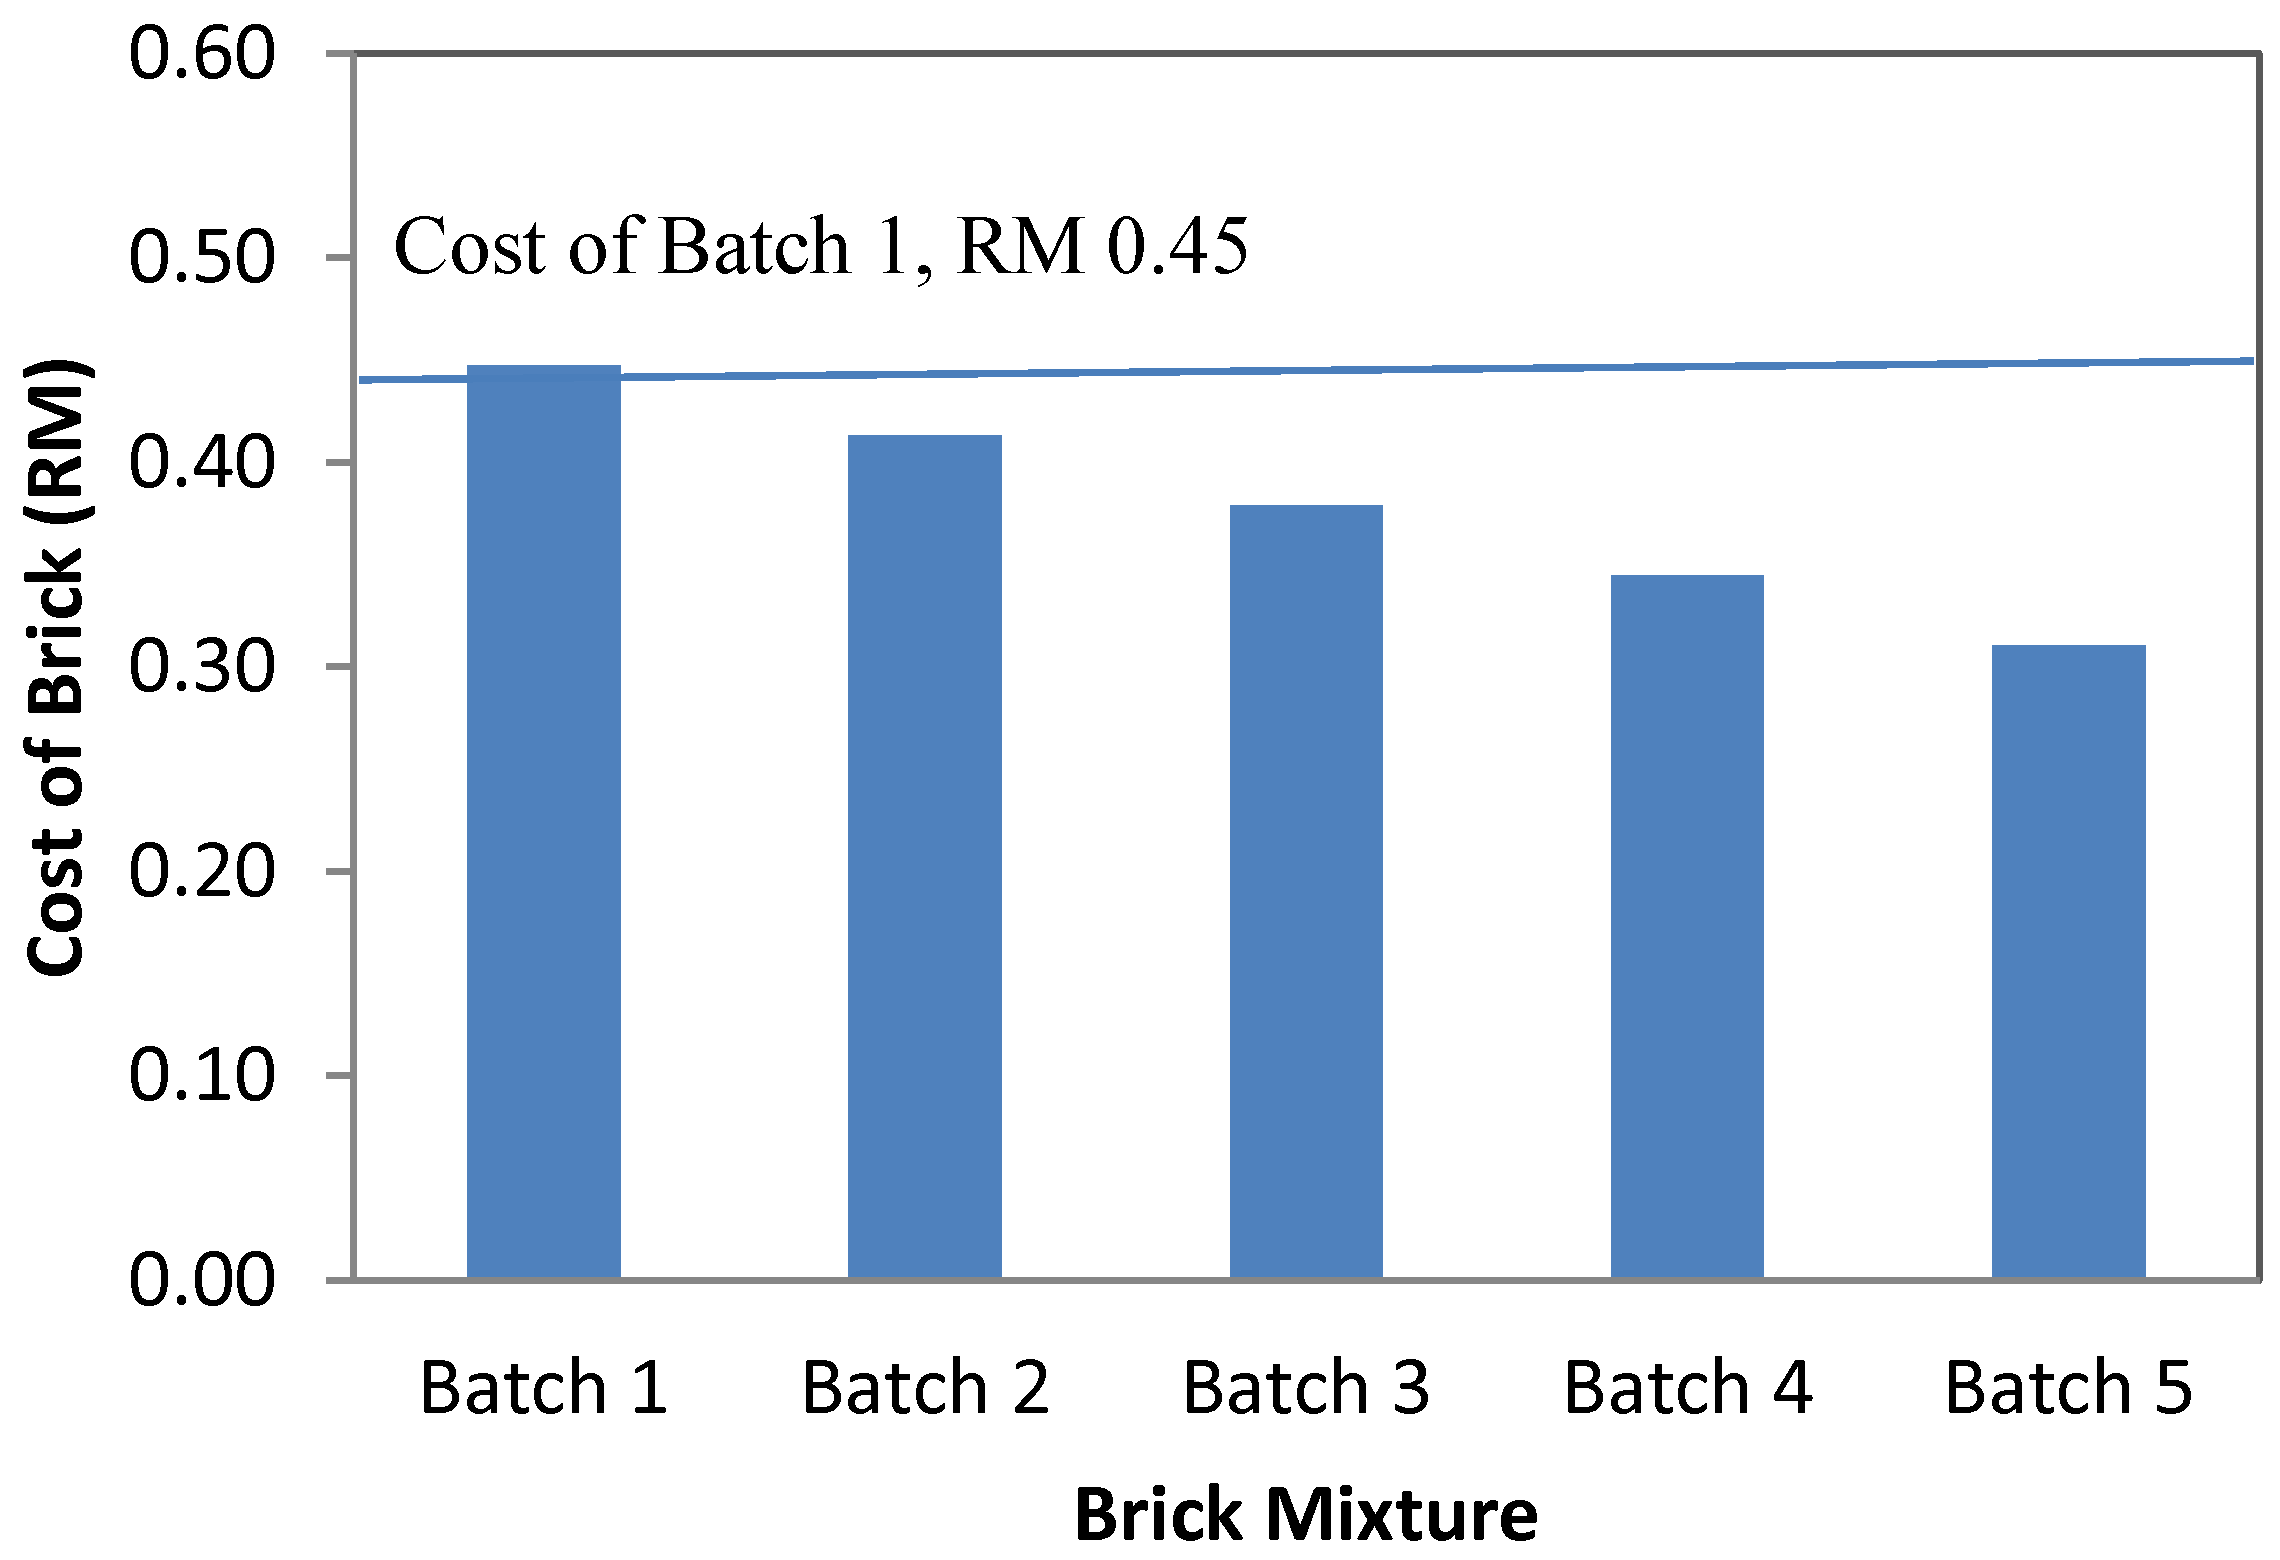
The Ca(OH)2 contents of the pastes at 28 days and at 90 days of curing are shown in Figure 6 and Figure 7, respectively. It can be seen that the trend of results at 28 days curing is almost similar to the results at 90 days curing. At 90 days of curing, the Ca(OH)2 content of the control batch (Batch 1) was approximately at 12.4%, which was the highest value compared to the other batches and this is due to hydration of the cement [35]. The addition of 10% POFA was found to result in a significant loss of Ca(OH)2. The pozzolanic reaction was found to reduce Ca(OH)2 as it was observed in Batch 2 [42]. However, at higher proportions of fly ash content, this becomes 30% (Batch 5), where Ca(OH)2 content significantly dropped to approximately 6.6%. These results showed that the higher the content of pozzolanic material (POFA and fly ash) is, the higher the consumption of Ca(OH)2 is, due to the pozzolanic reaction. Furthermore, another possibility for decreasing Ca(OH)2 content is due to the lower content of Portland cement in the POFA and fly ash cement pastes. The decrease of the Portland cement content would cause a lower amount of calcium hydroxide content to be liberated from the cement hydration. This finding is similar to previous findings of Altwair et al. [35].

3.5. Cost of Brick

The calculation of the cost of bricks is based on only material price. The price of cement and sand is 9.5 USD per 100 kg and 1 USD per 100 kg, respectively. The fly ash and POFA are free of cost. The cost analysis of the bricks is shown in Figure 8. It can be seen that the cost of the control batch is the most expensive compared to the other batches. The cost of the raw materials is important for the overall cost of the bricks. While the cost depends significantly on the cost of cement, when it is replaced by these waste materials, such as POFA and fly ash, there can be a significant cost saving. The lower cost creates commercial viability in moving towards the use of waste materials as a replacement for cement and provides an impetus towards cleaner production in the construction industry.

4. Conclusions

An experimental study was carried out to investigate the properties of bricks in which cement is replaced by blended POFA and fly ash in different ratios. The findings in this study emphasize the opportunity for an environmentally friendly method of managing waste products from the palm oil industry and coal-fired power plants. Fly ash bricks showed encouraging improvement after the addition of 10% of POFA. Some specific conclusions from this study are as follows:
As per ASTM C55-11 [34], all of the brick specimens were categorized under the medium-weight brick category. In essence, the density of the bricks is dependent on the percentage of substitution of the Portland cement. The higher the level of replacement of Portland cement, the greater the density of the bricks.
The compressive strength of the bricks is improved by adding POFA and fly ash. The highest strength value was obtained when the ratio of the POFA and fly ash was maintained as 1:1. However, the compressive strength slightly decreased when the fly ash replacement was more than 10%.
The compressive strength of the bricks decreased approximately by 10% to 15% after 24 h of immersion in water. In addition, bricks containing 10% to 30% of fly ash exhibited a higher compressive strength than that of the bricks made from Portland cement. However, based on the Malaysian Standard [43], these bricks satisfied the requirements of Class 1 and Class 2 load-bearing bricks.
The water absorption of the POFA and fly ash bricks is 208 kg/m3, which is lower than that of ASTM C55-11 [34]. However, higher water absorption was found in Batch 3 compared to the control batch at 90 days. Furthermore, the water absorption of POFA and fly ash bricks decreased with increasing fly ash replacement.
At 28 days and 90 days of curing, TGA data confirmed that the Ca(OH)2 gradually decreased due to the increase of pozzolanic content.
POFA and fly ash are considered to be waste materials, and this led to the cost of POFA- and fly-ash-containing bricks being lower than that of Portland-cement-containing bricks.

Author Contributions

Muhammad Ekhlasur Rahman & Phang Ji Ong conceived and designed the experiments; Phang Ji Ong & Kazi Md. Shorowordi performed the experiments; Muhammad Ekhlasur Rahman, Omid Nabinejad & Phang Ji Ong analyzed the data; Muhammad Ekhlasur Rahman, Phang Ji Ong, Omid Nabinejad, Sumaiya Islam, Neamul Ahsan Noman Khandoker and Vikram Pakrashi wrote the paper.

Conflicts of Interest

The authors declare no conflict of interest.

References

  1. Da Silva Almeida, G.; Da Silva, J.B.; Silva, C.J.; Swarnakar, R.; De Araújo Neves, G.; De Lima, A.G. Heat and mass transport in an industrial tunnel dryer: Modeling andsimulation applied to hollow bricks. Appl. Therm. Eng. 2013, 55, 78–86. [Google Scholar] [CrossRef]
  2. Yusoff, S. Renewable energy from palm oil—Innovation on effectiveutilization of waste. J. Clean. Prod. 2006, 14, 87–93. [Google Scholar] [CrossRef]
  3. Ng, W.P.Q.; Lam, H.L.; Foo, F.Y.; Kamal, M.; Lim, J.H.E. Waste-to-wealth: Green potential from palm biomass in Malaysia. J. Clean. Prod. 2012, 34, 57–65. [Google Scholar] [CrossRef] [Green Version]
  4. Agensi Inovasi Malaysia. National Biomass Strategy 2020: New Wealth Creation for Malaysia’s Palm Oil Industry; Agensi Inovasi Malaysia: Kualalumpur, Malaysia, 2011; pp. 1–32. [Google Scholar]
  5. AL-Oqla, F.M.; Sapuan, S.M. Natural fiber reinforced polymer composites in industrial applications: Feasibility of date palm fibers for sustainable automotive Industry. J. Clean. Prod. 2014, 66, 347–354. [Google Scholar] [CrossRef]
  6. Rahman, M.E.; Boon, A.; Muntohar, A.S.; Tanim, M.N.H.; Pakrashi, V. Performance of Bricks Incorporating Palm Oil Fuel Ash. J. Clean. Prod. 2014, 78, 195–201. [Google Scholar] [CrossRef]
  7. AL-Oqla, F.M.; Sapuan, S.M. Polymer Selection Approach for Commonly and Uncommonly Used Natural Fibers under Uncertainty Environments. J. Miner. Metals Mater. Soc. 2015, 67, 2450–2463. [Google Scholar] [CrossRef]
  8. Al-Oqla, F.M.; Sapuan, M.S.; Ishak, M.R.; Aziz, N.A. Combined Multi-criteria Evaluation Stage Technique as an agro Waste Evaluation Indicator for Polymeric Composites: Date Palm Fibers as a Case Study. BioResources 2014, 9, 4608–4621. [Google Scholar] [CrossRef]
  9. Al-Oqla, F.M.; Sapuan, M.S.; Ishak, M.R.; Aziz, N.A. A Novel Evaluation Tool for Enhancing the Selection of Natural Fibers for Polymeric Composites Based on Fiber Moisture Content Criterion. BioResources 2015, 10, 299–312. [Google Scholar] [CrossRef]
  10. Tangchirapat, W.; Saeting, T.; Jaturapitakkul, C.; Kiattikomol, K.; Siripanichgorn, A. Use of waste ash from palm oil industry in concrete. Waste Manag. 2007, 27, 81–88. [Google Scholar] [CrossRef] [PubMed]
  11. Cicek, T.; Tanrıverdi, M. Lime based steam autoclaved fly ash bricks. Constr. Build. Mater. 2007, 21, 1295–1300. [Google Scholar] [CrossRef]
  12. Tay, J.H. Ash from oil-palm waste as concrete material. J. Mater. Civ. Eng. 1990, 2, 94–105. [Google Scholar] [CrossRef]
  13. Muntohar, A.S.; Rahman, M.E. Lightweight masonry block from oil palm kernel shell. Constr. Build. Mater. 2014, 54, 477–484. [Google Scholar] [CrossRef]
  14. Shakir, A.A.; Sivakumar, N.; Mustapha, K.N. Properties of bricks made using fly ash, quarry dust and billet scale. Constr. Build. Mater. 2013, 41, 131–138. [Google Scholar] [CrossRef]
  15. Turgut, P. Manufacturing of building bricks without Portland cement. J. Clean. Prod. 2012, 37, 361–367. [Google Scholar] [CrossRef]
  16. Gokhan, G.; Osman, S. Porous clay bricks manufactured with rice husks. Constr. Build. Mater. 2013, 40, 390–396. [Google Scholar]
  17. Rahman, M.A. Properties of clay-sand-rice husk ash mixed bricks. Int. J. Cem. Compos. Lightweight Concr. 1987, 9, 105–108. [Google Scholar] [CrossRef]
  18. Malhotra, S.K.; Tehri, S.I. Development of bricks from granulated blastfurnace slag. Constr. Build. Mater. 1996, 10, 191–193. [Google Scholar] [CrossRef]
  19. Bilgin, N.; Yeprem, H.A.; Arslan, S.; Bilgin, A.; Gunay, E.; Marsoglu, M. Use of waste marble powder in brick industry. Constr. Build. Mater. 2012, 29, 449–457. [Google Scholar] [CrossRef]
  20. Weng, C.H.; Lin, D.F.; Chiang, P.C. Utilization of sludge as brick materials. Adv. Environ. Res. 2003, 7, 679–685. [Google Scholar] [CrossRef]
  21. Faria, K.C.P.; Gurgel, R.F.; Holanda, J.N.F. Recycling of sugarcane bagasse ash waste in the production of clay bricks. J. Environ. Manag. 2012, 101, 7–12. [Google Scholar] [CrossRef] [PubMed]
  22. Gencel, O.; Sutcu, M.; Erdogmus, E.; Koc, V.; Cay, V.V.; Gok, M.S. Properties of bricks with waste ferrochromium slag and zeolite. J. Clean. Prod. 2013, 59, 111–119. [Google Scholar] [CrossRef]
  23. Zhang, L. Production of Bricks from Waste Materials—A review. Constr. Build. Mater. 2013, 47, 643–655. [Google Scholar] [CrossRef]
  24. Taaffe, J.; O’Sullivan, S.; Rahman, M.E.; Pakrashi, V. Experimental Characterisation of Polyethylene Terephthalate (PET) Bottle Eco-Bricks. Mater. Des. 2014, 60, 50–56. [Google Scholar] [CrossRef]
  25. Rahman, M.E.; Muntohar, A.S.; Pakrashi, V.; Nagaratnam, B.H.; Sujan, D. Self Compacting Concrete from Uncontrolled Burning of Rice Husk & Blended Fine Aggregate. Mater. Des. 2014, 55, 410–415. [Google Scholar]
  26. ASTM International. Standard Specification for Portland Cement; ASTM C150/C150M-12; ASTM International: West Conshohocken, PA, USA, 2012. [Google Scholar]
  27. ASTM International. Standard Specification for Coal Fly Ash and Raw or Calcined Natural Pozzolan for Use in Concrete; ASTM C618-12a; ASTM International: West Conshohocken, PA, USA, 2012. [Google Scholar]
  28. Nagaratnam, B.H.; Rahman, M.E.; Mannan, M.A. A Study on Hardened State Properties Using Fly Ash and Blended Fine Aggregate. Adv. Mater. Res. 2012, 587, 21–25. [Google Scholar] [CrossRef]
  29. Australian Standard. Aggregates and Rock for Engineering Purposes—Concrete Aggregates; AS 2758.1; Australian Standard: Sydney, Australia, 1998. [Google Scholar]
  30. ASTM International. Standard Test Methods for Sampling and Testing Brick and Structural Clay Tile; ASTM C67-11; ASTM International: West Conshohocken, PA, USA, 2011. [Google Scholar]
  31. ASTM International. Standard Test Method for Compositional Analysis by Thermogravimetry; ASTM E1131-08; ASTM International: West Conshohocken, PA, USA, 2014. [Google Scholar]
  32. Borges, P.H.R.; Costa, J.O.; Milestone, N.B.; Lynsdale, C.J.; Streatfield, R.E. Carbonation of CH and C-S-H in composite cement pastes containing high amounts of BFS. Cem. Concr. Res. 2010, 40, 284–292. [Google Scholar] [CrossRef]
  33. Ranjbar, N.; Mehrali, M.; Behnia, A.; Alengaram, U.J.; Jumaat, M.J. Compressive Strength and Microstructural Analysis of Fly Ash/Palm Oil Fuel Ash Based Geopolymer Mortar. Mater. Des. 2014, 59, 532–539. [Google Scholar] [CrossRef]
  34. ASTM International. Standard Specification for Concrete Building Brick; ASTM C55-11; ASTM International: West Conshohocken, PA, USA, 2011. [Google Scholar]
  35. Altwair, N.M.; Johari, A.M.; Hashim, S.F.S. Strength Activity Index and Microstructural Characteristics of Treated Palm Oil Fuel Ash. Int. J. Civ. Environ. Eng. 2011, 11, 100–107. [Google Scholar]
  36. Chindaprasirt, P.; Homwuttiwong, S.; Jaturapitakkul, C. Strength and water permeability of concrete containing palm oil fuel ash and rice husk. Constr. Build. Mater. 2007, 21, 1492–1499. [Google Scholar] [CrossRef]
  37. Naganathan, S.; Linda, T. Effect of Fly Ash Fineness on the Performance of Cement Mortar. Jordan J. Civ. Eng. 2013, 7, 326–331. [Google Scholar]
  38. Gabrovseka, R.; Vukb, T.; Kaucica, V. Evaluation of the hydration of Portland cement containing various carbonates by means of thermal analysis. Acta Chim. Slov. 2006, 53, 159–165. [Google Scholar]
  39. Dweck, J.; Buchler, P.M.; Vieira Coelho, A.C.; Cartledge, F.K. Hydration of a Portland cement blended with calcium carbonate. Thermochim. Acta 2000, 346, 105–113. [Google Scholar] [CrossRef]
  40. Li, D.; Shi, H.; Deng, J.; Xu, Y. Study on the thermal decomposition kinetics of nano-sized calcium carbonates. J. Zhejiang Univ. 2003, 4, 363–368. [Google Scholar] [CrossRef]
  41. Mohammed, M.K.; Dawson, A.R.; Thom, N.H. Production, microstructure and hydration of sustainable self-compacting concrete with different types of filler. Constr. Build. Mater. 2013, 49, 84–92. [Google Scholar] [CrossRef]
  42. Kroehong, W.; Sinsiri, T.; Jaturapitakkul, C.; Chindaprasirt, P. Effect of Palm Oil Fuel Ash Fineness on the Microstructure of Blended Cement Paste. Constr. Build. Mater. 2011, 25, 4095–4104. [Google Scholar] [CrossRef]
  43. Scientific and Industrial Research Institute of Malaysia (SIRIM). Specifications for Bricks and Blocks of Fired Brick-Earth Clay or Shale: Part 2: Metric Units; MS 76; SIRIM: Shah Alam, Malaysia, 1972. [Google Scholar]
Figure 1. Local River Sand Grading Curve.
Technologies 06 00020 g001
Figure 2. Average densities of different mixes.
Technologies 06 00020 g002
Figure 3. Compressive strength of bricks at 28 days for soaked and unsoaked conditions.
Technologies 06 00020 g003
Figure 4. Compressive strength of bricks at 90 days for soaked and unsoaked conditions.
Technologies 06 00020 g004
Figure 5. Water absorption of bricks for different batches of samples.
Technologies 06 00020 g005
Figure 6. De-hydroxylation and de-carbonation at 28 days.
Technologies 06 00020 g006
Figure 7. De-hydroxylation and de-carbonation at 90 days.
Technologies 06 00020 g007
Figure 8. Unit cost of brick.
Technologies 06 00020 g008
Table 1. Brick Mix Ratio.
BatchRatioCuring Condition
Batch 1C:S = 1:390 days
28 days
Batch 2C + POFA(10%):S = 1:390 days
28 days
Batch 3C + POFA(10%) + FA(10%):S = 1:390 days
28 days
Batch 4C + POFA(10%) + FA(20%):S = 1:390 days
28 days
Batch 5C + POFA(10%) + FA(30%):S = 1:390 days
28 days
Where: C = Cement; S = Sand; POFA = Palm Oil Fuel Ash; FA = Fly Ash.
Table 2. Step analysis of de-hydroxylation and de-carbonation stages from TGA curves.
Cement Paste SampleSecond StageThird StageFourth Stage
Temperature Range/°CMass Loss/%Temperature Range/°CMass Loss/%Temperature Range/°CMass Loss/%
28 Days90 Days28 Days90 Days28 Days90 Days
Batch 1419–4425.023.90505–7332.105.80733–9501.641.87
Batch 2415–4373.574.80626–6772.802.71735–9501.122.12
Batch 3421–4413.694.05620–6752.924.08733–9501.541.55
Batch 4419–4372.723.03692–6972.542.27720–9502.041.57
Batch 5428–4422.272.37518–6542.292.13727–9501.981.59

