Article

Mass Proportion, Bioactive Compounds and Antioxidant Capacity of Carrot Peel as Affected by Various Solvents

by
Van Tang Nguyen
1,2,* and
Christopher J. Scarlett
1
1
School of Environmental and Life Sciences, Faculty of Science and Information Technology, University of Newcastle, Ourimbah, NSW 2258, Australia
2
Department of Food Technology, Faculty of Food Technology, Nha Trang University, No. 2 Nguyen Dinh Chieu, Nha Trang, Khanh Hoa 8458, Vietnam
*
Author to whom correspondence should be addressed.
Technologies 2016, 4(4), 36; https://doi.org/10.3390/technologies4040036
Submission received: 22 August 2016 / Revised: 17 October 2016 / Accepted: 15 November 2016 / Published: 17 November 2016
(This article belongs to the Section Innovations in Materials Processing)

Abstract

:
The aim of this study was to determine the mass proportion of carrot root and the effects of four various solvents (methanol, water, ethanol and hexane) on the contents of total phenolics and saponins as well as antioxidant capacity of carrot peel to identify an optimal solvent for effective extraction of bioactive compounds from carrot peel for further investigation. The results showed that carrot root consisted of body, heads and peel with their mass proportion of 83.19%, 5.01% and 14.19% by fresh weight, respectively. Among four solvents tested, methanol obtained the highest levels of extraction yield (54.02% by dry weight), total phenolic content (9.02 mg GAE/g dry weight) and antioxidant capacity (DPPH radical scavenging capacity, cupric ion reducing antioxidant capacity, and ferric reducing antioxidant power) from carrot peel, while water extracted the highest content of saponins (272.9 mg EE/g dry weight) and possessed the maximum ABTS radical scavenging capacity. Therefore, methanol and water are considered for effective extraction of phenolics and saponins from carrot peel, respectively. The phenolic/saponin-enriched extracts are potential sources for further applications in the healthy food and/or pharmaceutical industries.

Graphical Abstract

1. Introduction

The oxidation process in biological systems directly relates to oxygen, which is the most important acceptor of electrons leading to the formation of active oxygen and free radical species [1]. Reactive oxygen species (ROS) and reactive nitrogen species (RNS) have significant biological relevance that may attack biological macromolecules, giving rise to cellular, protein, lipid, nucleic acids and DNA damage, cell aging, oxidative stress-originated diseases, such as cardiovascular, diabetic and neurodegenerative diseases and cancer [1,2]. Therefore, the use of antioxidants derived from natural materials is necessary to prevent radical chain reactions of oxidation or to inhibit initiation and propagation steps leading to termination of the reaction and delay oxidation processes [3,4].
In recent years, natural bioactive compounds have received a special attraction because of their potential biological properties and applicability. As such, considering residues/by-products or wastes from the food processing industry as abundant, inexpensive, renewable and sustainable sources of bioactive compounds is a great interest to the researchers and producers [5,6,7,8,9,10,11,12].
In regards to the extraction process, extraction conditions include solvents, extraction methods and extraction parameters, in which solvents directly affect extraction efficiency, production costs such as extraction times, amount of solvents, energy consumption, as well as their impacts on humans and the environment [13,14,15,16]. Recently, a number of various solvents have been applied for extraction of bioactive compounds from plant materials—for example, water considered as a “green” solvent, organic solvents (ethanol and methanol) [17,18], supercritical carbon dioxide and ionic liquids. The results from these studies proved for obtaining high extraction efficiency of bioactive compounds. Therefore, the selection of effective solvent is a crucial step for preparation of bioactive compound-enriched extracts from plant materials.
Carrot root has been known as one of popular vegetables due to it is rich in carotenoids and anthocyanindins, which display potential biological properties, such as antioxidant and anticancer activities. Carrot has several varieties that vary in size, shape and colour, such as deep orange, purple, white, yellow and red [19]. Total carrot harvested area and production worldwide in 2013 were 1.20 million ha and 37.23 million tonnes, respectively [20]. Importantly, carrot peel is considered as a potential by-product/waste from the carrot processing industry (approximately 5.28 million tonnes per year), which has been mainly used for animal feed and fertilizer, or discarded into the landfills, leading to harmful effects on the environment. With this in mind, the study on the mass proportion of carrot root, phenolics, saponins and antioxidant capacity of carrot peel has not been reported. Therefore, this study aimed to determine the mass proportion of carrot root to indicate the potential of carrot peel, as well as evaluate the effects of various solvents on extraction efficiency of total phenolic content, saponin content and antioxidant capacity of the extracts from carrot peel to identify an optimal solvent for effective extraction of bioactive compounds from carrot peel for further applications in the functional food and/or pharmaceutical industries.

2. Materials and Methods

2.1. Plant Material

Carrot roots (Scarlet Nantes) were purchased from the post-harvest market in Westfield, Tuggerah, Central Coast, New South Wales, Australia (October 2014), and immediately transported to the laboratories at the University of Newcastle, Ourimbah Campus, New South Wales, and stored at −20 °C until used for further experiments.

2.2. Analytical Chemicals

All chemicals used were of analytical grade: 2,2’-Azino-bis-3-ethylbenzothiazoline-6-sulphonic acid (ABTS), 2,2-diphenyl-1-picryl-hydrazil (DPPH), Folin–Ciocalteu, trolox, neocuproine, 2,4,6-tripyridyl-s-triazine (TPTZ), iron (III) chloride and standard compounds include gallic acid, p-coumaric acid, caffeic acid, 5,7-dimethoxycoumarin, rutin, chlorogenic acid, (−)-epicatechin, (±)-naringenin, luteolin, apigenin, (−)-epigallocatechin gallate and β-sitosterol-β-D-glucoside were purchased from Sigma-Aldrich Pty Ltd. (Sydney, Australia). Sodium carbonate anhydrous was purchased from Chem-supply (Adelaide, Australia). Acetic acid was obtained from BDH Laboratory Supplies (Poole, England). Sulfuric acid and hydrochloric acid were purchased from Ajax Finechemicals (New South Wales, Australia). Vanillin, potassium persulfate, methanol, ethanol, hexane and acetonitrile were obtained from Merck (Darmstadt, Germany). Copper (II) chloride was purchased from Standard Laboratories (Victoria, Australia). Sodium acetate trihydrate was obtained from Government Stores Department (New South Wales, Australia). Ammonium acetate was purchased from BDH Chemicals (Victoria, Australia).

2.3. Determination of Mass Proportion of Carrot Root

A number of carrot roots were randomly selected to determine their total weight. Carrot roots were then cut into two separate heads, the peel was removed, and then the weight of individual parts was determined including body, heads and peel. Carrot peel was packaged in sealed polyamide bags and stored at −20 °C until used. Moisture of fresh carrot peel was determined based on the Association of Official Analytical Chemists (AOAC) official methods of analysis [21] using a hot-air oven (Anax Pty Ltd., New South Wales, Australia) at 90 °C overnight.

2.4. Preparation of Carrot Peel Extracts

In this study, four various solvents were selected to test their extraction efficiency including methanol, water, ethanol and hexane. The extracts of carrot peel were prepared based on previous method [22] with some modifications. Briefly, fresh carrot peel was ground into fine particles using an electric blender (Hamilton Beach Brands, Inc., Guangdong, China) and 15 g of fresh peel was then extracted with 150 mL of solvent (ratio of solvent to sample was 10:1 v/w) at room temperature (19 ± 1 °C) for 60 min using a shaking waterbath (Ratek Instruments Pty LTD., Victoria, Australia) at shaking speed of 5/10.
After extraction, the obtained extracts were filtered through qualitative No. 1 filter papers (Bacto Laboratories Pty Ltd., New South Wales, Australia) and adjusted to a final volume of 150 mL for further analysis. The extracts were then stored at −20 °C for 2 weeks. To determine the extraction yield, 2 mL of the extracts were dried in a hot-air oven (Anax Pty Ltd., New South Wales, Australia) at 100 °C for 4 h to constant weight. The extraction yield was determined in the following equation:
E Y = D E D S × 100
where EY (% by dry weight) is an extraction yield; DE (g) is the weight of dry extracts after extraction; and DS (g) is the weight of dry sample before extraction.

2.5. Determination of Bioactive Compounds of Carrot Peel

2.5.1. Total Phenolic Content (TPC)

TPC of the extracts was determined using the Folin–Ciocalteu method as previously described [17] with some modifications. Briefly, 0.5 mL of the extract was mixed with 2.5 mL of 10% (v/v) Folin–Ciocalteu reagent in distilled water and left for 6 min. In addition, 2 mL of 7.5% (w/v) Na2CO3 solution was then added to the mixture. After incubation in the dark at room temperature for 1 h, the absorbance was measured at 765 nm using a UV-VIS spectrophotometer (Cary 50 Bio; Varian, Inc., New South Wales, Australia). Various solvents and Gallic acid were used as the controls and standard, respectively. The TPC was expressed as mg Gallic acid equivalents (GAE)/g dry weight.

2.5.2. Saponin Content

Saponin content of the extracts was determined according to the method, as previously described [18]. Briefly, 0.5 mL of the extract was mixed with 0.5 mL of 8% (w/v) vanillin solution and 5 mL of 72% (v/v) H2SO4 solution. The mixture was incubated at 70 °C for 10 min and then rapidly cooled to room temperature using an ice water bath. The absorbance was measured at 560 nm using a UV-VIS spectrophotometer. Various solvents and Escin were used as the controls and standard, respectively. Saponin content was expressed as mg of Escin equivalents (EE)/g dry weight.

2.5.3. Identification of Individual Bioactive Compounds within Carrot Root Extractn

Individual bioactive compounds within carrot root extracts were identified using HPLC (Thermo Electron Corporation, Beverly, MA, USA) based on a previous method [17] with some minor modifications. Briefly, the extracts and standard solutions were filtered through 0.45 μm nylon membranes of 25 mm Phenex syringe filters and 20 μL was individually injected by an autosampler plus (Finnigan Surveyor, Thermo Electron Corporation, Beverly, MA, USA) onto a column (Synergi 4 μ Polar-RP 80A (250 × 4.6 mm, 4 μm), Torrance, CA, USA), which was maintained at 35 °C by an oven (Finnigan Surveyor). The mobile phase consisted of 0.2% orthophosphoric acid in distilled water (A) and 100% acetonitrile (B). Flow rate was set at 1 mL/min with the gradient as follows: 0–5 min, 0% B; 5–20 min, 20% B; 20–30 min, 30% B; 30–55 min, 30% B; and 55–65 min, 0% B. The bioactive compounds were detected at 200–600 nm using a photodiode array (PDA) plus detector (Finnigan Surveyor). Identification was achieved by comparing retention times (tR) of compounds in carrot peel extracts with those of standard compounds, which could be classified into the following groups: flavonoids (rutin, (±)-naringenin, myricetin, apigenin, (−)-epigallocatechin gallate), phenolic acids (gallic acid, p-coumaric acid, caffeic acid, protocatechuic acid, 5,7-dimethoxycoumarin), saponin (escin), β-sitosterol-β-d-glucoside, and ascorbic acid in terms of individual standards and mixture of the extract with each standard (1:1 v/v).

2.6. Determination of Antioxidant Capacity of Carrot Root

2.6.1. ABTS Radical Scavenging Capacity (ARSC)

ARSC of the extracts was determined using the ABTS assay as previously described [17] with some modifications. Briefly, a stock solution was prepared by mixing 7.4 mM ABTS and 2.6 mM K2S2O8 solutions (1:1 ratio), left in the dark at room temperature for 12 h, and then stored at −18 °C until required. Prior to use, a working solution was prepared by mixing 1 mL of stock solution with 60 mL of methanol to obtain an absorbance of 1.1 ± 0.02 at 734 nm. For the ABTS reaction, 0.15 mL of the extract was mixed with 2.85 mL of the working solution and incubated in the dark at room temperature for 2 h. The absorbance was measured at 734 nm using a UV-VIS spectrophotometer. Various solvents and Trolox were used as the controls and standard, respectively. The results were expressed as mg Trolox equivalents (TE)/g dry weight.

2.6.2. DPPH Radical Scavenging Capacity (DRSC)

DRSC of the extracts was measured based on the method as previously reported [17] with some modifications. Briefly, a stock solution of 0.024% (w/v) DPPH in methanol was prepared and stored at −18 °C. Before use, a working solution was prepared by diluting 1.0 mL of stock solution with 45 mL of methanol to obtain an absorbance of 1.1 ± 0.02 at 515 nm. For the DPPH reaction, 0.15 mL of the extract was mixed with 2.850 mL of the working solution and incubated in the dark at room temperature for 3 h. The absorbance was measured at 515 nm using a UV-VIS spectrophotometer. Various solvents and Trolox were used as the controls and standard, respectively. The results were expressed as mg Trolox equivalents (TE)/g dry weight.

2.6.3. Determination of Cupric Ion Reducing Antioxidant Capacity (CUPRAC)

CUPRAC of the extracts was analyzed using the methods as described by Nguyen et al. [18]. Briefly, 1.0 mL of 10 mM CuCl2 solution was mixed with 1.0 mL of 7.5 mM neocuproine and 1.0 mL of 7.7% (w/v) NH4Ac solutions. In addition, 1.1 mL of the extract was then added and incubated in the dark at room temperature for 1.5 h. The absorbance was measured at 450 nm using a UV-VIS spectrophotometer. Various solvents and Trolox were used as the controls and standard, respectively. The results were expressed as mg Trolox equivalents (TE)/g dry weight.

2.6.4. Determination of Ferric Reducing Antioxidant Power (FRAP)

FRAP of the extracts was determined based on the methods as previously reported [18]. Reagent A: 300 mM acetate buffer solution (3.1 g C2H3NaO2·3H2O and 16 mL C2H4O2 diluted to 1000 mL), pH 3.6; reagent B: 10 mM TPTZ solution in 40 mM HCl; and reagent C: 20 mM FeCl3·6H2O solution. Prior to use, the fresh FRAP solution was prepared by mixing reagents A, B and C at a ratio of 10:1:1. For the FRAP reaction, 0.15 mL of the extract was mixed with 2.850 mL of the fresh FRAP solution and incubated in the dark at room temperature for 30 min. The absorbance was read at 593 nm using a UV-VIS spectrophotometer. Various solvents and Trolox were used as the controls and standard, respectively. The results were expressed as mg Trolox equivalents (TE)/g dry weight.

2.7. Statistical Analysis

All experiments were performed in triplicate. The data were analyzed using SPSS software (Version 22.0, Chicago, IL, USA) and expressed as mean ± standard deviation (n = 3). Statistical comparisons were made using one-way ANOVA (analysis of variance) and Tukey HSD (honest significant difference) tests. Experiments were considered to be significantly different when p-values were below 0.05.

3. Results and Discussion

3.1. Mass Proportion of Carrot Root

The study results showed that carrot root consisted of three individual parts in terms of body, heads and peel, with their mass proportion accounted for 83.19%, 5.01% and 14.19% by fresh weight, respectively, indicating that carrot peel is a main residue (14.19 kg carrot peel could be obtained from 100 kg carrot root) from carrot processing industry, with an estimation about 5.28 million tonnes per year, which is considered as “waste” with high risks for the environment pollution when it is discarded directly to the landfills due to carrot peel is rich in organic compounds. Of these, carrot peel is a potential source for extraction of valuable bioactive compounds for further applications in the healthy food industry and other industries, such as medicines, cosmetics and pharmaceuticals.

3.2. Effect of Solvents on Extraction Yield and Bioactive Compounds of Carrot Peel

3.2.1. Extraction Yield

Moisture of fresh carrot peel was determined at 90.40%, indicating fresh carrot peel had a high water content, meaning that only 9.60 g dry carrot peel could be obtained from 100 g fresh carrot peel for further utilization. Table 1 shows that, among four solvents tested, methanol obtained the highest extraction yield (5.18% by fresh weight, or 54.02% by dry weight) when compared to those extracted by ethanol, water and hexane (4.48%, 4.46% and 4.13% by fresh weight, or 46.67%, 46.53% and 43.04% by dry weight). However, no significant difference (p < 0.05) in the extraction yields were observed between ethanol and water extracts. The differences on extraction yields among various solvents may be due to differences of protic solvent character on diffusivity and solubility of solutes in solvent during extraction, which decided to extraction yield of carrot peel. Previous study [18] found that extraction yield of P. trimera root gained by water and methanol (11.48% and 11.04% by dry weight, respectively) were significantly higher than those obtained by acetonitrile, ethyl acetate and hexane (2.31%, 2.32% and 2.08% by dry weight, respectively), while the study of Rahman et al. [23] demonstrated that phytochemicals and antioxidant potential of C. asiatica were affected by extraction solvent polarity in terms of 100% ethanol, 50% ethanol and water. In comparison with other materials, extraction yield of carrot peel was much higher than that of papaya leaf (19.15% by dry weight), as previously reported by Vuong et al. [24], while the study of Chisté et al. [25] found that the yield of solid extract from C. villosum fruit pulps obtained the highest level by mix of ethanol and ethyl acetate (1:1 v/v; 46.4% by dry weight), followed by ethyl acetate, water, ethanol and least by 50% ethanol (41.9%, 14.7%, 11.1% and 10.8% by dry weight, respectively). These results indicated that the extraction yield of carrot peel was greatly affected by solvents, of which methanol was the most effective solvent for extraction of solutes from carrot peel.

3.2.2. Total Phenolic Content

Phenolic compounds have direct links to their antioxidant and anticancer capacities [14,17,26]. Figure 1A indicates, that among four solvents tested, the highest TPC of carrot peel obtained by methanol (9.02 mg GAE/g dry weight), and it was significantly higher (p < 0.05) than those extracted by ethanol, water and hexane (6.96, 5.15 and 1.04 mg GAE/g dry weight, respectively). These findings are supported by previous study [27], which indicated that the methanolic extracts of Phyllanthus species possessed higher TPC levels (50.12 to 68.70 mg GAE/g dry weight) than water extracts (41.19 to 55.38 mg GAE/g dry weight), while the study of Sen and Batra [28] also reported that TPC of plant P. amarus was gradually reduced from methanol to ethanol and then petroleum ether (212.67, 208.09 and 203.54 mg/100 g dry weight, respectively). These data revealed that extraction efficiency of methanol relates to its intermediate polarity that allowed it to solvate low molecular weight organic compounds possessing protonatable functional groups, such as –COOH and –OH [18]. The study of Vuong et al. [24] reported that TPC of papaya leaf extracted by various solvents was decreased in order of water, methanol, acetone and ethanol (23.06, 15.03, 10.71 and 9.43 mg GAE/g dry weight, respectively). Previous study of Shahriar et al. [29] found that TPC of W. somnifera root was decreased in order by chloroform, petroleum ether, methanol, ethanol and n-hexane (60.99, 56.58, 23.86, 5.46 and 1.43 mg GAE/g dry weight, respectively). To compare with other plants, TPC of carrot peel was much higher than that of Sage plants [30] (approximately 2.3 mg GAE/g dry weight), but it was lower than those of Oolong tea [22] and papaya leaf [24] (13.58 and 15.03 mg GAE/g dry weight, respectively), and being much lower than those of P. amarus/urinaria/niruri [27] (50.24, 62.56 and 68.70 mg GAE/g dry weight, respectively). These results showed that the extractability of TPC from carrot peel was greatly affected by solvent character, and methanol was the most effective solvent for extraction of TPC from carrot peel.

3.2.3. Saponin Content

Saponins consist of many valuable phytochemicals, such as triterpenes, lupeol, triterpene glycosides, sterols, glycyrrhizic acid and triterpene scaffolds, which directly link to their biological properties like antiviral, antimicrobial, antioxidative, anti-hyperglycaemic, hepatoprotective, cardioprotective, anti-herbivore, anti-diarrhoeal, anti-HIV, anti-tumor, anti-hepatitis, anti-inflammatory and anti-cancer activities [31,32,33]. Figure 1B illustrates the highest saponin content of carrot peel obtained by water (272.9 mg EE/g dry weight), followed by methanol (229.5 mg EE/g dry weight), and both were significantly higher than those gained by ethanol and hexane (194.0 and 39.9 mg EE/g dry weight, respectively; p < 0.05), indicating the extractability of saponins from carrot peel greatly varied depending on polarity of solvents (9.0, 5.2, 5.1 and 0.0 for water, ethanol, methanol and hexane, respectively). The study of Vuong et al. [24] reported that saponin content of Carica papaya leaf was extracted by various solvents reduced in order of ethanol, methanol, acetone and water (82.88, 49.14, 31.75 and 26.36 mg EE/g dry weight, respectively), while the study of Patel et al. [34] also found that P. amarus contained high levels of saponins and tannins (24.05% and 17.50%, respectively) but low content of cyanogenic glycosides (1.46%). These results proved that carrot peel is a rich source of saponins, and solvents significantly affected saponin yield from carrot peel. Of those, it is interesting to use water as a cheap, non-toxic and safe solvent for extraction of saponins from carrot peel for potential applications in the healthy food and/or pharmaceutical industries.

3.2.4. Individual Bioactive Compounds within Carrot Root

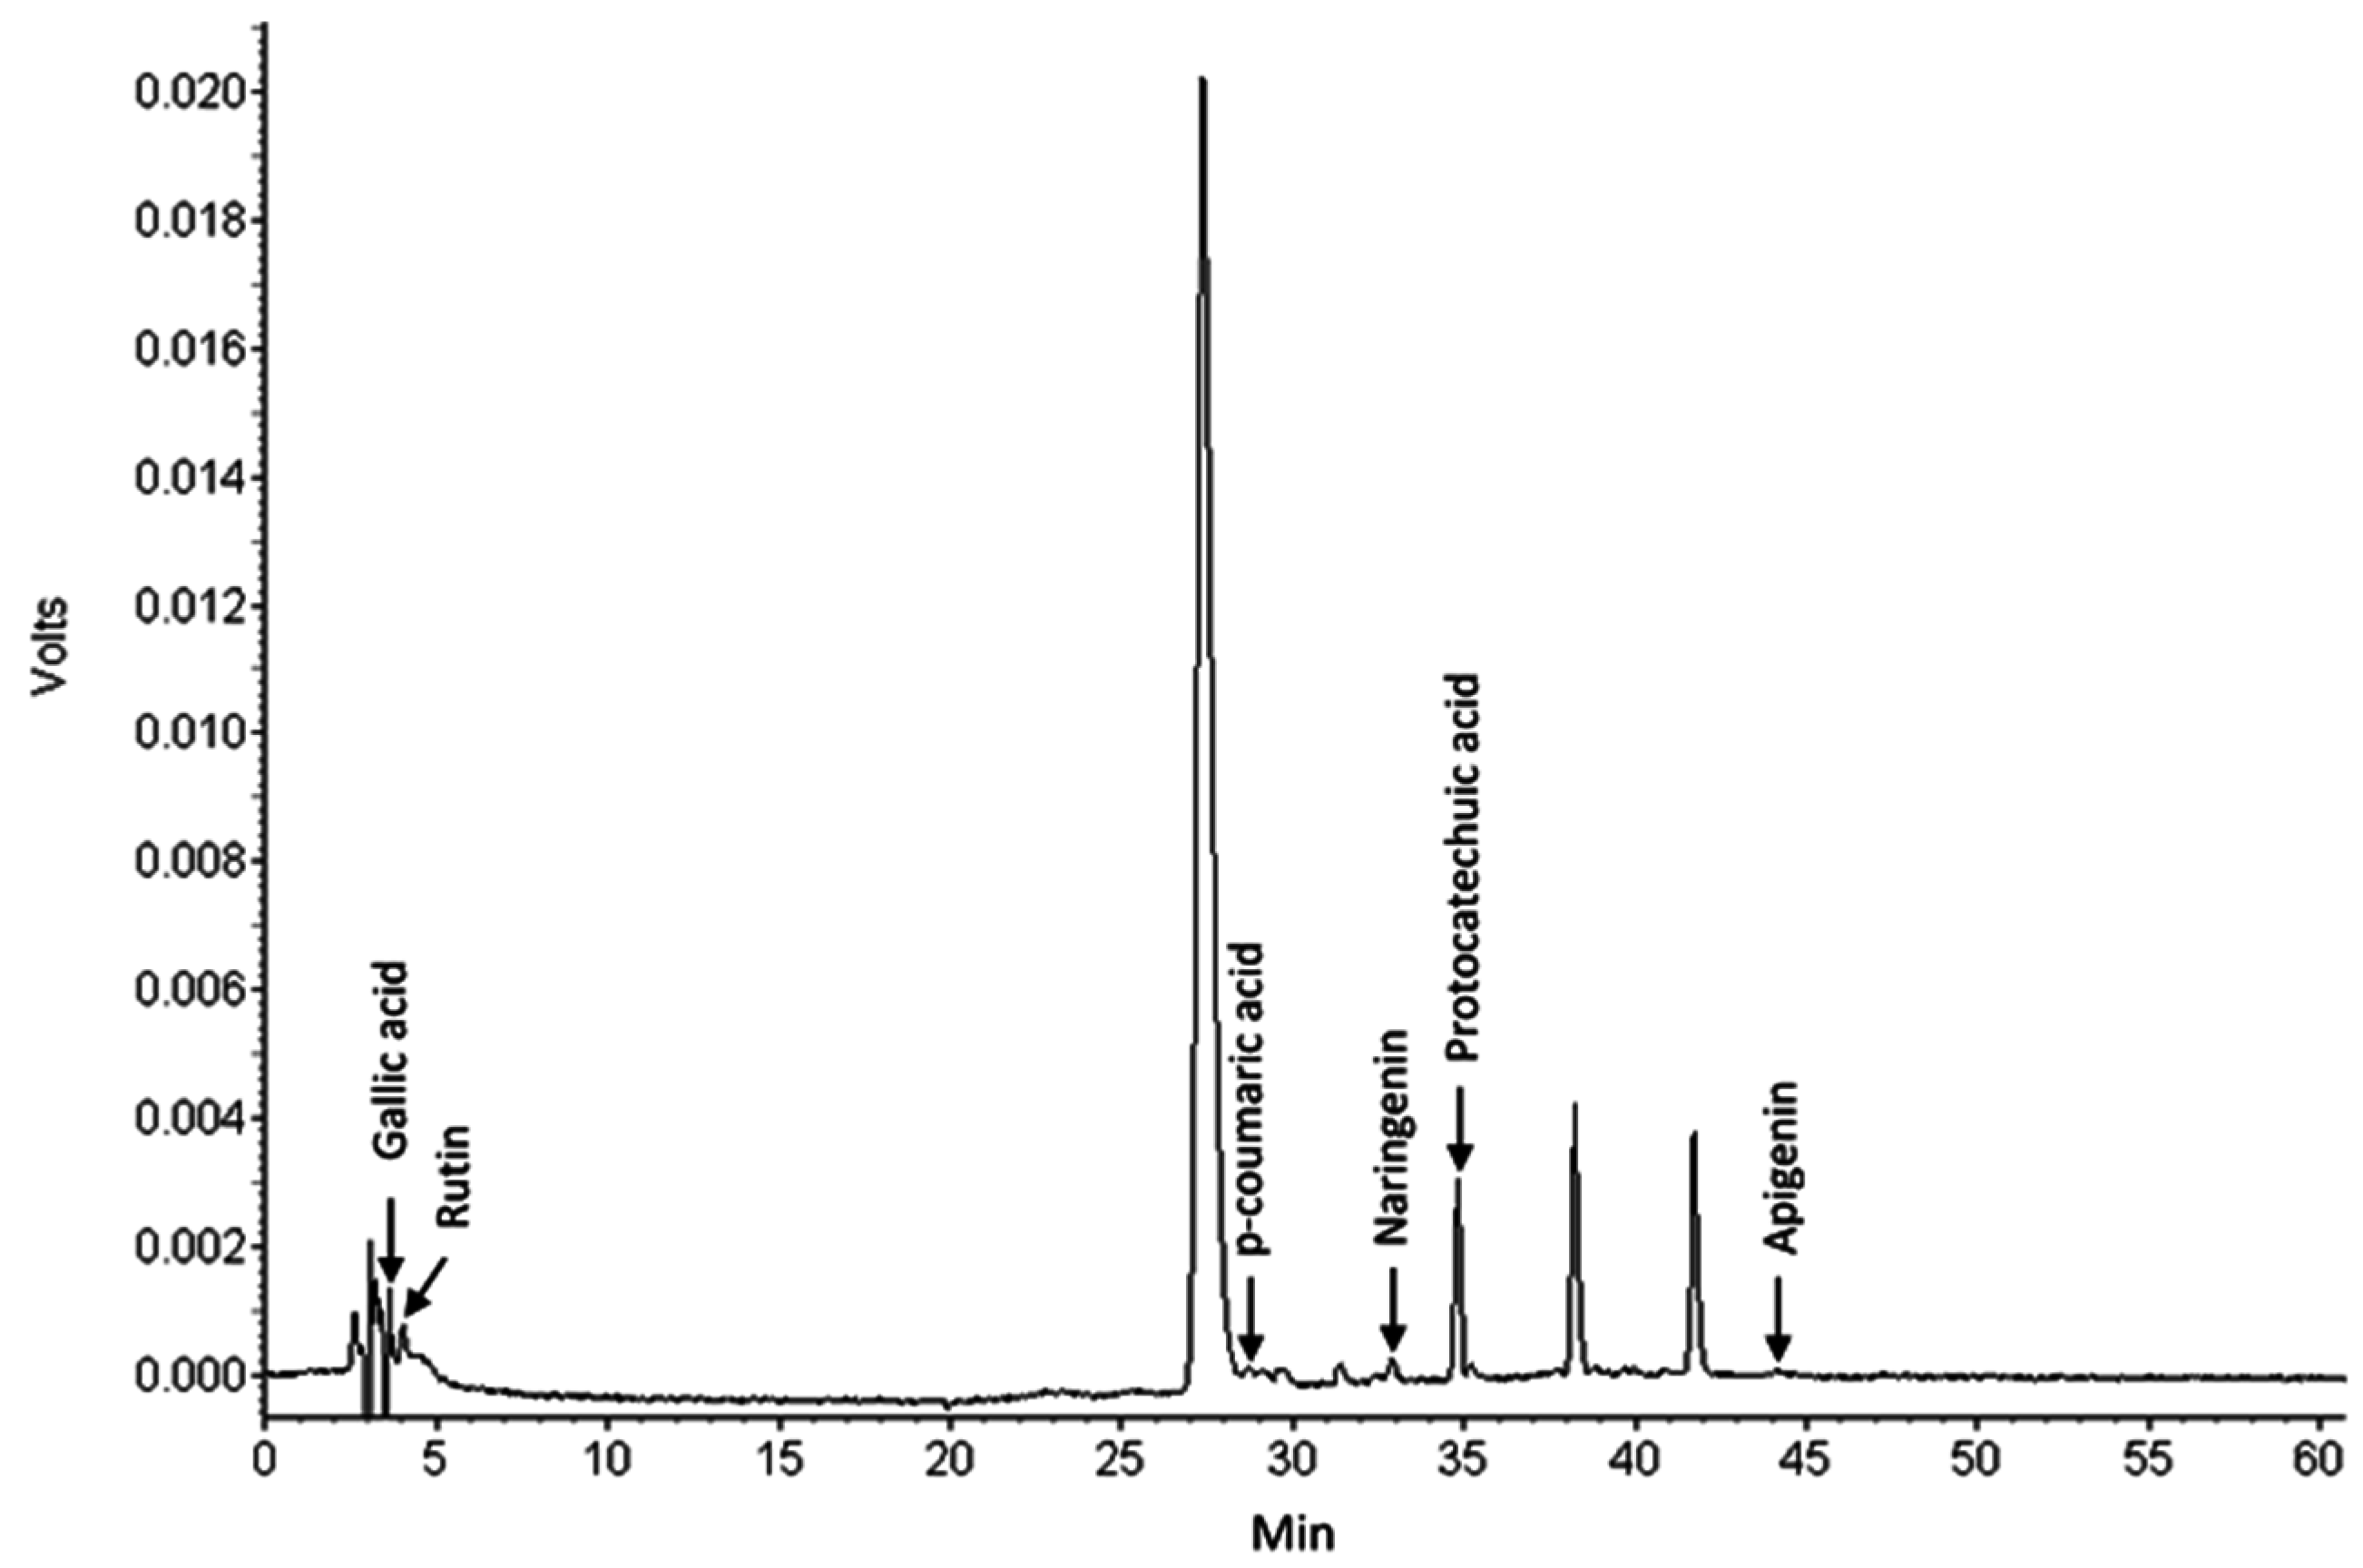
HPLC analysis indicated that three bioactive compounds were identified in the methanolic extract from carrot peel in order of retention time, including (1) gallic acid, (2) rutin, (3) p-coumaric acid, (4) (±)-naringenin, (5) protocatechuic acid, and (6) apigenin (Figure 2). However, some major compounds in carrot peel extract have not yet been identified in this study. Thus, they are required to identify, quantify, isolate and purify in further studies. Eleven bioactive compounds in the methanolic extract from P. trimera root were identified, including five phenolic acids (gallic acid, chlorogenic acid, caffeic acid, syringic acid and p-coumaric acid) and six flavonoids ((+)-catechin, (−)-epicatechin, rutin, myricetin, quercetin and kaempferol) [18]. Another study of Nguyen et al. [17] also identified twelve bioactive compounds in the ethanolic extract from P. amarus, comprising six phenolic acids (gallic acid, chlorogenic acid, caffeic acid, syringic acid, p-coumaric acid and 5,7-dimethoxycoumarin), five flavonoids ((−)-epicatechin, (−)-epigallocatechin gallate, rutin, luteolin and myricetin) and one sterol (β-sitosterol). These results illustrated that the plants are rich sources of phenolic acids and flavonoids that greatly contributed to their potential antioxidant capacity.

3.3. Effect of Solvents on Antioxidant Capacity of Carrot Peel

3.3.1. ABTS Radical Scavenging Capacity (ARSC)

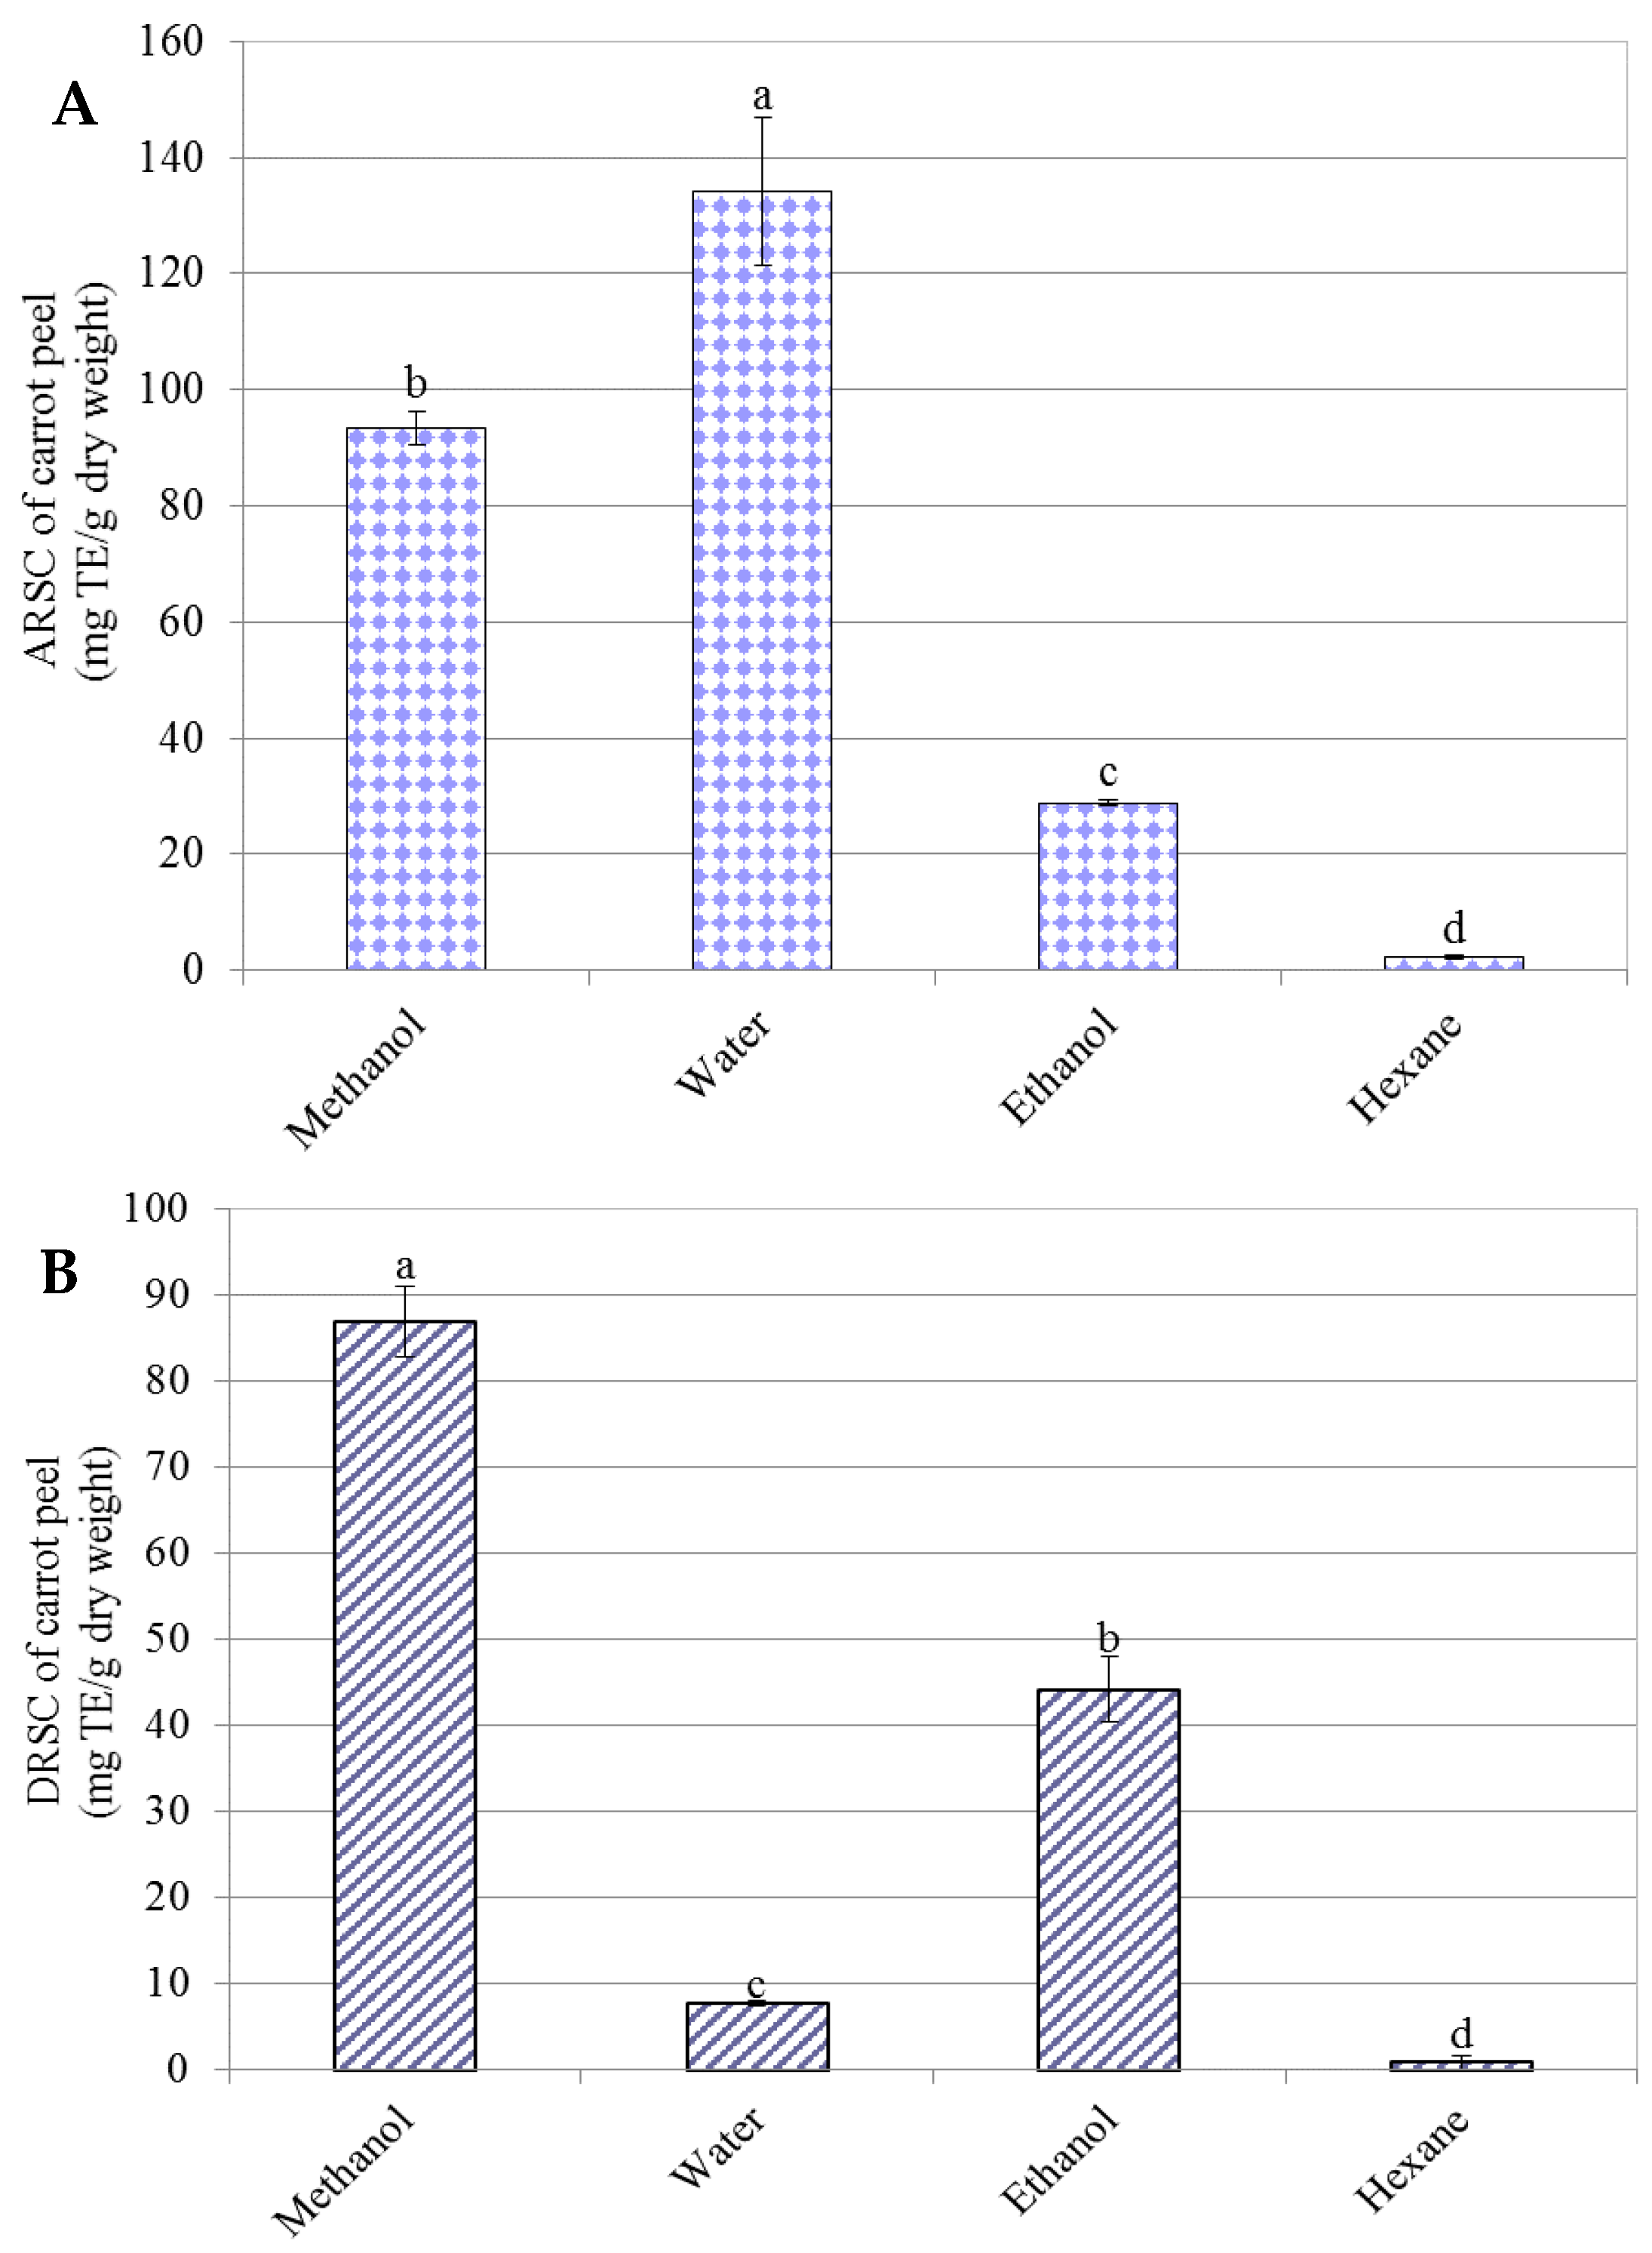
Figure 3A shows ARSC of carrot peel extracted by four various solvents, in which the highest ARSC obtained from water extract (134.11 mg TE/g dry weight), and it was significant higher (p < 0.05) than those extracted by methanol, ethanol and hexane (93.40, 28.88 and 2.23 mg TE/g dry weight, respectively), implying that ARSC of carrot peel was significantly influenced by polarity of solvents (9.0, 5.2, 5.1 and 0.0 for water, ethanol, methanol and hexane, respectively). Table 2 illustrates a strong correlation between saponins of carrot peel and ARSC (R2 = 0.78), while TPC of carrot peel weakly correlated with ARSC (R2 = 0.25), meaning that saponins were a major contributor to ARSC of carrot peel, which might promote single electron transfer capacity for ABTS free radical to form an electron pair [17]. The study of Dhanani et al. [35] indicated that the ethanolic extract of W. somnifera possessed the highest ARSC in comparison with the extracts obtained by 10% ethanol and water, while the study of Kamonwannasit et al. [36] found that the water extract of A. crassna leaves substantially exhibited the ARSC (IC50 = 218.93 μg/mL) when compared to butylated hydroxytoluene (BHT; IC50 = 83.09 μg/mL). These results showed that solvents significantly affected ARSC of carrot peel, in which water was the best solvent for obtaining the optimal ARSC from carrot peel.

3.3.2. DPPH Radical Scavenging Capacity

DRSC of carrot peel obtained the highest level by methanol (87.00 mg TE/g dry weight), followed by ethanol, water and lowest level by hexane (44.23, 7.72 and 0.91 mg TE/g dry weight, respectively; p < 0.05; Figure 3B), revealing that DRSC of carrot peel directly related to intermediate polarity of methanol and ethanol, which allowed them to solvate low molecular weight organic compounds possessing protonatable functional groups [18]. Table 2 indicates that DRSC greatly correlated to TPC of carrot peel (R2 = 0.79), whereas the weak correlation was found between saponins of carrot peel and DRSC (R2 = 0.17), meaning that TPC of carrot peel mainly contributed to DRSC, which increased single electron transfer capacity for DPPH free radical to form an electron pair. These results are similar to a previous report [37], which showed that DRSC of various extracts of I. griffithii seeds reduced in the order of methanol, ethyl acetate and hexane, while another study of Sen and Batra [28] also found that DRSC of P. amarus Schum. and Thonn. extracts decreased in the order of methanol, ethanol and petroleum ether.
In comparison between the extracts of W. somnifera root using different solvents with ascorbic acid and BHT, the study of Shahriar et al. [29] indicated that the extracts obtained by chloroform, petroleum ether and methanol possessed the greatest DRSC. In contrast, the extracts gained by ethanol and n-hexane had the lowest DRSC. The research of Maity et al. [38] found that DRSC of P. amarus root extracts reduced in order of ethyl acetate, water, 70% ethanol and petroleum ether, with IC50 values being 18.43, 29.52, 35.48 and 96.05 μg/mL, respectively. Therefore, DRSC of carrot peel strongly depended on solvent character, and methanol showed itself to be the most effective solvent in retaining the highest DRSC from carrot peel.

3.3.3. Cupric Ion Reducing Antioxidant Capacity

Figure 4A indicates that CUPRAC of carrot peel were significantly different among four solvents tested (15.31, 8.88, 4.82 and 0.31 mg TE/g dry weight for methanol, ethanol, water and hexane, respectively; p < 0.05), in which the greatest CUPRAC was obtained by methanol, whereas the lowest CUPRAC was observed from the hexane extract. This data revealed that CUPRAC of carrot peel was directly affected by intermediate polarity of methanol and ethanol that allowed them to solvate low molecular weight organic compounds with protonatable functional groups [18]. Table 2 shows that a strong positive correlation was found between TPC of carrot peel and CUPRAC (R2 = 0.93), while a weak correlation was seen between saponins of carrot peel and CUPRAC (R2 = 0.36), implying that TPC of carrot peel was a great contributor to CUPRAC, which raised cupric ion reducing capacity for carrot peel. A previous study of Vuong et al. [24] indicated that CUPRAC of Carica papaya leaf extracts varied on various solvents in the order of water, methanol, acetone and ethanol (166.66, 158.91, 133.18 and 122.47 µg TE/g dry weight, respectively), while the research of Shahriar et al. [29] reported that, among the extracts of W. somnifera root, chloroform extract had maximum CUPRAC, and it was comparable to ascorbic acid, butylated hydroxyanisole (BHA) and BHT, followed by petroleum ether, methanol, ethanol and n-hexane. These results indicated that solvents greatly affected the CUPRAC of carrot peel, of which methanol was the most effective solvent in retaining the greatest CUPRAC from carrot peel.

3.3.4. Ferric Reducing Antioxidant Power

The methanolic extract of carrot peel possessed the highest FRAP (40.50 mg TE/g dry weight), followed by ethanol, water and hexane (27.67, 20.113 and 8.41 mg TE/g dry weight, respectively; Figure 4B). These results implied that the intermediate polarity of methanol and ethanol significantly influenced FRAP of carrot peel. Table 2 indicates that the greatest correlation was observed between TPC of carrot peel and FRAP (R2 = 0.96), but the correlation between saponins of carrot peel and FRAP was only at a medium level (R2 = 0.46), indicating that TPC of carrot peel greatly contributed to FRAP, which increased ferric reduction ability for carrot peel. The study of Vijayakumar et al. [37] reported that the methanolic extract of I. griffithii seeds possessed the highest FRAP (0.297 mM Fe(II)/g) as compared to ethyl acetate and hexane extracts (0.142 and 0.108 mM Fe(II)/g, respectively), but they were much lower than those of standards BHT and ascorbic acid at 300 μg/mL (2.312 and 2.270 mM Fe(II)/g, respectively). Of these, solvents greatly affected FRAP of carrot peel, and methanol was found to be the best solvent for obtaining the highest level of FRAP from carrot peel.

4. Conclusions

The results from this study showed that solvent character greatly affected extractability of bioactive compounds and antioxidant capacity of carrot peel. In this instance, methanol and water were the most effective solvents for obtaining the highest yields of phenolics and saponins, as well as the greatest antioxidant capacity from carrot peel, respectively. This is of great interest in the preparation of the extracts for potential applications in food industry and/or pharmaceutical industries.

Acknowledgments

The authors would like to thank the School of Environmental and Life Sciences, Faculty of Science and Information Technology, University of Newcastle, Australia.

Author Contributions

Van Tang Nguyen conceived and designed the experiments, performed the experiments, analyzed the data, and wrote the paper. Christopher J. Scarlett reviewed the paper. Van Tang Nguyen revised the paper.

Conflicts of Interest

The authors declare no conflict of interest.

References

  1. Naumovski, N. Bioactive composition of plants and plant foods. In Plant Bioactive Compounds for Pancreatic Cancer Prevention and Treatment; Scarlett, C.J., Vuong, Q.V., Eds.; Nova Science Publishers: New York, NY, USA, 2014; pp. 81–115. [Google Scholar]
  2. Apak, R.; Gorinstein, S.; Böhm, V.; Schaich, K.M.; Özyürek, M.; Güçlü, K. Methods of measurement and evaluation of natural antioxidant capacity/activity (IUPAC technical report). Pure Appl. Chem. 2013, 85, 957–998. [Google Scholar] [CrossRef]
  3. Nguyen, V.T.; Pham, N.M.Q.; Vuong, Q.V.; Bowyer, M.C.; van Altena, I.A.; Scarlett, C.J. Phytochemical retention and antioxidant capacity of xao tam phan (Paramignya trimera) root as prepared by different drying methods. Dry. Technol. Int. J. 2016, 34, 324–334. [Google Scholar] [CrossRef]
  4. Nguyen, V.T.; Pham, H.N.T.; Bowyer, M.C.; van Altena, I.A.; Scarlett, C.J. Influence of solvents and novel extraction methods on bioactive compounds and antioxidant capacity of Phyllanthus amarus. Chem. Pap. 2016, 70, 556–566. [Google Scholar] [CrossRef]
  5. Arlorio, M.; Coïsson, J.D.; Travaglia, F.; Varsaldi, F.; Miglio, G.; Lombardi, G.; Martelli, A. Antioxidant and biological activity of phenolic pigments from Theobroma cacao hulls extracted with supercritical CO2. Food Res. Int. 2005, 38, 1009–1014. [Google Scholar] [CrossRef]
  6. Balasundram, N.; Sundram, K.; Samman, S. Phenolic compounds in plants and agri-industrial by-products: Antioxidant activity, occurrence, and potential uses. Food Chem. 2006, 99, 191–203. [Google Scholar] [CrossRef]
  7. Bhakyaraj, R.; Singaravadive, K. Minerals and bioactive compounds in cashew apple (Anacardium occidentale L.). J. Food Res. Sci. 2012, 1, 32–36. [Google Scholar]
  8. Bai, X.L.; Yue, T.L.; Yuan, Y.H.; Zhang, H.W. Optimization of microwave-assisted extraction of polyphenols from apple pomace using response surface methodology and HPLC analysis. J. Sep. Sci. 2010, 33, 3751–3758. [Google Scholar] [CrossRef] [PubMed]
  9. Acevedo, F.; Rubilar, M.; Scheuermann, E.; Cancino, B.; Uquiche, E.; Garcés, M.; Inostroza, K.; Shene, C. Bioactive compounds of spent coffee grounds, a coffee industrial residue. In Proceedings of the Symposium on Agricultural and Agroindustrial Waste Management (III Siger), Sao Pedro, Brazil, 12–14 March 2013; pp. 1–4.
  10. Atindana, J.N.; Zhong, F.; Mothibe, K.J.; Bangoura, M.L.; Lagnika, C. Quantification of total polyphenolic content and antimicrobial activity of cocoa (Theobroma cacao L.) bean shells. Pak. J. Nutr. 2012, 11, 574–579. [Google Scholar]
  11. Baiano, A. Recovery of biomolecules from food wastes—A review. Molecules 2014, 19, 14821–14842. [Google Scholar] [CrossRef] [PubMed]
  12. Barba, F.J.; Zhu, Z.; Koubaa, M.; de Souza Sant’Ana, A.; Orlien, V. Green alternative methods for the extraction of antioxidant bioactive compounds from winery wastes and by-products: A review. Trends Food Sci. Technol. 2016, 49, 96–109. [Google Scholar] [CrossRef]
  13. Kalia, K.; Sharma, K.; Singh, H.P.; Singh, B. Effects of extraction methods on phenolic contents and antioxidant activity in aerial parts of Potentilla atrosanguinea Lodd. and quantification of its phenolic constituents by RP-HPLC. J. Agric. Food Chem. 2008, 56, 10129–10134. [Google Scholar] [CrossRef] [PubMed]
  14. Dai, J.; Mumper, R.J. Plant phenolics: Extraction, analysis and their antioxidant and anticancer properties. Molecules 2010, 15, 7313–7352. [Google Scholar] [CrossRef] [PubMed]
  15. Azmir, J.; Zaidul, I.S.M.; Rahman, M.M.; Sharif, K.M.; Mohamed, A.; Sahena, F.; Jahurul, M.H.A.; Ghafoor, K.; Norulaini, N.A.N.; Omar, A.K.M. Techniques for extraction of bioactive compounds from plant materials: A review. J. Food Eng. 2013, 117, 426–436. [Google Scholar] [CrossRef]
  16. Nguyen, V.T. Mass proportion, proximate composition and effects of solvents and extraction parameters on pigment yield from cacao pod shell (Theobroma cacao L.). J. Food Process. Preserv. 2014, 39, 1414–1420. [Google Scholar] [CrossRef]
  17. Nguyen, V.T.; Vuong, Q.V.; Bowyer, M.C.; van Altena, I.A.; Scarlett, C.J. Effects of different drying methods on bioactive compound yield and antioxidant capacity of Phyllanthus amarus. Dry. Technol. Int. J. 2015, 33, 1006–1017. [Google Scholar] [CrossRef]
  18. Nguyen, V.T.; Bowyer, M.C.; Vuong, Q.V.; van Altena, I.A.; Scarlett, C.J. Phytochemicals and antioxidant capacity of xao tam phan (Paramignya trimera) root as affected by various solvents and extraction methods. Ind. Crops Prod. 2015, 67, 192–200. [Google Scholar] [CrossRef]
  19. Kamiloglu, S.; Capanoglu, E.; Bilen, F.D.; Gonzales, G.B.; Grootaert, C.; Van de Wiele, T.; Van Camp, J. Bioaccessibility of polyphenols from plant-processing byproducts of black carrot (Daucus carota L.). J. Agric. Food Chem. 2015, 64, 2450–2458. [Google Scholar] [CrossRef] [PubMed]
  20. Food and Agriculture Organization Statistics (FAOSTAT). FAO Statistic Division; Food and Agriculture Organization of the United Nations: Rome, Italy, 2015; Available online: http://faostat3.fao.org/home/E (accessed on 10 August 2016).
  21. AOAC. Official Methods of Analysis, 16th ed.; Assoc. Official Anal. Chemists: Washington, DC, USA, 1998. [Google Scholar]
  22. Nguyen, V.T.; Ueng, J.P.; Tsai, G.J. Proximate composition, total phenolic content, and antioxidant activity of seagrape (Caulerpa lentillifera). J. Food Sci. 2011, 76, C950–C958. [Google Scholar] [CrossRef] [PubMed]
  23. Rahman, M.; Hossain, S.; Rahaman, A.; Fatima, N.; Nahar, T.; Uddin, B.; Basunia, M.A. Antioxidant activity of Centella asiatica (Linn.) urban: Impact of extraction solvent polarity. J. Pharmacol. Phytochem. 2013, 1, 27–32. [Google Scholar]
  24. Vuong, Q.V.; Hirun, S.; Roach, P.D.; Bowyer, M.C.; Phillips, P.A.; Scarlett, C.J. Effect of extraction conditions on total phenolic compounds and antioxidant activities of Carica papaya leaf aqueous extracts. J. Herb. Med. 2013, 3, 104–111. [Google Scholar] [CrossRef]
  25. Chisté, R.C.; Benassi, M.D.T.; Mercadante, A.Z. Efficiency of different solvents on the extraction of bioactive compounds from the Amazonian fruit Caryocar villosum and the effect on its antioxidant and colour properties. Phytochem. Anal. 2014, 25, 364–372. [Google Scholar] [CrossRef]
  26. Khoddami, A.; Wilkes, M.A.; Roberts, T.H. Techniques for analysis of plant phenolic compounds. Molecules 2013, 18, 2328–2375. [Google Scholar] [CrossRef] [PubMed]
  27. Poh-Hwa, T.; Yoke-Kqueen, C.; Indu Bala, J.; Son, R. Bioprotective properties of three Malaysia Phyllanthus species: An investigation of the antioxidant and antimicrobial activities. Int. Food Res. J. 2011, 18, 887–893. [Google Scholar]
  28. Sen, A.; Batra, A. The study of in vitro and in vivo antioxidant activity and total phenolic content of Phyllanthus amarus Schum. & Thonn.: A medicinally important plant. Int. J. Pharm. Pharm. Sci. 2013, 5, 942–947. [Google Scholar]
  29. Shahriar, M.; Hossain, M.I.; Sharmin, F.A.; Akhter, S.; Haque, M.A.; Bhuiyan, M.A. In vitro antioxidant and free radical scavenging activity of Withania somnifera root. Iosr J. Pharm. 2013, 3, 38–47. [Google Scholar]
  30. Ibtissem, H.S.; Fatma, Z.R.; Iness, B.R.; Soumaya, B.; Ferid, L.; Brahim, M. Total phenolics, flavonoids, and antioxidant activity of Sage (Salvia officinalis L.) plants as affected by different drying methods. Food Bioprocess Technol. 2013, 6, 806–817. [Google Scholar]
  31. Osbourn, A.; Goss, R.J.M.; Field, R.A. The saponins—Polar isoprenoids with important and diverse biological activities. Nat. Prod. Rep. 2011, 28, 1261–1268. [Google Scholar] [CrossRef] [PubMed]
  32. Tiwari, P.; Kumar, B.; Kaur, M.; Kaur, G.; Kaur, H. Phytochemical screening and extraction: A review. Int. Pharm. Sci. 2011, 1, 98–106. [Google Scholar]
  33. Doughari, J.H. Phytochemicals—A global perspective of their role in nutrition and health. In Phytochemicals: Extraction Methods, Basic Structures and Mode of Action as Potential Chemotherapeutic Agents; Rao, V., Ed.; InTech: Rijeka, Croatia, 2012; pp. 1–32. [Google Scholar]
  34. Patel, J.R.; Tripathib, P.; Sharmaa, V.; Chauhana, N.S.; Dixit, V.K. Phyllanthus amarus: Ethnomedicinal uses, phytochemistry and pharmacology: A review. J. Ethnopharmarcol. 2011, 138, 286–313. [Google Scholar] [CrossRef] [PubMed]
  35. Dhanani, T.; Shah, S.; Gajbhiye, N.A.; Kumar, S. Effect of extraction methods on yield, phytochemical constituents and antioxidant activity of Withania somnifera. Arab. J. Chem. 2013. [Google Scholar] [CrossRef]
  36. Kamonwannasit, S.; Nantapong, N.; Kumkrai, P.; Luecha, P.; Kupittayanant, S.; Chudapongse, N. Antibacterial activity of Aquilaria crassna leaf extract against Staphylococcus epidermidis by disruption of cell wall. Ann. Clin. Microbiol. Antimicrob. 2013, 12. [Google Scholar] [CrossRef] [PubMed]
  37. Vijayakumar, A.; Kumar, P.P.; Jeyaraj, B. Antioxidant activity of Illicium griffithi Hook. f. & Thoms seeds—In vitro. Asian J. Pharm. Clin. Res. 2013, 6, 269–273. [Google Scholar]
  38. Maity, S.; Chatterjee, S.; Variyar, P.S.; Sharma, A.; Adhikari, S.; Mazumder, S. Evaluation of antioxidant activity and characterization of phenolic constituents of Phyllanthus amarus root. J. Agric. Food Chem. 2013, 61, 3443–3450. [Google Scholar] [CrossRef] [PubMed]
Figure 1. Total phenolic content (A) and saponin content and (B) of carrot peel extracted by four various solvents. Means and standard deviations were of triplicate. Different letters (a,b,c,d) within the columns denotes a significant difference between treatments (p < 0.05).
Technologies 04 00036 g001
Figure 2. HPLC chromatogram of the methanolic extract from carrot peel.
Technologies 04 00036 g002
Figure 3. Antioxidant capacity of carrot peel extracted by four various solvents: (A) ABTS radical scavenging capacity and (B) DPPH radical scavenging capacity. Means and standard deviations were of triplicate. Different letters (a,b,c,d) within the columns denotes a significant difference between treatments (p < 0.05).
Technologies 04 00036 g003
Figure 4. Antioxidant capacity of carrot peel extracted by four various solvents: (A) cupric ion reducing antioxidant capacity and (B) ferric reducing antioxidant power. Means and standard deviations were of triplicate. Different letters (a,b,c,d) within the columns denotes a significant difference between treatments (p < 0.05).
Technologies 04 00036 g004
Table 1. Extraction yield of carrot peel extracted by four various solvents.
SolventExtraction Yield
% by fresh weight% by dry weight
Water4.46 ± 0.51 ab46.53 ± 5.29 ab
Ethanol4.48 ± 0.48 ab46.67 ± 5.02 ab
Methanol5.18 ± 0.56 a*54.02 ± 5.81 a
Hexane4.13 ± 0.37 b43.04 ± 3.85 b
* Means and standard deviations were of triplicate. Different letters (a,b) in the same column were significantly different (p < 0.05).
Table 2. Correlations between bioactive compounds and antioxidant capacity of carrot peel extracted by four various solvents.
Correlations * (R2)ARSCDRSCCUPRACFRAP
TPC0.250.790.930.96
Saponins0.780.170.360.43
* Based on values obtained from four various solvents. ARSC: ABTS radical scavenging capacity; DRSC: DPPH radical scavenging capacity; CUPRAC: Cupric ion reducing antioxidant capacity; FRAP: Ferric reducing antioxidant power; TPC: Total phenolic content.