Abstract
We have developed and built a highly accurate laser strainmeter for geophysical observations. It features the precise length measurement of a 100-m optical cavity with reference to a stable quantum standard. Unlike conventional laser strainmeters based on simple Michelson interferometers that require uninterrupted fringe counting to track the evolution of ground deformations, this instrument is able to determine the absolute length of a cavity at any given time. The instrument offers advantage in covering a variety of geophysical events, ranging from instantaneous earthquakes to crustal deformations associated with tectonic strain changes that persist over time. An automatic alignment control and an autonomous relocking system have been developed to realize stable performance and maximize observation times. It was installed in a deep underground site at the Kamioka mine in Japan, and an effective resolution of 2 × (10−8 − 10−7) m was achieved. The regular tidal deformations and co-seismic strain changes were in good agreement with those from a theoretical model and a co-located conventional laser strainmeter. Only the new instrument was able to record large strain steps caused by a nearby large earthquake because of its capability of absolute length determination.
1. Introduction
Numerous geophysical events invoke ground deformations at various spatial and temporal scales. For instance, earthquakes originate from instant fault slips, while tides and tectonic strain changes cause continuous deformations over longer periods of time. A few different types of strainmeters are used for such geophysical applications, including instruments that utilize a quartz tube for reference [1,2]. The combination of a laser interferometer and quantum standard is the most advanced metrological technique, because of its sensitivity and reliability. However, partly because of the very high sensitivity, some technical difficulties exist in standard Michelson laser interferometers. These include fringe counting errors, which occur because of rapid and large changes in crustal deformations that exceed instrument capability. Since this type of interferometer detects relative changes in distance, if fringe tracking fails, continuities in data will be lost.
To overcome this problem and realize robust observations, we have designed and constructed an absolute distance meter (ADM). The ADM is a laser interferometer that can determine the “absolute” distance between two points fixed to the ground accurately [3]. Because of this feature, even if an observation is interrupted, the instrument is able to produce continuous data after it resumes. The ADM was located in an underground site at the Kamioka mine (N 36.4° E 137.3°; elevation: 360 m), which also accommodates several scientific observatories for cosmic ray research (Super Kamiokande and KamLand [4,5]), gravitational wave detectors (CLIO and KAGRA (under construction) [6,7]) and geophysical surveys (e.g., [8]). Another laser strainmeter (LSM) based on the Michelson interferometer was installed along with the ADM, and they share the same infrastructure [9]. These instruments, including the ADM and LSM, are located at the deep underground site to take advantage of the stable and low noise environment.
The ADM consists of a 100-m Fabry–Pérot cavity and can determine its length by applying a double modulation technique to the laser beam. The absolute length is obtained with reference to a standard rubidium (Rb) atomic clock. The cavity needs to maintain constant alignment to suppress the errors in the length determination, as well as to achieve reliable long-term operation that is crucial for geophysical observations. For these purposes, we characterized the cavity response to misalignments and newly developed an automatic alignment control system that utilizes a mechanical modulation. This is the novel feature of the instrument, as the technique is introduced to an ADM for the first time. The instrument is also equipped with a self-control system designed to achieve reliable and autonomous operation and to maximize the observation time. The basic principle of operation and the implementation of the instrument are described briefly, as the main topic of this paper is about the detailed analysis of cavity alignment and its control system that follows. The observation results and the performance of the instrument are discussed at the end of this paper.
2. Description of the Instrument
2.1. ADM System Overview
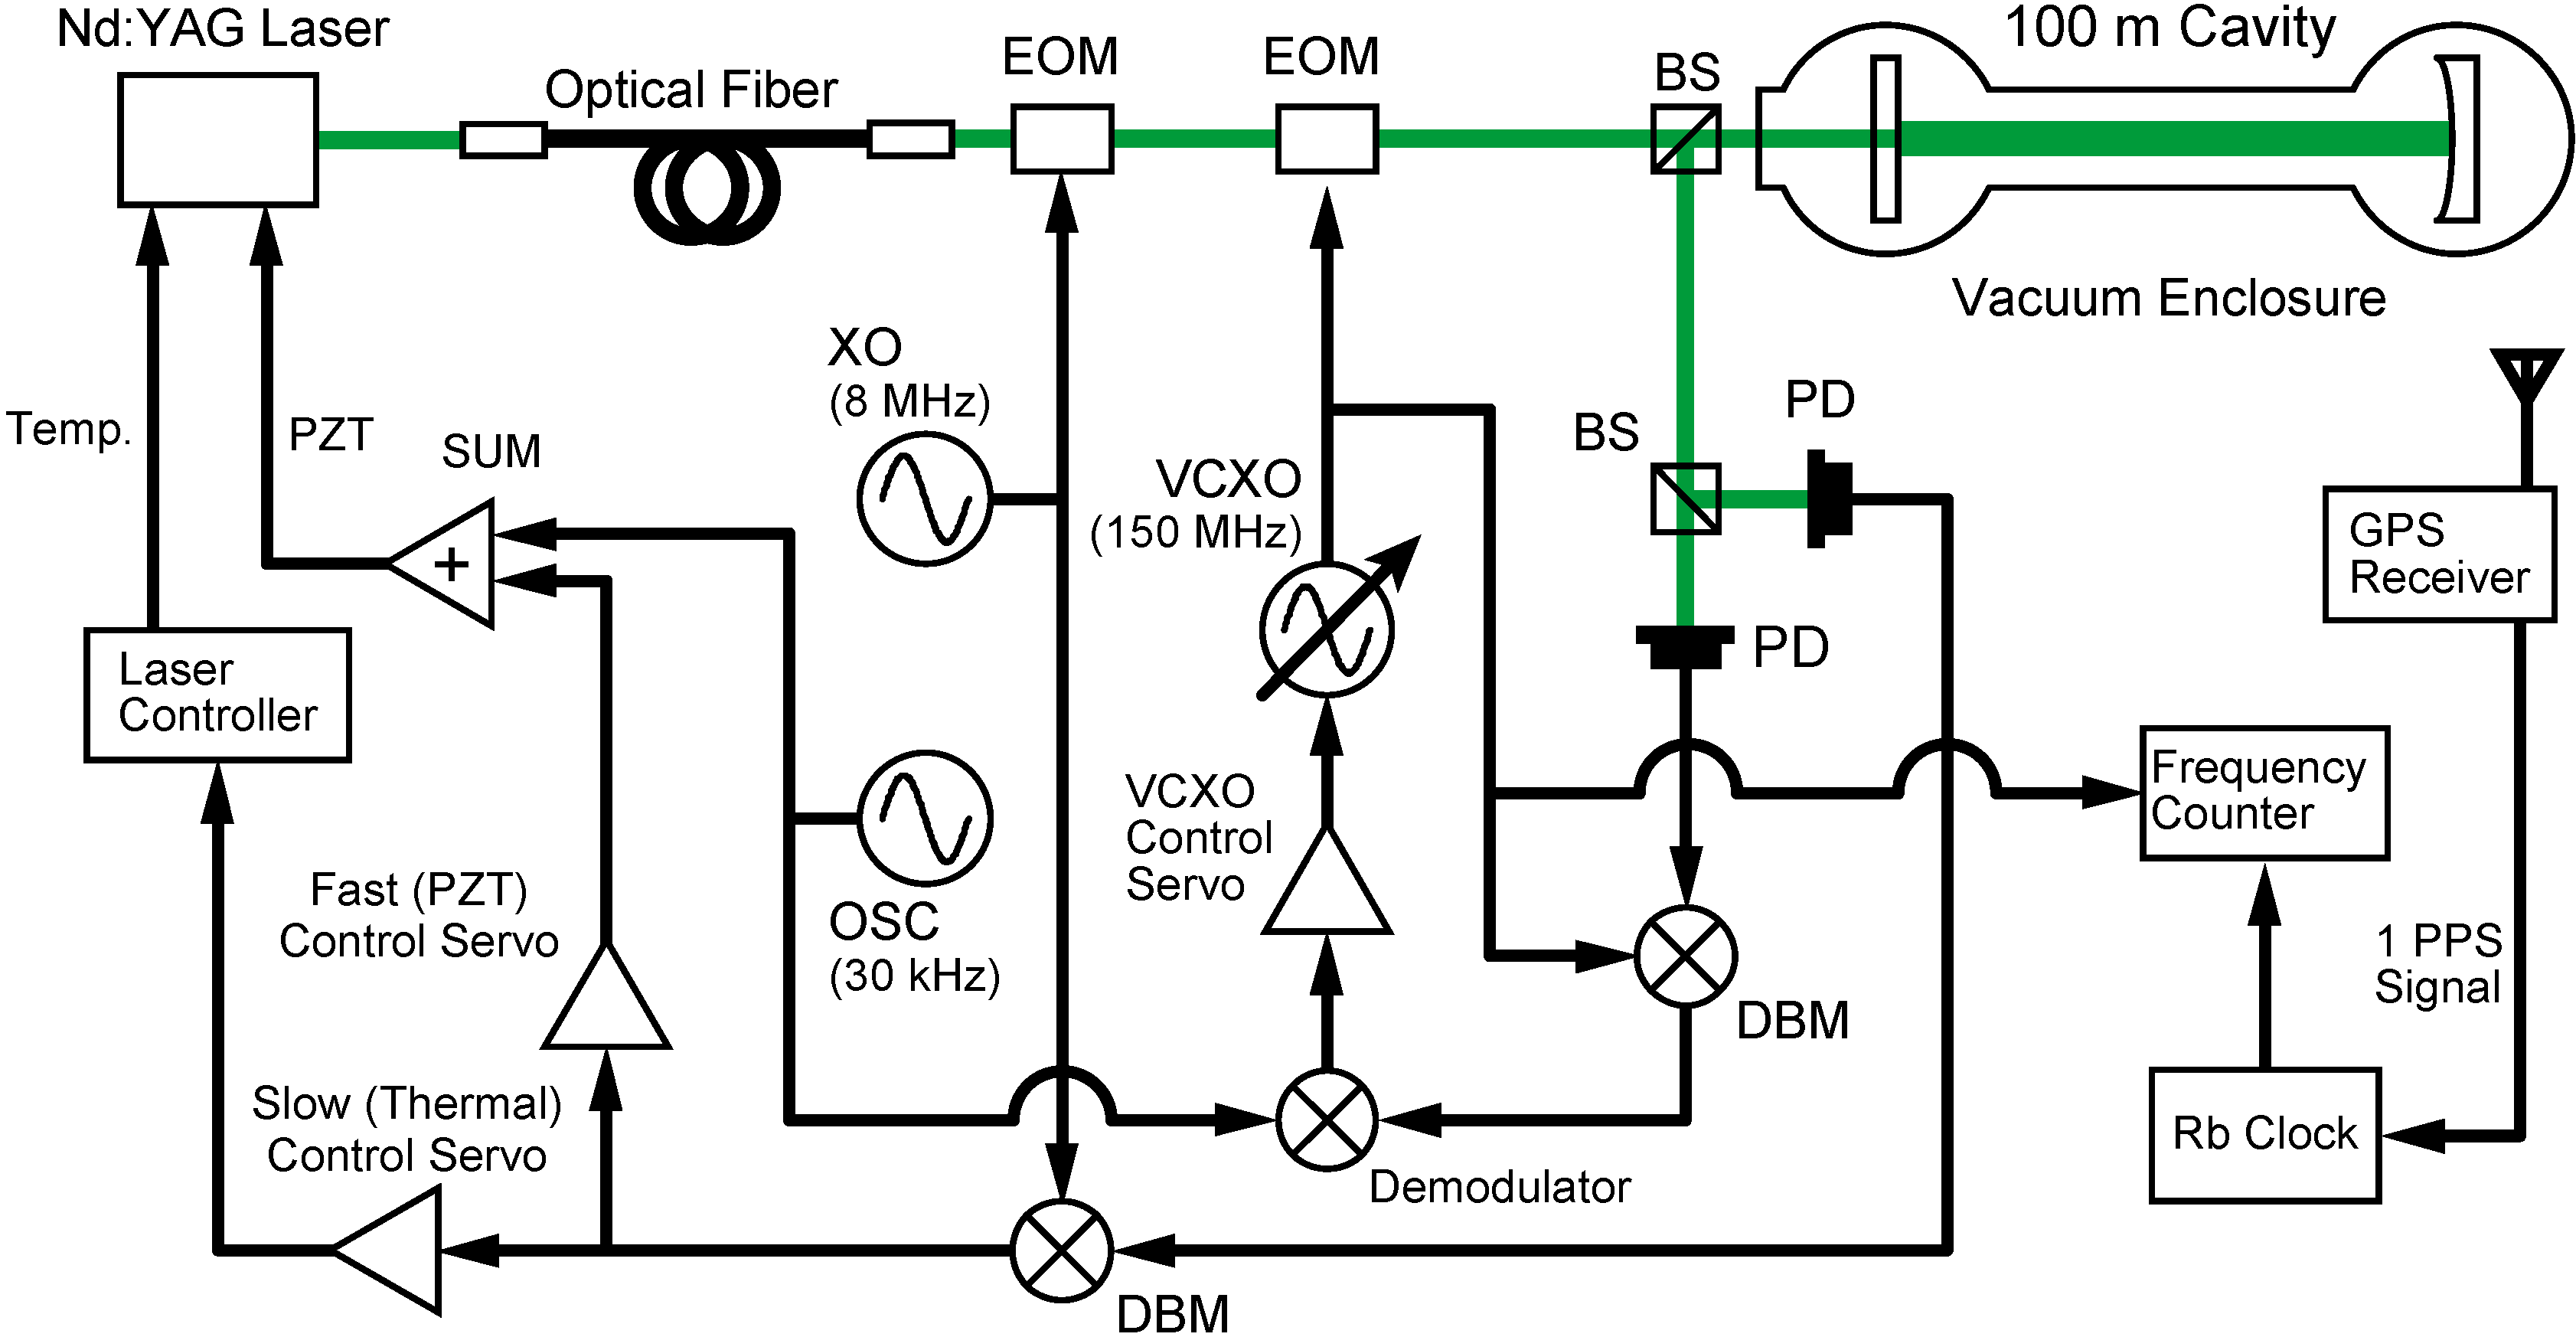
A schematic diagram of the ADM is shown in Figure 1. A frequency-doubled Nd:YAG laser (wave length λ = 532 nm) is used as a light source, and the beam is delivered to input optics through a polarization maintaining fiber. Phase modulations at 8 MHz and ~150 MHz are applied to the laser beam via electro-optic modulators (EOMs) that are driven by a fixed frequency quartz crystal oscillator (XO) and a voltage controlled crystal oscillator (VCXO), respectively, before the light enters the 100-m optical cavity. Frequency modulation (FM) at an audio frequency (30 kHz) is applied via a piezoelectric transducer (PZT) attached to the laser crystal, as well. The cavity is oriented north–south and is formed by a flat front mirror and concave end mirror with a design radius of curvature (Re) of 150 m. The mirrors are dielectric-multilayer coated and held by gimbals that are mounted on granite platforms firmly fixed to the bedrock. The mirror orientation is controlled by an alignment control system (described later) to maintain the optimal state. The optical cavity is under a high vacuum of the order of 10−4 Pa to eliminate disturbances to the optical path length, because of the atmospheric refractive index. The vacuum tanks, which accommodate the cavity optics, are bolted to the granite platforms mentioned above and decoupled from the rest of the vacuum system by having flexible bellows inserted between them, as illustrated in [10]. This assures that the cavity optics follow the Earth movement precisely. The output beam returning from the cavity is detected by two photo detectors (PDs) after being split by a beam splitter. One of the PD signals is demodulated by a double-balanced mixer (DBM) with the 8-MHz signal generated by XO to maintain the laser (carrier) frequency locked to the cavity (Pound–Drever–Hall method [11]), while the other PD signal is demodulated by another DBM with VCXO. The DBM output signal is further demodulated at the FM frequency to obtain the error signal that is used to control the VCXO frequency to maintain the sidebands resonant in the cavity. The VCXO frequency is monitored by a frequency counter that is synchronized to a 10-MHz Rb atomic clock stabilized to the order of 10−11 to 10−12 using the GPS one pulse per second signal. All servo controls are implemented with analog circuits and are enabled or disabled according to the lock status of the instrument by a digital control system based on a PC for automatic operation.
The 100-m optical cavity is sealed in a vacuum enclosure to eliminate atmospheric disturbances. Double-phase modulation is applied to the incident beam. The laser beam is frequency modulated via a PZT attached to the laser crystal and using EOMs driven by the fixed frequency XO and the VCXO to generate sidebands. The error signal for the Pound–Drever–Hall method is extracted by demodulating the reflected beam signal at the XO frequency. By demodulating the PD signal at the VCXO frequency and then the FM frequency, the error signal for sideband locking is obtained.
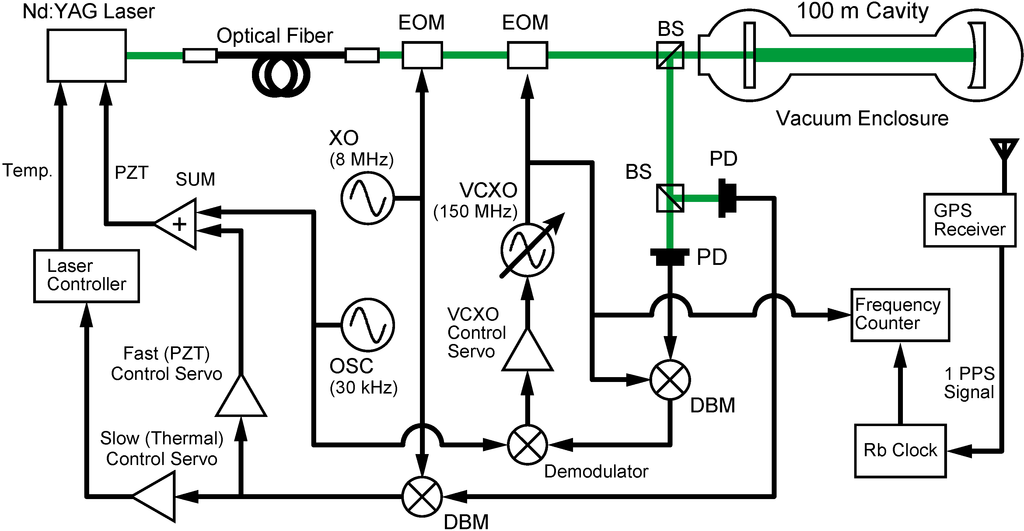
Figure 1.
Block diagram of the absolute distance meter (ADM). EOM, electro-optic modulator; PZT, piezoelectric transducer; XO, quartz crystal oscillator; VCXO, voltage controlled crystal oscillator; PD, photo detector; DBM, double-balanced mixer.
Figure 1.
Block diagram of the absolute distance meter (ADM). EOM, electro-optic modulator; PZT, piezoelectric transducer; XO, quartz crystal oscillator; VCXO, voltage controlled crystal oscillator; PD, photo detector; DBM, double-balanced mixer.
2.2. Absolute Distance Determination
When considering only the fundamental transverse electromagnetic mode (TEM00), the resonant frequencies (νn) of an optical cavity in vacuum are:
 where n, c, and denote an integer, the speed of light and the cavity length, respectively [12]. The geometric constant γ is defined by the radii of curvature of the mirrors (Rf and Re for the front and end mirrors, respectively) as:


The incident beam is doubly phase-modulated at a frequency of 8 MHz for the carrier lock and νm (VCXO frequency: 150 MHz) to generate sidebands. When the carrier is locked to the cavity, νm needs to satisfy:
 to make the sidebands resonant in the cavity, as well (m is an integer). Since L is coarsely determined by a supplemental measurement to be 99.92 ± 0.01 m and the wave length that corresponds to νm is much longer than the error of L, m must be equal to 100 without uncertainty. Therefore, the exact distance between two mirrors can be determined by measuring the VCXO frequency accurately and substituting for m into Equation (3):


A more detailed explanation is available in our earlier publication [13].
2.3. Alignment Control of the Optical Cavity
As the target of the ADM covers geophysical events whose durations vary from short (sub-second) to long (years) periods of time, the optical cavity needs to be maintained highly stable. One of the expected sources of instability is the misalignment of the incident beam with respect to the main cavity caused by the ground tilts, which are mainly induced by the seasonal change of groundwater distribution and atmospheric pressure Changes of tilt angles of the cavity optics cause errors in the length determination, coupling with beam miscentering. To resolve these problems, the tilt of the cavity mirrors is monitored and controlled to maintain an optimal state. The block diagram of the alignment control system is shown in Figure 2. A PD is located behind the end mirror to monitor the power of the beam transmitted from the cavity. The detected power reaches maximum only when the cavity mirrors are best aligned with the incident beam. Each mirror was mounted in a gimbal equipped with two PZTs to change the angle of the mirror about two axes perpendicular to the cavity axis. The rotations about the vertical and horizontal axes are defined as the yaw and pitch, respectively. The PZTs assigned to four degrees of freedom (DoF)—pitch and yaw of the front and end mirrors—were driven at different frequencies ranging from 61–109 Hz with a small amplitude for the mechanical modulation of the mirror angles. The derivatives of the output power signal were extracted by demodulating the output PD signal at these frequencies. They were used as the error signals in the control system, which sets all four demodulated signals to null, the unique condition for which the cavity is optimally aligned. The separation between modulation frequencies was carefully determined to prevent interference between each DoF. The bandwidth of the alignment control was limited from DC to several hertz to avoid interference with the modulation. The wave front sensing technique was used in our earlier experiment [13]. That technique is suitable to resolve the misalignment of the optical system with more DoF (the cavity was a part of the TAMA300 gravitational wave detector), but it requires complicated optical design and electrics. The mechanical modulation system developed for this ADM is simpler and effective in a single cavity that is specifically designed for geophysical observations.
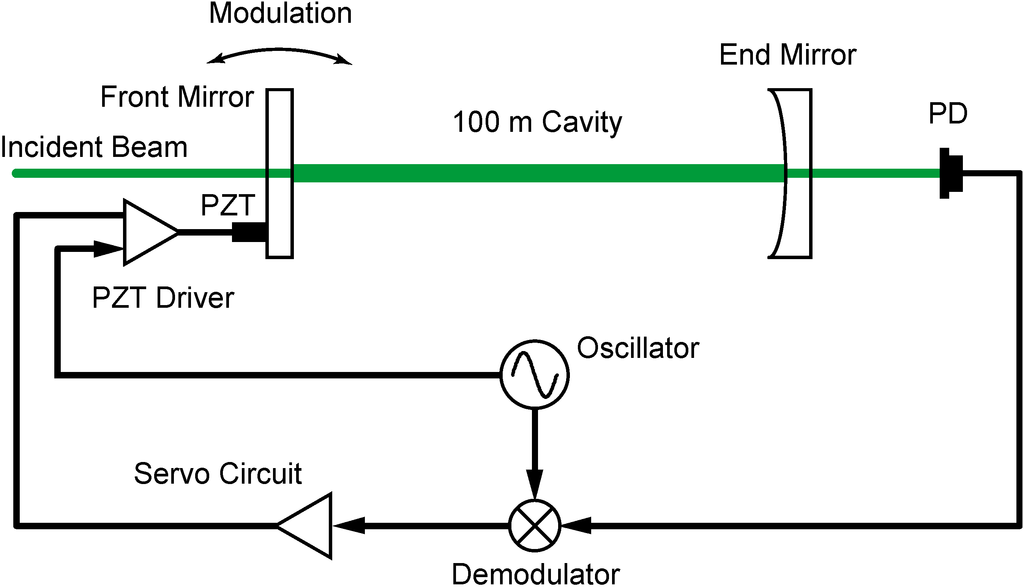
Figure 2.
Block diagram of automatic alignment control.
Figure 2.
Block diagram of automatic alignment control.
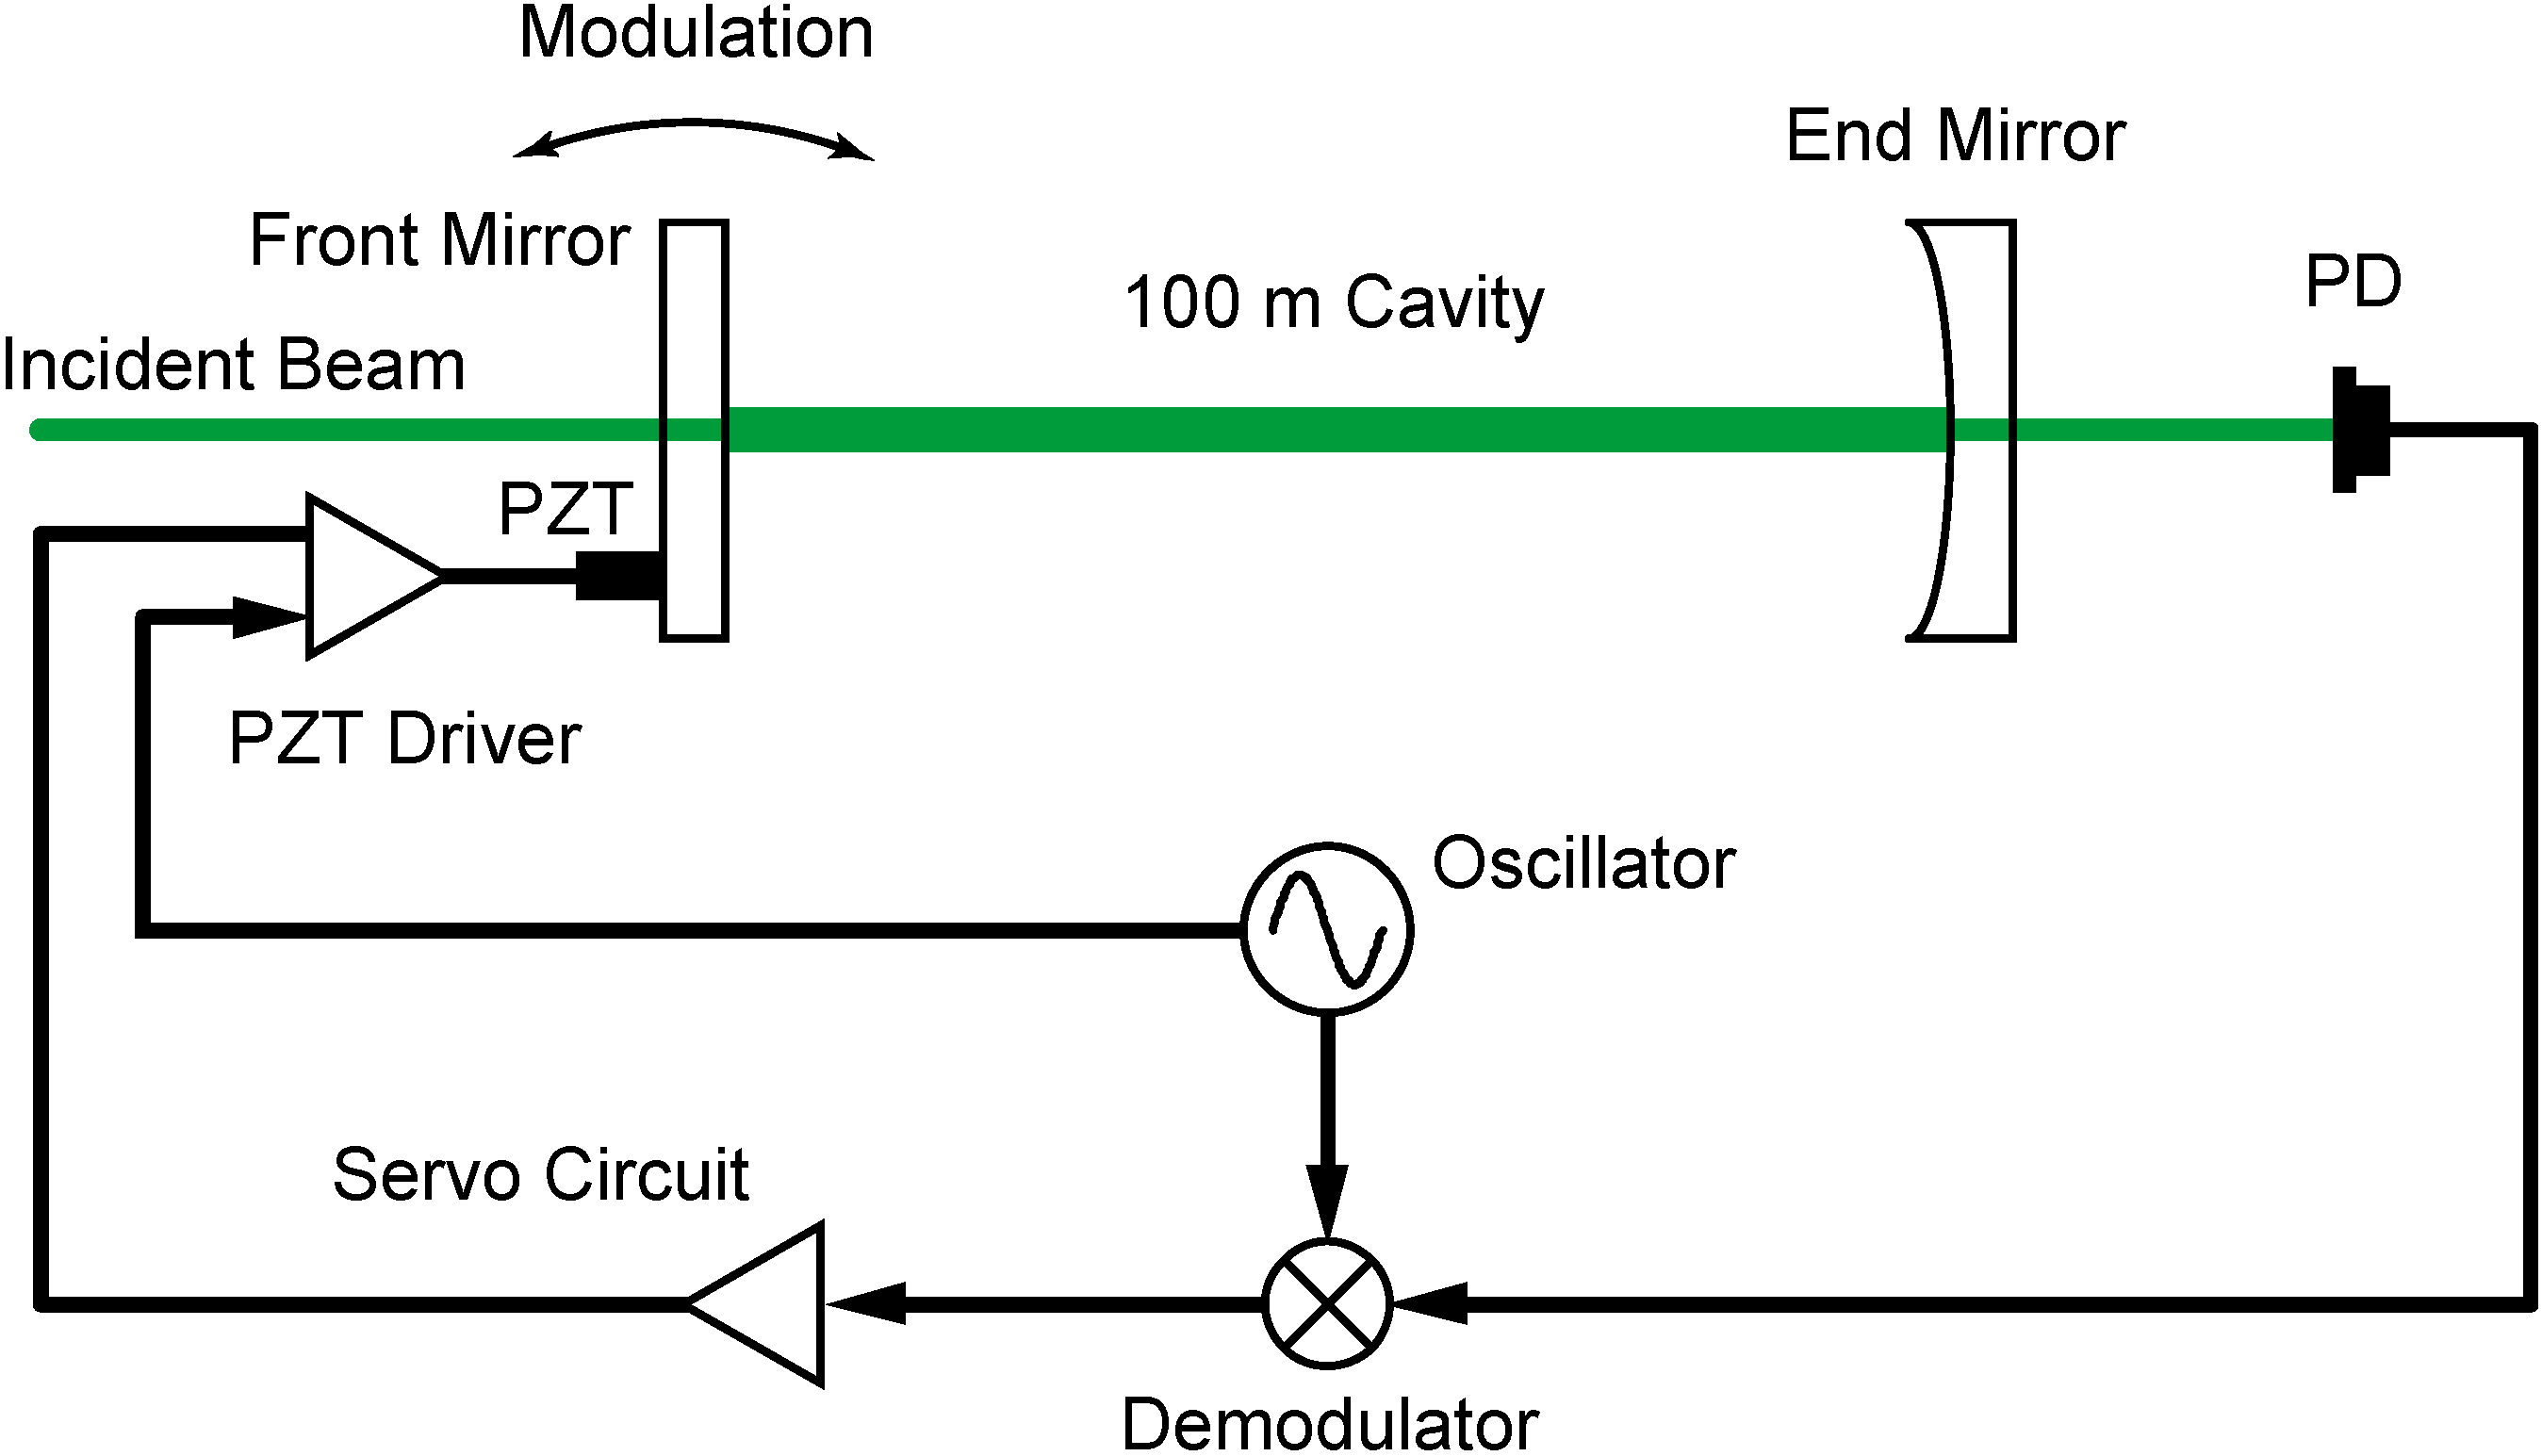
The angle of the cavity mirror is mechanically modulated using PZTs mounted on its gimbal holder. The photo detector located behind the end mirror monitors the intensity of the transmitted beam, and its signal is demodulated to obtain the error and is then processed by the servo circuit. The feedback signal is added to the PZT input to maintain the PD signal maximum, i.e., the best cavity alignment.
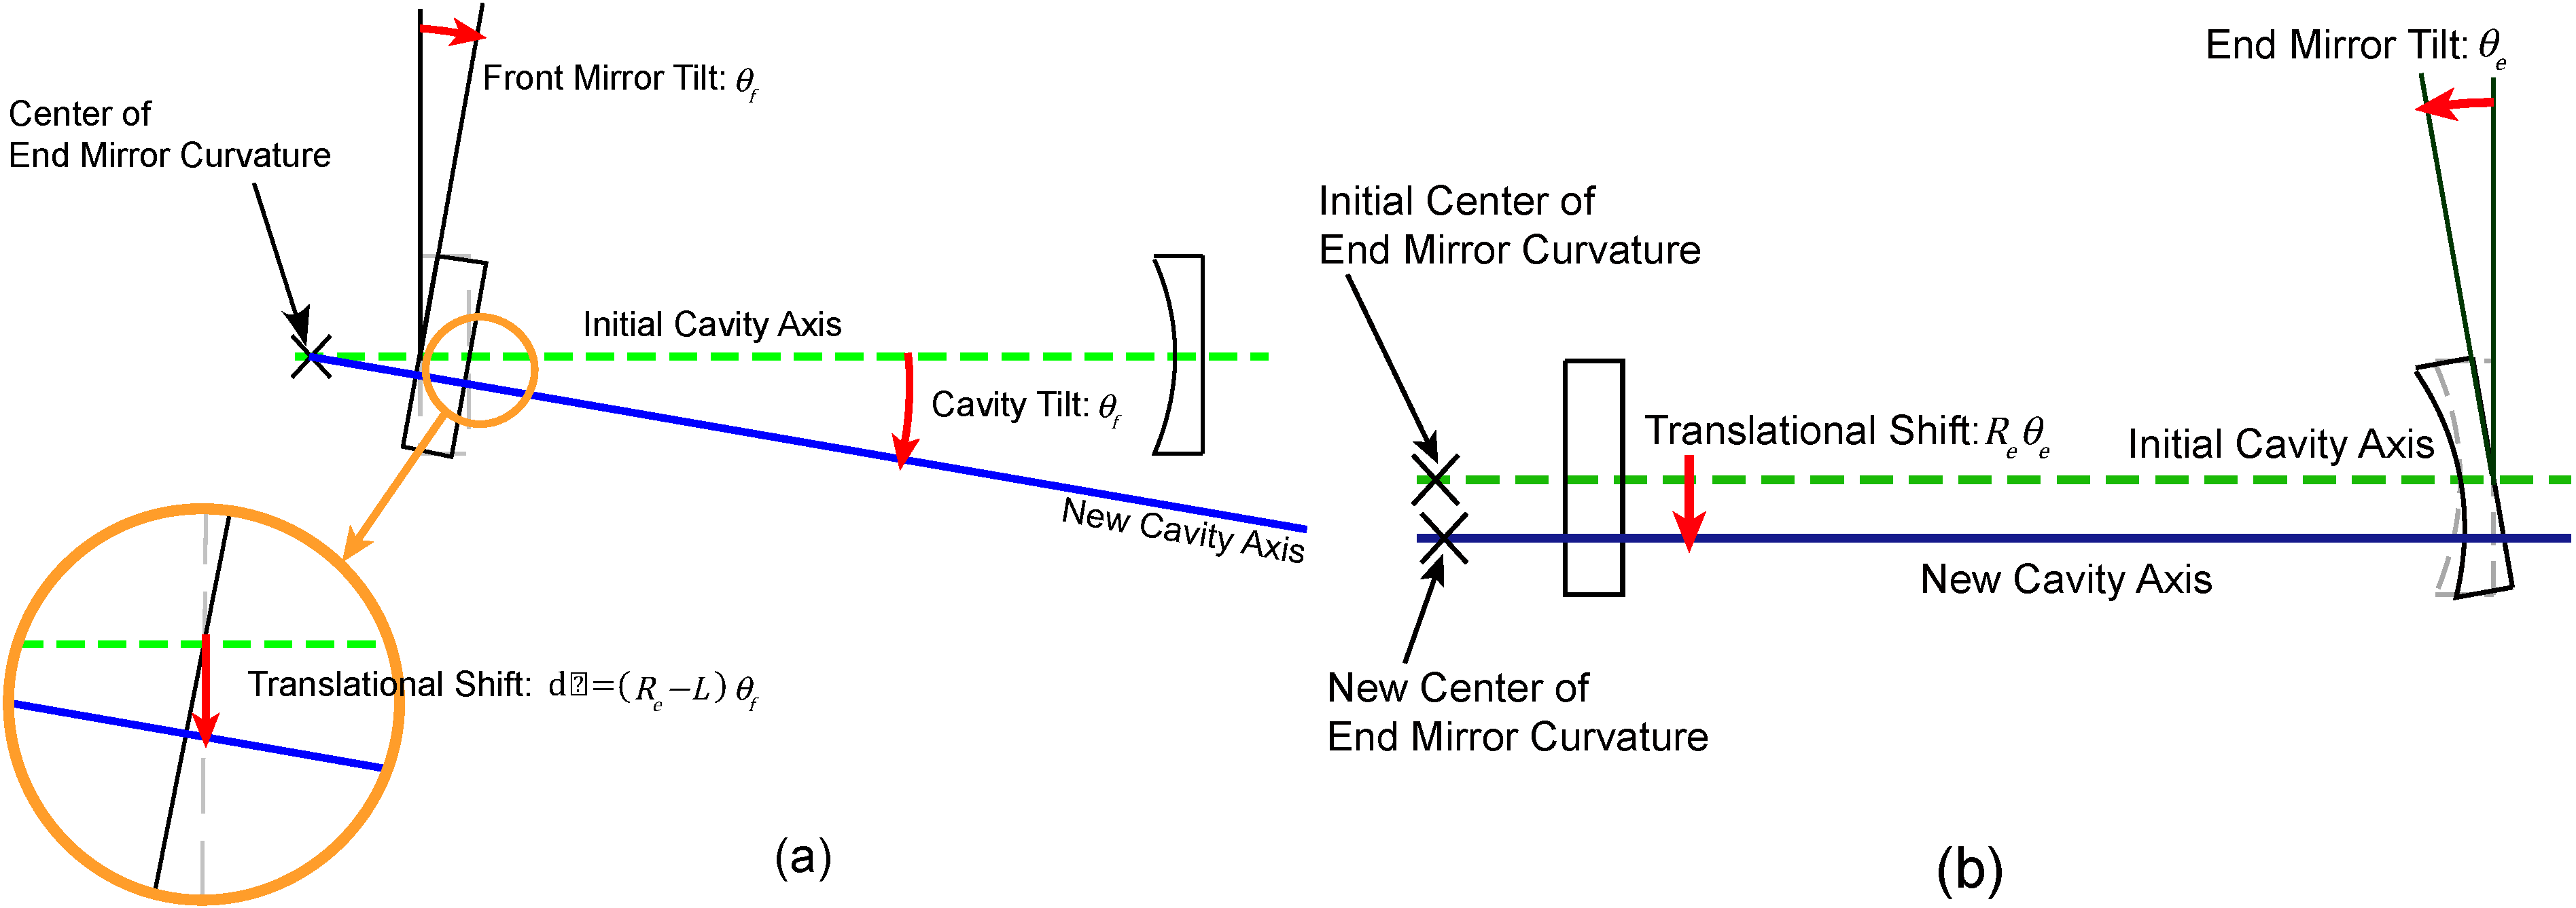
Tilts of the front and end mirrors introduce different effects on the transmitted beam power, depending on their radii of curvature. Starting with a cavity that was perfectly aligned initially, when the flat front mirror rotates by θf, it causes not only a tilt of the cavity axis, but also a translational shift. The cavity axis will be redefined by rotating and shifting the original axis by θf and dx = (Re − L) θf, respectively, as shown in Figure 3a. Meanwhile, the tilt of the end mirror only causes the cavity axis to shift by Reθe (θe is the tilt angle of the end mirror), because the cavity finds a point on the end mirror surface where the beam reflects normally to the front mirror, as shown in Figure 3b.
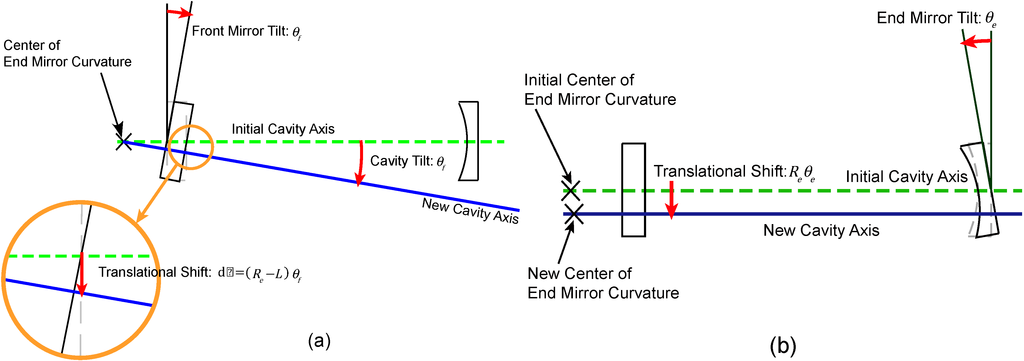
Figure 3.
Geometric effect caused by the cavity mirror tilt. The tilt of the flat front mirror induces the cavity axis to tilt and shift sideways simultaneously (a), while the end mirror tilt causes only a perpendicular shift, because of its concave shape (b).
Figure 3.
Geometric effect caused by the cavity mirror tilt. The tilt of the flat front mirror induces the cavity axis to tilt and shift sideways simultaneously (a), while the end mirror tilt causes only a perpendicular shift, because of its concave shape (b).
It is a good approximation that the incident beam comprises only the fundamental mode (TEM00), and it will be converted partially to the first higher order spatial mode (TEM10) when the beam returns from the tilted cavity. Considering only these modes, when the cavity axis rotates and shifts by dθ and dx with respect to the incident beam, respectively, the amplitudes of the electric fields of the reflected beam (  and
and  for TEM00 and TEM10, respectively) are calculated by using those of the input beam (E00 and E10 for TEM00 and TEM10, respectively) as:

 where rc0 and rc1 denote the reflectivity of the cavity for the TEM00 and TEM10 modes, respectively [14]. w0 and ϕ0 are the size (radius) of the beam at its waist position and the divergence angle, respectively (designed to be located at the front mirror surface as w0 = 3.5 mm and ϕ0 = 34 μrad in our configuration). By substituting the physical parameters, the equivalent rotational angle and the perpendicular shift of the cavity axis produced by the mirror tilts in Equation (6), one can compute the reflectivity of the cavity and obtain the intensity of the transmitted beam. The transmitted beam intensity as a parametric function of θf and θe is plotted in Figure 4, normalized to unity at its maximum, and forms a skewed elliptical paraboloid. Skewing occurs because the rotation of the front mirror changes the beam spot position on the end mirror surface, and the reflected beam is no longer parallel to the incident beam. This breaks the optical resonance, except when the cavity length is equal to the radius of curvature of the end mirror (i.e., L = Re). Therefore, the end mirror needs to be rotated to correct the non-parallelism and to maintain the resonance. A coupling between mirror rotation in the orthogonal directions (yaw and pitch) is expected, because of the concave shape of the end mirror, but this higher order effect is small and is not observed. The skew angle of the elliptical axes depends on the discrepancy between L and Re and other parameters. For ADM specifications, the radius of curvature of the end mirror was most responsible for determining the skew angle among these parameters. The skew angles estimated by varying the radius of curvature are plotted in Figure 5.
 and
and  for TEM00 and TEM10, respectively) are calculated by using those of the input beam (E00 and E10 for TEM00 and TEM10, respectively) as:


The pitch and yaw angles of the mirrors were independently controlled by servo controllers to reduce the error signal to zero in each DoF. Since only the unique condition (peak of the paraboloid) fulfils the optimal condition and no local minima exist, this simple strategy was successful.
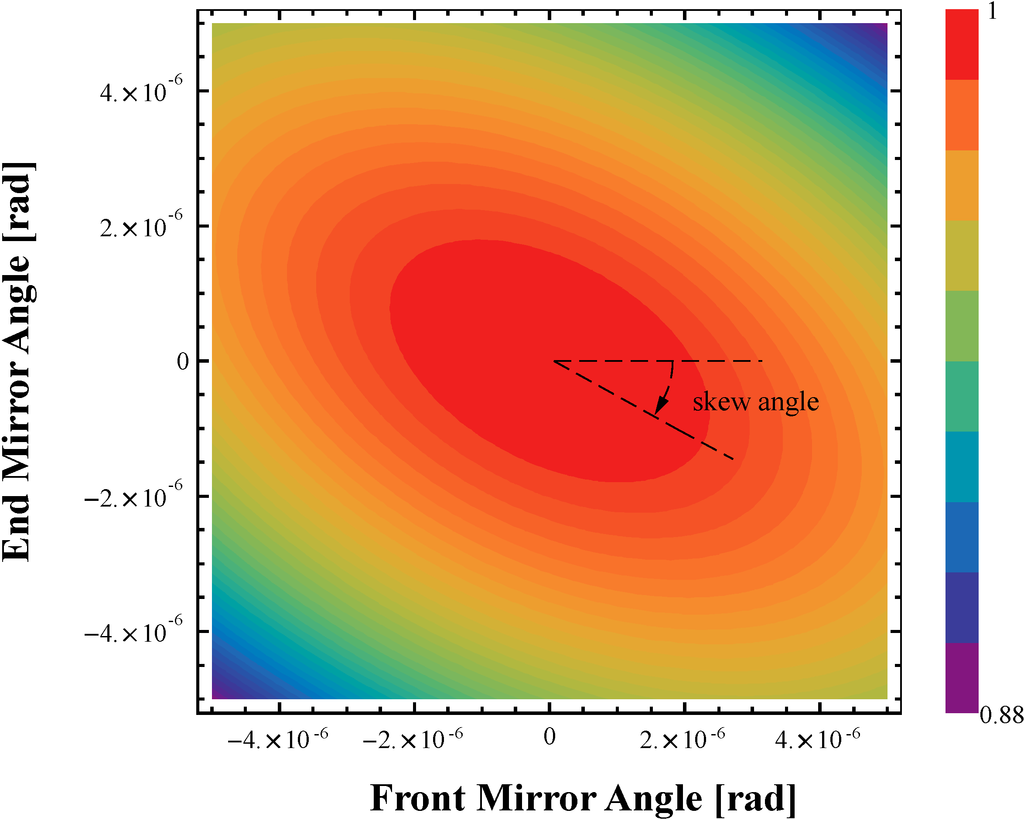
Figure 4.
Transmitted beam intensity (model).
Figure 4.
Transmitted beam intensity (model).
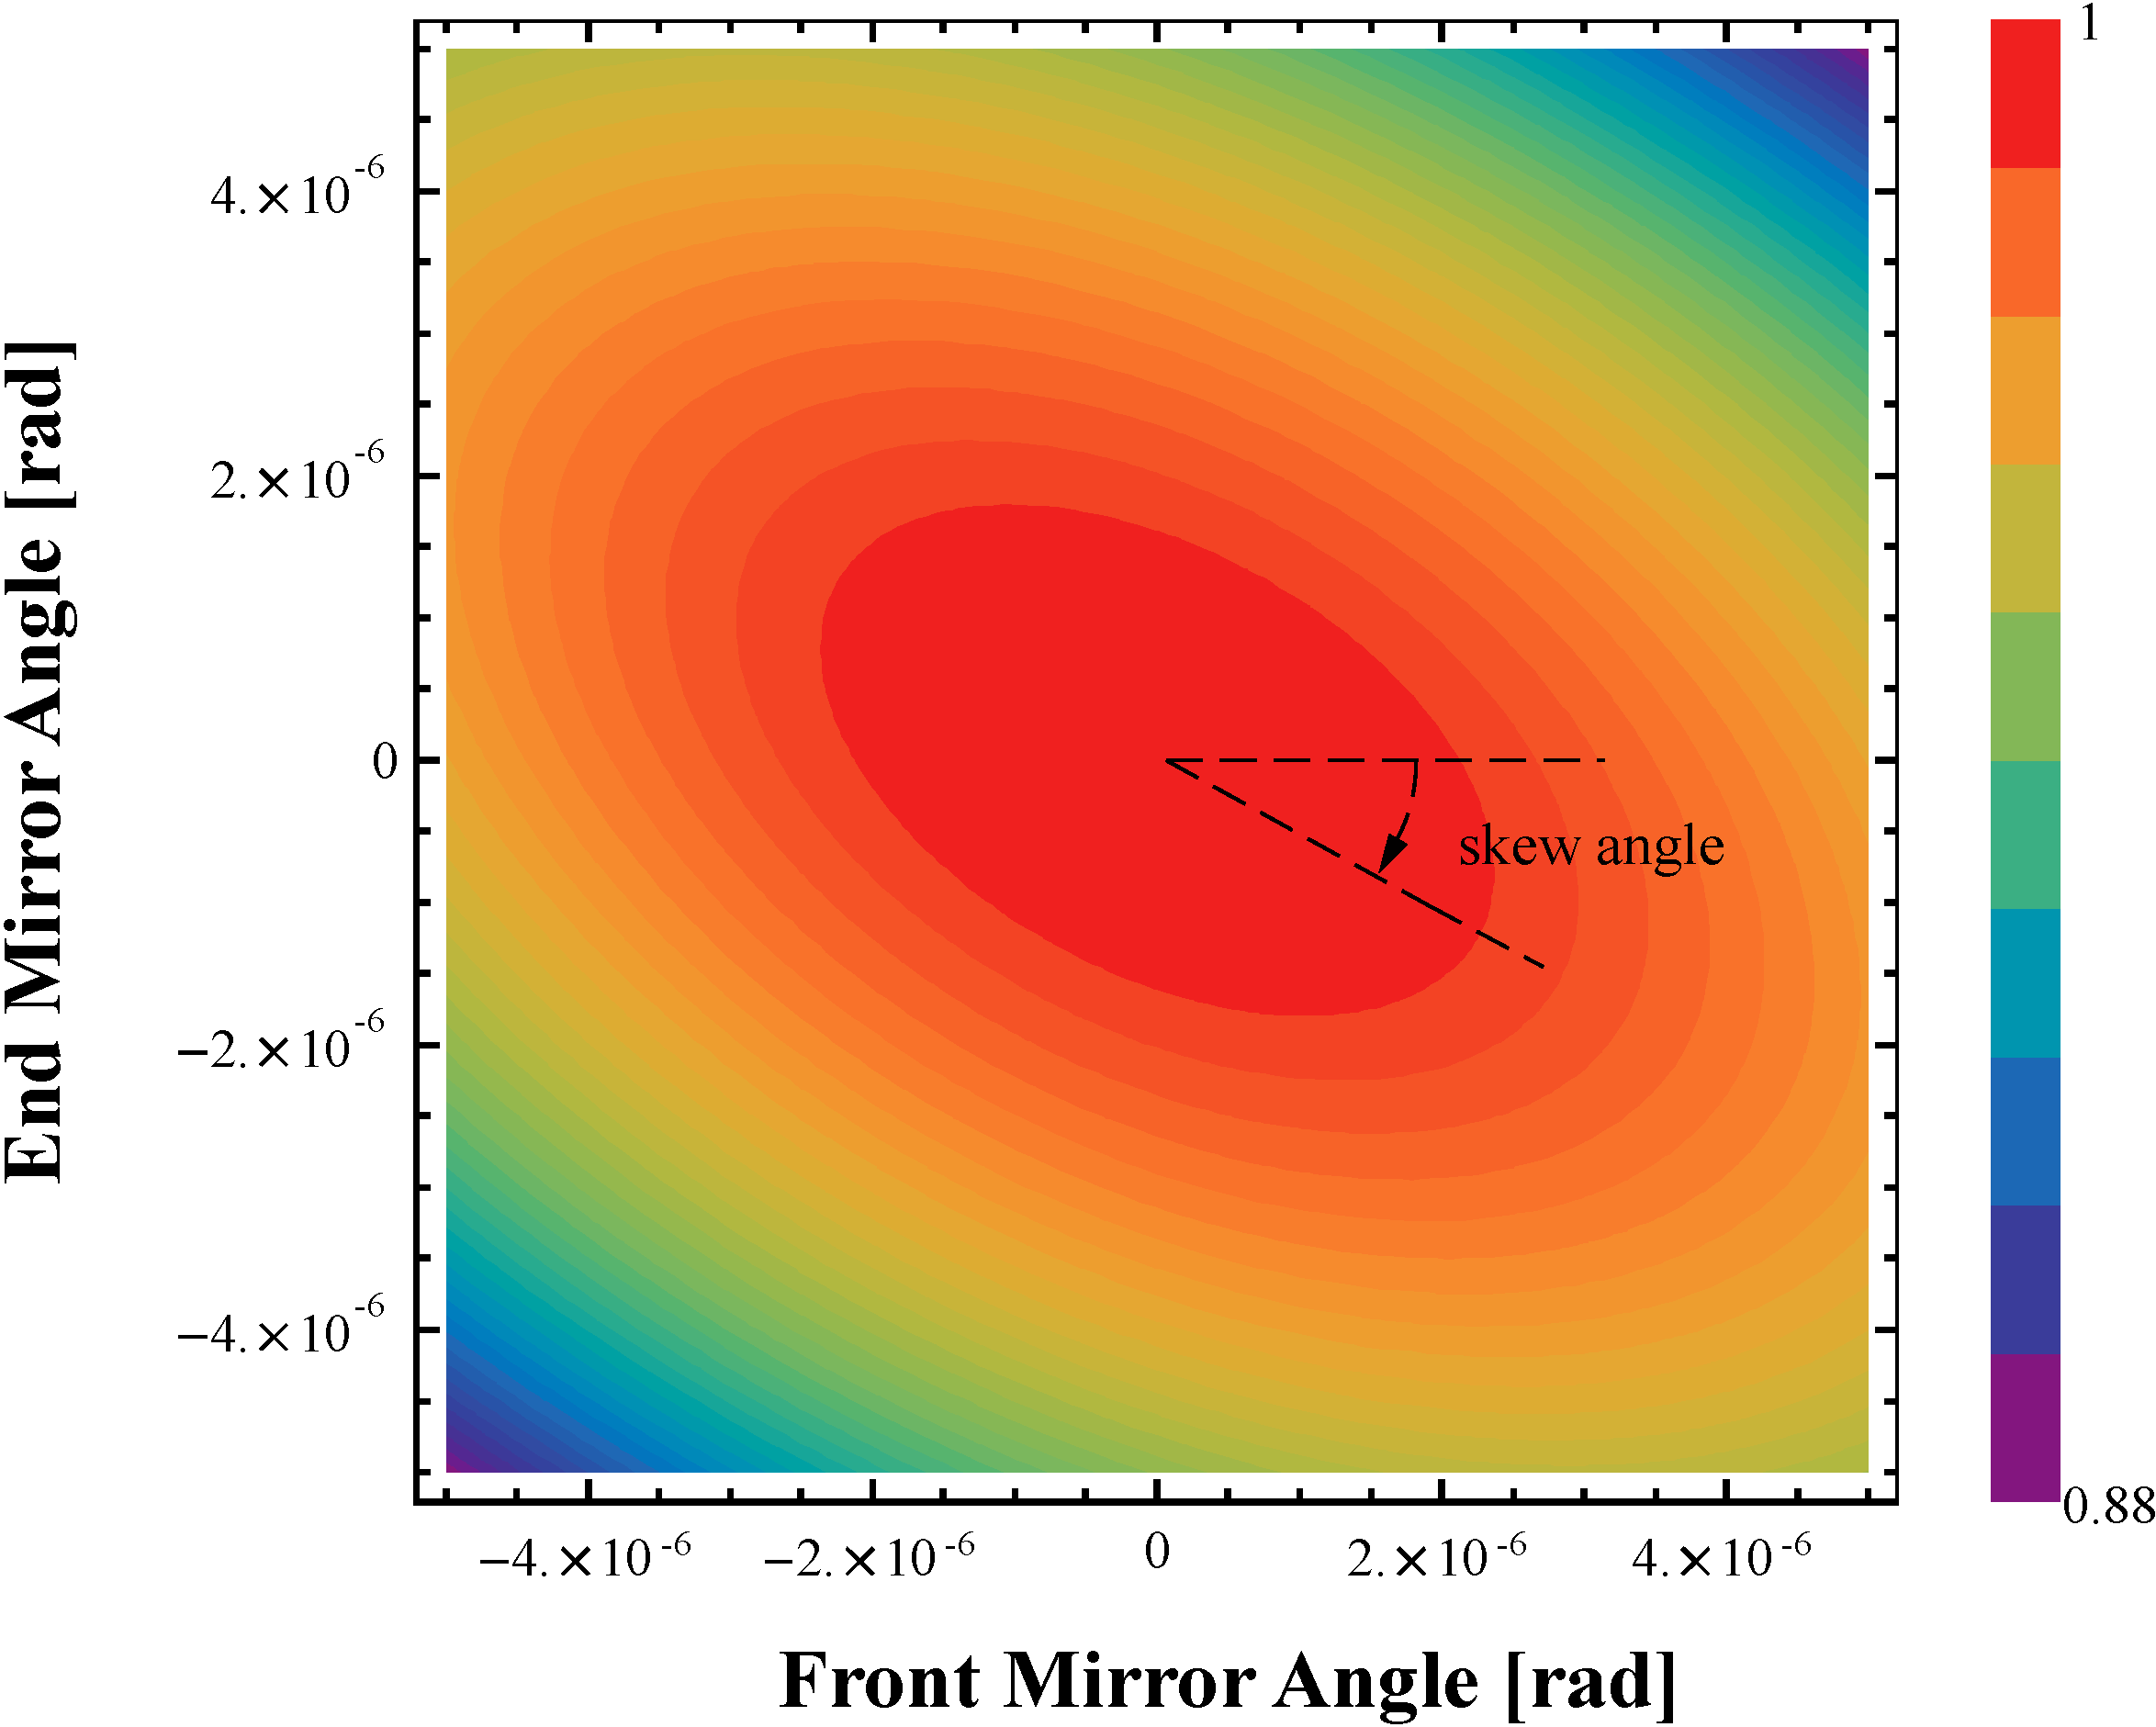
The intensity of the beam transmitted from the optical cavity is computed by assuming that the beam waist is located at the front mirror surface and that the radius of curvature of the end mirror is 150 m. The intensity is plotted as a function of the tilt angles of the front and end mirrors and forms a skewed elliptic paraboloid with a skew angle of 28.8° in this case. This plot is scaled arbitrarily.
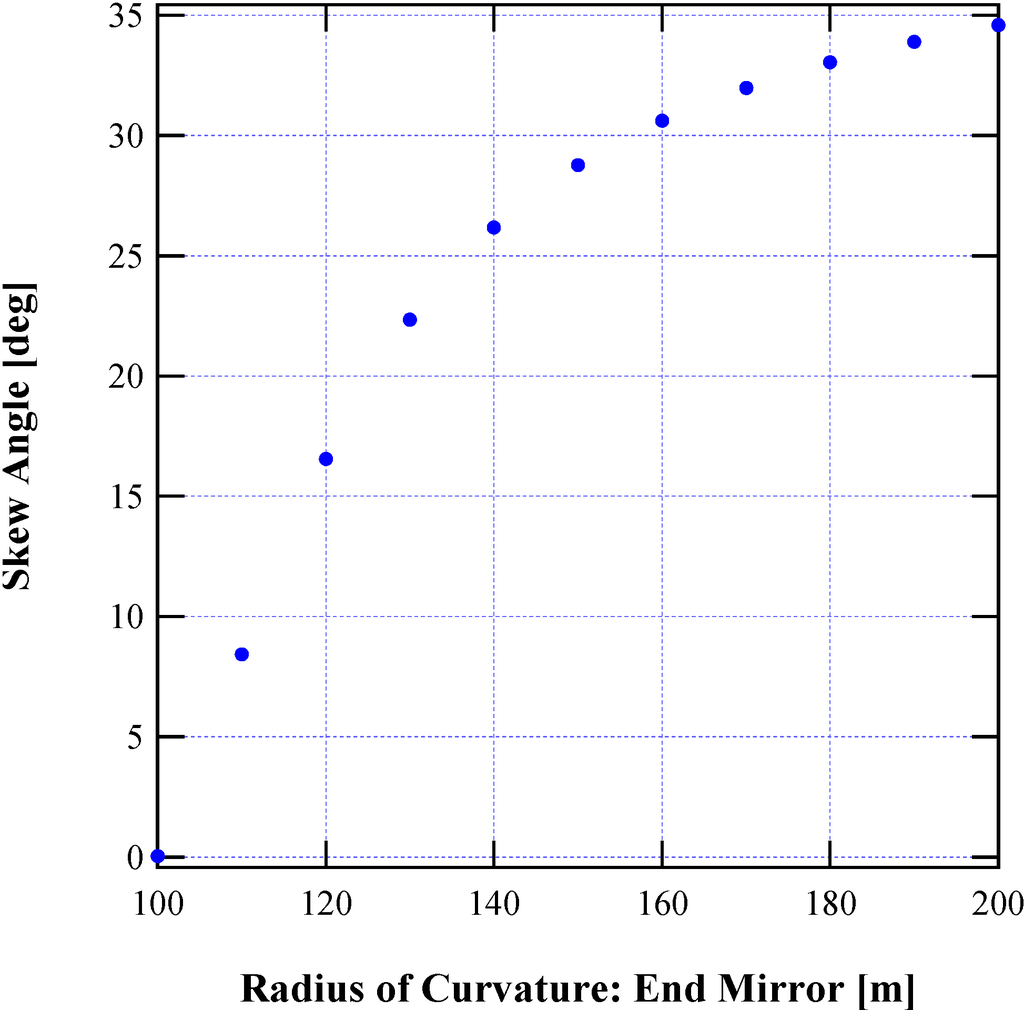
Figure 5.
Skew angles of the transmitted beam intensity paraboloid (model).
Figure 5.
Skew angles of the transmitted beam intensity paraboloid (model).
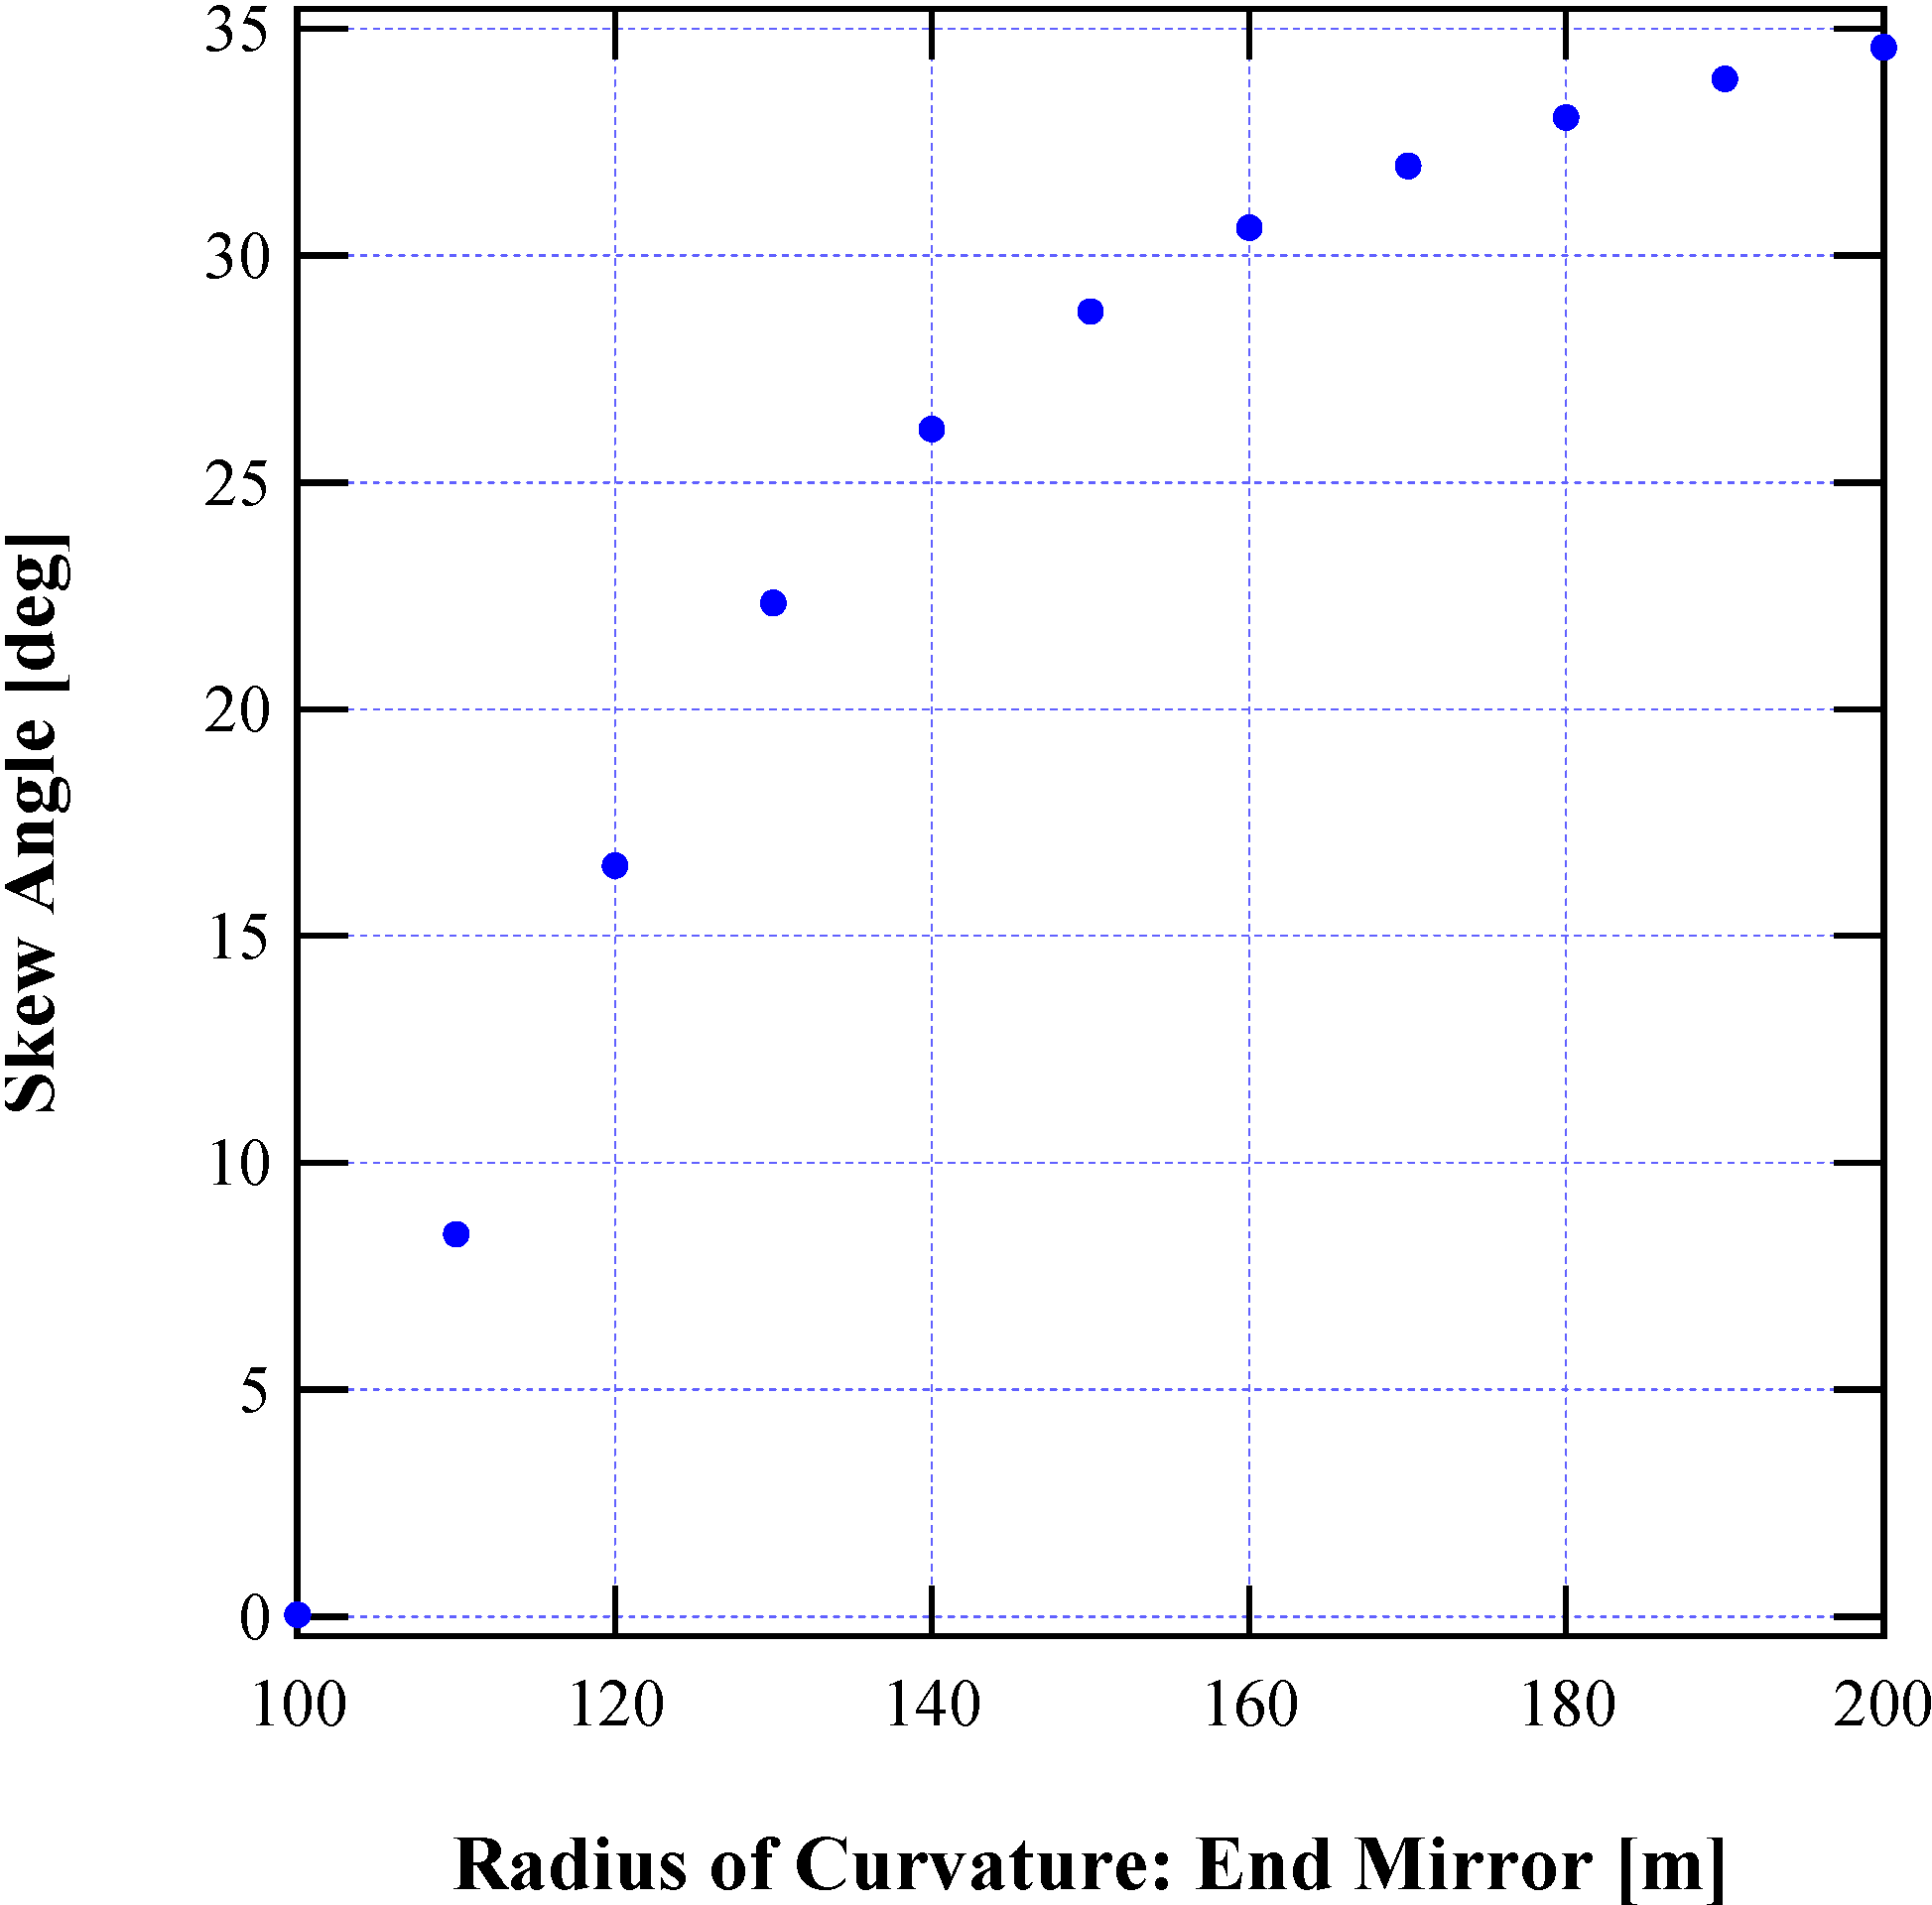
The skew angles of the elliptic paraboloid, which the transmitted beam intensity draws as a function of the radius of curvature of the end mirror, are estimated by using the theoretical model.
2.4. Automatic Relocking System
The resonance of the optical cavity could be lost because the control system could be overwhelmed by large and/or sudden changes in cavity length, mirror misalignments, etc. However, when the ADM regains cavity resonance, it begins producing data that continues from the moment it unlocks without imposing ambiguity induced by the fringe miscount in principle. This does not occur for other types of laser interferometers. An automatic relocking system was installed to utilize this advantage and maximize the observation time. The relocking system is based on a PXI PC from National Instruments Co. implemented with several ADCs and relays to monitor and engage or disengage the signals from analog circuits of the interferometer control loops. The intensity of the transmitted beam—the same signal used for alignment control—and the inputs to the PZT controllers in the automatic alignment control system were used as indicators of the status of the optical cavity. These signals were monitored every second, and when the transmitted beam intensity became smaller than a given threshold, for instance, the VCXO frequency control loop was disengaged and reset by operating the relays in the servo circuits. After waiting for an appropriate settling time to the analog circuits, the loop was engaged again to reacquire the cavity resonance. When the attempt failed, the process was repeated after a given interval until the indicator signal was brought back to exceed the threshold. The threshold level and timing parameters were carefully chosen after iterations and could be set remotely via Internet connection from outside the observatory. A duty cycle higher than 90% was achieved by setting the thresholds at approximately half the maximum for transmitted power and 2.5 μrad for mirror misalignment. The automatic relocking system allows for almost autonomous operation of the ADM and is effective in reducing disturbances caused by nearby activities for maintenance.
3. Results and Discussion
3.1. Performance of Absolute Distance Determination
A typical result of the strain measured with the ADM is shown in Figure 6 together with that of the LSM. A simulated curve, computed with the GOTIC2 simulator, taking into account a topographic effect of the Kamioka site, is also plotted for comparison [15,16]. Diurnal and semidiurnal signals of an amplitude of the order of 1 μm (10−8 in strain) were measured by both instruments. Those signals, which are related to the Earth’s tide, agree very well with the simulation results. Thus, the instrument calibration is validated. However, mismatches in shorter and longer timescale were also observed. These glitches in ADM data are considered to be caused by artificial and natural activities, including earthquakes. The slow drift of −0.4 μm/day, which is not seen in the model, was observed with two independent instruments and is therefore believed to reflect an actual strain change rather than an instrumental error. Several geophysical events, such as the movement of groundwater and the influences of atmospheric pressure, which are not included in the theoretical model, should contribute to the drift. It should be noted that the control of the VCXO frequency was unlocked on 31 August (indicated by an arrow); however, it relocked automatically and continuous observation resumed. This demonstrates the capability of the ADM to determine the absolute distance.
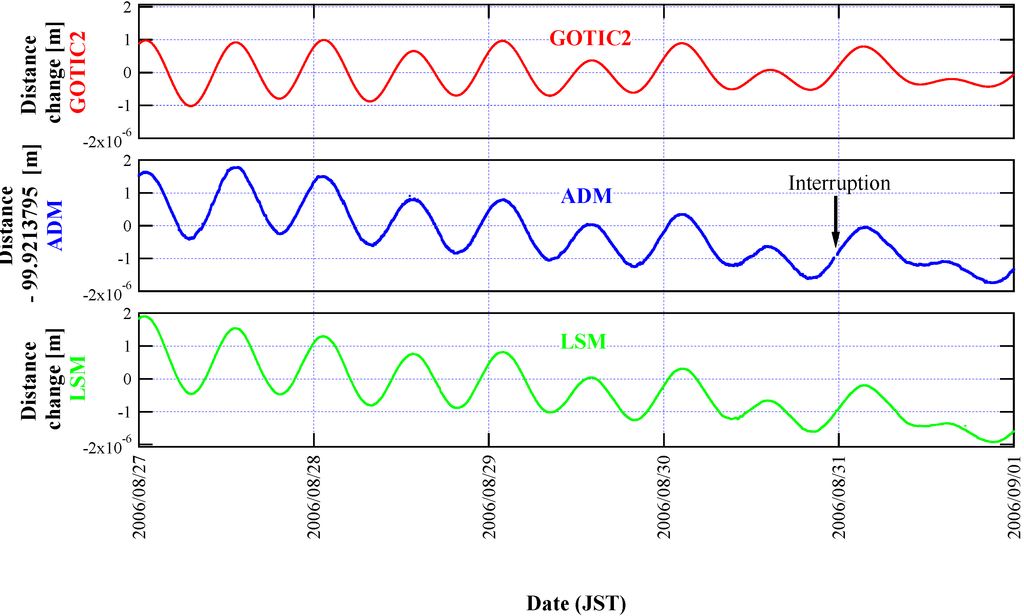
Figure 6.
Ground strain measured with the ADM. LSM, laser strainmeter.
Figure 6.
Ground strain measured with the ADM. LSM, laser strainmeter.
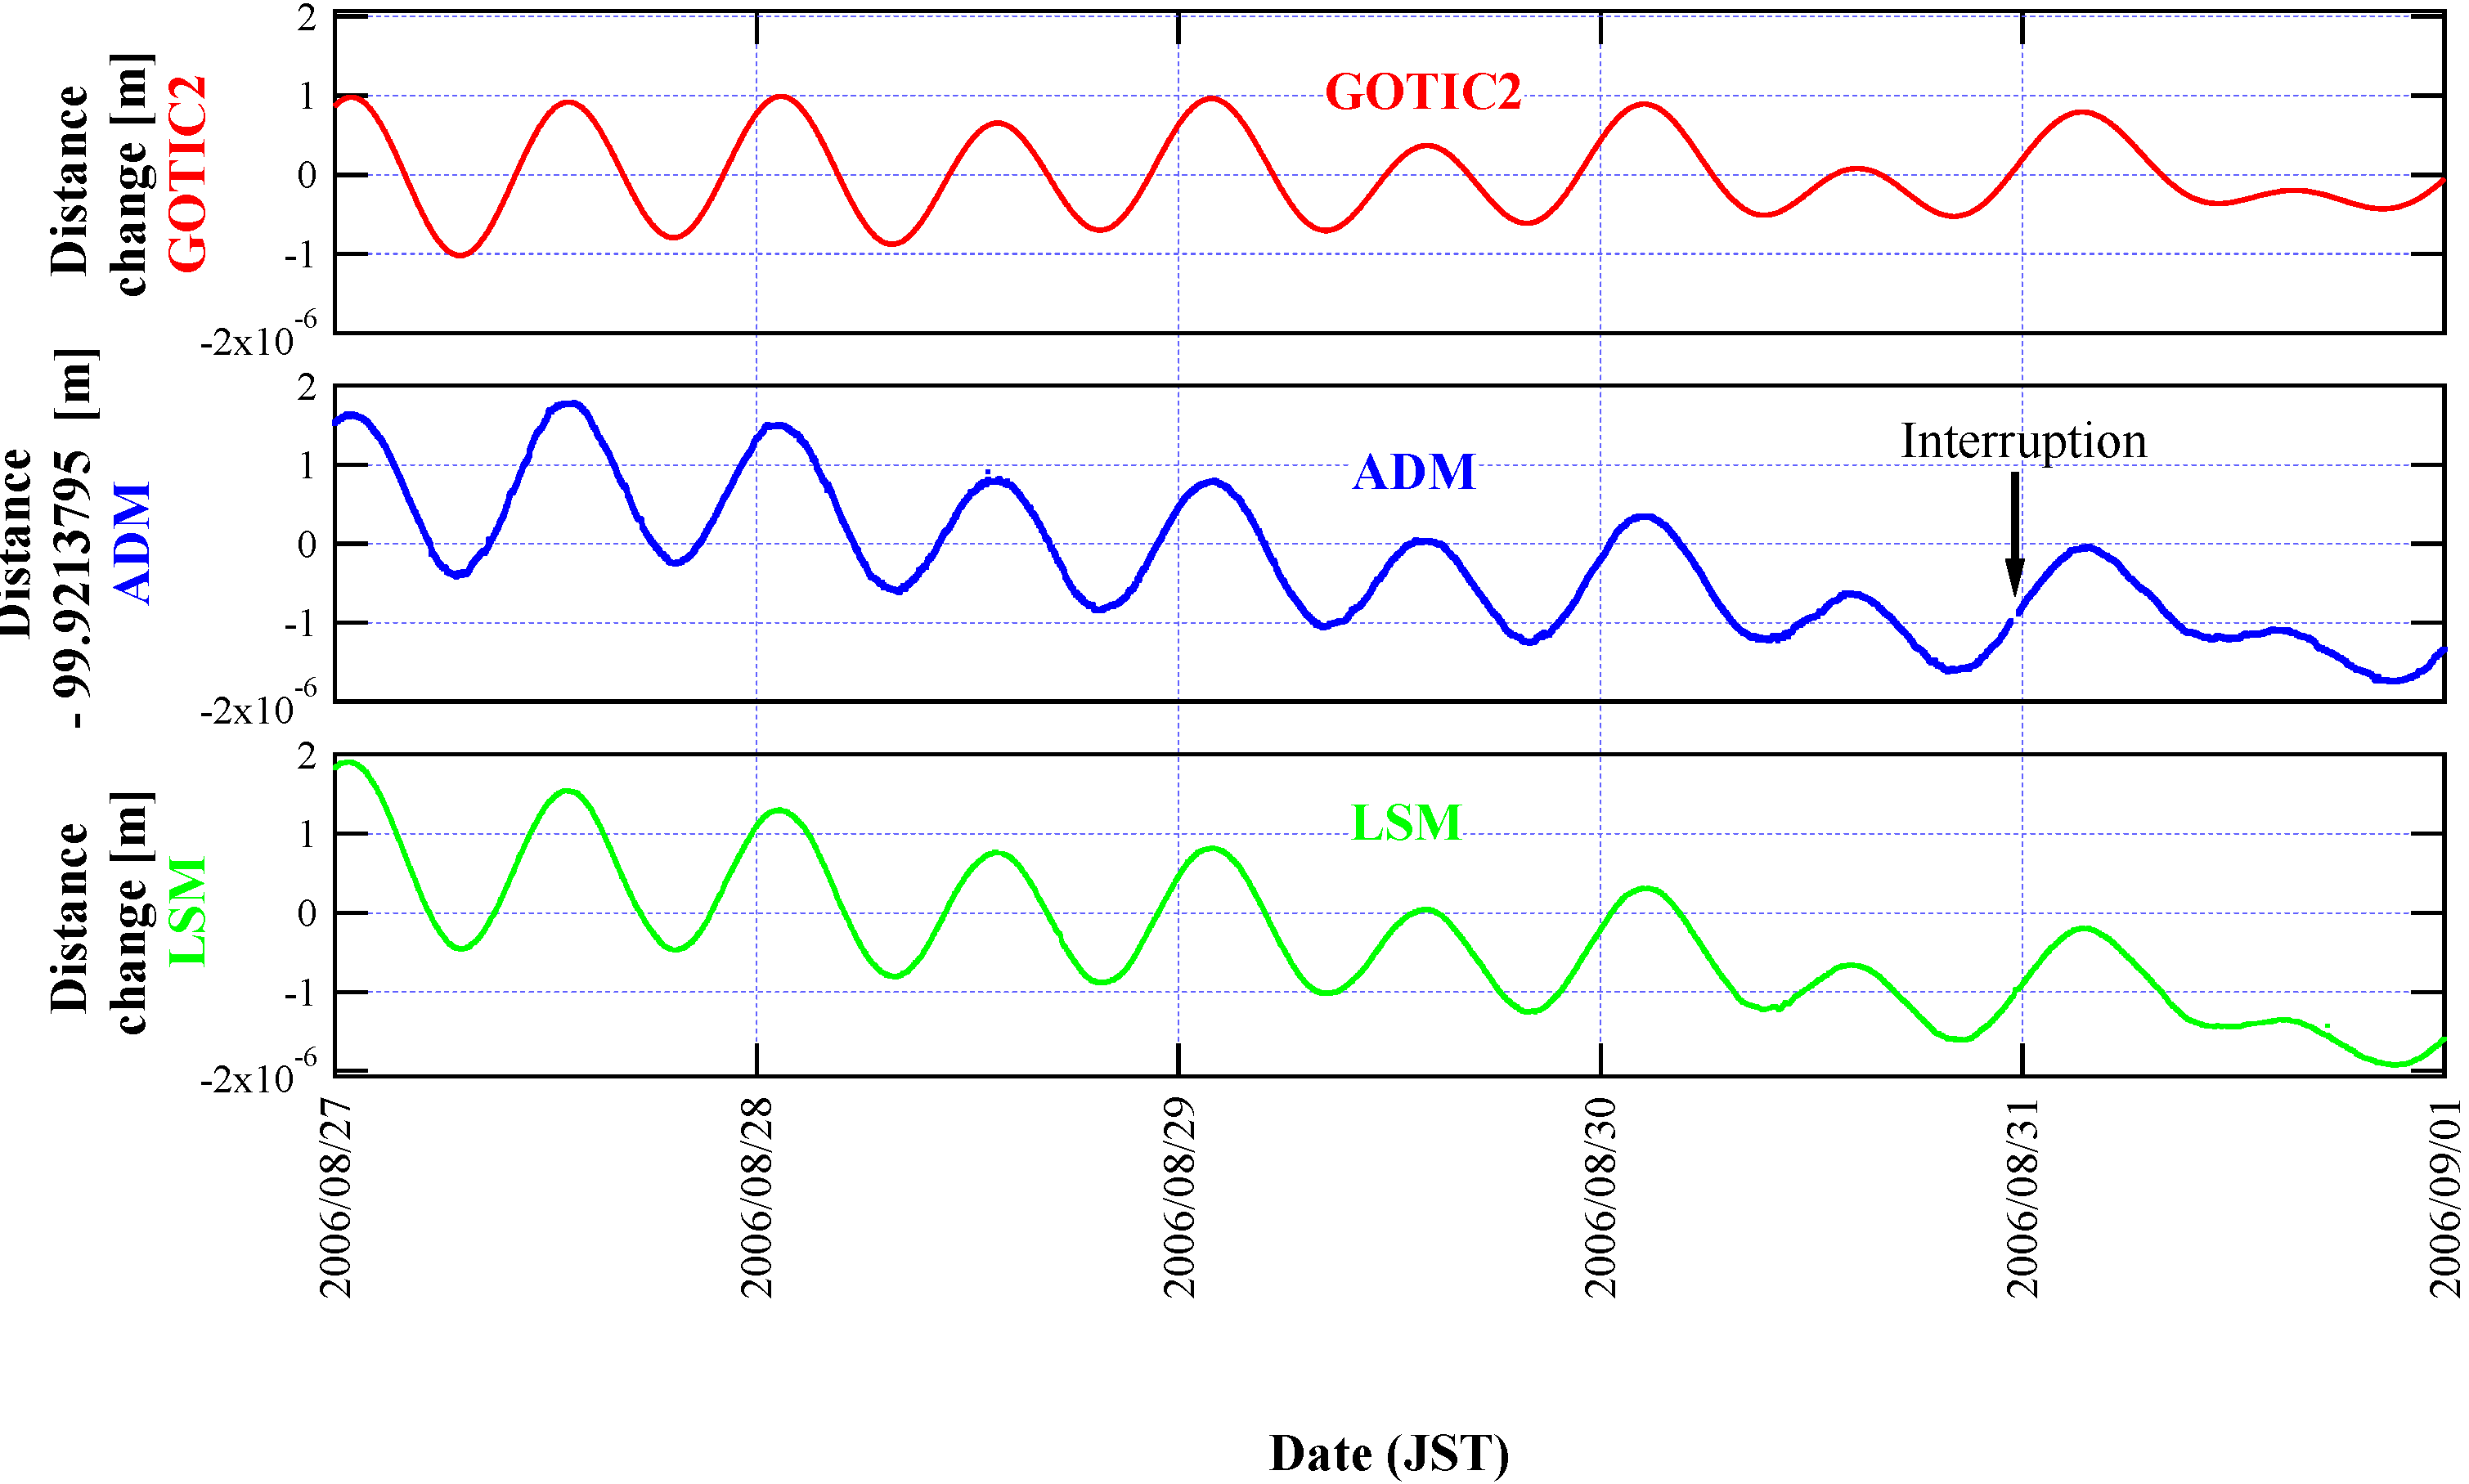
The LSM and GOTIC2 results are plotted. The amplitude of the tidal component correlates well for all three curves. The same drift rate was observed for both instruments. An automatic relocking of the ADM occurred as indicated by the arrow.
Figure 7 shows typical data produced by the ADM and LSM on 29 August 2006. No lock-loss occurred the entire day, as indicated by the intact transmitted beam power (bottom window). To estimate the ADM resolution, the difference between the two instruments is plotted in the middle window. Although the carrier and sidebands of the laser maintained an uninterrupted resonance in the cavity, several steps and glitches occurred as marked by the arrows. These are regarded as instrumental ADM noise, since they were not observed by the LSM. The standard deviation of the difference, calculated by avoiding these sudden changes, was 6.5 × 10⁻⁹ m (6.5 × 10⁻¹¹ in strain). This is close to the stability of the Rb atomic clock (used as a time base to stabilize the frequency counter that determines the VCXO frequency) and is expected as the achievable resolution of the ADM. However, the effective performance of the instrument is compromised by its imperfect repeatability. In principle, when the lock of the laser frequency, VCXO or alignment control is lost for a short moment for any reason besides an actual change in cavity length, the measured absolute distance should recover the value taken a moment ago. This was true for most lock-loss events, but there was a non-negligible number of incidents in which the VCXO frequency stepped up or down suddenly by an amount that corresponds to several 10−7 m, before and after the lock losses. The frequency and amplitude of these false events were mitigated by improving the servo circuits and the algorithm of the relocking system, but they were not completely removed. Therefore, we collected and statistically evaluated these events observed over five days, as detailed in our earlier publication [3]. Taking into account these events, the effective resolution of the ADM was determined to be 2 × (10−8 to 10−7) m (2 × (10−10 to 10−9) in strain).
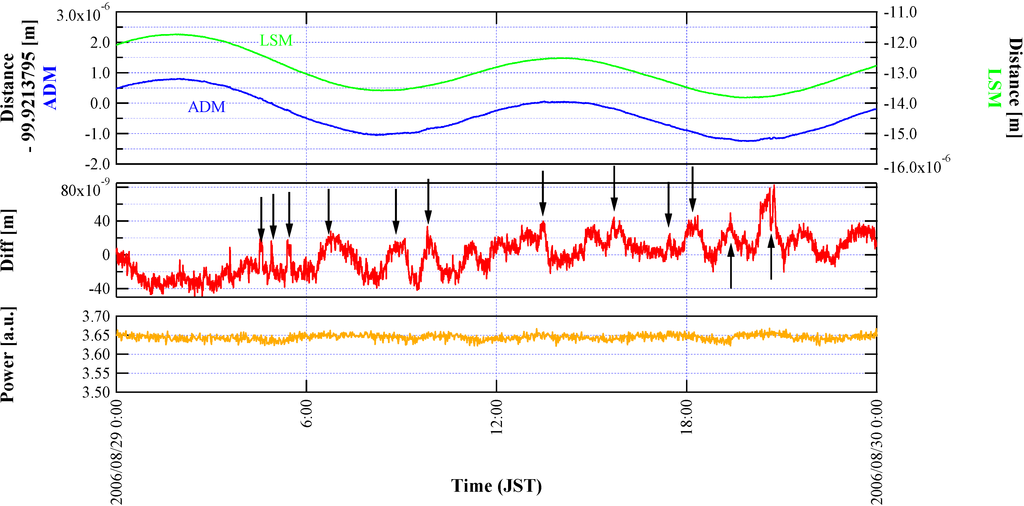
Figure 7.
Glitches observed in the ADM output. Absolute distance measured with the ADM (blue), the LSM data (green) and their difference (red).
Figure 7.
Glitches observed in the ADM output. Absolute distance measured with the ADM (blue), the LSM data (green) and their difference (red).
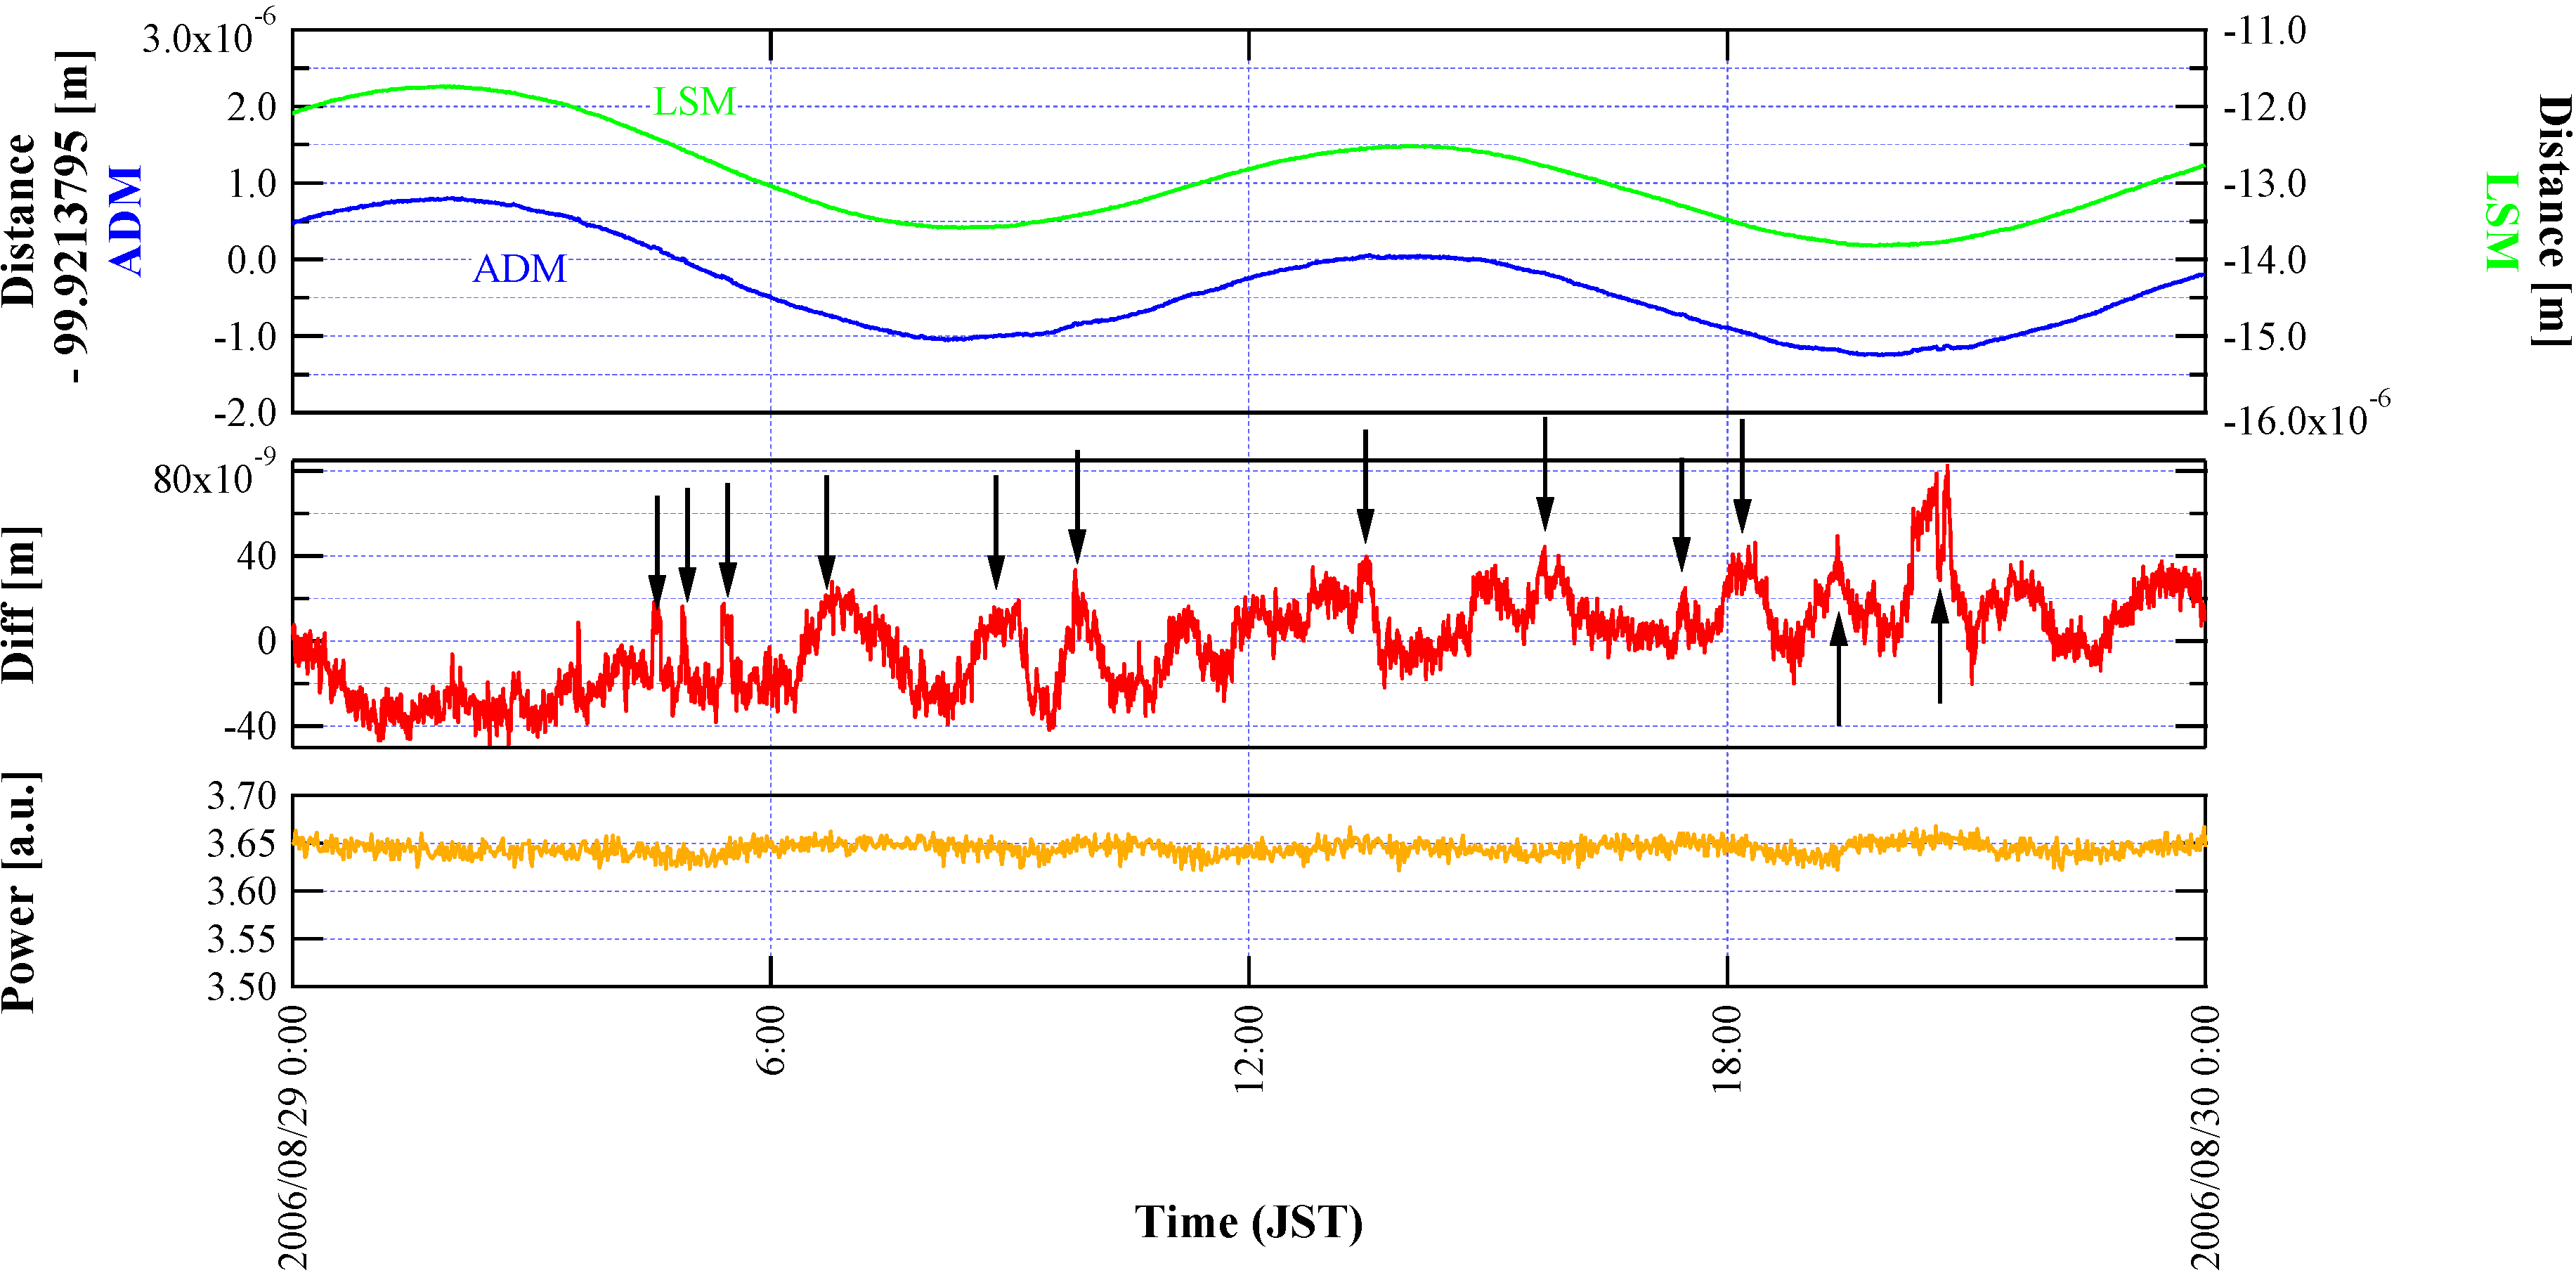
Sudden steps and glitches were observed in the ADM output (VCXO control voltage) signal as marked by arrows, even when all controls were engaged stably without interruptions and the transmitted beam intensity was optimal (orange).
3.2. Transient Events Observed with ADM
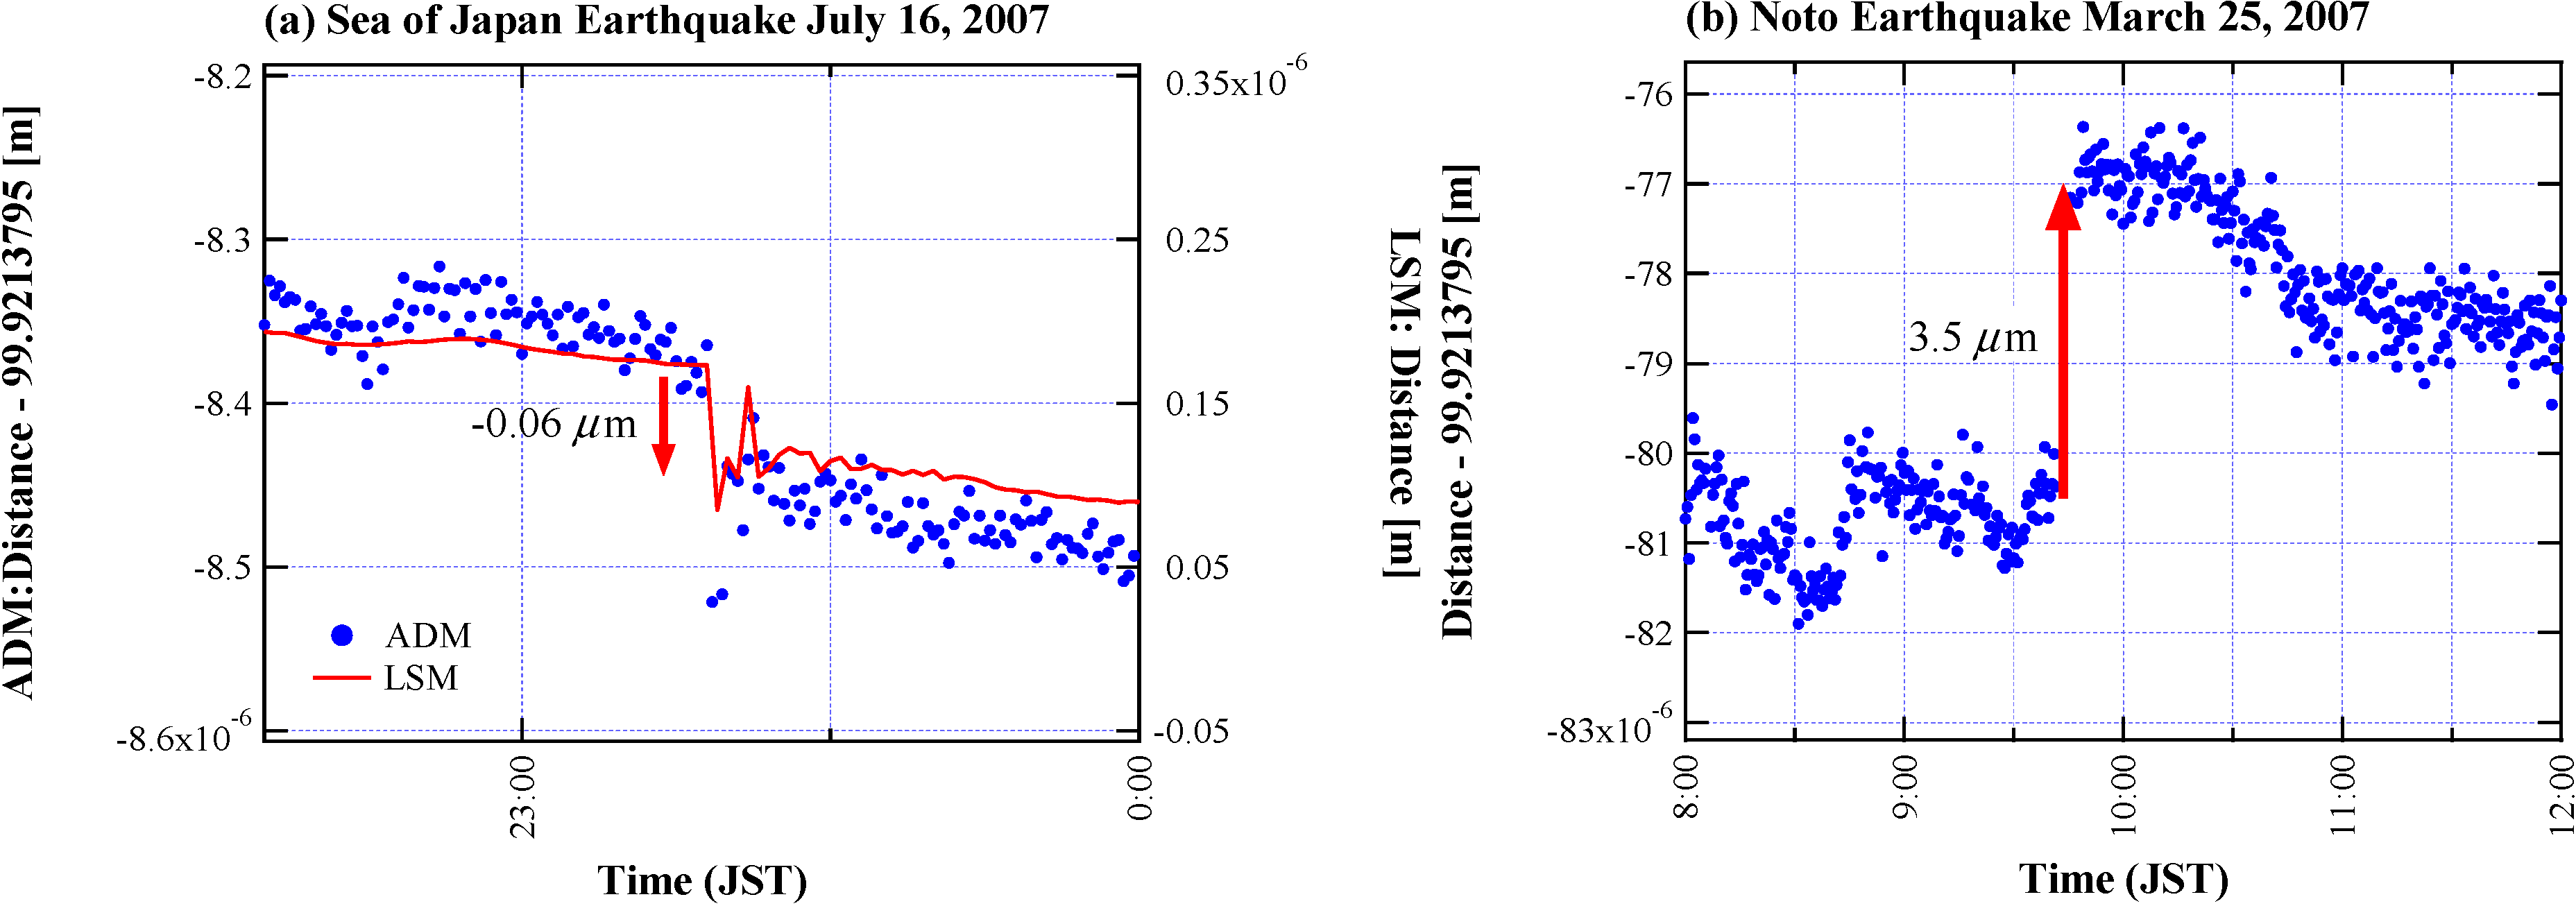
Two sets of data recorded for earthquakes that occurred in 2007 are shown in Figure 8. These data demonstrate the capability of the ADM in determining the strain steps invoked by these events. These results agree well with the theoretical strain steps calculated with a fault slip model (a detailed analysis is given in our earlier publication [3]). For a relatively small earthquake (the example in Figure 8a), the LSM gave almost the same result as the ADM with better resolution of approximately one order of magnitude. However, when a large earthquake, such as the Noto earthquake (see Figure 8b), occurs in the vicinity of the observatory, it may very likely overwhelm the LSM capability to track the fringe, and only the ADM can observe the strain step. Therefore, it is advantageous to use both instruments next to each other complementarily to realize a simultaneously large range and high resolution.
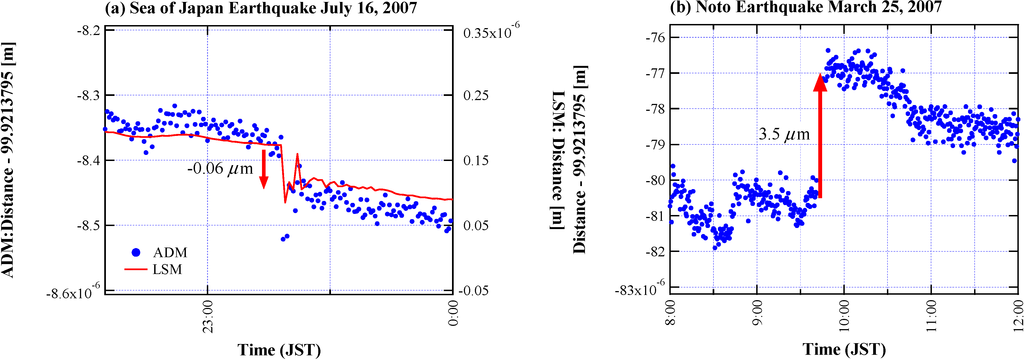
Figure 8.
Strain steps caused by earthquakes observed at the Kamioka site. (a) A relatively small change in distance close to the ADM resolution was observed for the small earthquake. Results were confirmed by the co-located LSM based on the standard Michelson interferometer with better resolution. (b) A large step was caused by the nearby and large earthquake. The LSM failed to track this step, because of fringe miscounting. The contribution of Earth’s tide has been simulated and removed from the observed data in both plots. A detailed analysis of these events is described in our earlier publication [3].
3.3. Alignment Control
The cavity mirrors were aligned initially by adjusting the DC offset of the PZT driver manually to maximize the transmitted beam intensity. The automatic alignment control system was successful in maintaining this optimal state during the observations. However, its relocking process sometimes introduced step changes in the absolute distance measurement, as described earlier.
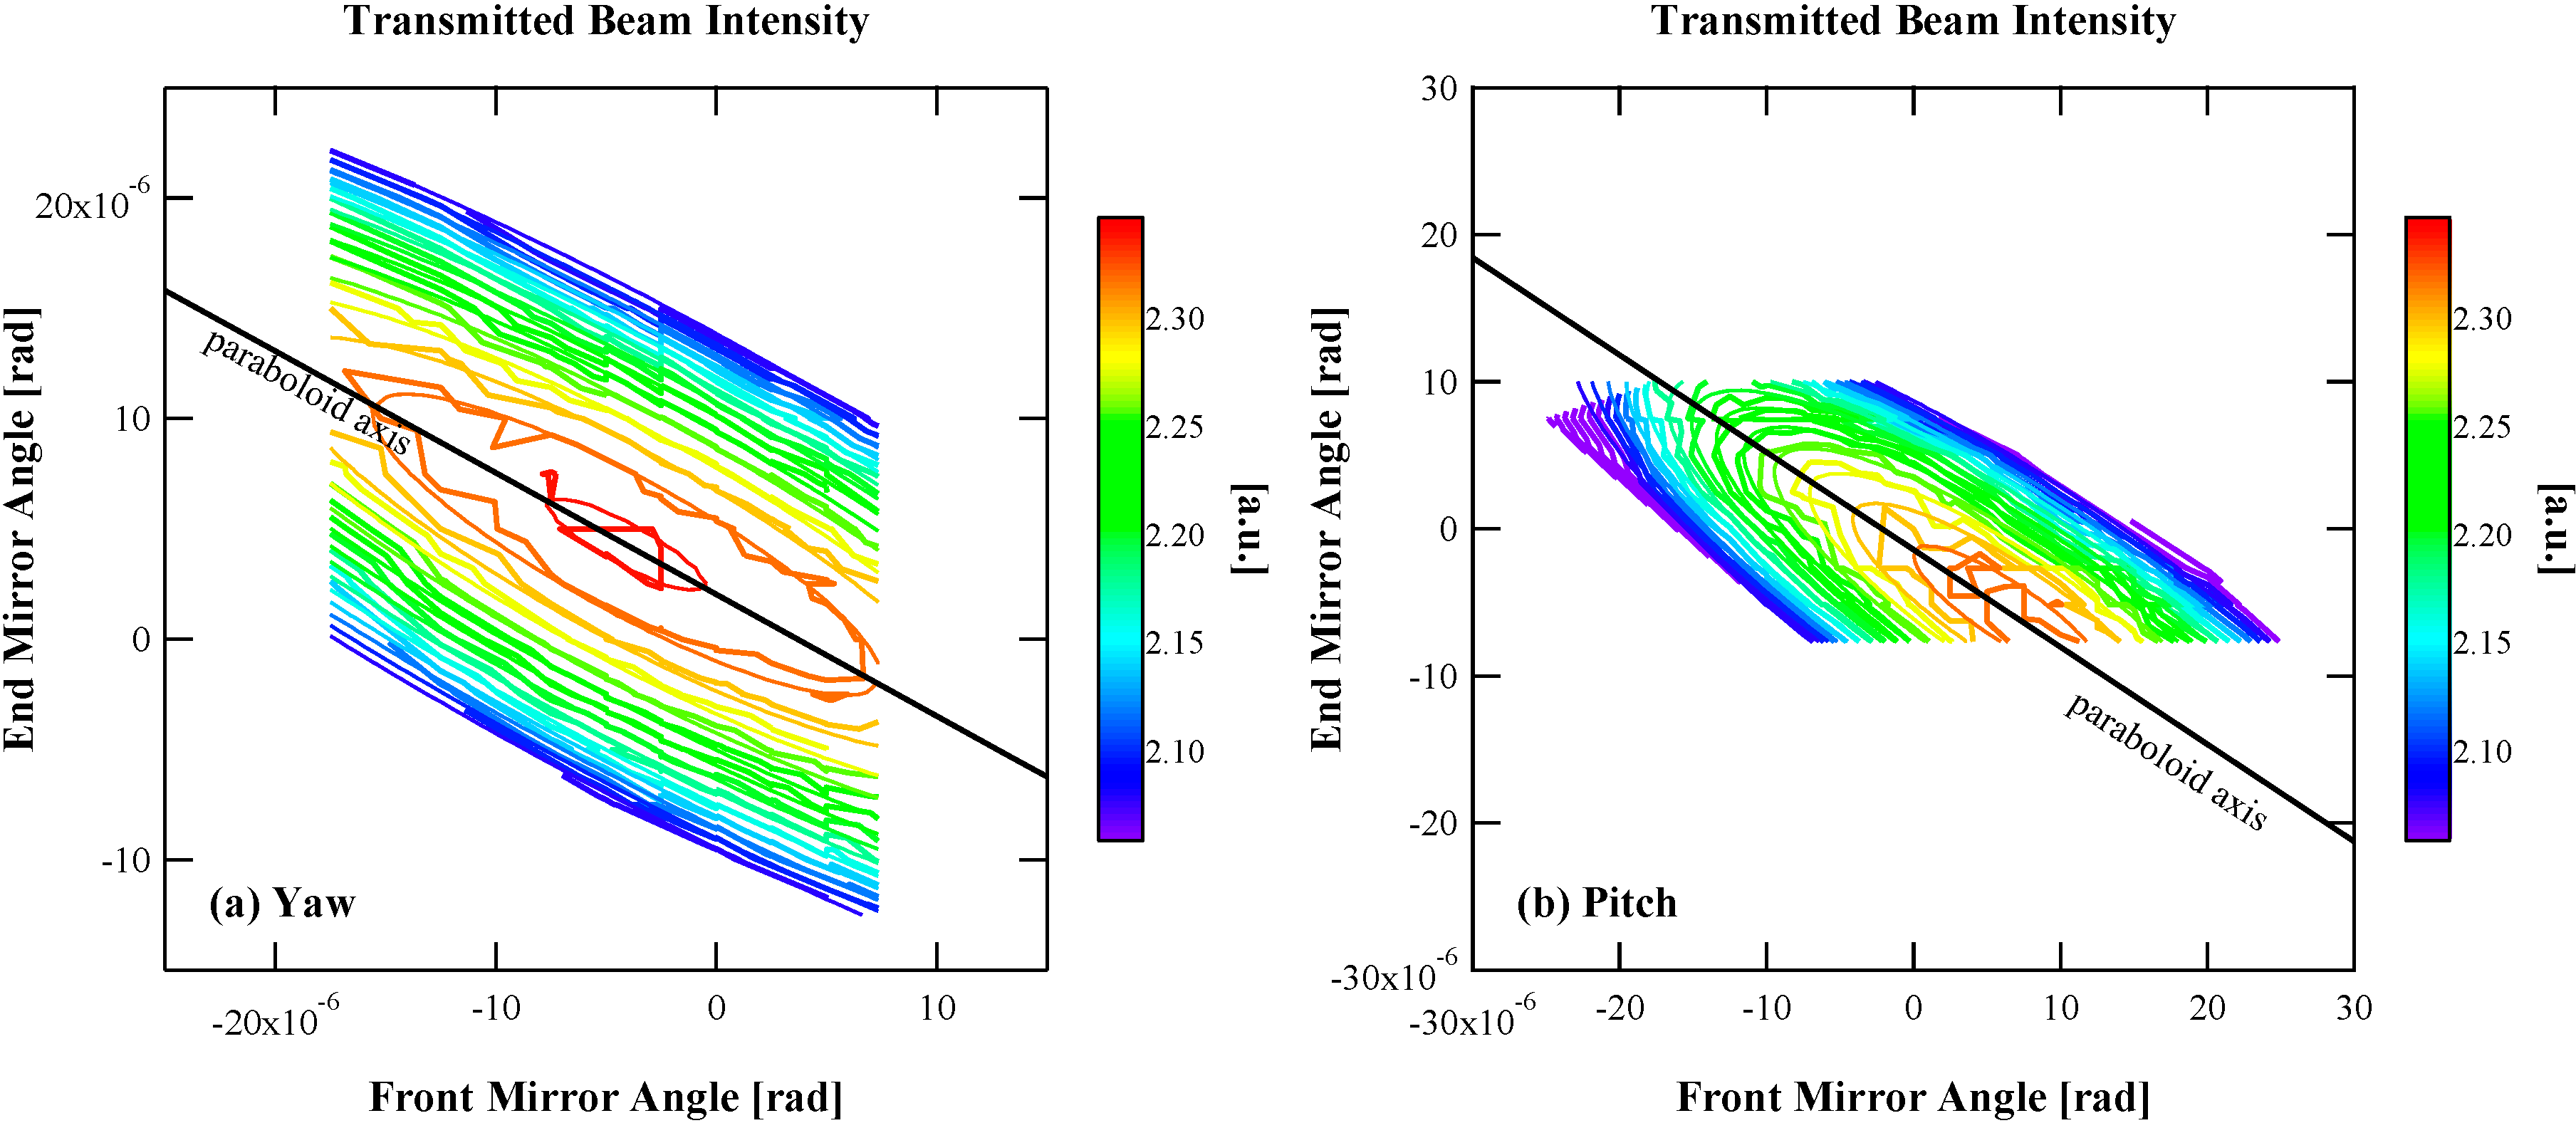
To design the servo control circuits, the cavity’s response to misalignment was characterized. The transmitted beam intensity was measured by misaligning the front and end mirrors intentionally by changing the DC offset of the PZT driver to obtain the contour maps shown in Figure 9. By repeating the same measurements several times, the skew angle was determined to be 31.0 ± 3.3°, which corresponds to ~162 m for the radius of curvature of the end mirror and 3.6 mm for the beam waist size, according to the theoretical model. This is reasonable, because the design value for the radius of curvature was 150 m and is close to the estimation. This is also because the beam waist size was visually estimated to be ~4 mm (it was not measured precisely).
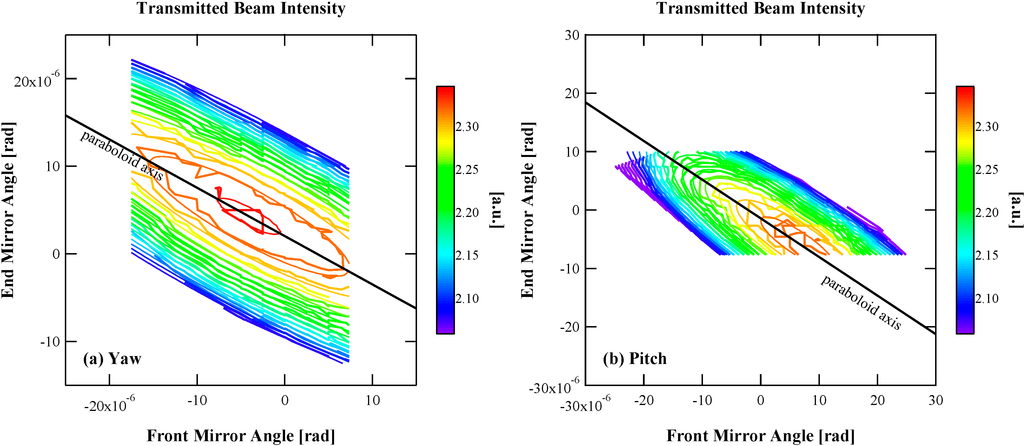
Figure 9.
Transmitted beam intensity (actual measurements). The intensity of the beam transmitted from the cavity was monitored by the photo detector located behind the end mirror. These maps were acquired by misaligning the mirrors intentionally in yaw (a) and pitch (b) directions. The thick contours are drawn by using measured data, and the thinner ones are the results from paraboloid fitting. These measurements were repeated several times to determine the skew angles and to validate the model calculation.
From the servo signals in the automatic alignment control system, it was revealed that the tilt angles of the cavity mirrors wobble by the order of 10−6 radians over several days. This would cause the error of 10−9 m in the absolute distance determination if the misalignment were not compensated for, assuming that the beam was off of the front mirror center by 1 mm. This is comparable to the potentially achievable resolution of the ADM without glitches that should be removed in the future. In addition, since larger changes of mirror angles are anticipated in a longer period (not confirmed during this study), we conclude that the automatic alignment control is crucial in ADMs.
4. Conclusions
We installed the ADM in the Kamioka underground observatory for geophysical studies. The measurement principle of the instrument is based on the resonant sideband technique in which the absolute length of a 100-m optical cavity fixed to the bedrock is derived accurately from the VCXO frequency used to create the modulated sidebands that keep resonating with the optical cavity. An automatic control system with a mechanical modulation technique was used to maintain optimal cavity alignment. The response of the optical cavity to misalignment was characterized and modeled in detail to obtain a deeper understanding of the system and to design the alignment control.
The effective resolution of the ADM was evaluated to be of the order of 10−8 to 10−7 m, and the potential resolution is one order of magnitude better. These values are close to the stability of the atomic clock, which defines the achievable performance fundamentally. The main cause of the degradation was the discrete steps and glitches of the VCXO frequency, which was occasionally observed before and after the lock loss and recovery processes of the VCXO and alignment control systems. These effects were not removed completely, but were mitigated to realize a resolution sufficient for geophysical research. The instrument was able to record a myriad of events over several years of operation, including earthquakes and tidal strain. These observations were useful for validating the theoretical model that is used to estimate coseismic crustal deformations [3]. We were able to record the large strain step induced by a nearby earthquake that overwhelmed the LSM installed in the same place. This is because of the fundamental advantage of the ADM, which is its capability to determine absolute distances. Therefore, observatories that contain both types of interferometers to complement one another would be most effective.
From the metrological point of view, the ADM is a successful example of an observation system based on a combination of a precise laser interferometry and a stable quantum standard time base. This sort of approach is supposed to be effective for not only length determination, but also other types of geophysical observations, as the research area covers a wide range of space time and requires constant references.
Acknowledgments
This study was partially supported by a Grant-in-Aid for Scientific Research (A) (18204039), the Japan Society for the Promotion of Sciences, by the Earthquake Research Institute Cooperative Research Program (2006-B-04), by the Institute for Cosmic Ray Research Inter-University Research Program and by the Disaster Prevention Research Institute Cooperative Research Program (16G-01).
Author Contributions
Akiteru Takamori made the model on cavity alignment described in this article. He also developed the automatic alignment control and autonomous relocking systems. Akito Araya made the total design of the instrument and developed the other control systems. They installed and operated the ADM. Wataru Morii was responsible for acquisition and processing of the observation data. Souichi Telada developed the sideband modulation technique and contributed to the ADM design. Takashi Uchiyama made major contribution in the operation and investigation for noise mitigation of the ADM. Masatake Ohashi was in charge of the R&D program and supervised the construction and operation of the instrument.
Conflicts of Interest
The authors declare no conflict of interest.
References
- Benioff, H. Fused-quartz extensometer for secular, tidal, and seismic strains. Geol. Soc. Am. Bull. 1959, 70, 1019–1032. [Google Scholar] [CrossRef]
- Mentes, G. Quartz tube extensometer for observation of Earth tides and local tectonic deformations at the Sopronbanfalva Geodynamic Observatory, Hungary. Rev. Sci. Instrum. 2010, 81, 074501. [Google Scholar] [CrossRef]
- Araya, A.; Takamori, A.; Morii, W.; Hayakawa, H.; Uchiyama, T.; Ohashi, M.; Telada, S.; Takemoto, S. Analyses of far-field coseismic crustal deformation observed by a new laser distance measurement system. Geophys. J. Int. 2010, 181, 127–140. [Google Scholar] [CrossRef]
- Fukuda, S.; Fukuda, Y.; Hayakawa, T.; Ichihara, E.; Ishitsuka, M.; Itow, Y.; Kajita, T.; Kameda, J.; Kaneyuki, K.; Kasuga, S.; et al. The Super-Kamiokande detector. Nucl. Instrum. Methods Phys. Res. A 2003, 501, 418–462. [Google Scholar] [CrossRef]
- Suekane, F. KamLAND Collaboration. KamLAND. In Proceedings of International Workshop on Nuclear Physics 27th Course—Nutrinos in Cosmology, in Astroparticle and Nuclear Physics, Sicily, Italy, 19 September 2005; Volume 57, pp. 106–126.
- Miyoki, S.; Uchiyama, T.; Yamamoto, K.; Ohashi, M.; Kuroda, K.; Akutsu, T.; Kamagasako, S.; Nakagawa, N.; Tokunari, M.; Kasahara, K. The CLIO project. Class. Quantum Gravity 2006, 23, S231–S237. [Google Scholar] [CrossRef]
- Kuroda, K.; Ohashi, M.; Miyoki, S.; Tatsumi, D.; Sato, S.; Ishizuka, H.; Fujimoto, M.K.; Kawamura, S.; Takahashi, R. Large-scale cryogenic gravitational wave telescope. Int. J. Mod. Phys. D 1999, 8, 557–579. [Google Scholar] [CrossRef]
- Kano, Y.; Yanagidani, T. Broadband hydroseismograms observed by closed borehole wells in the Kamioka mine, central Japan: Response of pore pressure to seismic waves from 0.05 to 2 Hz. J. Geophys. Res.: Solid Earth 2006, 111, B03410. [Google Scholar] [CrossRef]
- Takemoto, S.; Araya, A.; Akamatsu, J.; Morii, W.; Momose, H.; Ohashi, M.; Kawasaki, I.; Higashi, T.; Fukuda, Y.; Miyoki, S.; et al. A 100 m laser strainmeter system installed in a 1 km deep tunnel at Kamioka, Gifu, Japan. J. Geodyn. 2004, 38, 477–488. [Google Scholar] [CrossRef]
- Araya, A.; Morii, W.; Hayakawa, H.; Takamori, A.; Uchiyama, T.; Ohashi, M.; Yamada, I.; Telada, S.; Takemoto, S. Broadband observation with laser strainmeters and a strategy for high resolution long-term strain observation based on quantum standard. J. Geod. Soc. Jpn. 2007, 53, 81–97. [Google Scholar]
- Drever, R.W.P.; Hall, J.L.; Kowalski, F.V.; Hough, J.; Ford, G.M.; Munley, A.J.; Ward, H. Laser phase and frequency stabilization using an optical-resonator. Appl. Phys. B 1983, 31, 97–105. [Google Scholar]
- Kogelnik, H.; Li, T. Laser beams and resonators. Appl. Opt. 1966, 5, 1550–1567. [Google Scholar] [CrossRef]
- Araya, A.; Telada, S.; Tochikubo, K.; Taniguchi, S.; Takahashi, R.; Kawabe, K.; Tatsumi, D.; Yamazaki, T.; Kawamura, S.; Miyoki, S.; et al. Absolute-length determination of a long-baseline Fabry-Perot cavity by means of resonating modulation sidebands. Appl. Opt. 1999, 38, 2848–2856. [Google Scholar] [CrossRef]
- Tochikubo, K. Development of 300-m Fabry-Perot Cavity with Automatic Alignment Control; University of Tokyo: Tokyo, Japan, 1999. [Google Scholar]
- Matsumoto, K.; Sato, T.; Takanezawa, T.; Ooe, M. GOTIC2: A program for computation of oceanic tidal loading effect. J. Geod. Soc. Jpn. 2001, 47, 243–248. [Google Scholar]
- Takemoto, S.; Momose, H.; Araya, A.; Morii, W.; Akamatsu, J.; Ohashi, M.; Takamori, A.; Miyoki, S.; Uchiyama, T.; Tatsumi, D.; et al. A 100 m laser strainmeter system in the Kamioka Mine, Japan, for precise observations of tidal strains. J. Geodyn. 2006, 41, 23–29. [Google Scholar] [CrossRef]
© 2014 by the authors; licensee MDPI, Basel, Switzerland. This article is an open access article distributed under the terms and conditions of the Creative Commons Attribution license (http://creativecommons.org/licenses/by/3.0/).
