1. Introduction
Urban air pollution remains one of the most pressing environmental and public health challenges of the 21st century. According to the World Health Organization, over 4.2 million premature deaths occur annually due to ambient air pollution, with fine particulate matter (PM2.5) identified as the primary contributor [
1]. Cities located in topographic basins are particularly vulnerable due to the combined effects of atmospheric inversion layers, limited dispersion capacity, and concentrated emission sources [
2].
Almaty, the largest city in Kazakhstan with a population exceeding 2.2 million, is situated in a mountain basin at the northern foothills of the Trans-Ili Alatau range at an elevation of approximately 700–900 m above sea level. This geographical setting creates a natural bowl that traps pollutants, particularly during temperature inversion events frequent during the heating season (October–March). The combination of vehicular emissions, residential heating, and industrial activities results in PM2.5 concentrations that regularly exceed WHO guidelines by a factor of 5–10 during winter months [
3]. Ground-based monitoring at the US Embassy records an annual mean PM2.5 of 39.2 µg/m
3, with daily peaks exceeding 250 µg/m
3 [
4]. Road transport accounts for an estimated 60–70% of NOx emissions and 30–40% of PM2.5 emissions in the city center, with 797,000 registered vehicles as of 2025, of which 31% are older than 20 years [
5]. IQAir ranked Almaty among the top 10 most polluted cities globally on multiple occasions [
6], while the World Bank estimated that air pollution costs the Kazakhstani economy over
$10.5 billion annually [
7].
Despite this severity, the quantitative relationship between real-time traffic flow and ambient air quality remains poorly characterized for Central Asian cities, primarily due to the lack of integrated monitoring infrastructure [
2]. Traditional monitoring systems rely on a sparse network of stationary stations with limited public data access and incompatible formats [
4]. Source apportionment studies using Positive Matrix Factorization and HYSPLIT analysis trajectory have identified dominant emission sources [
8], and broader regional analyzes have confirmed Central Asia as an emerging global hotspot for air pollution [
2], yet no study has examined traffic–air quality relationships in Almaty using real-time co-located data.
Spatial interpolation methods such as Ordinary Kriging and Inverse Distance Weighting can partially compensate for monitoring gaps [
9,
10], but their reliability is strongly condition-dependent. Hybrid Kriging–ML methods have been shown to better capture nonlinear spatial patterns in heterogeneous terrain [
11], and combining deep learning with Kriging has improved spatio-temporal prediction accuracy [
12]—approaches relevant to Almaty’s complex topography. Granger causality methods have been applied to study pollutant–meteorology interactions in Jakarta [
13], inter-city PM2.5 propagation in China [
14], and land-use-specific pollutant dynamics in Malaysia [
15], but such analyzes have not been conducted for Almaty. Convergent cross-mapping has further revealed bidirectional feedback between pollution and local climate [
16], a mechanism particularly relevant in mountain basin settings.
Deep learning has become the dominant paradigm for short-term PM2.5 forecasting. Zaini et al. systematically evaluated CNN, LSTM, and hybrid CNN-LSTM architectures, identifying hybrid spatial-temporal models as most promising [
17]. Li et al. benchmarked LSTM, CNN-LSTM, Transformer, and Transformer-LSTM models for a basin city like Almaty, demonstrating that meteorological integration and specialized architectures are required for topographically complex environments [
18]. Zhang et al. proposed spatial-temporal attention convolutional networks that incorporate pollutant dispersion dynamics [
19], while Du et al. showed through interpretable ML analysis that traffic density correlates with PM2.5 but is rarely used as a real-time predictive feature [
20]. Traffic emission factors are standardized in the EMEP/EEA Guidebook [
21], which provides the methodological basis for vehicle-level CO
2 estimation in the present study.
The digital twin (DT) paradigm has recently extended from engineering systems to urban environmental monitoring. Saheer et al., in a systematic review of 100 studies, identified air quality management as a central DT application domain enabling real-time monitoring and proactive management [
22]. Teutscher et al. demonstrated a DT framework integrating CFD simulations with live meteorological data, achieving hourly spatial pollution updates [
23]. Bibri et al. reviewed AI–DT synergies in smart city planning across 100+ studies, noting limited practical implementations in developing regions [
24]. Jayachandran et al. proposed a layered smart city DT architecture with LSTM-based AQI forecasting integrated into a 3D urban model [
25]. However, Carter et al. found only five existing urban DTs that model atmospheric pollution, with even fewer incorporating live sensor data [
26], confirming that the transition from monitoring to intervention remains an open challenge.
The review reveals four critical gaps. First, integrated real-time platforms combining traffic and air-quality data have not been developed for data-sparse Central Asian cities such as Almaty [
17,
18,
19]. Second, correlation and lead–lag analysis of real-time traffic–air-quality relationships has not been applied in the region [
13,
14,
16]. Third, existing urban digital-twin systems rarely integrate multiple analytical components—monitoring, emission estimation, exposure assessment, and forecasting—into a single reproducible platform [
22,
26]. Fourth, the specific challenges of mountain-basin cities with aging vehicle fleets and sparse sensor networks require localized solutions [
2,
5].
This study addresses these gaps through the following contributions:
A web-based digital twin prototype for urban traffic and air-quality monitoring in Almaty, integrating the TomTom Traffic API [
27], OpenWeatherMap Air Pollution API [
28], WAQI [
29], and official population statistics [
30] within a single analytical platform.
A unified station-based dataset combining traffic indicators and air-quality measurements by location and timestamp, enabling the calculation of road congestion, traffic density, vehicles per hour, estimated CO2 emissions, and a population exposure index.
An empirical analysis of traffic–pollution relationships (PM2.5, NO2, CO, road congestion, and vehicle intensity) using Pearson correlation, station-level comparison, and lead–lag (temporal precedence) analysis of traffic and gaseous pollutants.
A preliminary short-horizon PM2.5 nowcasting experiment using lag features, rolling averages, and traffic-related variables, comparing Linear Regression, Random Forest, and Gradient Boosting against a persistence baseline across temporal resolutions.
A reproducible prototype implementation with automated background data collection, local CSV/SQLite storage, interactive dashboard visualization, and export functions for further statistical analysis.
The objective of this study is to develop and evaluate a web-based digital twin prototype for the integrated monitoring and analysis of the relationship between traffic load and air quality in Almaty, Kazakhstan.
2. Materials and Methods
2.1. Study Area
Almaty (43.24° N, 76.89° E) is the largest city in Kazakhstan, located in the southeastern part of the country at the northern foothills of the Trans-Ili Alatau mountain range. The city spans an elevation range of approximately 700–900 m above sea level and covers an area of over 680 km2 across eight administrative districts. The metropolitan area is situated in a semi-enclosed basin, open to the north and bounded by mountains rising to 4000–5000 m to the south and southeast.
This topographic setting is critical for air quality dynamics. During winter months (October–March), temperature inversions frequently form over the basin, trapping pollutants within a shallow planetary boundary layer of 200–500 m [
2]. The prevailing wind regime is characterized by mountain-valley breezes with generally low wind speeds (1–3 m/s) that limit pollutant dispersion.
The coordinates of monitoring points are presented in
Table 1.
Five monitoring points were selected to represent the principal transport corridors of Almaty rather than to provide uniform spatial coverage. Each corresponds to a functionally distinct part of the road network—the central zone and the northern, eastern, southern, and western transport corridors—chosen to capture differences in traffic intensity, road congestion, and air-pollution patterns across the city. The practical selection criteria were the availability of a matching road segment in the TomTom Traffic API and sufficient data completeness at each point; each station is associated with fixed geographic coordinates and a representative road segment used for traffic-flow and emission calculations (
Table 1). During the study period, real traffic coverage at the northern point proved sparse owing to limited TomTom segment availability, which is treated as a data-coverage limitation (
Section 4).
2.2. System Architecture
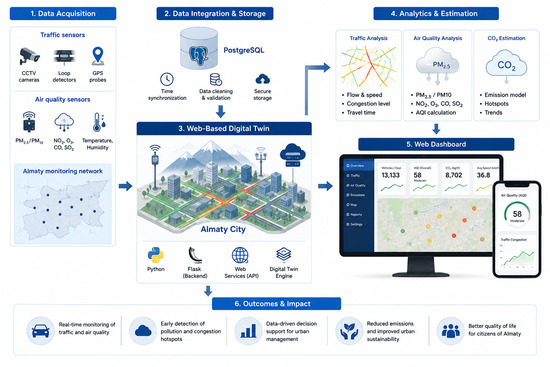
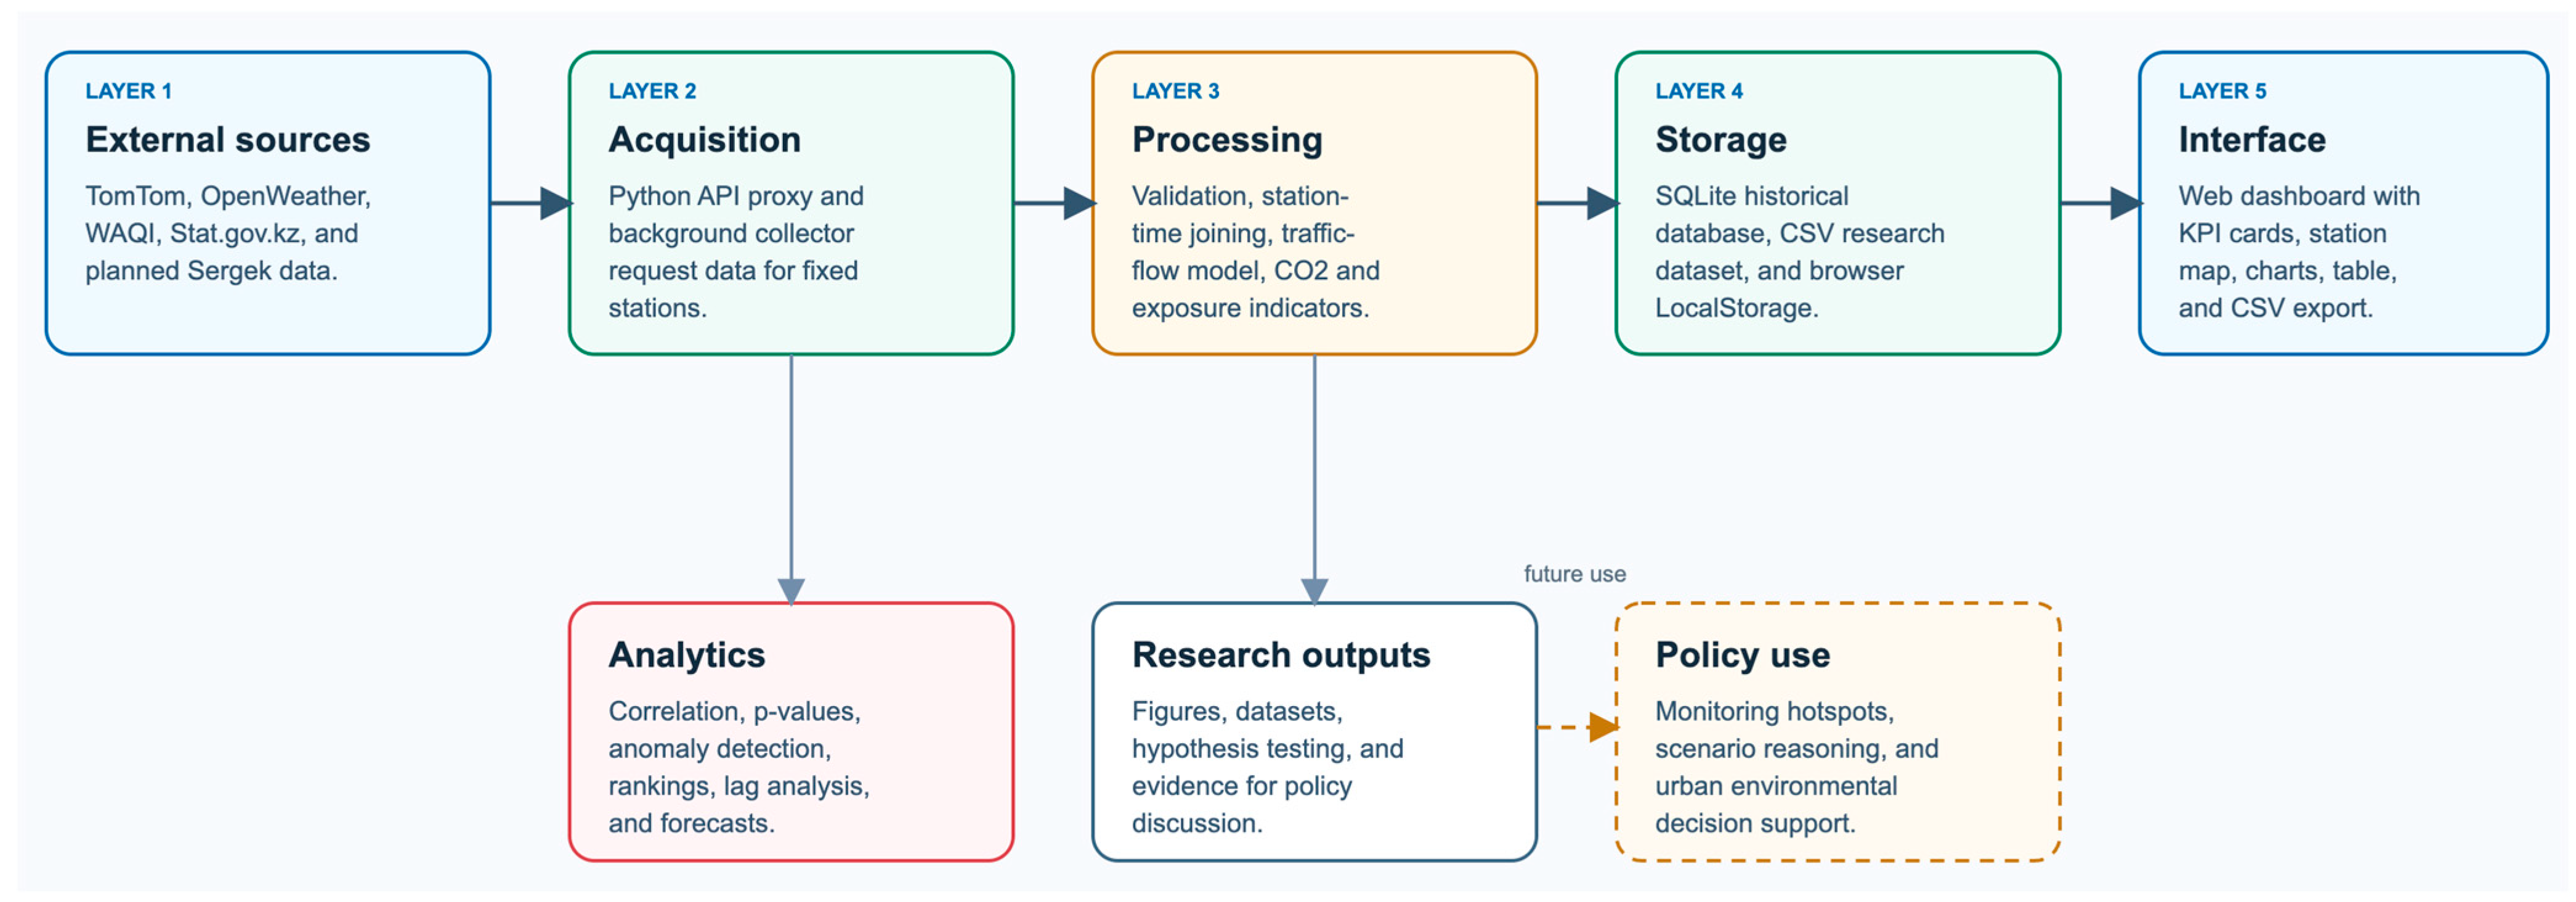
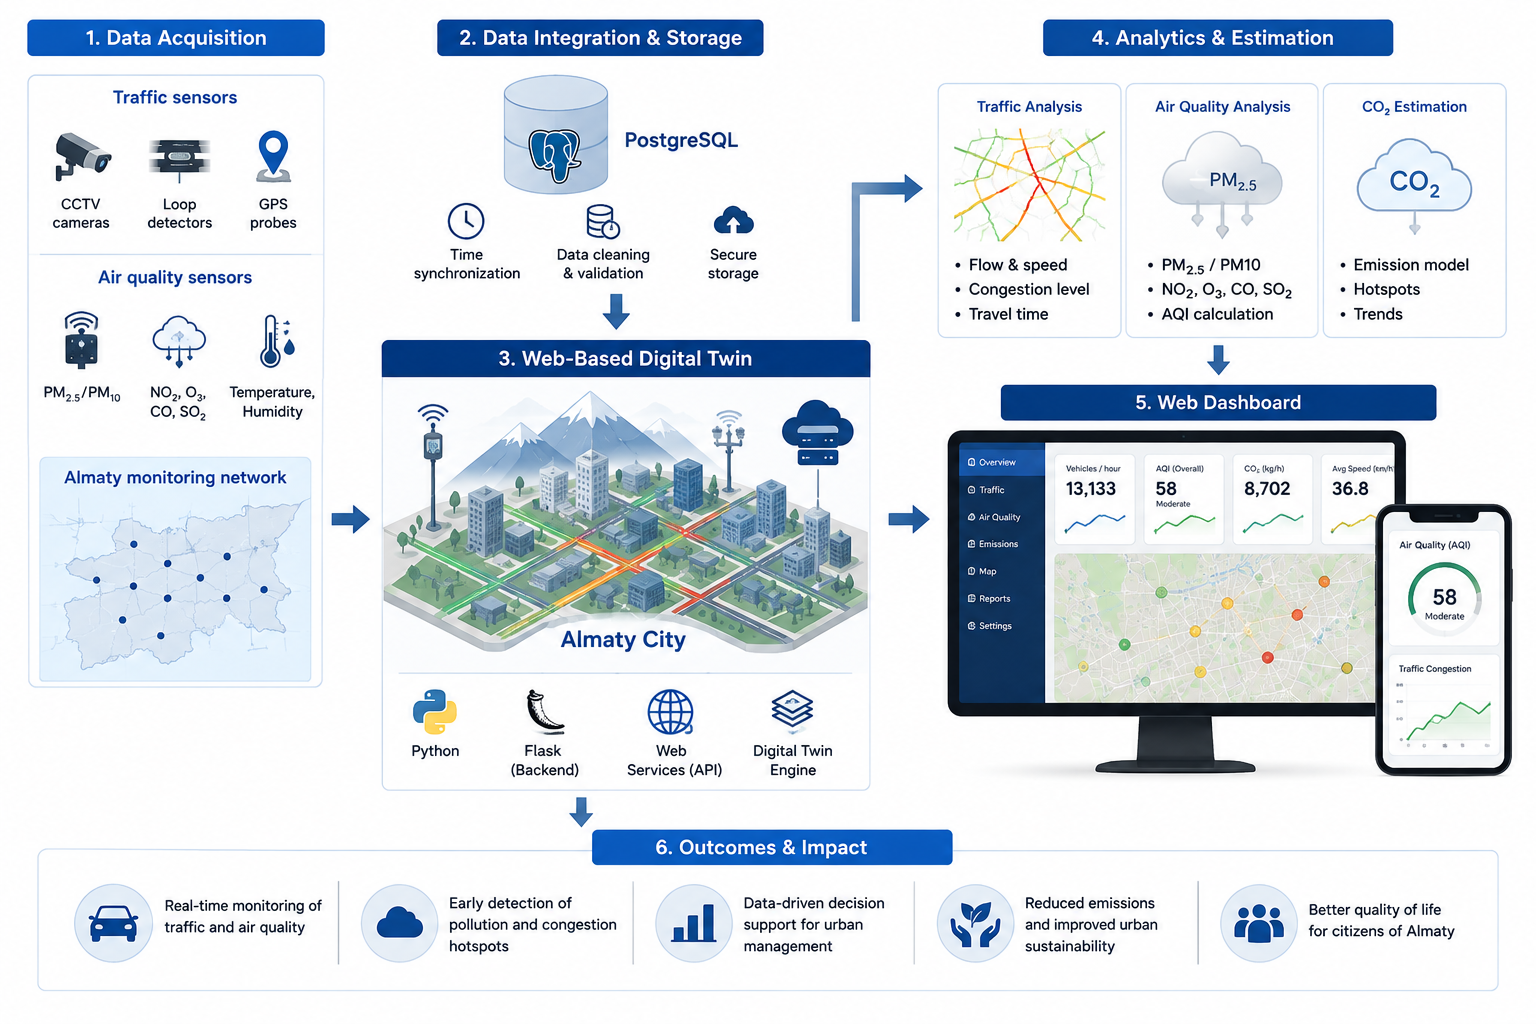
The proposed digital twin is implemented as a modular, web-based system for the integrated monitoring of traffic flow and air quality in Almaty. The architecture is organized into five functional layers: data acquisition, data collection, processing, storage, and visualization, as illustrated in
Figure 1.
The data acquisition layer interfaces with external services, including the TomTom Traffic API for speed and congestion data, OpenWeatherMap and WAQI for pollutant concentrations and meteorological context, and official population statistics from the Bureau of National Statistics of Kazakhstan. The Sergek city surveillance network is identified as a prospective data source for camera- and sensor-based traffic feeds.
The data collection layer consists of a Python-based (v3.12.4) API proxy server and an independent background collector. The proxy receives requests from the web application, queries external APIs, validates responses, and applies fallback procedures when data are unavailable. The background collector operates autonomously, periodically recording observations for each fixed monitoring station into local storage, thereby accumulating a historical dataset for statistical analysis and forecasting.
The processing layer transforms raw measurements into analytical indicators. For each station, the system computes traffic density, vehicles per hour, road congestion level, estimated CO2 emissions, an Air Pollution Index, and a Population Exposure Index. These derived metrics support station-level comparison, correlation analysis, anomaly detection, and short-term PM2.5 forecasting.
The storage layer persists processed data in a local SQLite 3.45.3 database for structured historical storage and exports records in CSV format for analysis and publication. Browser-side local storage is used for short-term retention of interface state.
The visualization layer is a browser-based dashboard developed in HTML, CSS, and JavaScript. It presents key urban indicators, station-level tables, traffic and air quality charts, correlation heatmaps, exposure hotspot maps, and forecasting results. The dashboard supports manual refresh, automatic updates, and CSV export.
Overall, the architecture is designed to be lightweight, reproducible, and extensible, with the analytical output layer supporting correlation studies, anomaly detection, hypothesis testing, and the preparation of datasets and figures for scientific publication. The system can further serve as a decision-support tool for identifying traffic and pollution hotspots and informing urban environmental management.
2.3. Data Sources and Data Collection
The digital twin integrates several external data sources to describe the traffic, environmental, meteorological, and population context of Almaty.
This table summarizes the main external data sources and variables used by the digital twin.
Data were collected for five fixed monitoring stations representing central, northern, eastern, southern, and western transport corridors of the city. Each observation is linked to a station identifier, geographic coordinates, timestamp, and data source label in
Table 2. Traffic data were obtained from the TomTom Traffic Flow Segment Data API. This source provides information about the road segment closest to the selected coordinates, including current speed and free-flow speed. These variables were used to calculate road congestion, traffic density, and vehicles per hour. Air quality data were collected mainly from the OpenWeather Air Pollution API, with WAQI used as an additional air quality source and metadata reference. The following pollutants were included in the dataset: PM2.5, PM10, NO
2, O
3, and CO. These indicators were used for pollution monitoring, correlation analysis, air quality indexing, and PM2.5 forecasting. Meteorological data were obtained from the OpenWeather Current Weather API. The system stores temperature, humidity, wind speed, and weather description. These variables provide additional environmental context and may be used in future forecasting models.
Population data were taken from the Bureau of National Statistics of the Republic of Kazakhstan. According to official statistics, the population of Almaty city as of April 1, 2026, was 2.359 million people. This value was used as a city-level population context for calculating the population exposure index. All collected data are stored in a unified station-time dataset. The system saves both processed indicators and source metadata, including traffic source, air quality source, weather source, and raw API responses. This structure supports reproducibility, validation, historical analysis, and further use of the dataset for statistical and machine learning models.
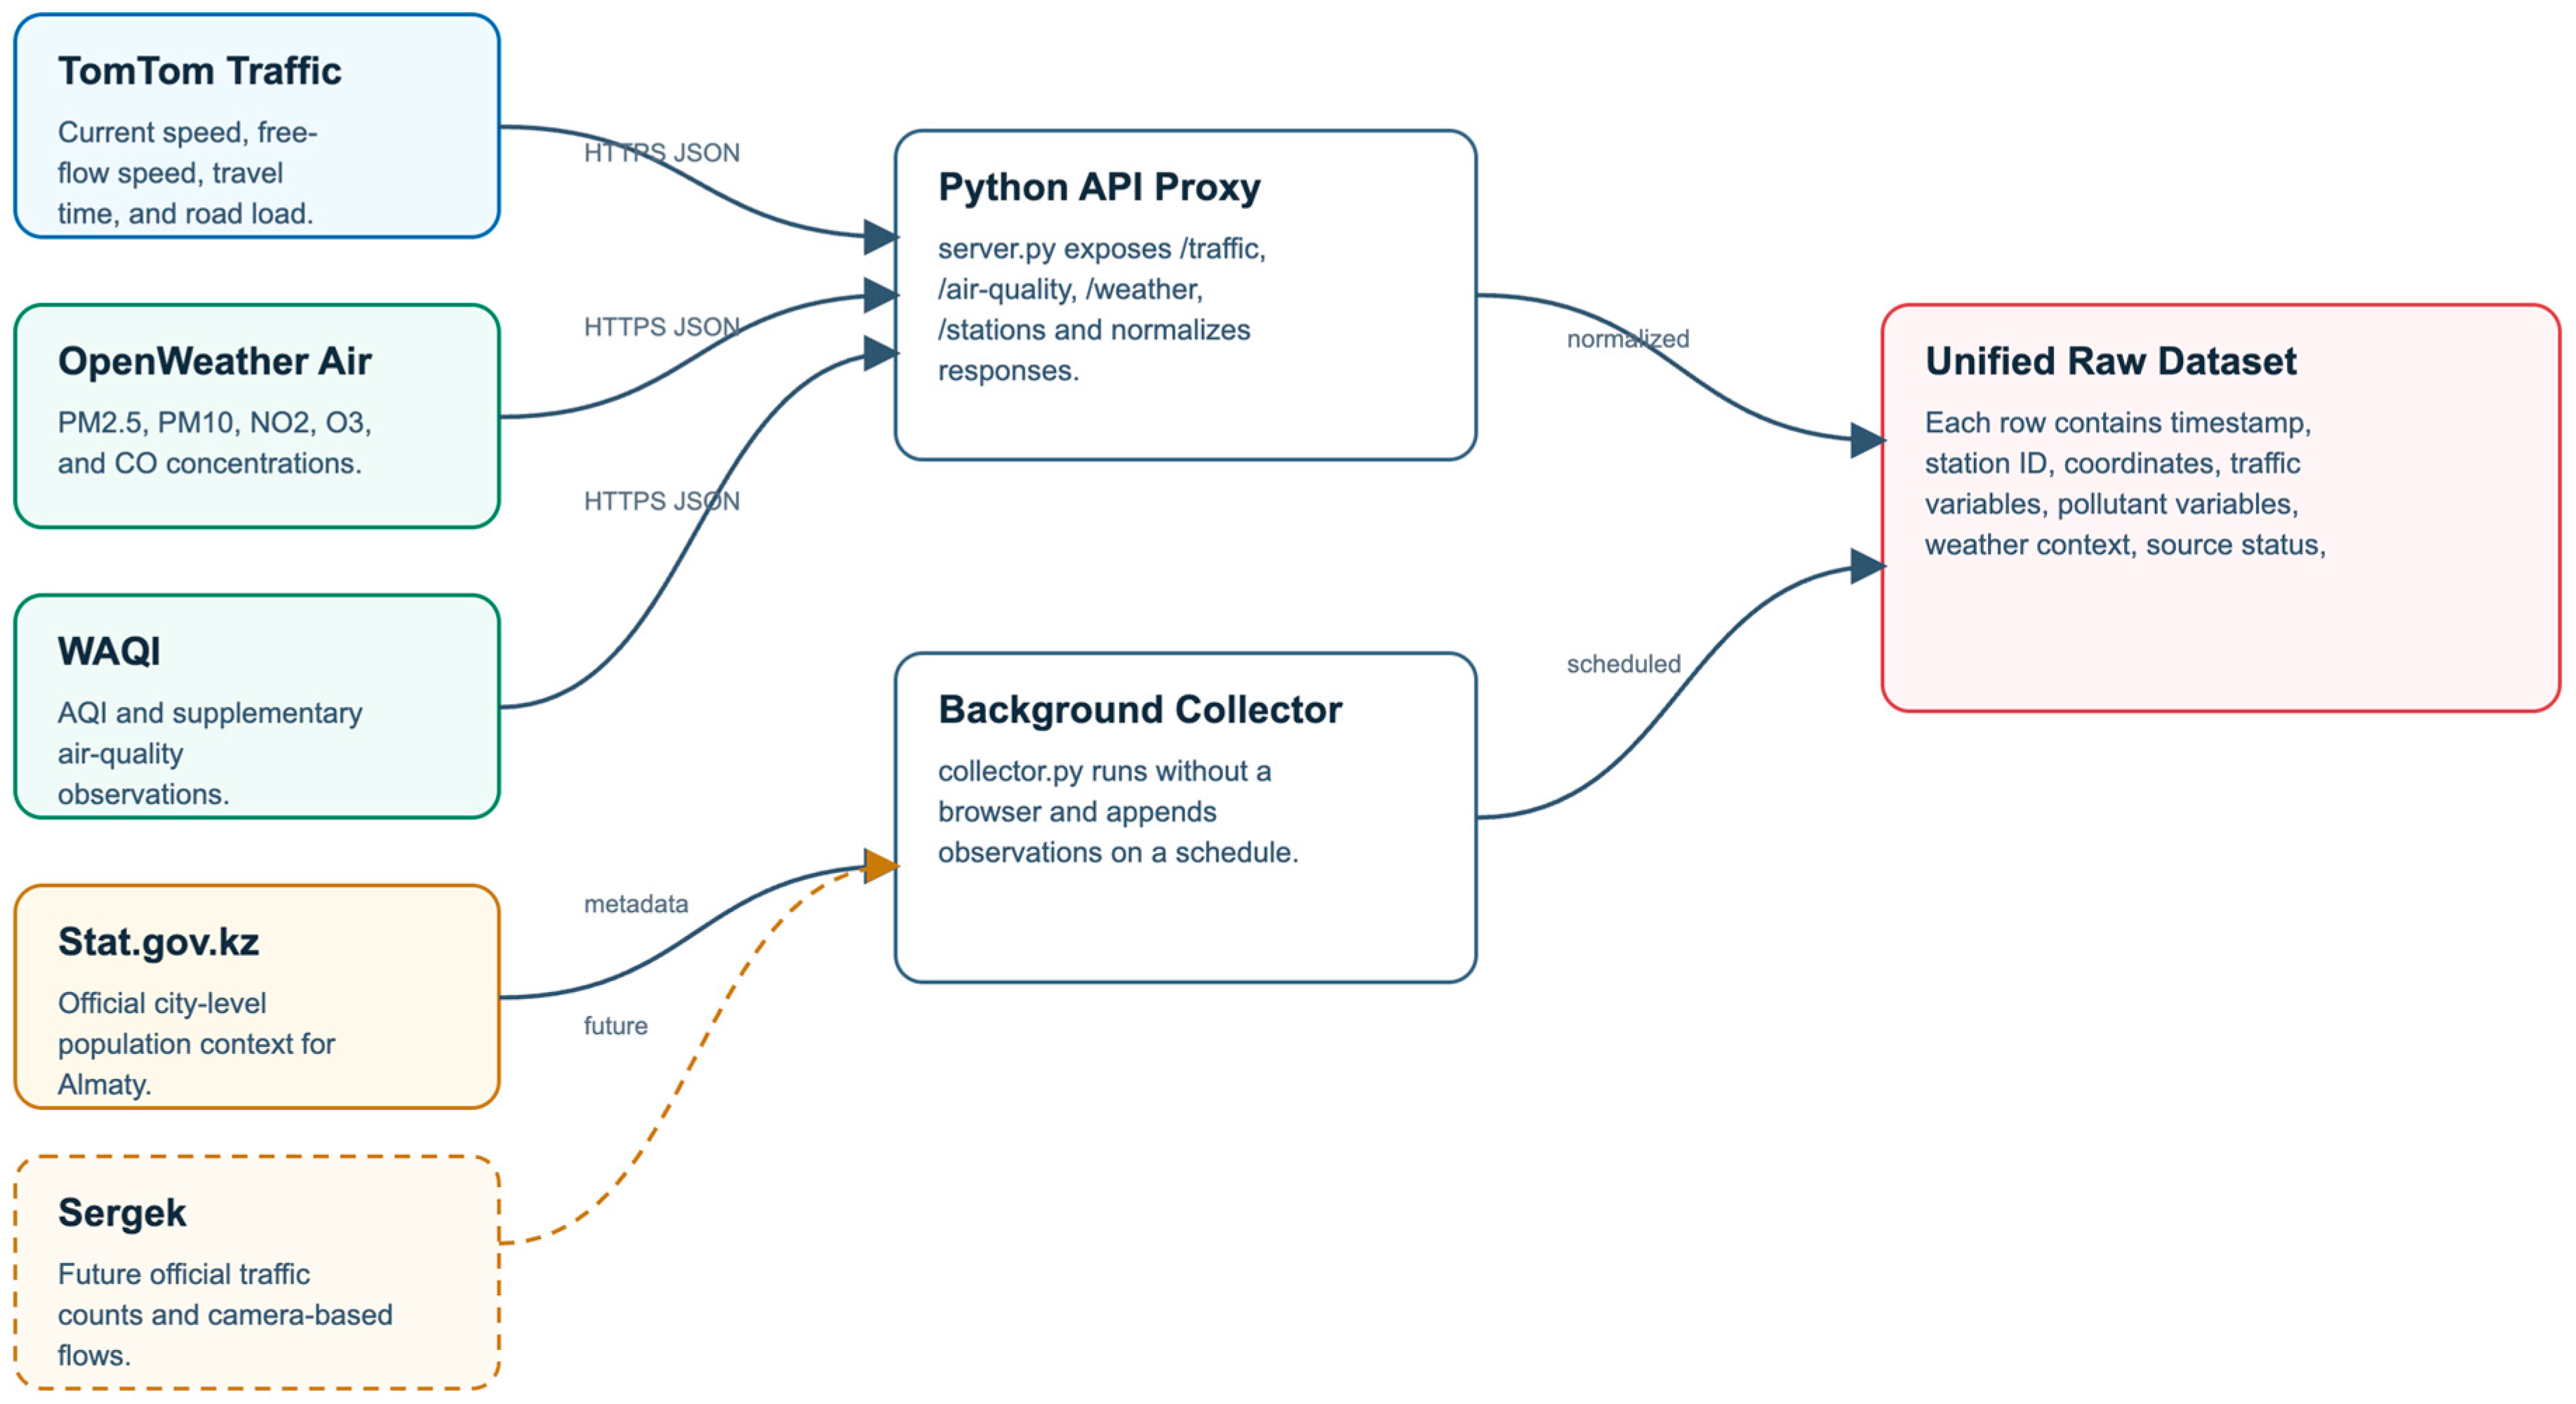
Figure 2 illustrates the data collection and integration module. The system receives traffic data from TomTom, air pollution data from OpenWeather and WAQI, weather data from OpenWeather, and population context from official statistics.
These sources are connected to the Python (version 3.12) API proxy and background collector in
Figure 2. The API proxy supports real-time dashboard requests, while the collector periodically stores observations without requiring an open browser. The result of this module is a unified station-time dataset.
The data collection workflow includes the following steps:
Select fixed monitoring stations and coordinates.
Request traffic, air quality, and weather data for each station.
Validate API responses and handle missing values.
Calculate derived indicators.
Save observations to SQLite and CSV storage.
Repeat the process in a collection cycle (nominal interval of approximately five minutes per station).
Because the external APIs (TomTom Traffic, OpenWeatherMap, and WAQI) refresh at different and independently determined rates, the collector does not attempt to match their native update frequencies. Instead, it queries all sources once per collection cycle and assigns a single common collector timestamp to every response obtained within that cycle. Only cycles in which live TomTom and air-quality responses were both available were retained for the co-located analysis, ensuring temporal alignment across the traffic, air-quality, and meteorological streams within each station-time record.
Data was collected over a 50-day deployment period, from 26 May 2026, to 16 July 2026, on a near real-time cycle of approximately one recording per station every five minutes. Since requests to external APIs were made in real time, actual responses were captured periodically over the 18 active days during this window. When the API returned incomplete data, the prototype’s fallback mechanism generated placeholder values to keep the system running; such records are identified by source title and excluded from scientific analysis (
Section 3.2). For prediction experiments, stored observations were converted to a fixed temporal resolution (15, 30, and 60 min), with 15 min resolution used as the base setting.
2.4. Data Processing
After data collection, all observations were converted into a single station-time dataset. Each record corresponds to one monitoring station at a specific point in time and includes station coordinates, traffic indicators, pollutant concentrations, meteorological variables, and source metadata. Because the original API observations were collected at irregular near-real-time intervals, temporal aggregation was required before time-series modeling. The station-time observations retained for scientific analysis were grouped by station and aligned to fixed time intervals. For each station-interval, the available observations were aggregated to obtain a representative value for the traffic, air-quality, and meteorological variables. The resulting dataset was then used for the construction of lagged variables, rolling-window features, and the next-step PM2.5 forecasting target. Three resolutions (15, 30, and 60 min) were evaluated in a sensitivity analysis (
Section 3.5), with the 15 min resolution used as the primary setting.
Accordingly, the temporal resolution of the raw dataset and the modeling dataset should be distinguished. The raw dataset consists of irregularly sampled near-real-time station-time observations (nominal ~5 min cycle), whereas the forecasting dataset has an effective temporal resolution of 15 min at the primary setting.
Traffic and air quality data were aggregated by station ID and observation time, allowing for comparison of traffic load and pollution indicators within a single spatiotemporal unit. Before calculating analytical metrics, the collected values were checked for missing, invalid, or extreme values. Numerical variables were converted to a consistent format, and predefined value ranges were applied to avoid unrealistic values. If an external API returned incomplete data, the prototype generated fallback values to maintain continuous operation; such records are identified by the source metadata field and were excluded from the scientific analysis. Traffic was estimated using a macroscopic traffic flow model. Initially, traffic density was calculated based on the ratio between the current speed and the free-flow speed. The number of vehicles per hour was then estimated as the product of density and speed. Traffic congestion was calculated as a composite indicator based on the modelled traffic density and the congestion value obtained from the API. CO
2 emissions were estimated using the number of vehicles per hour, road section length, and an emission factor. Air pollution indicators were processed using PM2.5, PM10, NO
2, O
3, and CO concentrations. A composite air pollution index was calculated as a weighted indicator combining these pollutants. Additionally, a population impact index was calculated as a proxy indicator combining pollution levels, traffic congestion, and Almaty’s population size at the city level. The processed data was stored using two complementary mechanisms for distinct purposes. SQLite serves as the primary local structured store for the autonomous background collector, providing transactional writes and repeated querying of historical records without a separate database server. CSV is used as an export format for downstream analysis in external environments (Python 3.12, Kaggle Notebooks, Excel 365, and statistical tools), which do not require a live database connection. SQLite was selected for its deployment simplicity, self-contained single-file operation, and independence from server infrastructure, which are appropriate for a single-writer prototype where concurrent-write limitations do not arise. We acknowledge that this design is intended for prototype-scale operation: for a production deployment with higher throughput and concurrent access, a scalable backend such as PostgreSQL/PostGIS, TimescaleDB, or a NoSQL time-series store would be adopted, and the intermediate CSV export could be replaced by a direct database or API interface.
where pollutant concentrations are expressed in µg/m
3, and the weights reflect the relative contribution of each pollutant to the composite index.
The Population Exposure Index (PEI) was computed as a preliminary proxy combining pollutant pressure, congestion, and city-level population:
where
P_population is a normalized population term (2,500,000 is a scaling denominator, not the actual city population of 2.359 million), and
P_pollutant is a weighted, normalized combination of pollutant concentrations and congestion. Unlike the air pollution index, the
PEI additionally incorporates population and congestion to approximate exposure pressure; it is intended as a preliminary proxy rather than a validated exposure model.
Since the system is currently implemented as a prototype, some metrics, including vehicles per hour and CO2 emissions, are model-based estimates rather than direct sensor measurements. Therefore, they should be interpreted as rough analytical metrics suitable for pilot analysis and methodology validation.
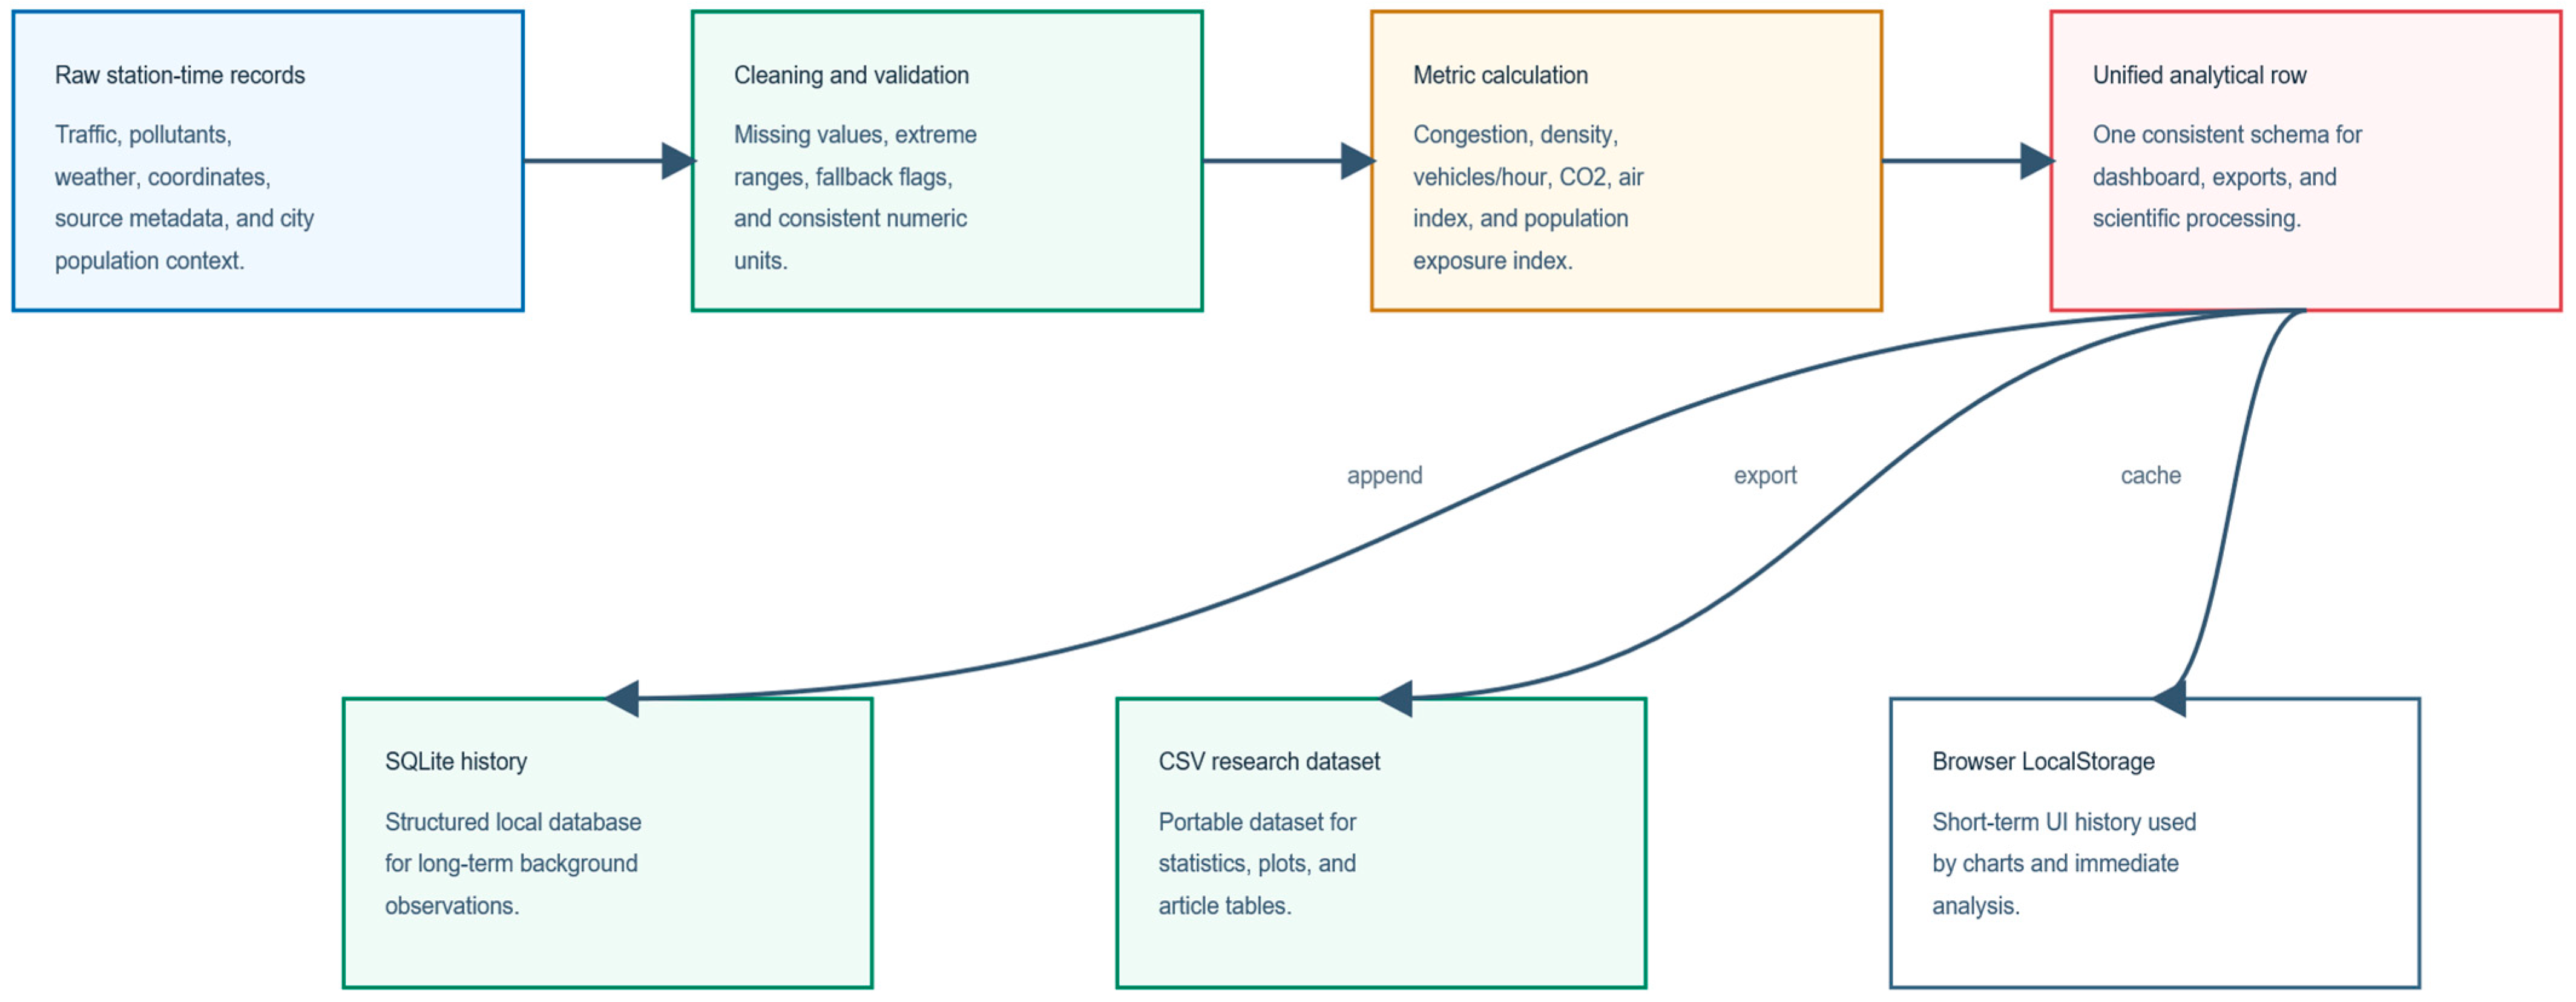
Figure 3 describes the data processing and storage workflow.
Raw data is cleaned, verified, and converted into analytical metrics. The system calculates road congestion, traffic density, vehicles per hour, CO2 emissions, an air pollution index, and a population impact index. After processing, the data is stored in SQLite for structured historical storage and exported to CSV for statistical analysis, visualization, and scientific reporting.
2.5. Analytical Methods
The analytical module of the digital twin was designed to evaluate the relationship between traffic activity and air quality indicators. The analysis was performed using the unified station-time dataset generated by the data collection and processing pipeline. The main variables included vehicles per hour, traffic density, road congestion, estimated CO2 emissions, PM2.5, PM10, NO2, O3, CO, meteorological parameters, and population exposure index.
First, descriptive statistics were calculated for each monitoring station. These statistics included mean, minimum, maximum, and standard deviation values for traffic flow, congestion, pollutant concentrations, and emissions. This allowed comparison of stations according to traffic intensity and pollution levels.
Second, correlation analysis was performed to estimate the strength and direction of relationships between traffic indicators and air quality variables. Pearson correlation coefficients were calculated for pairs of variables, including traffic flow and PM2.5, traffic flow and NO2, traffic flow and CO, congestion and PM2.5, and speed and pollutant concentrations. The statistical significance of correlations was assessed using p-values.
Third, station-level ranking was used to identify the most loaded and most polluted monitoring points. Stations were ranked by average vehicles per hour, estimated CO2 emissions, PM2.5 concentration, and population exposure index. This helped identify potential traffic and pollution hotspots within the monitored urban corridors.
Fourth, anomaly detection was applied to identify unusual observations in the historical dataset. Values that deviated strongly from the typical distribution of each variable were marked as potential anomalies. This step is important for detecting extreme pollution episodes, abnormal congestion, or possible data quality issues.
Finally, temporal analysis was used to examine changes in traffic and air quality over time. The dataset was grouped by hour of day and day of week to identify peak traffic periods, pollution accumulation patterns, and differences between weekdays and weekends. These methods provide the basis for interpreting the environmental impact of urban traffic and for preparing input features for forecasting models.
The following analytical methods were applied:
- -
Descriptive statistics;
- -
Pearson correlation analysis;
- -
p-value estimation;
- -
Station ranking;
- -
Anomaly detection;
- -
Hourly and weekly temporal analysis;
- -
Traffic-pollution scatter analysis;
- -
Population exposure assessment.
2.6. Forecasting Dataset Preparation
Short-term PM2.5 forecasting was conducted to evaluate the predictive potential of the accumulated station-time dataset. The task was formulated as a supervised regression problem, where the target variable was PM2.5 concentration at the subsequent time step (t + 1).
The original CSV dataset was transformed into a modeling dataset through timestamp parsing, chronological sorting by station, extraction of temporal variables, generation of lag features, rolling mean features, and creation of the target variable in
Table 3. Temporal variables included hour of day, day of week, and weekend indicator. Lag features were computed for
PM2.5 and traffic flow at 1, 2, 3, 6, and 12 time steps prior to the current observation. Rolling mean features for
PM2.5 were calculated over 3-step and 6-step windows to represent short-term pollution trends.
All features listed in
Table 3 were used in the full-feature forecasting experiment: pollutant concentrations (
PM2.5,
PM10,
NO2,
O3,
CO), air_index, traffic variables (speed, density, vehicles per hour, congestion), CO
2, the Population Exposure Index, temporal features (hour, day of week, weekend flag),
PM2.5 lags and rolling means, and traffic lags. Identifiers (timestamp, station_id, station_name) and the target variable (next-step
PM2.5) were not used as predictors.
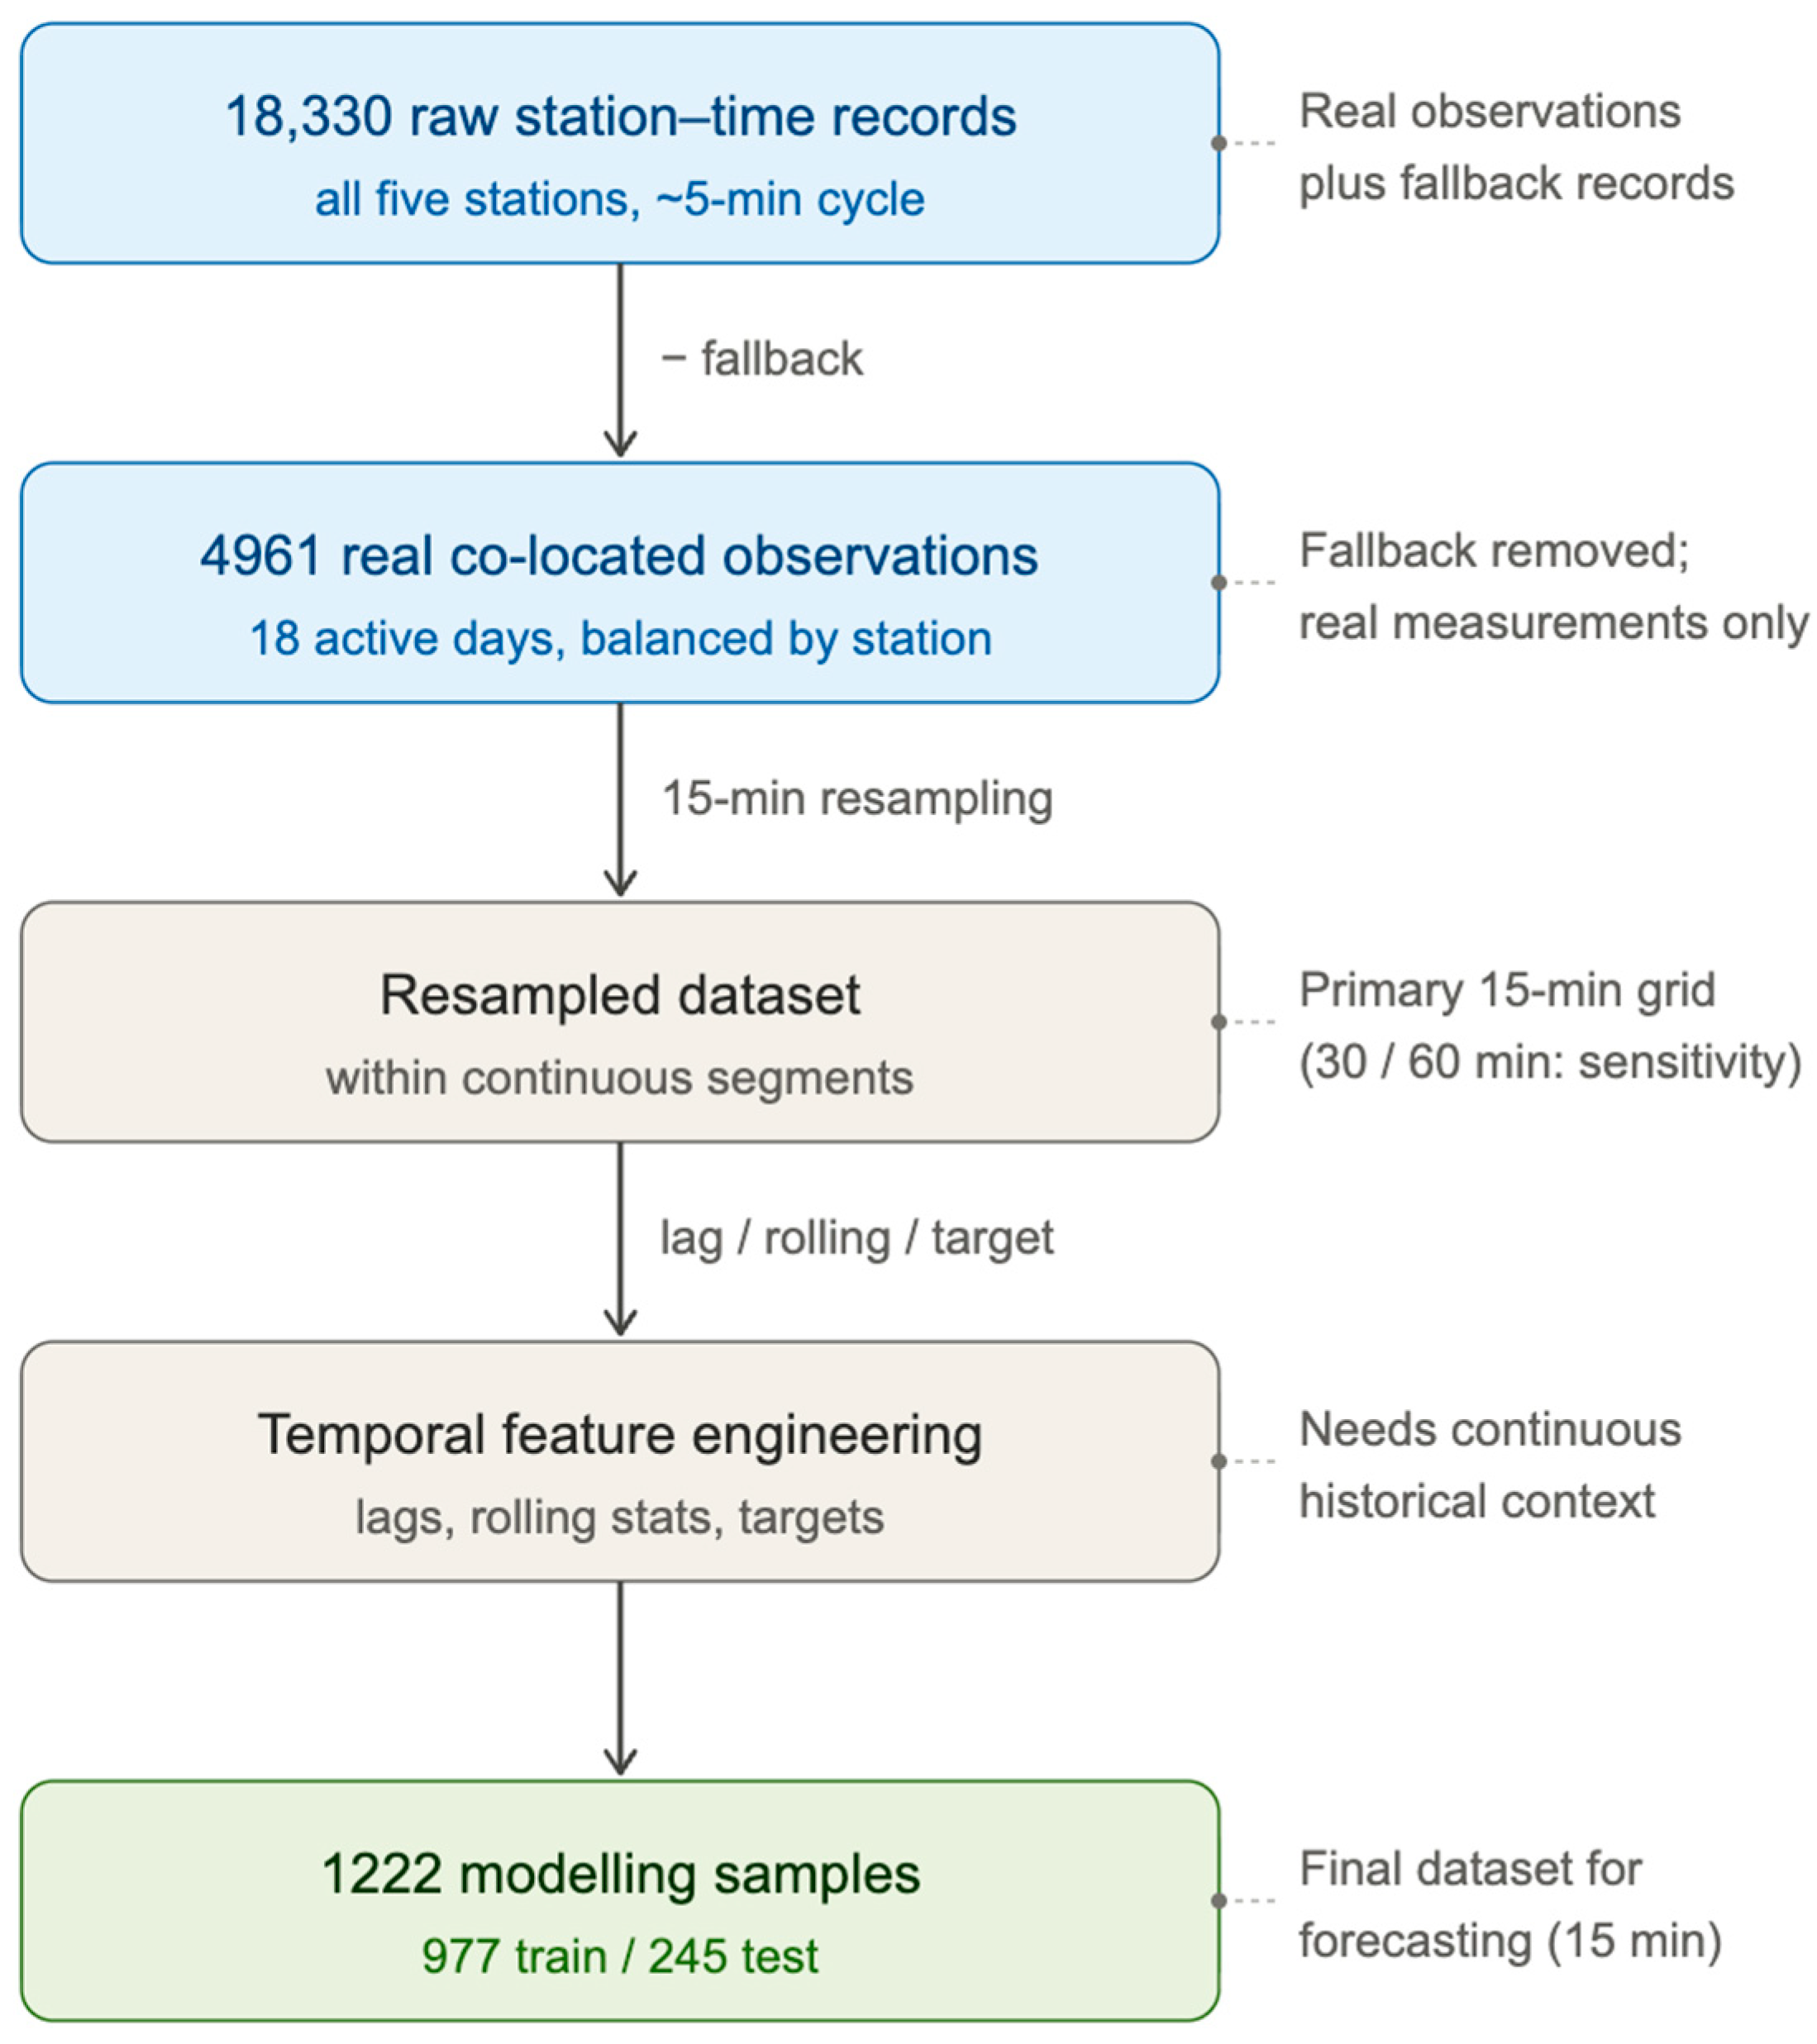
The modeling dataset is a strict subset of the collected data (
Figure 4). From 18,330 raw station-time records, 4961 real co-located observations remain after excluding fallback records generated during API outages. Resampling to the primary 15 min resolution and constructing lag, rolling-mean, and target features within continuous segments then yields 1222 modeling samples. The reduction is therefore fully explained by three explicit steps—fallback exclusion, temporal resampling, and the historical-context requirements of lag and target construction—rather than by unaccounted data loss. The 30 and 60 min resolutions (466 and 140 samples, respectively) are used for the sensitivity analysis in
Section 3.5.
From 18,330 raw station-time records, 4961 real co-located observations remain after excluding fallback; 15 min resampling and feature construction within continuous segments then yield 1222 modeling samples.
The final modeling data set was divided into training and testing subsets using chronological partitioning. Observations were ordered by timestamp, with the earliest 80% used for model training and the most recent 20% reserved for testing. Random splitting was deliberately avoided as it may leak temporal data, allowing observations from later periods to influence model training. This chronological division was used to more realistically assess the model’s ability to predict future PM2.5 concentrations based on previously observed data.
2.7. Forecasting Models
Although the literature review highlights deep-learning architectures (CNN, LSTM, Transformer) as the current state of the art for
PM2.5 forecasting, this study deliberately employs lightweight, interpretable models. This choice is dictated by the prototype dataset: the limited number of continuous modeling samples and the short forecast horizon do not justify, and cannot reliably train, high-capacity deep networks, which are prone to overfitting on small datasets. Interpretable models also allow direct inspection of feature importance, which is central to the exploratory aim of this study. Deep-learning architectures are therefore positioned as future work, to be evaluated as the historical dataset grows (
Section 4).
Four forecasting approaches were compared to assess the predictive potential of the modeling dataset (
Table 4). The first is a lag-1 persistence baseline, which predicts the next PM
2.5 value as equal to the most recent observation and serves as a reference benchmark for determining whether machine-learning models improve on simple temporal persistence. The second is Linear Regression, which estimates a linear relationship between
PM2.5 and the predictor variables. The third is Random Forest, an ensemble of decision trees capable of capturing nonlinear relationships and feature interactions. The fourth is Gradient Boosting, a sequential ensemble that iteratively reduces prediction error through boosted decision trees.
Model performance was evaluated using four standard regression metrics: Mean Absolute Error (MAE), Root Mean Squared Error (RMSE), Mean Absolute Percentage Error (MAPE), and the coefficient of determination (R2). MAE reflects the average prediction error in the original unit (µg/m3); RMSE penalizes larger deviations more strongly; MAPE expresses the error as a percentage; and R2 quantifies the proportion of variance in PM2.5 explained by each model.
Given the limited temporal coverage of the dataset at this stage, the results should be interpreted as a baseline assessment of predictive potential rather than an operational forecasting system.
2.8. Web Application Implementation
The digital twin was implemented as a lightweight web application supporting real-time monitoring, data visualization, and analytical interpretation of traffic and air quality indicators. The system was developed using a minimal technology stack to ensure reproducibility and ease of deployment: the client side was built with HTML, CSS, and JavaScript, while the server side was implemented in Python (version 3.12). Persistent data storage is organized using a local SQLite database and CSV files.
The web interface is structured into four functional modules. The first provides an overview of key urban indicators, including total vehicles per hour, estimated CO2 emissions, average traffic speed, and the current correlation between traffic flow and PM2.5. The second module presents station-level monitoring results in an interactive table, enabling comparison of traffic intensity, pollutant concentrations, CO2 emissions, and population exposure across all monitoring locations. The third module contains visualization tools—bar charts, pie charts, line charts, scatter plots, and a correlation heatmap—supporting exploratory spatial and temporal analysis. The fourth module is dedicated to advanced analytical outputs, including correlation coefficients, p-values, anomaly detection, station rankings, exposure hotspots, and preliminary forecasting results, thereby bridging the monitoring dashboard with research-oriented analysis.
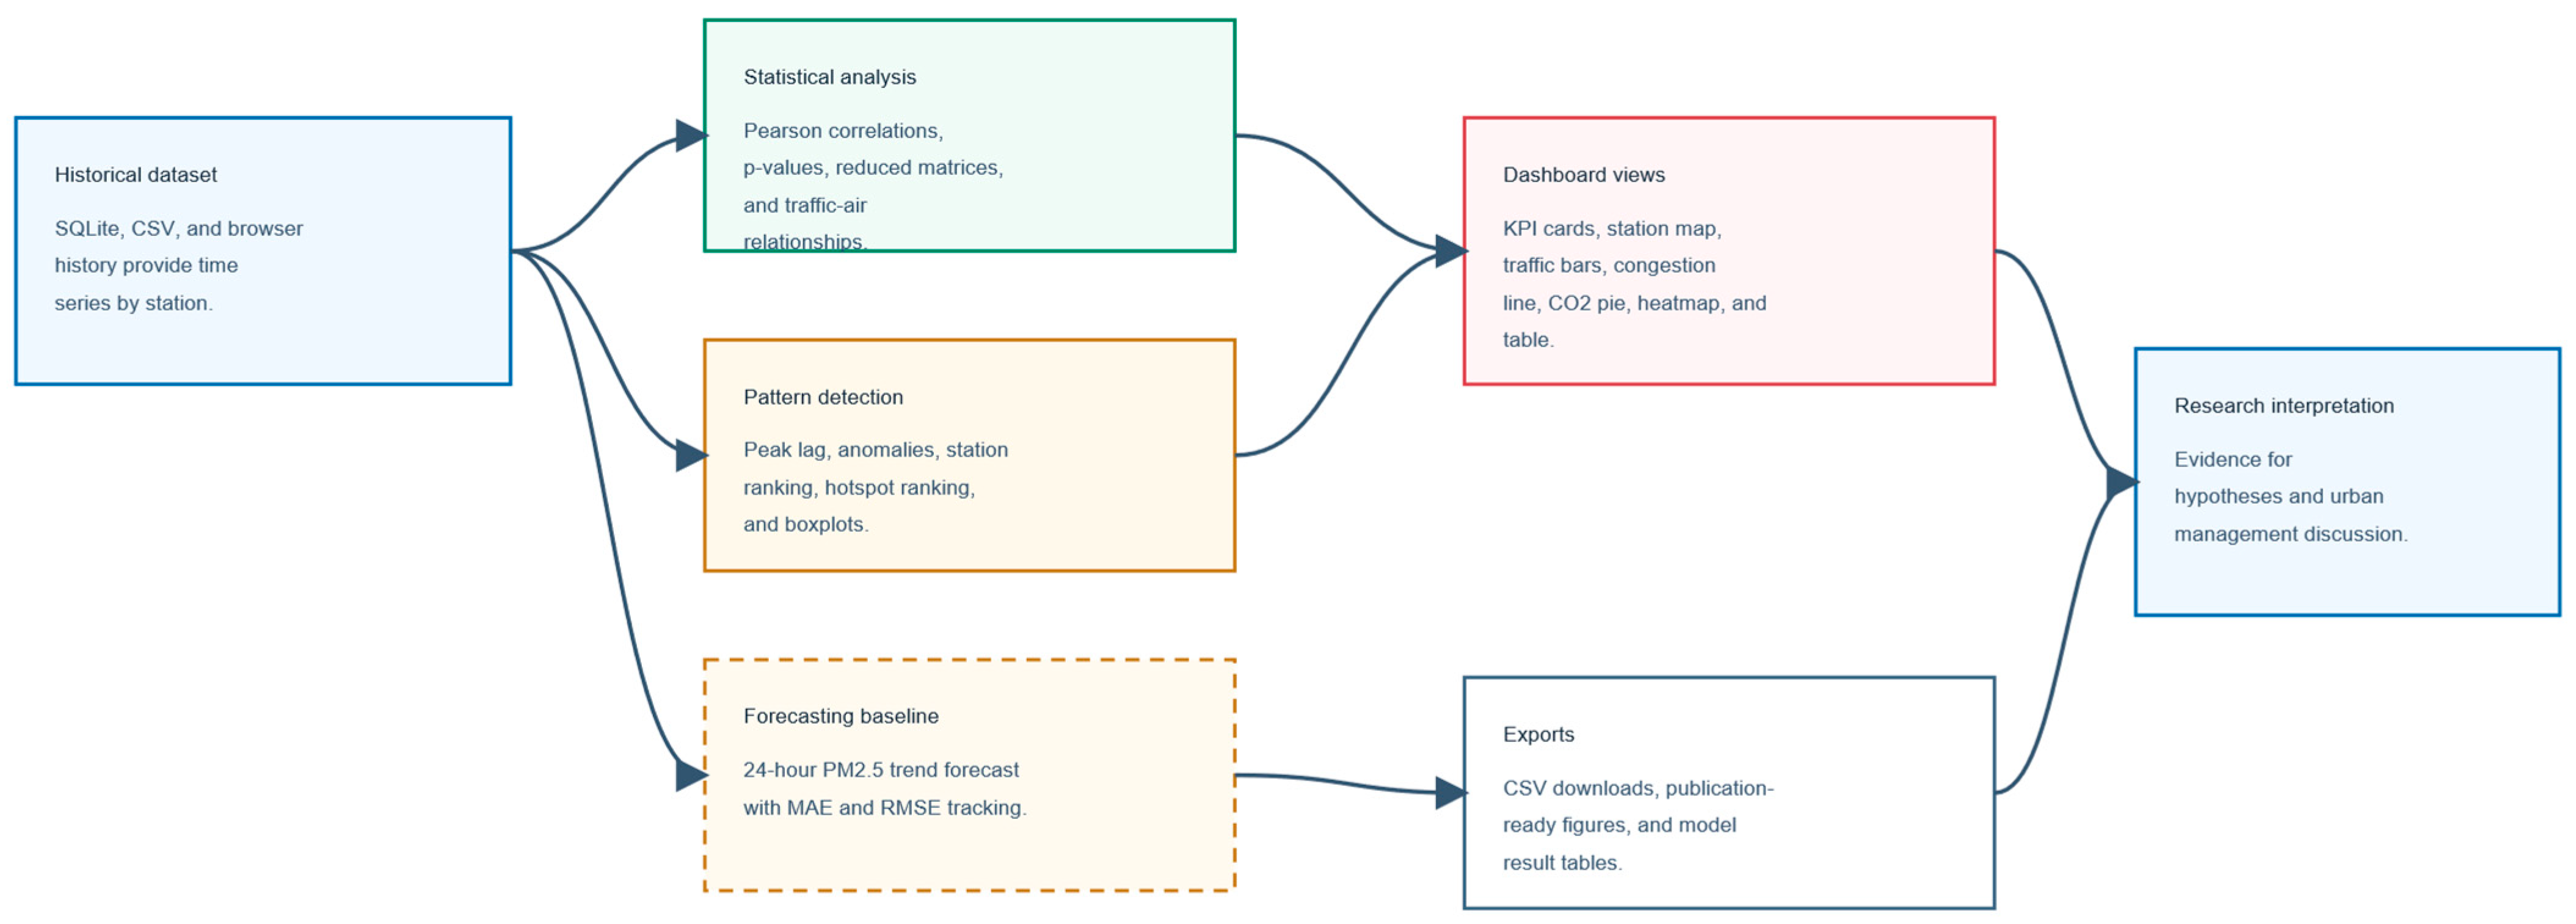
Figure 5 presents the analytical and visualization components of the digital twin. Historical data is used to calculate correlations between transport and air pollution,
p-values, anomaly indicators, station ratings, peak-hour delays, and baseline forecasts. These results are displayed on the dashboard using KPI charts, tables, maps, histograms, line graphs, pie charts, heat maps, scatter plots, and forecast graphs. The module supports the interpretation of the relationships between transport and air quality and the preparation of results for publication.
The application supports both manual and scheduled automatic data updates. In addition, a background collector operates independently of the browser session, periodically saving observations to local storage and enabling the accumulation of a longitudinal dataset for statistical analysis and forecasting. A CSV export function allows the processed data to be used in external environments such as Python (3.12), Excel, or statistical software packages. The interface is responsive and compatible with desktop, tablet, and mobile devices.
3. Results
This section presents the main findings obtained from the developed digital twin prototype, including station-level traffic and air quality indicators, correlation analysis, population exposure assessment, and preliminary PM2.5 forecasting performance. The analysis is based on a historical dataset accumulated during repeated data collection cycles, where each record corresponds to one monitoring station at one timestamp and includes traffic indicators, pollutant concentrations, estimated emissions, meteorological variables, and a population exposure index. The results demonstrate the system’s capacity to support both real-time urban monitoring and research-oriented analysis.
3.1. Dashboard Overview
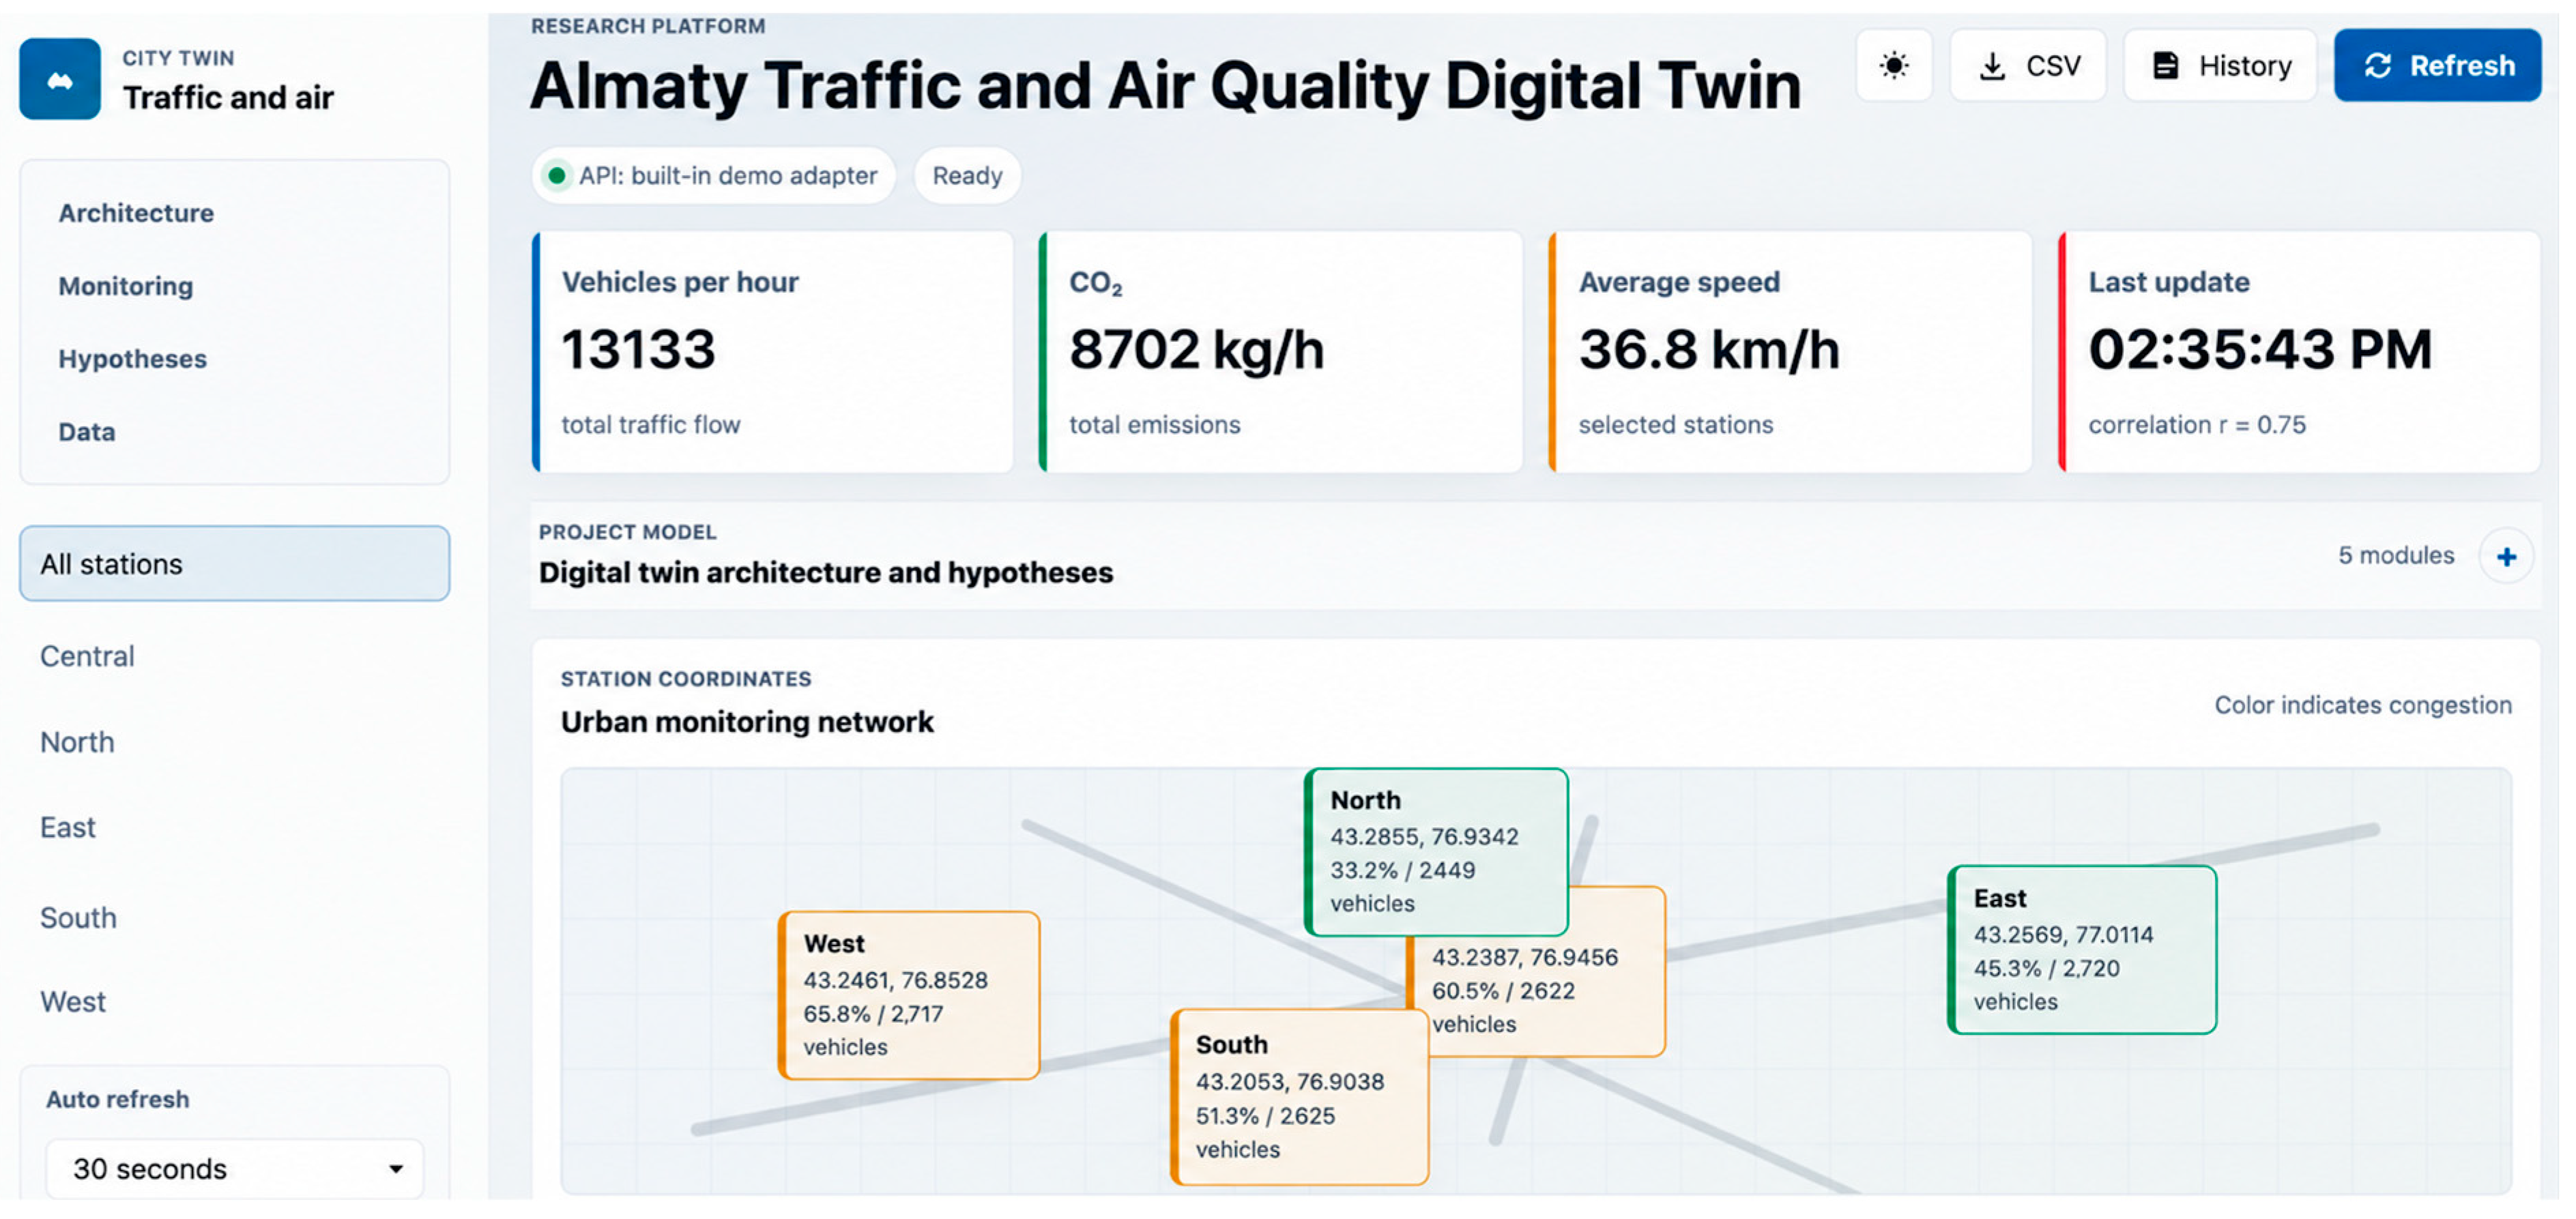
The implemented dashboard is shown in
Figure 6. It provides an integrated real-time interface displaying traffic flow for each station, calculated
CO2 emissions, average speed, congestion levels, and pollutant summary data, as well as a map of the monitoring network of five stations (Central, North, East, South, and West). The values shown in the dashboard represent a current operational snapshot: they are continuously updated based on current API responses and may include backup values generated during API failures. Accordingly, they illustrate the system monitoring interface rather than the analytical results of the study, which are calculated offline from the real (not backup) dataset and are presented in
Section 3.3,
Section 3.4 and
Section 3.5.
Figure 6 confirms that the system successfully collects, processes, and visualizes traffic flow and air quality data in a single integrated interface.
Displayed values are a live operational snapshot and may include fallback placeholders; they are not the basis of the analysis.
3.2. Collected Dataset Description
The collected records include both observations returned directly by external APIs and records generated by the prototype’s fallback mechanism when one or more external services were unavailable or returned incomplete information. Fallback records are identified by their source labels and were excluded from the primary scientific analysis. The retained real observations were subsequently collated by station and time and resampled to fixed temporal resolutions (primarily 15 min) for statistical and predictive analyses.
Each record corresponds to a single monitoring station at one timestamp and includes four variable groups. Traffic indicators comprise speed, traffic density, vehicles per hour, and road congestion percentage. Air-quality measurements include PM
2.5, PM
10, NO
2, O
3, CO, and a calculated air pollution index. Derived variables include estimated CO
2 emissions and a population exposure index computed from pollutant concentrations, congestion level, and city-level population data. A source field identifies the origin of each record (external API or fallback) and was retained to support filtering and validation in subsequent analysis. As shown in
Table 5, the final dataset comprised 4,961 co-located observations collected during the 50-day monitoring period.
As the system was implemented as a prototype, the dataset contains observations from multiple source types. This heterogeneity should be accounted for during data cleaning and interpretation of analytical results.
3.3. Station-Level Monitoring Results
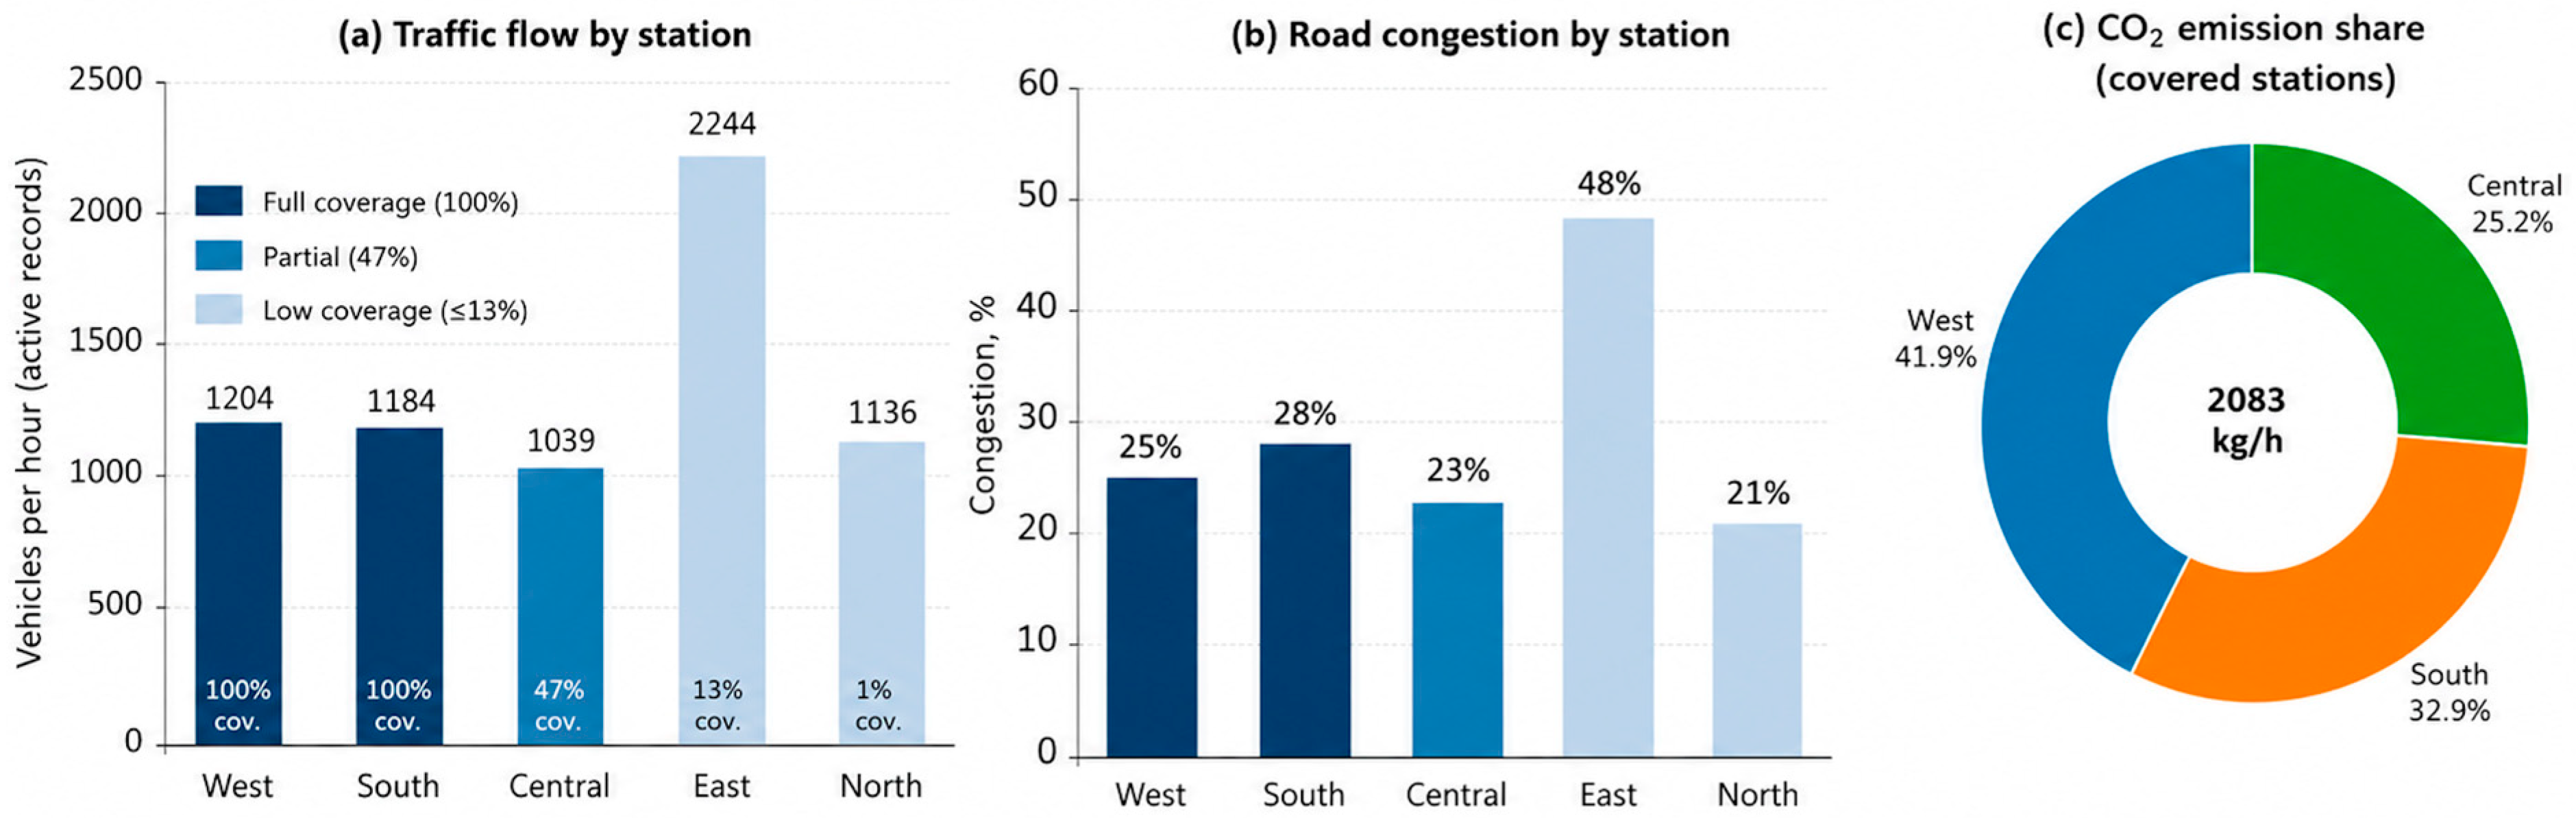
Station-level analysis was based on records with live TomTom traffic data, whose coverage varied markedly across the five stations: the West and South stations had complete coverage (100% of records), Central partial coverage (47%), and the East and North stations very limited coverage (13% and 1%, respectively). Station comparisons are therefore drawn primarily from the adequately covered stations, and the East and North values are interpreted with caution.
Among the covered stations, average traffic flow ranged from approximately 1039 vehicles per hour at Central to 1204 at West and 1184 at South, with a clear evening rush-hour peak (≈1540 veh/h at West around 18:00 local time;
Figure 7). Average road congestion during the summer period was moderate—28% at South, 25% at West, and 23% at Central. The East station recorded higher nominal values (≈2235 veh/h, 48% congestion) but only from 13% coverage (132 records) and is therefore not directly comparable.
Estimated CO
2 emissions broadly followed traffic volume. Across the adequately covered stations, the West and South corridors together accounted for roughly three-quarters of the estimated total (West 41.9%, South 32.9%, Central 25.2%;
Figure 7). These patterns indicate that transport-related environmental pressure is unevenly distributed and should be assessed at the corridor level rather than aggregated across the city.
Bar shading indicates live TomTom coverage (dark = full, light = low). Means are computed over active (live-traffic) records; the East and North stations have low coverage (13% and 1%) and are interpreted with caution. The CO2 share is shown for the fully/partially covered stations (West, South, Central).
3.4. Traffic–Air-Quality Relationships
The relationship between traffic and air quality was examined on the real co-located subset (
n = 4961) using Pearson correlation and a lagged (lead–lag) analysis. Traffic intensity showed no statistically significant association with particulate matter but weak, highly significant positive associations with the gaseous combustion tracers NO
2 and CO (
Table 6). PM2.5 was low and spatially uniform during the summer period (mean 6.0 µg/m
3, range 1.6–13.7), leaving little variance for traffic to explain. This indicates that, under summer conditions, the traffic signal is expressed in directly vehicle-emitted gases rather than in particulate matter.
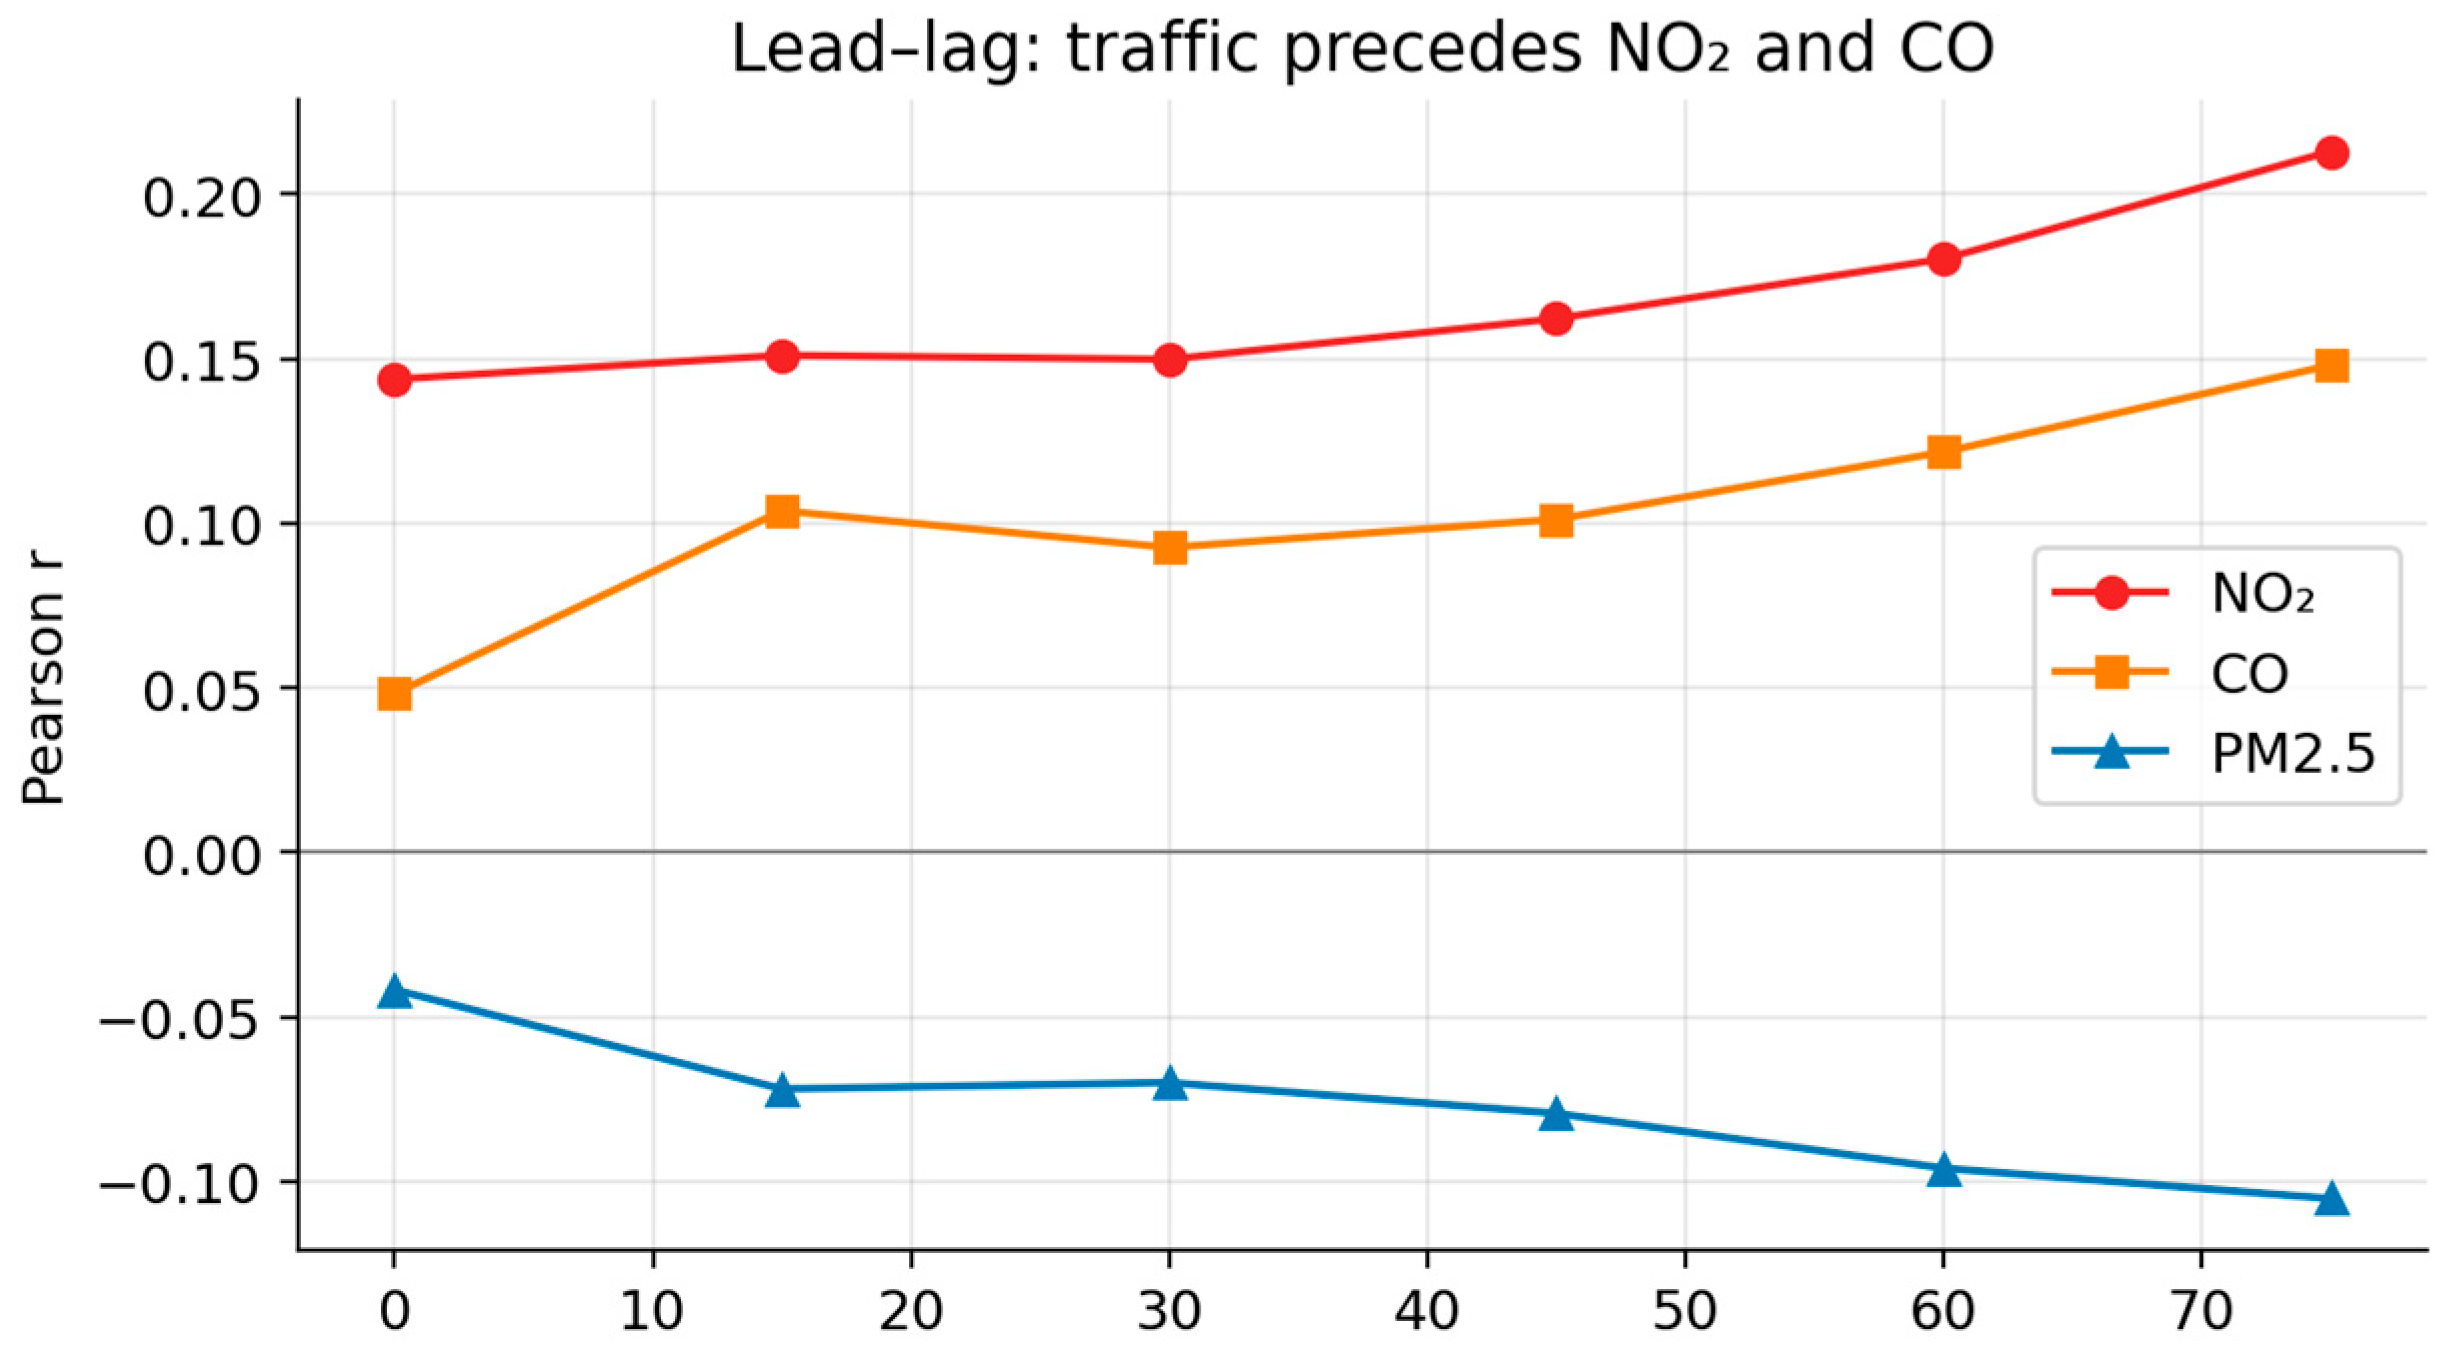
A lagged cross-correlation analysis showed that traffic not only correlates with these gases but temporally precedes them (
Figure 8). The traffic–NO
2 correlation increased with lag, from r ≈ 0.14 at zero lag to r ≈ 0.21 at a lead of about 75 min, and the traffic–CO correlation rose similarly (from ≈ 0.05 to ≈ 0.15), whereas the traffic–PM2.5 correlation remained near zero at all lags. This indicates that traffic activity leads NO
2 and CO by up to roughly one hour, consistent with vehicular emission followed by accumulation and dispersion.
The association was also spatially heterogeneous. The strongest traffic–NO
2 correlations occurred at the East (r = 0.39) and Central (r = 0.25) stations and were weakest or absent at South (r = 0.07) and North; because the East and North stations had limited traffic coverage (
Section 3.3), their station-level coefficients are interpreted with caution. Overall, the analysis reveals a temporally leading, spatially varying association between traffic and vehicle-emitted gases, but not
PM2.5—a coherent, season-specific characterization of the traffic–air-quality relationship in Almaty.
3.5. PM2.5 Forecasting Results
The forecasting experiment was performed on the real co-located subset (4961 records; fallback records excluded). Observations were resampled per station to fixed temporal resolutions (15, 30, and 60 min), and lag, rolling-mean, and target features were constructed within continuous segments. At the primary 15 min resolution this yielded 1222 complete records, split chronologically into 977 training and 245 testing records; the 30 and 60 min resolutions (466 and 140 records) were used for a sensitivity analysis. The reported MAE, RMSE, MAPE, and R
2 values were computed on the testing subsets.
Table 7 presents the performance of the four models across the three resolutions.
Across all temporal resolutions, the machine-learning models did not consistently outperform the lag-1 persistence baseline. At the 15 min resolution the baseline already achieved R2 = 0.980, and the models ranged from 0.962 to 0.977; at the 60 min resolution all models fell below the baseline (R2 ≤ 0.319 vs 0.743). This behavior reflects the strong temporal persistence of a low, slowly varying summer PM2.5 signal (mean ≈ 6 µg/m3), for which recent values alone explain most of the variance. The close performance of Random Forest and Gradient Boosting is consistent with this persistence-dominated structure, under which bagging- and boosting-based ensembles converge to comparable solutions. Time-series cross-validation confirmed this pattern and showed increasing variance at coarser resolutions, where fewer continuous sequences are available. These results are reported as a prototype-level baseline; traffic-derived features contributed negligibly, and meaningful predictive gains are expected only under higher-PM2.5 (heating-season) conditions.
To assess whether these results are stable rather than an artefact of a single train–test split—particularly given the limited number of testing records at coarser resolutions—model performance was additionally evaluated using time-series cross-validation (TimeSeriesSplit, five folds) on the chronologically ordered modeling dataset.
Table 8 reports the mean and standard deviation of MAE and R
2 across the folds.
The cross-validation results confirm the single-split findings and quantify their stability. At the 15 min resolution, performance is reasonably robust (Linear Regression R2 = 0.92 ± 0.07), whereas at coarser resolutions both the mean performance and its variance deteriorate sharply, becoming unstable at the 60 min resolution where only 140 modeling records remain. This pattern reinforces the central observation that reliable short-horizon nowcasting is constrained by the intermittent availability of continuous real data rather than by the choice of model. It also underscores that the additional predictive value of traffic-related features could not be established under the present summer conditions and short observation window, and should be re-examined once denser, heating-season data become available.
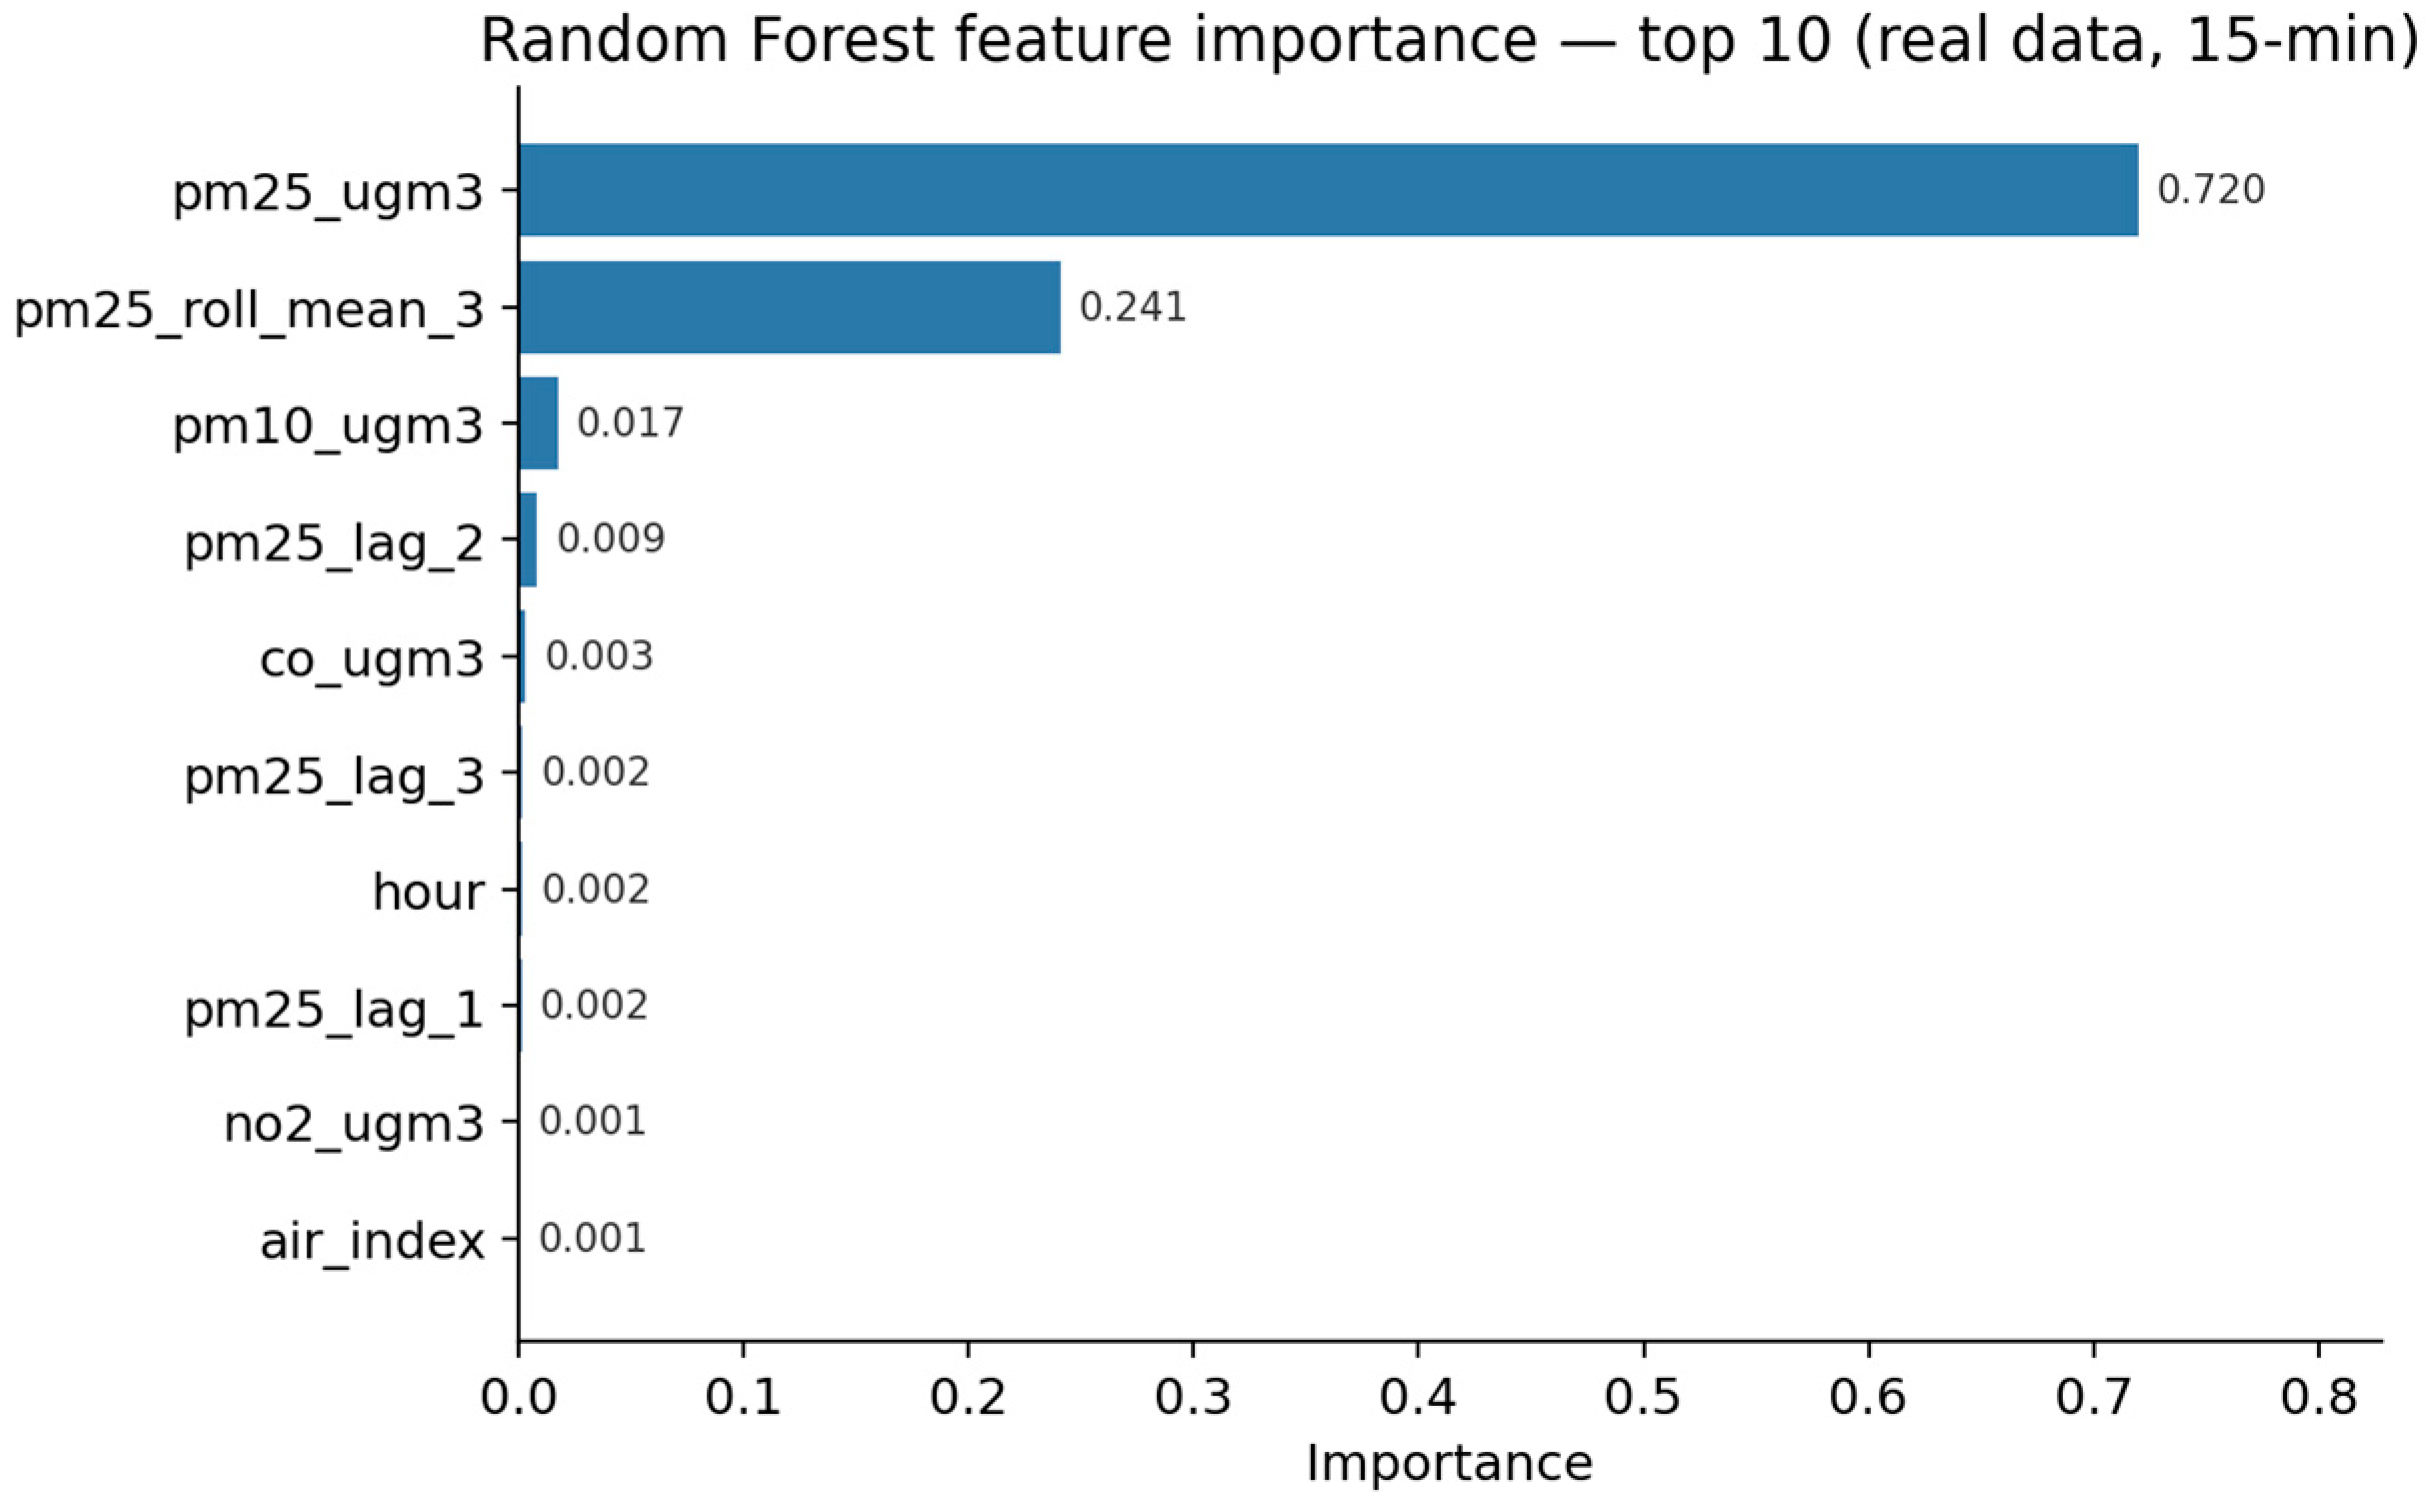
Feature-importance analysis (Random Forest, 15 min resolution) identified the variables contributing most to short-term
PM2.5 prediction (
Figure 9). The dominant predictor was the current
PM2.5 value (importance ≈ 0.72), followed by its short rolling mean (pm25_roll_mean_3 ≈ 0.24); the recent
PM2.5 lags contributed much less, reflecting the strong temporal autocorrelation of
PM2.5. The composite air_index contributed only marginally (≈0.0008), and all traffic-derived variables together accounted for less than 0.002 of the total importance. A model trained on only the ten most important features—none of which is a traffic variable—matched the full-feature model (R
2 = 0.963 vs. 0.962), and removing air_index left unchanged performance (R
2 = 0.961). These results confirm that short-horizon
PM2.5 is governed by temporal persistence rather than by traffic-flow characteristics, with no single feature dominating leakage.
Taken together, the forecasting results show that reliable short-horizon PM2.5 nowcasting is constrained by the intermittent availability of continuous real data rather than by the choice of model, and that traffic-related features add no measurable predictive value under the low- PM2.5 summer conditions studied here. This does not rule out a traffic contribution during the heating season, when particulate levels are higher and more variable; establishing it will require dense, continuous data spanning the winter months. The forecasting component is therefore best regarded as a reproducible prototype-level baseline that the platform is designed to extend as longer records accumulate.
4. Discussion
The results demonstrate that the proposed digital twin prototype successfully integrates traffic, air-quality, emission, exposure, and forecasting indicators within a single analytical framework, supporting both real-time dashboard visualization and longitudinal data accumulation for exploratory urban environmental analysis.
Station-level analysis revealed spatial variation in traffic intensity and estimated CO2 emissions across the monitored corridors, with the West and South corridors carrying the highest transport-related pressure. Real traffic coverage from the TomTom API was, however, uneven across stations, being complete at West and South, partial at Central, and sparse at East and North; station-level results were therefore drawn primarily from the adequately covered stations, and the remaining values were interpreted with caution.
Correlation analysis on the real co-located subset (n = 4961) showed that, during the summer period, traffic intensity was not significantly associated with PM2.5—which was low and spatially uniform (mean ≈ 6 µg/m3)—but was weakly and significantly correlated with the vehicle-emitted gases NO2 (r ≈ 0.16) and CO (r ≈ 0.10). A lead–lag analysis further showed that traffic temporally preceded elevated NO2 and CO by up to about one hour, and the association was strongest at the corridor stations with the most complete traffic coverage. This indicates that, in this season, the traffic signature appears in gaseous pollutants rather than in PM2.5, which is not primarily traffic-driven when concentrations are low.
It is important to emphasize that the absence of a significant traffic–PM2.5 association in this study does not imply that no such relationship exists. The finding is conditional on the observed context—a short summer window with low, uniform PM2.5—in which particulate levels are not primarily traffic-driven. The concurrent, temporally leading associations between traffic and NO2/CO confirm that the underlying vehicular emission mechanism is active; its expression in PM2.5 is expected to become detectable during the heating season, when residential heating and temperature inversions elevate particulate concentrations. The present result should therefore be read as a season-specific characterization rather than as evidence against a traffic–PM2.5 link in general.
These findings can be positioned against recent studies on traffic-related air-quality modeling. Much of the prior work reporting strong traffic–PM2.5 coupling was conducted in high-PM2.5 or heating-season contexts and relied on deep-learning architectures. In contrast, the present study integrates live, multi-source APIs in a data-sparse Central Asian city and analyzes a low-PM2.5 summer period, isolating the gaseous rather than the particulate traffic signature. Its contribution is therefore twofold: a reproducible, API-based monitoring platform, and an empirical, season-specific characterization of the traffic–air-quality relationship that motivates a dedicated heating-season study.
The forecasting experiment showed that short-horizon PM2.5 is dominated by temporal persistence. Across the evaluated resolutions, the machine-learning models did not consistently outperform a persistence baseline and traffic-derived features contributed negligibly; time-series cross-validation confirmed this pattern and revealed high variance at coarser resolutions, where continuous real data were scarce. These results are reported as a prototype-level baseline rather than an operational capability.
From an urban-management perspective, the digital twin can support potential applications such as comparison of transport-corridor performance, monitoring of elevated exposure periods, and scenario-based evaluation of traffic-management interventions. Although demonstrated for Almaty, the modular, API-based architecture is transferable to other urban regions, as it relies exclusively on globally available data sources and requires no city-specific infrastructure.
The study has several limitations. The analysis covers a 50-day summer window (26 May–16 July 2026) with 18 active days of real co-located data, outside the October–March heating season when
PM2.5 peaks; the low, uniform summer
PM2.5 limits the detectability of a traffic–
PM2.5 relationship. Fallback records generated during API outages were excluded from the scientific analysis and used only to demonstrate system resilience, and real traffic coverage was uneven across stations. The analysis was further constrained by the variables available from public APIs, which do not expose factors such as vehicle-fleet composition, boundary-layer height, or non-traffic emission sources (residential heating, industry); the derived indicators (vehicles per hour, CO
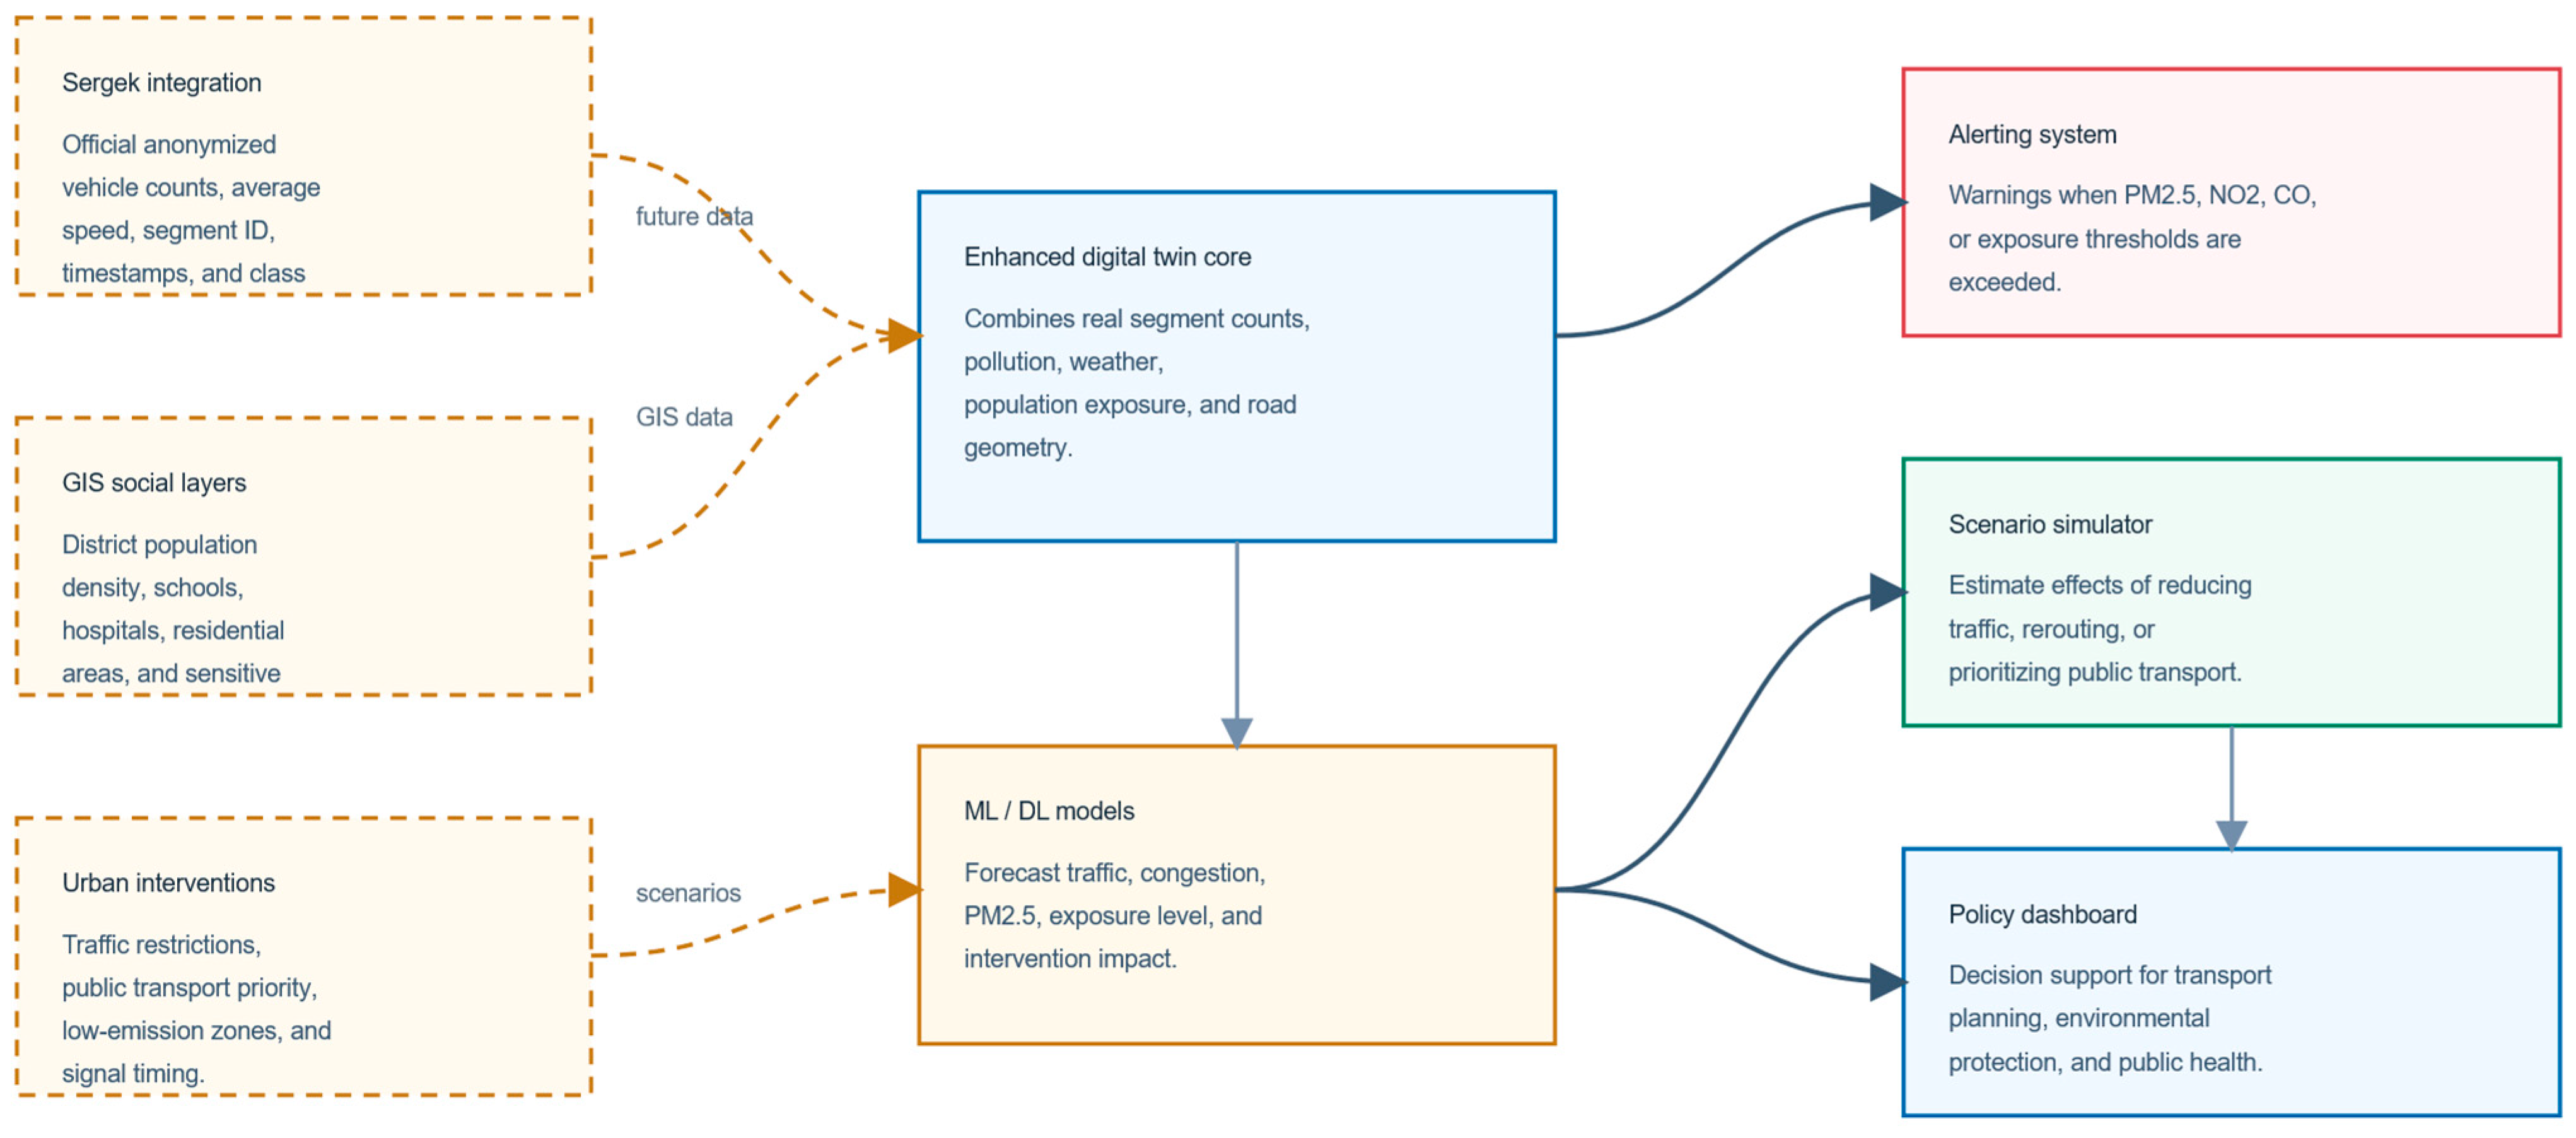
2) are therefore model-based estimates, and the observed relationships may be affected by unobserved confounders. Reference-grade measurements from the municipal Sergek monitoring network, which could provide higher-density and more reliable data, are not publicly available and require authorization from state authorities, which was beyond the scope of this prototype study. Accordingly, the results should be interpreted as a methodological validation of the framework rather than a comprehensive assessment of traffic-related air pollution in Almaty; full validation requires continued collection into the heating season, a richer variable set, and, ideally, integration with official reference-grade measurements. The planned extensions of the prototype are illustrated in
Figure 10.
Figure 10 outlines the intended evolution of the prototype toward a city-scale decision-support platform, integrating official reference-grade measurements, richer contextual variables, and heating-season data as they become available.
5. Conclusions
This study presented a web-based digital twin prototype for integrated monitoring and analysis of traffic flow and air quality in Almaty, Kazakhstan. The system autonomously collects data from the TomTom Traffic, OpenWeather Air Pollution, and WAQI APIs and official population statistics for five fixed monitoring stations, accumulating station-time records in local SQLite and CSV storage and supporting real-time dashboard visualization, historical accumulation, correlation analysis, anomaly detection, and short-term PM2.5 forecasting.
The empirical analysis, based on 4961 real co-located observations, showed that during the summer study period traffic intensity was not significantly associated with PM2.5—which was low and spatially uniform—but was weakly and significantly correlated with the vehicle-emitted gases NO2 and CO, which it preceded by up to about one hour. Station-level comparison revealed uneven transport-related pressure across corridors, with the western and southern corridors carrying the highest load, subject to uneven real traffic coverage across stations.
The forecasting experiment showed that short-horizon PM2.5 is dominated by temporal persistence: lightweight machine-learning models did not consistently outperform a persistence baseline, and traffic-derived features contributed negligibly. These results are reported as a prototype-level baseline rather than an operational forecasting capability.
The prototype is intended as a methodological baseline rather than an operational system. Future work should extend the observation period into the heating season, pursue integration with the municipal Sergek monitoring network—contingent on the required authorizations—to incorporate reference-grade sensor data, and add GIS layers such as district-level population density and the locations of schools, hospitals, and residential zones. Advanced forecasting architectures such as LSTM and temporal convolutional networks should be evaluated as the historical dataset grows. These extensions would support the evolution of the prototype into a decision-support platform for transport, environmental policy, and public-health management in Almaty and similar Central Asian cities, while its modular, API-based architecture ensures transferability beyond the Almaty case study.




 ,
,