Article

Deep Neural Network-Based Segmentation of Epileptiform Activity Patterns in EEG Approaches Inter-Expert Agreement for a Pediatric Test Cohort


by
Nikolay V. Gromov
1,
Albina V. Lebedeva
1,2,
Artem A. Sharkov
1,3,4,
Anna D. Grebenyukova
1,4,5,
Oksana D. Elshina
6,
Anastasiya M. Borisova
6,
Valentin Yu. Borisov
6,
Anton E. Malkov
1,7,
Lev A. Smirnov
1,
Tatiana A. Levanova
1,* and
Alexander N. Pisarchik
8,*
1
Research Center in the Field of Artificial Intelligence, Lobachevsky State University of Nizhny Novgorod, 603022 Nizhny Novgorod, Russia
2
Department of Biology, Privolzhsky Research Medical University, 603005 Nizhny Novgorod, Russia
3
Veltischev Research and Clinical Institute for Pediatrics and Pediatric Surgery, Pirogov Russian National Research Medical University, 125412 Moscow, Russia
4
Department of Neurology, Genomed Ltd., 105005 Moscow, Russia
5
Federal Center of Brain Research and Neurotechnologies, Federal Medical Biological Agency, 117513 Moscow, Russia
6
Pediatric Department of University Clinic, Privolzhsky Research Medical University, 603005 Nizhny Novgorod, Russia
7
Institute of Theoretical and Experimental Biophysics, Russian Academy of Sciences, 142290 Pushchino, Russia
8
Center for Biomedical Technology, Universidad Politécnica de Madrid, 28223 Madrid, Spain
*
Authors to whom correspondence should be addressed.
Technologies 2026, 14(7), 403; https://doi.org/10.3390/technologies14070403
Submission received: 17 May 2026 / Revised: 23 June 2026 / Accepted: 25 June 2026 / Published: 1 July 2026

Abstract

Automatic analysis of electroencephalography (EEG) recordings relies on large, high-quality labeled datasets. Manual segmentation by medical experts is resource-intensive and time-consuming. Moreover, to overcome potential subjectivity in labeling, independent annotation by at least two experts is required. Therefore, reliable automatic data labeling is essential for obtaining the large datasets needed to train robust AI models. In this paper, we show that a properly trained state-of-the-art deep neural network (DNN) achieves labeling performance comparable to inter-expert agreement in the task of segmenting epileptiform activity patterns. To this end, we first compiled a custom database of EEG recordings containing such patterns. Second, five experts based on part of these recordings independently assessed spike-wave index (SWI), which is a key diagnostic criterion that indicates the percentage of the EEG recording during which epileptic discharges are observed. Third, we compared the expert assessments with SWI calculated based on automatic segmentation by the trained DNN. Our results demonstrate that the 1D U-Net architecture achieves competitive overall performance and aligns well with both expert assessments and expert-derived SWI values. Thus, automated segmentation and analysis of EEG recordings holds great promise for accelerating diagnosis and developing targeted therapeutic strategies for epilepsy.

1. Introduction

The spike-wave index (SWI) has emerged as a crucial quantitative biomarker in epilepsy, particularly for conditions such as spike-wave activation in sleep (SWAS), also referred to as electrical status epilepticus during sleep (ESES) or continuous spike-waves during slow sleep (CSWS) [1]. SWI represents the percentage of EEG recording time during which epileptic discharges are observed and serves as an objective measure of epileptiform burden [2]. Another indicator is the representation, which is defined as the percentage of the total recording duration occupied by any epileptiform pattern. Both indicators are decisive for diagnosing epilepsy based on EEG data [3].
According to recommendations in the relevant medical literature [4,5], prognosis regarding the presence and future course of the disease should be based primarily on the calculated SWI and the representation of epileptiform activity patterns in EEG recordings. Therefore, the development of new methods for identifying epileptiform activity patterns and for constructing short- and long-term prognoses from EEG data reduces to the sequential solution of two problems: (i) segmentation of epileptiform activity patterns, and (ii) calculation of various characteristics (such as SWI) from the segmented patterns.
Traditional methods for calculating SWI involve manual counting of spikes and sharp waves only over a short interval of the EEG recording. This process is not only time-consuming and labor-intensive but also subject to significant interrater variability. Consequently, a fully automatic computer algorithm for fast and accurate SWI calculation can assist physicians in making precise and rapid decisions for diagnosing and adjusting existing therapy in patients with epilepsy. Compared to human raters, an automatic method is consistent; however, its accuracy can still be improved.
Current automatic methods for EEG data processing include direct approaches and machine learning techniques. These methods typically extract temporal, frequency, or time--frequency features from the EEG, such as the time occupied by epileptiform activity, the epileptiform activity occurrence rate, or both [6,7,8], and then use classification methods on the extracted features to complete the EEG processing task.
Several direct methods are based on templates and morphological features. For example, the authors in [9] proposed an automatic detection algorithm that relies on k-means time clustering to detect epileptiform spikes. The k-means algorithm first divides the peak into several clusters and then uses the centroid of each cluster as a template to detect different spike types. This algorithm involves a large number of threshold parameter settings such as correlation and feature thresholds (rise and fall slopes, curvatures) at different processing stages, which complicates the operation. Also, template engineering often results in decreased sensitivity due to neglect of atypical spikes. In [10], a hybrid expert system was proposed that integrates biogeography-based optimization into a morphological-analysis-based expert model and mimics the decision-making process of epileptologists in quantifying epileptiform patterns in EEG data, taking into account personalized features and medical knowledge. In addition, there are many algorithms for automatic epileptiform spike detection, such as wavelet transform [11], power spectrum analysis [12,13], and independent component analysis [14].
Recent studies have explored automated approaches for SWI calculation to address these limitations. Reus et al. [2] compared the performance of a commercially available spike detection algorithm with human expert consensus for SWI determination, finding that automated detection could provide comparable results when using appropriate sensitivity settings. Their work demonstrated that automated tools could save substantial time while maintaining consistency, particularly when reviewing large EEG datasets. In [15], the clinical utility of automated spike quantification using wearable EEG devices was investigated, highlighting the potential for continuous monitoring and objective assessment of treatment response.
From a clinical perspective, the quantification of epileptiform activity using measures such as SWI provides a window into thalamocortical network function, particularly during sleep, and may serve as a biomarker for treatment response and disease progression. The relationship between thalamocortical network dysfunction and epileptiform activity has been extensively studied, especially in generalized epilepsies characterized by spike-wave discharges. Research has shown that abnormal interactions between thalamic nuclei and cortical regions play a central role in the generation and propagation of generalized spike-wave activity [16]. These findings have important implications for understanding the pathophysiology of epilepsy and for developing targeted therapeutic interventions. Automated analysis of EEG recordings could facilitate more precise characterization of thalamocortical dysfunction patterns, thereby enabling personalized treatment strategies and objective monitoring of therapeutic efficacy.
This paper aims to investigate the effectiveness of a state-of-the-art deep neural network in the task of epileptiform activity segmentation and subsequent SWI calculation relative to medical expert SWI assessments, and to investigate its suitability for potential clinical deployment. To accomplish this, we first compiled a custom database of EEG recordings containing expert-annotated epileptiform activity patterns. Second, we benchmarked the performance of a state-of-the-art deep neural network on the epileptiform activity segmentation task. Third, we compared the expert assessments of SWI with the SWI calculated based on segmentation produced by the trained DNN.
The remainder of this paper is organized as follows. Section 2 offers a concise review of the related literature. Section 3 describes the datasets and preprocessing methods used in this study, including the annotation process. Section 4 outlines the deep learning architecture evaluated in this research, detailing its design, implementation, learning process, evaluation metrics, and the full performance assessment pipeline. Section 5 presents the numerical experimental results, providing a comprehensive overview of model performance (Section 5.1) and a comparison of SWI predictions between five human experts and the DNN (Section 5.2). Section 6 discusses the findings and proposes directions for future work. Finally, Section 7 summarizes the main conclusions of the study.

2. Related Works

2.1. Challenges in Manual EEG Annotation and Inter-Expert Agreement

The visual assessment of EEG recordings for epileptiform activity remains the gold standard in clinical practice, but this approach is inherently limited by several critical factors. Manual annotation of EEG data is notoriously time-consuming and resource-intensive, requiring specialized expertise that is often scarce in clinical settings [17]. Moreover, the subjective nature of visual interpretation leads to significant variability between experts, even among highly trained neurophysiologists. A landmark study by Jing et al. [17] demonstrated that interrater reliability for identifying interictal epileptiform discharges (IEDs) varies considerably, with agreement rates ranging from moderate to substantial depending on the specific characteristics of the discharges. This variability underscores the fundamental challenge in establishing ground truth annotations for training automated systems.
Further research by Bagheri et al. [18] investigated the specific characteristics of interictal epileptiform discharges that contribute to expert agreement, finding that discharge morphology, amplitude, and spatial distribution significantly influence interrater reliability. These findings highlight the complex nature of EEG interpretation and the need for standardized annotation protocols. Grant et al. conducted a large single-center study examining EEG interpretation reliability and interpreter confidence, revealing that even experienced clinicians exhibit substantial variability in their assessments, particularly for ambiguous or subtle epileptiform patterns [19]. This variability has direct clinical implications, as inconsistent interpretation can lead to misdiagnosis and inappropriate treatment decisions.

2.2. Evolution of Automated EEG Analysis Methods

The development of automated methods for EEG analysis has progressed through several distinct phases over the past four decades. Early approaches focused on mimetic methods and rule-based systems that attempted to codify expert knowledge about epileptiform discharge characteristics [20]. These systems typically employed handcrafted features such as amplitude thresholds, duration criteria, and morphological templates to identify potential epileptiform events. While pioneering in their time, these methods suffered from limited generalizability and high false-positive rates, particularly when applied to diverse patient populations and recording conditions.
The advent of traditional machine learning techniques marked a significant advancement, with algorithms such as support vector machines, random forests, and artificial neural networks being applied to EEG analysis [20]. These approaches typically involved feature extraction followed by classification, with features derived from time-domain, frequency-domain, and time–frequency representations of the EEG signal. However, the performance of these methods remained constrained by the quality and relevance of the handcrafted features, which required substantial domain expertise to design and optimize.

2.3. Deep Learning Revolution in EEG Analysis

The emergence of deep learning has fundamentally transformed the landscape of automated EEG analysis. Different architectures were tested here, including deep recurrent neural networks, such as long short-term memory networks (LSTMs), and architectures from speech technologies, such as WaveNet [21]. Convolutional neural networks (CNNs) have shown particular promise for EEG analysis due to their ability to capture spatial and temporal patterns in multichannel recordings [22]. Antoniades et al. [22] demonstrated that CNNs could achieve state-of-the-art performance in detecting interictal discharges from intracranial EEG data while automatically learning clinically meaningful features that provided insight into different types of epileptiform activity.
For scalp EEG recordings, Tjepkema-Cloostermans et al. [23] presented one of the first comprehensive studies applying deep learning to focal epileptiform discharge detection, showing that deep neural networks could achieve performance approaching that of human experts. Their work highlighted the importance of large, well-annotated datasets for training robust models and demonstrated the potential of deep learning to reduce the burden of manual EEG review. More recently, da Silva Lourenço et al. [20] provided a comprehensive review of machine learning approaches for IED detection, noting that deep learning methods have yielded the best results to date and their application in the field continues to grow rapidly.

2.4. U-Net Architectures for Biomedical Signal Segmentation

The U-Net architecture, originally developed for biomedical image segmentation, has shown remarkable success in various medical imaging applications and has been adapted for one-dimensional signal processing tasks. The encoder–decoder structure with skip connections allows the network to capture both local features and global context, making it particularly suitable for segmenting epileptiform events in continuous EEG recordings. While most U-Net applications have focused on 2D and 3D medical images, recent adaptations for 1D signals have demonstrated promising results in physiological signal processing, including ECG analysis and sleep stage classification.
The success of U-Net in biomedical applications stems from its ability to handle the class imbalance problem common in medical data, where pathological events (such as epileptiform discharges) represent only a small fraction of the total recording time. The architecture’s design facilitates precise localization of events while maintaining computational efficiency, making it suitable for processing long-duration EEG recordings.

2.5. EEG Datasets Containing Expert-Annotated Epileptiform Activity Patterns

A significant advancement in public EEG resources comes from Lin and colleagues [24], who published a comprehensive dataset addressing critical limitations of existing collections. This dataset contains recordings from 84 patients, each contributing 20 min of continuous raw EEG, totaling 28 h of data. Critically, annotations were performed by at least three EEG experts, with IEDs categorized into five spatial distribution types: generalized, frontal, temporal, occipital, and centro-parietal. The dataset also includes sleep–wake-state annotations, recognizing that consciousness state influences EEG characteristics and IED detection. The authors emphasize that this is the first publicly available dataset containing spatial distribution information for IEDs, addressing a crucial gap given that spatial patterns inform epilepsy classification and presurgical assessment [24]. The dataset is available via Figshare (version 2) and has been validated using a VGG-based detection model, demonstrating improved performance when incorporating spatial and consciousness state information.
The most recent and largest contribution to the field is Omni-iEEG, presented at the International Conference on Learning Representations (ICLR) 2026 [25]. This intracranial EEG (iEEG) dataset comprises recordings from 302 patients with 178 h of high-resolution data. Notably, it includes over 36,000 expert-validated annotations of pathological events, representing the largest collection of annotated epileptiform activity to date. Omni-iEEG distinguishes itself through harmonized clinical metadata, including seizure onset zones, surgical resection locations, and outcomes validated by board-certified epileptologists. The authors position this resource as a bridge between machine learning and clinical epilepsy research, providing standardized benchmarks and clinically meaningful evaluation metrics. The dataset is designed to support reproducible and generalizable research, with code and data links available through the project page.
Addressing the specific needs of pediatric epilepsy research, a scalp EEG dataset from 21 pediatric subjects undergoing routine EEG evaluation [26] was published. Eleven subjects exhibited IEDs confirmed by neurologists, while ten served as IED-free controls. The dataset includes annotations by a neuro-technician and provides both raw recordings and 10 s segmented epochs for analysis. The authors demonstrated the utility of this dataset by evaluating a model based on exponential energy and support vector machine, positioning it as a benchmark for automated IED detection in pediatric populations.
A foundational contribution to deep-learning-based IED detection came from Tjepkema-Cloostermans and colleagues [23], who established a dataset for focal epileptiform discharge detection. This collection includes 50 EEGs from focal epilepsy patients with 1815 expert-annotated discharges, alongside 50 normal EEGs. Using this dataset, the authors demonstrated that convolutional and recurrent neural networks could achieve an area under the ROC curve of 0.94, establishing the feasibility of deep learning for clinical EEG analysis.
Another recent valuable contribution is the Harvard Electroencephalography Database (HEEDB) [27], which aggregates more than 280,000 EEG recordings from more than 108,000 patients across four Harvard-affiliated hospitals. Data are harmonized using the Brain Imaging Data Structure and hosted on the Brain Data Science Platform. EEG data are linked with clinical notes, International Classification of Diseases, 10th Revision codes, medications, and EEG reports. HEEDB fills a critical gap in EEG data availability for epilepsy research. By enabling large-scale, privacy-compliant, and clinically relevant analysis, it accelerates the development of diagnostic tools, improves training datasets for machine learning, and promotes data-sharing in alignment with FAIR (findable, accessible, interoperable, reusable).

2.6. Methodological Considerations in Expert Annotation

A critical methodological investigation by Svantesson and colleagues [28] examined the implications of expert interrater agreement for deep learning classifier development. Using a 78 min EEG with abundant periodic discharges independently annotated by two experts, the study revealed substantial discrepancies between agreement metrics. Cohen’s kappa values indicated only moderate agreement (0.53) between experts, while Gwet’s AC1, which is more robust to skewed prevalence, suggested near-perfect agreement (0.92).
This discrepancy highlights a fundamental challenge: epileptiform discharges constitute only a small fraction of total EEG data, making conventional agreement statistics potentially misleading. The authors further demonstrated that differences in expert annotations affected classifier learning, though cluster analysis revealed that all annotations were relatively similar in identifying periodic discharges. The study underscores the need for careful consideration of annotation reliability when developing and evaluating automated detection systems.
Complementing the focus on IED detection, Tăuţan and colleagues [29] developed algorithms for estimating frequency and spatial extent of rhythmic and periodic epileptiform patterns. Their study, based on 1087 continuous EEG segments annotated by three expert neurophysiologists, demonstrated that automated methods can match or exceed expert agreement levels. For rhythmic delta activity, expert-algorithm intraclass correlation coefficients ranged from 66 to 96 % , comparable to expert–expert agreement (60– 92 % ). This work suggests that automated quantification tools may enable large-scale EEG studies that were previously infeasible due to manual annotation constraints.

2.7. Topographic Interpretation and Focus Labeling

IED localization was based on the estimated cortical generator zone rather than on a simple enumeration of channels showing visible activity. In bipolar montage, each derivation represents a voltage difference between two adjacent electrodes; therefore, interpretation of epileptiform activity required assessment of polarity, phase reversal, amplitude gradients, and the spatial distribution of the field across neighboring channels.
For tabular reporting, the following notation was used:
  • ‘P4–T6’ indicated a broad or shared right posterior temporal–parietal epileptiform field involving both P4 and T6. This notation was used when discharges appeared synchronously in both derivations with comparable amplitude, or when the amplitude maximum shifted between these adjacent electrodes across repeated discharges.
  • ‘P4; T6’ indicated two independent epileptiform foci involving P4 and T6. This notation was used when discharges appeared asynchronously, without a stable shared field or consistent temporal coupling.
  • ‘P4–T6 ⇒ C4’ indicated a dominant epileptiform generator in the P4–T6 region with occasional synchronous propagation toward C4. The arrow denoted an attenuating spatial spread rather than an independent central focus.
Thus, the final clinical interpretation referred to epileptogenic regions or generator zones, not merely to individual bipolar derivations. For example, a downward spike in F3–C3 indicating maximal activity under C3, a downward spike in F7–T3 indicating maximal activity under T3, an upward spike in T3–T5 indicating maximal activity under T3, and an upward spike in C3–P3 indicating maximal activity under C3 were interpreted together as evidence of a regional field distribution rather than as four separate channel-level abnormalities.

2.8. Current Limitations and Research Gaps

Despite significant advances in automated EEG analysis, several important limitations persist. Most existing studies have focused on relatively small, homogeneous datasets, limiting the generalizability of developed models to diverse patient populations and recording conditions [20]. The lack of standardized evaluation metrics and benchmark datasets makes it difficult to compare different approaches objectively. Additionally, many automated systems operate as ‘black boxes’, providing limited insight into their decision-making processes, which hinders clinical adoption.
There remains a critical need for large, comprehensively annotated EEG databases that capture the full spectrum of epileptiform activity across different epilepsy syndromes, age groups, and recording conditions. Furthermore, most current approaches focus on detection rather than precise segmentation of epileptiform events, which is essential for accurate quantification of epileptiform burden. The integration of multimodal data, including clinical information and neuroimaging findings, represents another important direction for future research.

2.9. Contribution of the Present Work

The current study addresses several of these limitations by developing a 1D U-Net-based approach for precise segmentation of epileptiform activity in EEG recordings. Our work contributes to the field in several important ways: (1) we collected and annotated a custom database of EEG recordings with epileptiform activity using multiple independent experts to establish robust ground truth annotations; (2) we implemented a segmentation-based approach rather than mere detection, enabling precise quantification of epileptiform burden; (3) we conducted comprehensive comparisons between automated and expert annotations, including calculation of spike-wave index.
By demonstrating performance approaching inter-expert agreement within the examined cohort, our approach represents a significant step toward reliable automated EEG analysis that could support clinical decision making, accelerate diagnosis, and facilitate the development of targeted therapeutic strategies for epilepsy.

3. Materials and Data Recording Details

3.1. Ethics Statement

The study was conducted in accordance with the Declaration of Helsinki, and approved by the Bioethics Committee of the Institute of Biology and Biomedicine, National Research Lobachevsky State University of Nizhny Novgorod (protocol # 102, date of approval 27 August 2025).

3.2. Custom Database of Clinical Records from Patients with Epilepsy

The data were obtained from clinical epileptologists at the medical clinic of the Privolzhsky Research Medical University of the Ministry of Health of the Russian Federation, Nizhny Novgorod, and the Research Clinical Institute of Pediatrics and Pediatric Surgery named after Academician Yu.E. Veltischev of the Federal State Autonomous Educational Institution of Higher Education ‘N.I. Pirogov Russian National Research Medical University’ of the Ministry of Health of the Russian Federation, Moscow.

3.2.1. Data Acquisition and Automatic Preprocessing by ‘NeuroScope’ Software, Version 6.3.2497 (BIOLA LLC, Moscow, Russia)

Recordings were reviewed using both bipolar and monopolar montages. Recording parameters were as follows:
  • Sweep speed: 30 mm/s;
  • Sensitivity: 7–15 μ V/mm;
  • Low-frequency cutoff: 0.5 Hz;
  • High-frequency cutoff: 70 Hz;
  • Notch filter: 50 Hz.

3.2.2. Participants

A total of 41 recordings registered from 35 individuals with a confirmed diagnosis of epilepsy were included in the train group. Some subjects contributed more than one recording, as the recordings were obtained during separate sessions with a time interval between them (at least 1 year). The group was stratified into the following age cohorts:
  • Early childhood (1–3 years): 3 patients (ages 3, 3, 3);
  • Preschool age (4–6 years): 13 patients (ages 4, 4, 4, 4, 4, 4, 5, 5, 5, 5, 5, 6, 6);
  • Primary school age (7–11 years): 21 patients (ages 7, 7, 7, 7, 7, 7, 8, 8, 8, 8, 8, 8, 8, 9, 10, 10, 10, 11, 11, 11, 11);
  • Adolescence (12–18 years): 4 patients (ages 12, 12, 12, 13).
The median age in the group was 7 years (range: 3–13 years).
A total of 10 recordings registered from 10 individuals with a confirmed diagnosis of epilepsy were included in the test group.
The group was stratified into the following age cohorts:
  • Early childhood (1–3 years): 1 patient (age 3);
  • Preschool age (4–6 years): 3 patients (ages 4, 4, and 6);
  • Primary school age (7–11 years): 6 patients (ages 8, 8, 8, 8, 10 and 10).
The median age in the group was 8 years (range: 3–10 years).
Additional clinical and recording-related metadata are provided in Appendix A Table A1. The table includes patient age and sex, dataset allocation, anti-seizure medication status and total daily dose at the time of EEG recording, clinical diagnosis or epilepsy syndrome according to ILAE terminology where available, annotated EEG state, the topography of epileptiform discharges and SWI. For each recording, a 10 min EEG fragment was used for expert annotation and model training or evaluation. These metadata were included to facilitate interpretation of model performance across clinically heterogeneous recordings.

3.2.3. Annotation of Patterns of Epileptiform Activity

Ten-minute EEG segments were selected for manual annotation of interictal epileptiform discharges (IEDs). Candidate epileptiform transients were evaluated according to the six sensor-space criteria proposed by the International Federation of Clinical Neurophysiology (IFCN): sharp or spiky morphology, duration different from the background activity, waveform asymmetry, an after-going slow wave, disruption of the surrounding background activity, and a scalp distribution compatible with a cerebral source. The clinical validation study by Kural et al. demonstrated that the presence of five IFCN criteria in sensor space provides high specificity for IED identification and is suitable for clinical implementation [5].
IEDs were classified into two confidence categories according to the number of fulfilled IFCN criteria and their recurrence within the recording:
  • Definite IEDs: Transients fulfilling at least five of the six IFCN sensor-space criteria. These events were considered high-confidence epileptiform discharges and were used as reliable positive examples for deep learning model training. Definite IEDs provided clean prototypes of epileptiform morphology, temporal structure, after-going slow wave configuration, and physiologically plausible spatial field distribution. Their inclusion was intended to reduce label noise and stabilize early model learning.
  • Possible IEDs: Transients fulfilling at least three IFCN criteria and showing recurrent occurrence within the analyzed EEG segment. These events represented borderline epileptiform patterns that could not be confidently classified as definite IEDs but were not considered random sharp transients or isolated artifacts. Possible IEDs were used as lower-confidence or hard-training examples, helping the model learn the transition zone between unequivocal epileptiform discharges, benign sharp transients, physiological variants, and artifacts.
The use of both definite and possible IED categories was intended to improve model robustness by preventing overfitting to only idealized spike-and-wave patterns. This strategy allowed the neural network to learn generalized epileptiform features across patients, recording systems, montages, age groups, sleep stages, and background EEG abnormalities.
IED boundaries were marked from the first clear deviation from the baseline, either positive or negative, through the end of the associated slow wave. If the discharge was followed by subsequent rhythmic or semi-rhythmic activity, the annotation ended before the onset of the next independent wave, in order to avoid merging adjacent discharges into a single event.
Both definite and possible IEDs were included in the training data, but they were weighted differently according to annotation confidence. Definite IEDs were treated as high-confidence positive events and assigned a target weight of 1.0. Possible IEDs were included as lower-confidence positive examples and assigned a reduced target weight of 0.5. This weighting scheme allowed the model to learn from borderline epileptiform patterns while reducing the influence of uncertain events compared with definite IEDs.

3.3. Data and Preprocessing

The complete dataset used for consisted of 51 EEG recordings obtained from 45 subjects. Each recording contained a 10 min fragment with expert annotations of epileptiform activity. The recordings had different sampling rates: 199.5, 500, and 1000 Hz.
The dataset was split at the subject level into training and test subsets. The test subset included 10 recordings from 10 subjects and was used for medical evaluation and comparison of the SWI. The remaining 41 recordings were used for training the segmentation model. No subject was present in both the training and test subsets, preventing patient-level data leakage.
All EEG recordings were provided in a bipolar montage and contained 20 channels: 19 EEG channels and 1 ECG channel. The signals were initially preprocessed using the automatic tools of the ’Neuroscope’ software. No additional frequency filtering was applied. Further preprocessing included resampling all recordings to the lowest sampling rate, normalization to zero mean and unit variance, and clipping of extreme amplitude values exceeding | a | = 10 . This clipping step was used to reduce the influence of high-amplitude artifacts and outliers.
During postprocessing, short isolated network predictions were removed, and predicted epileptiform activity segments separated by gaps shorter than a predefined threshold were merged. This threshold was treated as an optimized parameter.

4. Methodology

4.1. U-Net Architecture

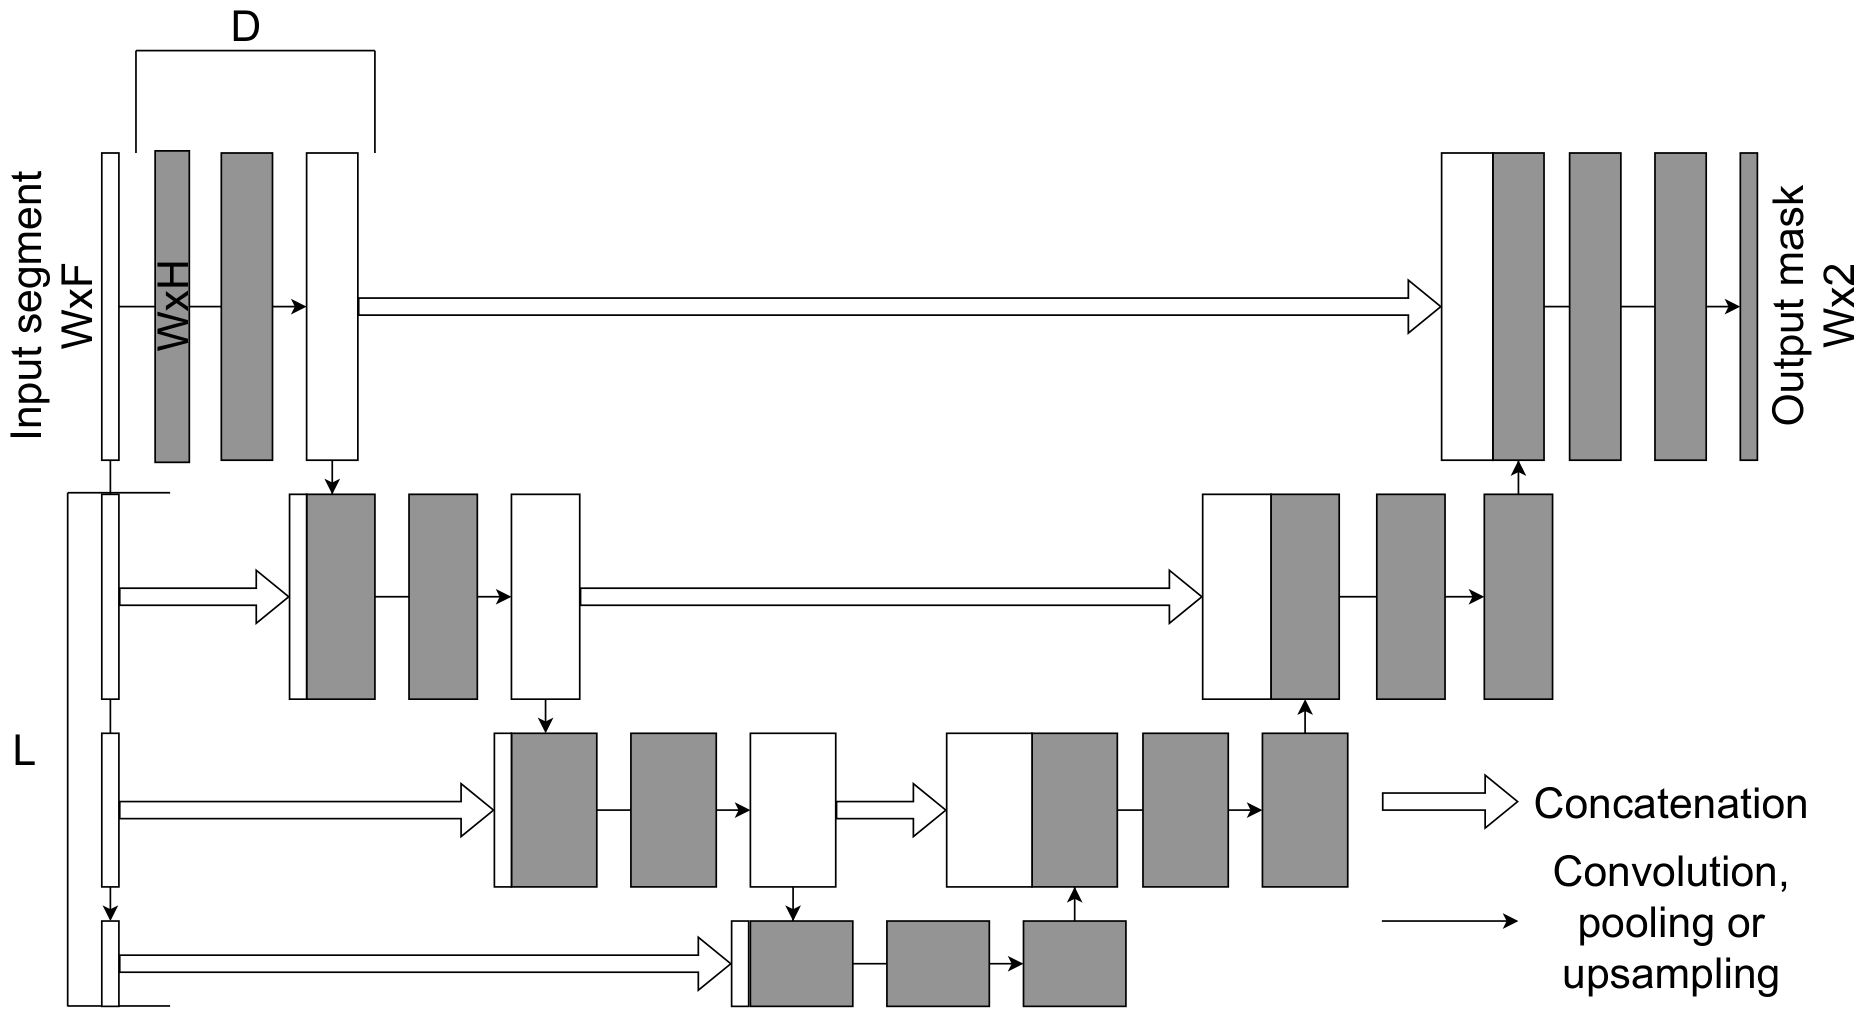
The U-Net model [30] is the most popular convolutional DNN model for medical image [31,32] and time series [33] segmentation tasks. The 1D U-Net architecture is an adaptation of the widely used U-Net model, originally designed for 2D image segmentation, tailored for one-dimensional sequential data. This network is particularly useful in applications involving time-series analysis, such as signal processing and biomedical data interpretation. The schematic representation of the 1D U-Net network architecture is presented in Figure 1. Note that 1D U-Net, like its 2D counterpart, follows an encoder–decoder structure with residual connections, allowing it to effectively capture both local and global features in sequential data. The encoder’s blocks pass their output to the corresponding decoder’s blocks. The encoder reduces the input dimensionality through successive downsampling layers, while the decoder reconstructs the signal with upsampling operations, preserving fine details through residual connections that bridge high-resolution features from the encoder to the decoder.
The network receives a W × F EEG recording segment as input, followed by L step-down blocks that include convolutions to expand the channels and reduce the time resolution and D convolution layers with residual connections. After that, there are L expansion blocks, including upsampling, concatenation with output of the corresponding step-down block, convolution with decreasing channels and D convolution layers with residual connections. At the end, there is a classification by one-dimensional convolution with a kernel 1. The output is a mask of the size W × 2 .
A similar 1D U-Net model showed competitive quality of segmentation in task of automatic sleep spindles segmentation in EEG recordings from patients with epilepsy and controls [34]. One of the key advantages of the 1D U-Net is its ability to handle long-range dependencies in sequential data while maintaining computational efficiency. This makes the 1D U-Net particularly effective for tasks requiring precise localization, such as segmentation of physiological signals like electrograms [35,36], ECG [37,38] and EEG [34,39]. Additionally, its symmetric structure ensures that the model retains critical information across different temporal scales, making it a versatile choice for various challenges in the processing of one dimensional signals.
Hyperparameters were optimized using the random search method from the Optuna library [40]. The best hyperparameters were chosen by the averaged value of F1-score using described cross-validation scheme. The optimized window size was 3625 points, the number L of downsampling and upsampling layers was 4, and D convolution layers with residual connections was 4. Kernel size of the convolutions was 12, postprocessing threshold was 20, and hidden layer size H was 132.

4.2. Training Process and Evaluation Metrics

To improve the training process of deep neural networks, the segmentation task was posed as a classification task. Each time point was assigned a class: 1 if it belonged to a labeled region of the epileptiform activity complex, and 0 otherwise. Therefore, a binary classification task was solved for each time point in the EEG recording. The model predicted the degree of confidence in a given class. The class with the highest degree of confidence was assigned as the answer. This formed a mask of 0 and 1, which is the result of the EEG recording segmentation.
For the evaluation metrics we considered precision, recall and F1-score:
Precision = TP TP + FP ;
Recall = TP TP + FN ;
F 1 = 2 Precision Recall Precision + Recall ;
where TP is the number of true positive detections, FP is the number of false positive detections and FN is the number of false negative detections, correspondingly.
The training process was organized as follows. Due to the limited dataset (per patient), the model was trained using a cross-validation approach. In each iteration, all records except five of them were used for training, while the remaining five records were held out for evaluation. Cross-validation was performed at the patient level. No EEG segments from the same patient were present in both training and validation folds. This method was chosen instead of the traditional train–test split to provide a more generalized assessment of the model’s performance given the small dataset size. By employing this strategy, the evaluation better reflects the networks’ ability to generalize across different patient records, reducing potential bias from a single random split. The approach ensures that performance metrics are averaged over multiple folds, offering a more robust estimate of the model’s effectiveness in real-world scenarios.
As the loss function for the segmentation task, we optimized both binary cross entropy (BCE) loss and Dice:
Loss = 1 2 BCE + 1 2 Dice .
Here, BCE loss is calculated as follows:
BCE = 1 n i = 1 n ( y i l o g ( y i ^ ) + ( 1 y i ) l o g ( 1 y i ^ ) ) ,
where n is number of training sequences, y i is correct sample and y i ^ is predicted sample. Dice loss is calculated as follows:
Dice = 1 2 i = 1 n y i y i ^ i = 1 n y i + y i ^ .

4.3. The Pipeline

In our study, 10 unique EEG recordings (test group) that had not been used for neural network training, validation, or hyperparameter optimization were selected. From each recording, a 10 min segment was randomly extracted for independent expert review.
Then, five experts in EEG interpretation independently evaluated the selected 10 min segments and estimated the SWI as the percentage of the segment occupied by spike-wave or epileptiform discharges.The experts were blinded to the output of the neural network and to each other’s assessments, as well as to a clinical diagnosis of patients. After four months, the same recordings were presented to these experts again in a shuffled order, without informing them that the recordings had already been evaluated. Experts performed visual SWI estimation only and did not provide full temporal annotations of all epileptiform events. Therefore, the expert–model comparison was interpreted as agreement in clinical SWI estimation, whereas the model’s temporal segmentation performance was evaluated separately against the expert-derived ground truth annotation.
Human SWI estimates were first compared across experts to determine interrater variability. The consensus human estimates, defined as the mean value among the assessors, were compared with the outputs of the proposed model, which performed point-wise annotation of epileptiform activity in each recording. SWI was then calculated as the percentage of the recording occupied by epileptiform activity. The same calculation was also applied to the ground truth annotation, which was obtained from the consensus annotations provided by the expert group.
SWI = T SW T total × 100 % ,
where T SW is the total duration of segments containing epileptiform activity, and T total is the total duration of the recording.
The agreement between manual and automated SWI estimation was assessed using mean deviation from expert ratings and correlation analysis. This design allowed for the evaluation of whether the automated annotation system performed within the expected range of expert-to-expert variability rather than being compared with a single potentially biased human reference.

5. Results

5.1. A Comprehensive Overview of the Model’s Performance

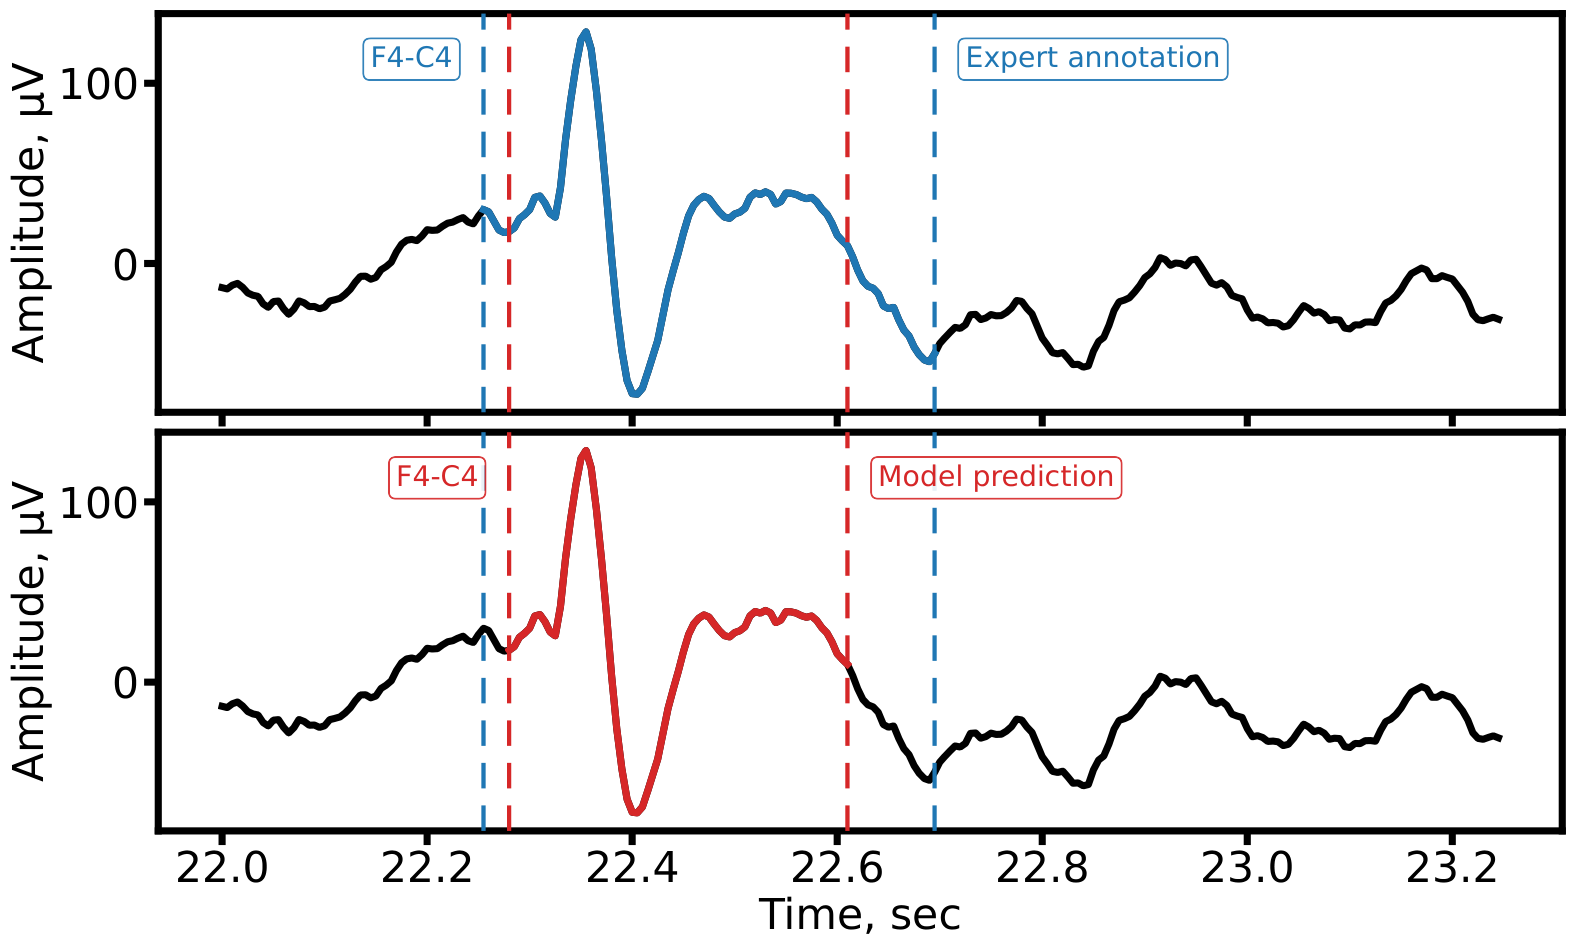
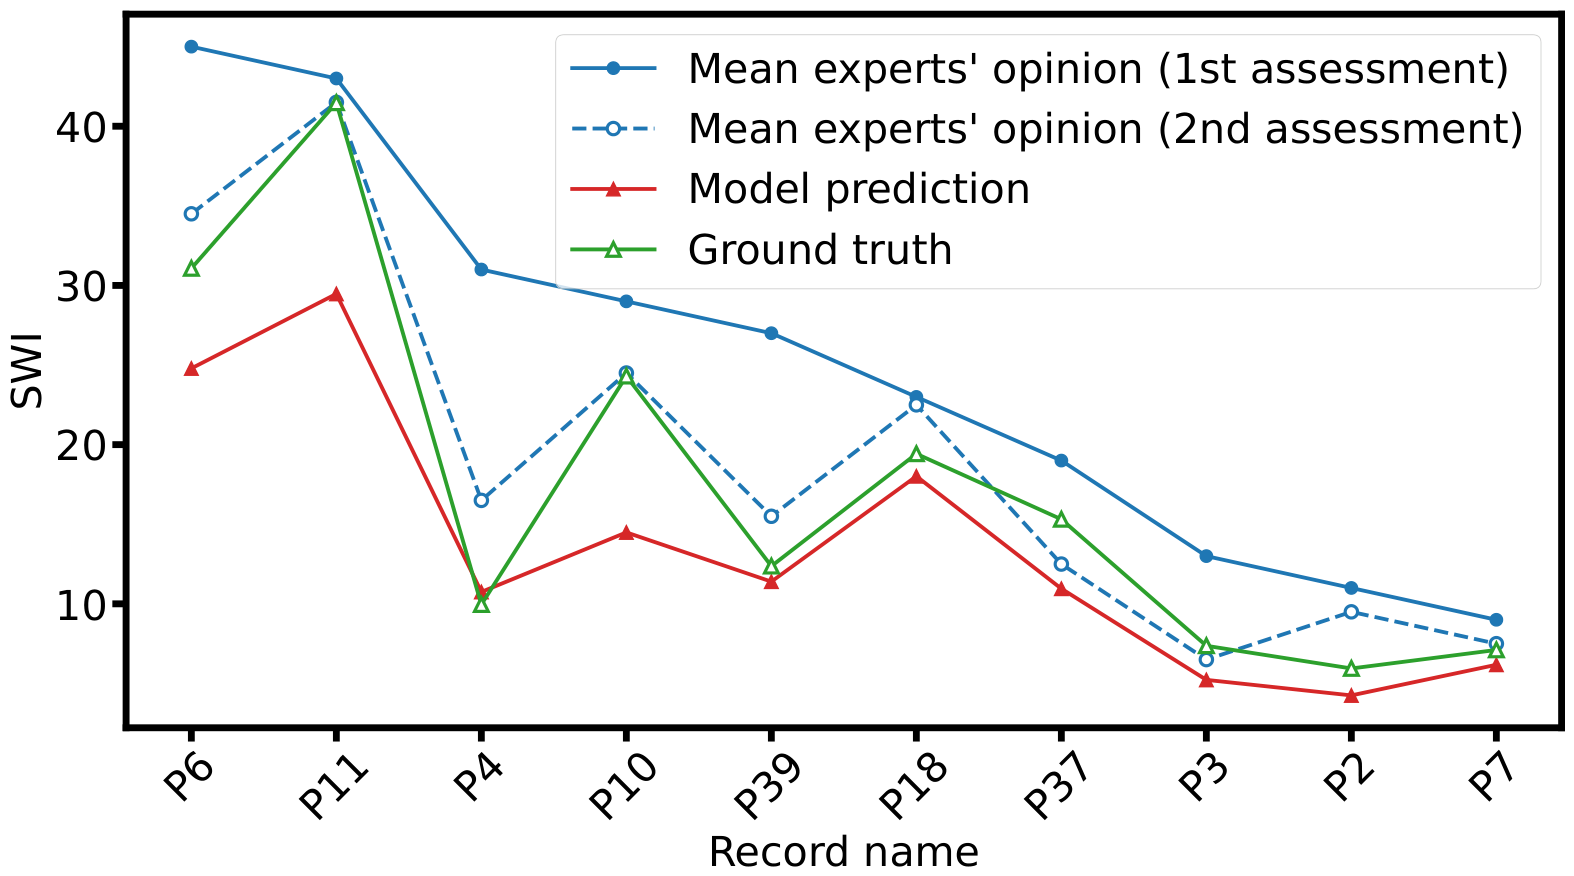
Table 1 presents a comprehensive overview of the model’s performance on the test cohort. The quality of epileptiform spike segmentation was assessed using an event-based F1-score, where a true positive is counted if there is any overlap between a predicted and a ground truth spike segment, as opposed to a point-wise comparison of each time sample. The results indicate strong performance, with F1-scores exceeding 0.9 for 5 out of 10 patients and dropping below 0.8 for only 2 cases (P7 and P2). A comparison between the ground truth and predicted SWI reveals that the model tends to underestimate the value of SWI, but in most cases, its prediction falls within the range of expert opinions. Examples of expert annotation and automatic segmentation of epileptiform spike on the F4–C4 lead recorded from a patient with epilepsy are shown in Figure 2.

5.2. Five Experts vs. DNN

Figure 3 demonstrates that both the neural network predictions and the averaged expert ratings are correlated with the ground truth (GT). The Pearson correlation coefficient between the average medical opinion and GT is 0.872 , whereas the correlation between the network output and GT reaches 0.968 . At high values of the SWI, the network systematically underestimates the SWI. If this bias proves consistent in a larger dataset, it may indicate a need for a multiplicative correction factor to the model’s output to proportionally increase the predicted SWI. In contrast, the averaged expert ratings generally overestimate the GT.
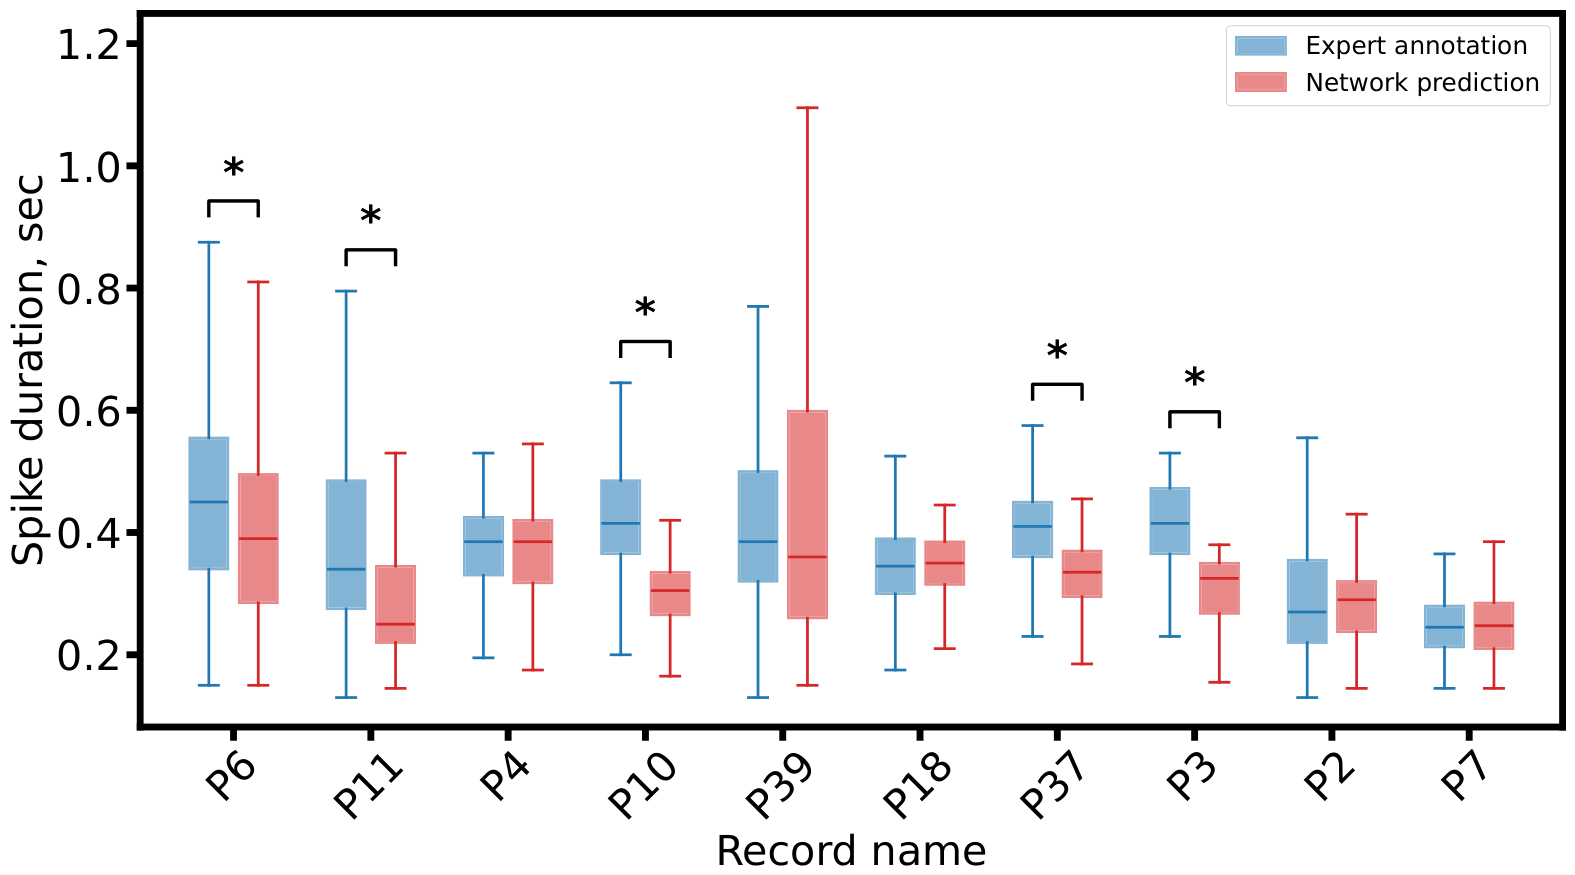
Furthermore, Figure 4 shows that, for the majority of recordings, the mean spike duration predicted by the model is shorter than that of the ground truth. We compared the durations of individual spike-wave events between the ground-truth expert annotations and the model predictions separately for each test recording. Two-sided Mann–Whitney U- and Brunner–Munzel tests were used, with the significance threshold set at α = 0.01 . A statistically significant difference in spike-wave duration between expert annotations and model predictions was found in 5 of 10 recordings for both tests.
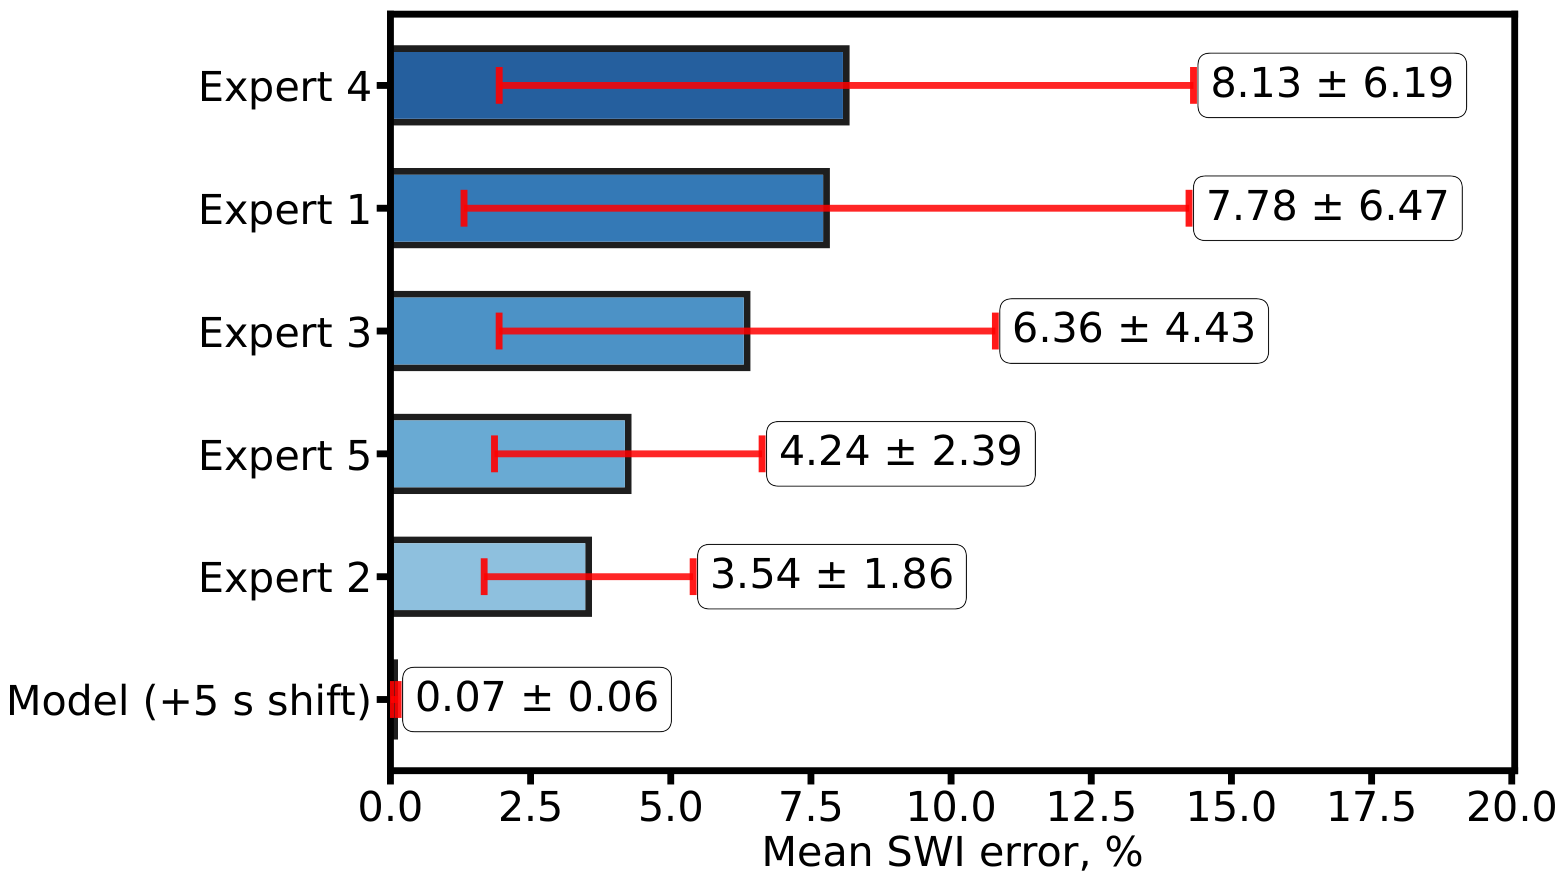
As can be clearly seen from Figure 5, the mean intrarater difference in the SWI between the first and second assessment by the same expert ranged from 3.54 % to 8.13 % , depending on the expert. Experts with a larger mean intrarater difference also exhibited a higher variance in these differences, indicating that the magnitude of score change between assessments was highly patient-dependent: for some patients the SWI changed minimally, while for others it changed substantially. Moreover, this variability could be large enough to cause the same patient to be assigned to different SWI risk categories by the same expert across repeated assessments. These findings underscore the need for an automated method that minimizes such inconsistency.
Also, we statistically compared the intrarater SWI differences obtained for Expert 4 and Expert 2. Because the same set of recordings was assessed by both specialists, a paired Wilcoxon signed-rank test was used; for completeness, we also performed a Mann–Whitney U-test. The difference did not reach statistical significance at the α = 0.05 level: p = 0.0625 for the Wilcoxon signed-rank test and p = 0.057 for the Mann–Whitney U-test. Thus, although Expert 4 showed a numerically larger intrarater SWI difference than Expert 2, this difference should be interpreted only as a borderline trend and not as a statistically significant effect.
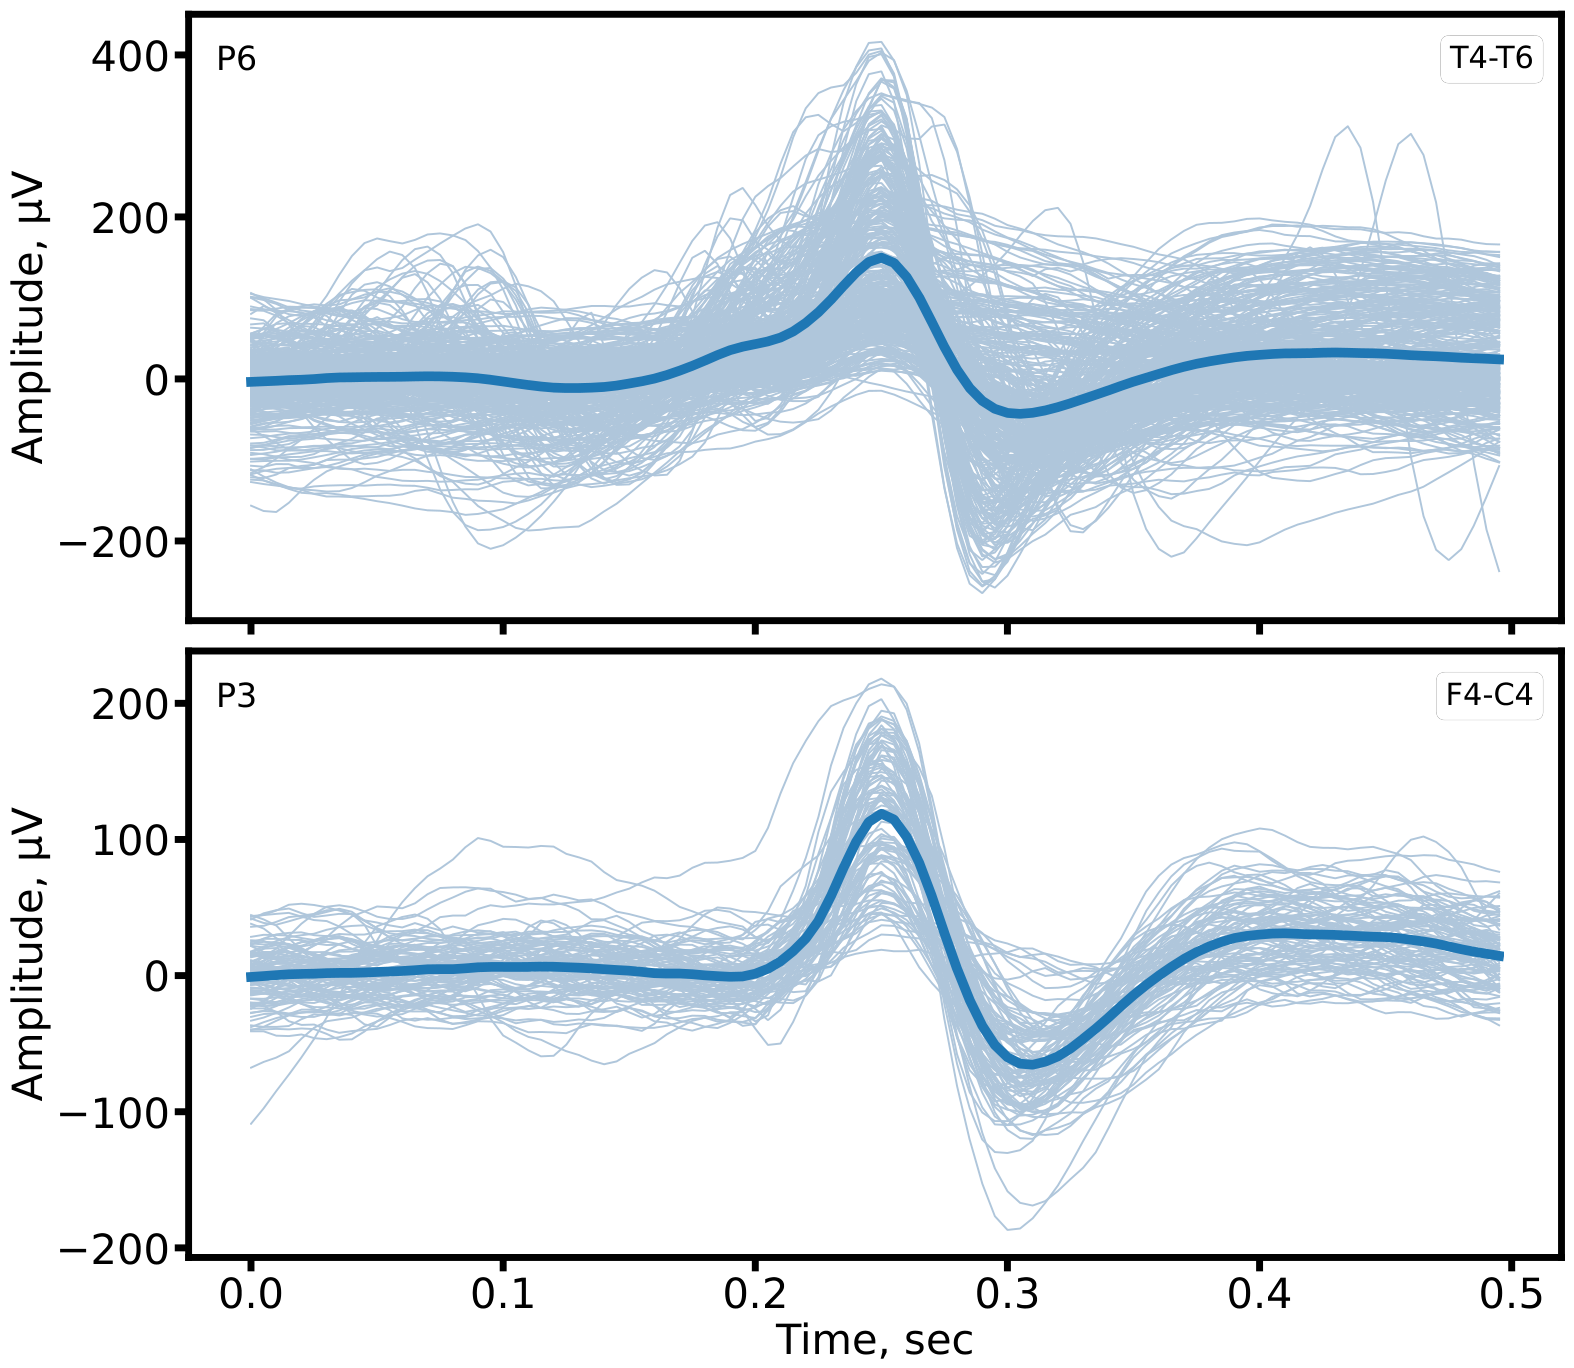
Figure 6 shows all detected spikes, together with their average waveforms, for two representative recordings: patient P6, who exhibited the highest inter-expert variability during the first assessment, and patient P3, who exhibited the lowest inter-expert variability across both assessments. The spikes from the recording with lower inter-expert variability display markedly lower temporal dispersion than those from the recording with higher inter-expert variability. This observation suggests that morphologically homogeneous spikes are more easily distinguished from background activity by human experts, thereby contributing to higher interrater agreement.
To further characterize model performance, we additionally calculated precision, recall, false-negative rate, and point-wise segmentation metrics. Event-based performance reflects whether epileptiform events were detected as discrete events, whereas point-wise metrics evaluate the temporal overlap between the predicted and reference segmentation masks. Therefore, point-wise metrics provide a stricter assessment of temporal segmentation accuracy and are more sensitive to underestimation of event duration.
Event-based detection performance is shown in Table 2. False-positive rate was not calculated for the event-based analysis, because true-negative events are not defined in this setting.
As can be seen from Table 2 and Table 3, the point-wise metrics were lower than the event-based metrics, mainly due to reduced recall. This indicates that the model often detected epileptiform events but predicted shorter segments than those annotated by experts. Thus, the model may correctly identify the presence of an epileptiform event while underestimating its temporal duration. In addition, isolated very short positive predictions may represent fragmented network outputs rather than separate clinically meaningful events, whereas short gaps between neighboring positive intervals were not merged in the present analysis. These factors further reduce point-wise performance. In the event-based analysis, this issue was partly addressed by postprocessing, which removed very short isolated detections and merged neighboring positive intervals separated by brief gaps before event-level metrics were calculated.

6. Discussion

The present study evaluated a 1D U-Net architecture for automatic segmentation of epileptiform activity in scalp EEG and subsequent calculation of SWI, comparing its performance against independent assessments by five clinical experts. The results demonstrate that the proposed deep neural network achieves high segmentation fidelity, with F1-scores exceeding 0.9 in half of the test recordings, and yields SWI estimates that correlate more strongly with the consensus ground truth ( r = 0.968 ) than the averaged expert visual estimates ( r = 0.872 ). These findings confirm that a properly trained deep learning model can attain a level of agreement with carefully curated annotations that matches, and in some respects surpasses, the consistency observed among human raters.

6.1. Model Bias and Potential Calibration

A notable observation is the systematic tendency of the model to underestimate the SWI, particularly at higher values, while the averaged expert estimates tend to overestimate the ground truth. The overestimation by experts may reflect the holistic nature of visual scoring, in which raters integrate spatial and temporal context in a way that expands perceived discharge boundaries beyond those marked during detailed annotation. The model’s underestimation, in contrast, is likely attributable to its conservative segmentation: the predicted mean spike duration was shorter than that of the ground truth for most records, indicating that the network captures the core of the epileptiform transient but may truncate the lower-amplitude onset and after-going slow-wave components. This behavior is consistent with the use of a loss function that balances sensitivity and precision; the Dice component penalizes false positives heavily, encouraging compact predictions. If confirmed on larger cohorts, this bias could be compensated by a multiplicative correction factor, thereby aligning the automated SWI more closely with clinical benchmarks. Moreover, such calibration may vary across SWI ranges, discharge morphologies, montages, background EEG characteristics, and sleep states.

6.2. Reproducibility and Test–Retest Variability

The test–retest variability of the experts, with intrarater differences ranging from 3.54 % to 8.13 % , underscores a well-known limitation of manual SWI estimation. Experts with higher mean intrarater differences also showed larger variance, implying that for some patients the SWI changed minimally between assessments, while for others it shifted substantially, occasionally enough to reclassify the patient into a different risk category. In contrast, the deterministic output of the neural network (evaluated with a 5 s shift of the input) exhibited negligible variation, demonstrating the superior reproducibility of automated analysis. This consistency is a critical advantage in clinical practice, where therapeutic decisions often hinge on small changes in epileptiform burden over time. Nevertheless, the limited number of test recordings restricts the statistical power of direct comparisons between individual experts, and the borderline difference between Expert 4 and Expert 2 should therefore be interpreted cautiously.

6.3. Morphological Factors Influencing Agreement

The relation between inter-expert agreement and spike morphology provides further insight. The recording with the lowest variability (P3) displayed spikes with markedly lower temporal dispersion than those from the recording with the highest inter-expert variability (P6). Morphologically heterogeneous discharges are inherently more ambiguous, blurring the boundary between epileptiform transients and background activity. The model achieved an F1-score of 0.92 on P6, indicating that, while it remains robust, such recordings are likely to challenge any annotation system—human or automatic. This finding suggests that automated tools could help to standardize interpretation by offering a reference that is invariant to subjective factors, potentially reducing the clinical uncertainty associated with recordings that evoke poor expert consensus.

6.4. Clinical Implications

From a clinical perspective, an automated SWI algorithm with demonstrated reliability could address several unmet needs. SWI serves as a quantitative biomarker for disease severity and treatment response. Manual calculation over prolonged recordings is prohibitively time-consuming, limiting its use in routine care. An automated method that operates on long-duration EEG, including overnight recordings, could enable continuous objective monitoring, facilitate early detection of deterioration, and support titration of therapy. Moreover, by providing a consistent reference, such a tool could harmonize SWI reporting across different centers and reduce the diagnostic variability that arises from differing levels of expertise or subjective judgment.

6.5. Relation to High-Frequency Oscillation Biomarkers

The present work focuses on conventional epileptiform activity segmentation in scalp EEG and on SWI estimation, a clinically established measure of spike-wave burden. This should be distinguished from emerging high-frequency EEG biomarkers, such as high-frequency oscillations (HFOs), including ripples and fast-ripples, which have been proposed as markers of epileptogenic tissue and epileptogenic network activity [41]. HFOs are commonly divided into ripples and fast-ripples, with fast-ripples generally occupying the higher-frequency range and often considered more specific for pathological epileptogenic activity [42]. Clinical studies have also suggested that fast-ripple rates in intracranial recordings may help localize epileptogenic tissue and predict epilepsy surgery outcomes [43]. More recent work further suggests that fast-ripples may arise as emergent properties of neuronal networks rather than simply representing isolated waveform events [44]. However, high-frequency oscillation detection requires different recording conditions, sufficient sampling rates, frequency-specific preprocessing, and dedicated validation strategies. Therefore, fast-ripple detection is outside the scope of the present model, which was developed for spike-wave/IED segmentation and SWI calculation. Nevertheless, the proposed segmentation framework contributes to the same broader direction: the development of reproducible automated tools for quantitative EEG biomarker analysis.

6.6. Limitations

Several limitations of this work should be acknowledged. The test dataset comprised only ten pediatric patients, predominantly between 4 and 10 years of age, limiting the generalizability of the findings to adult populations or to epilepsy syndromes not represented in the sample. The ground truth annotations were derived from expert consensus, which itself may contain systematic biases; an external, independently validated reference standard would strengthen future evaluations. The model’s systematic SWI underestimation, although correctable in principle, requires validation across diverse recording conditions and electrode montages before a global correction factor can be recommended. Additionally, all recordings were acquired with standard clinical amplifiers and pre-processing, and the model’s performance on data from different hardware or with lower signal-to-noise ratios remains untested.
Although repeated expert assessments often differed across the examined recordings, the extent of this difference was not uniform: in some cases, the reassessment difference was moderate, whereas in others it was higher. This variability likely reflects the inherent difficulty of visual SWI estimation, including heterogeneity of epileptiform activity morphology, differences in discharge density, background EEG abnormalities, and possible sleep-state effects. Therefore, high variability in repeated specialist assessments should be considered an important limitation of manual SWI scoring in this study.

6.7. Future Works

Future work should extend validation to larger, multicenter datasets that include a broader spectrum of age, epilepsy types, and sleep–wake states. Incorporating sleep staging information could further refine SWI calculation, given that epileptiform activity often exhibits state-dependent fluctuations. Exploring architectures that explicitly model onset and offset boundaries, such as attention-based or multi-task networks, may reduce the truncation of discharges. From a translational standpoint, prospective clinical studies are needed to assess whether automated SWI measurements lead to improved patient outcomes, for instance by enabling earlier therapeutic adjustments in SWAS or by providing objective endpoints in clinical trials. The integration of the algorithm into user-friendly EEG review software, with visual overlays and quality indicators, would be a pragmatic next step toward clinical deployment.

7. Conclusions

In this work, we addressed the critical task of automating the segmentation of epileptiform activity in EEG recordings to calculate the clinically significant index SWI. The scientific significance of this study lies in demonstrating that a properly trained deep neural network can provide reproducible segmentation of epileptiform activity and SWI estimation with performance approaching expert agreement within the examined pediatric EEG cohort, thereby offering an objective, scalable alternative to subjective manual annotation. By leveraging a 1D U-Net architecture and training it on a custom database annotated by experts, we have shown that deep neural networks can achieve a level of performance that sits within the range of inter-expert agreement. Our results demonstrate that the 1D U-Net provides robust and high-quality segmentation, with event-based F1-scores above 0.9 for half of the patients in our test cohort, and the automated SWI calculation correlates strongly with both the ground truth and the average medical opinion, validating its utility as a quantitative biomarker.
The analysis revealed that the model exhibits a tendency to underestimate SWI, likely due to predicting shorter spike durations compared to experts. Furthermore, the significant intra- and inter-expert variability observed in manual annotation strongly motivates the adoption of automated, objective tools for EEG analysis. An additional key advantage of the proposed approach lies in its scalability and consistency: while a physician typically bases their assessment on a relatively short fragment of the recording due to time constraints, the neural network can efficiently analyze long-duration EEG records in their entirety. This capability allows for a more comprehensive and representative calculation of the SWI, potentially leading to a more accurate characterization of the patient’s epileptiform burden and reducing the risk of conclusions drawn from unrepresentative samples.
The proposed approach may support SWI quantification and reduce annotation burden, but clinical utility requires prospective validation. Future work should focus on validating these findings on larger, more diverse multicenter datasets and exploring the clinical utility of this tool for accelerated diagnosis and the development of targeted therapeutic strategies for epilepsy.
Automatic segmentation of epileptiform activity patterns can be considered a core component of an automated EEG analysis tool for epilepsy. Such a tool could potentially encompass the analysis of epileptiform spikes in both daytime and overnight monitoring, as well as auxiliary modules for evaluating sleep spindle modifications induced by epilepsy during non-rapid eye movement stage 2 sleep [34] and for assessing changes in background rhythmic brain activity associated with the development of epilepsy [45].
With continued refinement and robust clinical validation, automated epileptiform activity segmentation has the potential to reduce the workload of EEG readers, harmonize quantitative EEG reporting across different medical centers, and therefore ultimately improve the management of patients with epilepsy.

Author Contributions

Conceptualization, A.V.L., A.A.S., O.D.E., L.A.S., T.A.L. and A.N.P.; methodology, N.V.G., A.A.S., A.D.G., A.V.L., A.M.B., V.Y.B. and A.E.M.; software, N.V.G.; validation, A.A.S., A.D.G., A.V.L., O.D.E., L.A.S., T.A.L. and A.N.P.; investigation, N.V.G., A.V.L., T.A.L. and L.A.S.; data curation, N.V.G. and A.E.M.; writing—original draft preparation, N.V.G., A.V.L., A.A.S., T.A.L., L.A.S. and A.N.P.; writing—review and editing, A.V.L., T.A.L. and A.N.P.; visualization, N.V.G.; supervision, A.V.L., T.A.L., L.A.S. and A.N.P.; project administration, A.V.L. and T.A.L.; funding acquisition, L.A.S. All authors have read and agreed to the published version of the manuscript.

Funding

This work was supported by the Ministry of Economic Development of the Russian Federation (grant no. 139-15-2025-004 dated 17 April 2025, agreement identifier 000000Ц313925P3X0002).

Institutional Review Board Statement

The study was conducted in accordance with the Declaration of Helsinki, and approved by the Bioethics Committee of the Institute of Biology and Biomedicine, National Research Lobachevsky State University of Nizhny Novgorod (protocol # 102, date of approval 27 August 2025).

Informed Consent Statement

Written informed consent for participation and publication was obtained from the parents or legal guardians of all pediatric participants involved in the study.

Data Availability Statement

The datasets generated and/or analyzed during the current study are available from the corresponding author on reasonable request.

Acknowledgments

During the preparation of this manuscript/study, the authors used DeepSeek-V4 for the purposes of language editing. The authors have reviewed and edited the output and take full responsibility for the content of this publication.

Conflicts of Interest

Authors A.A.S. and A.D.G. were employed by Genomed Ltd. The remaining authors declare that the research was conducted in the absence of any commercial or financial relationships that could be construed as a potential conflict of interest.

Abbreviations

The following abbreviations are used in this manuscript:
AIArtificial Intelligence
BCEBinary Cross-Entropy
CNNConvolutional Neural Network
CSWSContinuous Spike-Waves during Slow Sleep
DNNDeep Neural Network
ECGElectrocardiography
EEGElectroencephalography
ESESElectrical Status Epilepticus during Sleep
GTGround Truth
HEEDBHarvard Electroencephalography Database
ICLRInternational Conference on Learning Representations
IEDInterictal Epileptiform Discharge
IFCNInternational Federation of Clinical Neurophysiology
iEEGIntracranial Electroencephalography
LSTMLong Short-Term Memory
NREMNon-Rapid Eye Movement
ROCReceiver Operating Characteristic
SWASSpike-Wave Activation in Sleep
SWISpike-Wave Index

Appendix A

Table A1. Clinical and recording-related metadata of EEG recordings included in the study. The first index in patient codes with an underscore denotes the patient identifier, whereas the second index denotes the recording number for patients with repeated EEG recordings.
Patient CodeSexAge at EEGDataset AllocationMedication Status and Total Daily DoseClinical Diagnosis/Epilepsy Syndrome (ILAE Terminology)Annotated EEG StateTopography of Epileptiform DischargesSWI in Clinical Diagnosis
P1_3Male10 yearsIncluded in the manuscript cohortsodium valproate 625 mg/daySelf-limited epilepsy with autonomic seizures (SeLEAS)SleepC330%
P1_4Male11 yearsIncluded in the manuscript cohortsodium valproate 625 mg/daySelf-limited epilepsy with autonomic seizures (SeLEAS)Sleep and wakefulnessC320%
P1_5Male12 yearsIncluded in the manuscript cohortsodium valproate 250 mg/day; alimemazine 5 mg/daySelf-limited epilepsy with autonomic seizures (SeLEAS)SleepC3-T3 → F7-F315%
P2Male6 yearsTest cohortNo anti-seizure medicationFebrile seizures; attention-deficit/hyperactivity disorderSleep and wakefulnessT5-O115%
P3Male8 yearsTest cohortNo anti-seizure medicationUnspecified epilepsySleep and wakefulnessC4-T410%
P4Female10 yearsTest cohortethosuximide 125 mg/daySelf-limited epilepsy with centrotemporal spikes (SeLECTS)Sleep and wakefulnessC4-T4 → T3 → C3, Fz30%
P5Female12 yearsIncluded in the manuscript cohortlamotrigine 200 mg/dayUnspecified epilepsySleepT5-O120%
P6Female8 yearsTest cohortNo anti-seizure medicationSelf-limited epilepsy with autonomic seizures (SeLEAS)SleepT6 → T4-O2 with right hemispheric spread50%
P7Male4 yearsTest cohortNo anti-seizure medicationPrematurity at 33 weeksSleepC3-Cz5%
P9Male4 yearsIncluded in the manuscript cohortNo anti-seizure medicationPrematurity at 30 weeks; cerebral palsySleepP4-Pz → C4-Cz40%
P10Male10 yearsTest cohortlevetiracetam 1250 mg/day; montelukast 5 mg/daySelf-limited epilepsy with centrotemporal spikes (SeLECTS)WakefulnessF7-F3-T330%
P11Male4 yearsTest cohortNo anti-seizure medicationNo clinical seizures reported; prematurity at 32 weeks; psychomotor and language delaySleepC3-T3 → T530%
P12Female8 yearsIncluded in the manuscript cohortNo anti-seizure medication; memantine 5 mg/dayPrematurity at 25 weeks; autism spectrum disorder; psychomotor and language delaySleep and wakefulnessT4 → T6-C415%
P13Male5 yearsIncluded in the manuscript cohortNo anti-seizure medicationCyclic vomiting syndrome; stutteringSleepT4 → T6-P4-C45%
P14Male7 yearsIncluded in the manuscript cohortNo anti-seizure medicationSpeech/language delaySleepT6-O2-P410%
P15_1Male7 yearsIncluded in the manuscript cohortsodium valproate 450 mg/dayFocal structural epilepsySleepP4-Pz → C4-Cz35%
P15_2Male7 yearsIncluded in the manuscript cohortlevetiracetam 750 mg/dayFocal structural epilepsySleepP4-Pz → C4-Cz; P3-T530%
P16Female8 yearsIncluded in the manuscript cohortlevetiracetam 600 mg/day; sodium valproate 350 mg/day; sultiame 150 mg/dayFocal epilepsy of unknown etiologySleepC3-T3 → T535%
P17Female8 yearsIncluded in the manuscript cohortNo anti-seizure medicationNo epilepsy diagnosis recordedSleepT4 → T6-C415%
P18Male3 yearsTest cohortNo anti-seizure medicationspeech/language delaySleepT4 → T6-P4-C430%
P19Male8 yearsIncluded in the manuscript cohortsodium valproate 700 mg/day; lacosamide 200 mg/dayFocal structural epilepsy associated with tuberous sclerosis complexWakefulnessT6-O2-P410%
P23Female7 yearsIncluded in the manuscript cohortNo anti-seizure medicationattention-deficit/hyperactivity disorderSleepC3-P330%
P25_1Male4 yearsIncluded in the manuscript cohortNo anti-seizure medicationexpressive language disorderSleepO2 → T6-O15%
P25_3Male6 yearsIncluded in the manuscript cohortNo anti-seizure medicationexpressive language disorderWakefulnessO2 → O13%
P26Male4 yearsIncluded in the manuscript cohortNo anti-seizure medicationspeech/language delaySleepO1-P3-T510%
P27Male3 yearsIncluded in the manuscript cohortNo anti-seizure medicationspeech/language delaySleepT6 → O2-P410%
P36Male4 yearsIncluded in the manuscript cohortNo anti-seizure medicationFebrile seizures; unspecified genetic syndromeSleepO1 → O25%
P37Male8 yearsTest cohortNo anti-seizure medicationFocal structural epilepsySleepT4-C4 → F8-T6 → right hemispheric50%
P38Male8 yearsIncluded in the manuscript cohortNo anti-seizure medicationparasomniasSleepF8-T4 → C4-T610%
P39Female8 yearsTest cohortsodium valproate 800 mg/day; ethosuximide 600 mg/daySelf-limited epilepsy with autonomic seizures (SeLEAS)WakefulnessT4 → F8-T6-C4 → Cz-C35%
P40Male5 yearsIncluded in the manuscript cohortcarbamazepine 75 mg/dayautism spectrum disorderSleepT6-O2-P45%
P41Male4 yearsIncluded in the manuscript cohortNo anti-seizure medicationautism spectrum disorderSleepPz-Cz → C3,C45%
P43Female5 yearsIncluded in the manuscript cohortNo anti-seizure medicationprematurity at 31 weeks; cerebral palsySleepC4-T4 → P4-T610%
P53Male8 yearsIncluded in the manuscript cohortoxcarbazepine 300 mg/dayFocal genetic epilepsySleepT4 → F8-F7-C3-C4 → F7-T315%
P56Male3 yearsIncluded in the manuscript cohortNo anti-seizure medicationautism spectrum disorderSleepF4-C4-T4 → C3-T315%
P57Female8 yearsIncluded in the manuscript cohortNo anti-seizure medicationFocal epilepsy of unknown etiologySleepF4-F8-T4 → right hemisphere → left hemisphere60%
P58_2Male10 yearsIncluded in the manuscript cohortoxcarbazepine 900 mg/daySelf-limited epilepsy with centrotemporal spikes (SeLECTS)Sleep and wakefulnessC4-T4, F7 → F320%
P58_4Male11 yearsIncluded in the manuscript cohortoxcarbazepine 600 mg/day; levetiracetam 1500 mg/daySelf-limited epilepsy with centrotemporal spikes (SeLECTS)SleepF410%
P60Male9 yearsIncluded in the manuscript cohortsodium valproate 750 mg/daySelf-limited epilepsy with centrotemporal spikes (SeLECTS)SleepT3 → F715%
P61Female6 yearsIncluded in the manuscript cohortsodium valproate 300 mg/daySelf-limited epilepsy with centrotemporal spikes (SeLECTS)WakefulnessC3-T3 → F3-T55%
P63Male5 yearsIncluded in the manuscript cohortNo anti-seizure medicationSelf-limited epilepsy with centrotemporal spikes (SeLECTS)WakefulnessF8 → F4-T45%
P65_1Male3 yearsIncluded in the manuscript cohortNo anti-seizure medicationspeech/language delaySleepCz → Pz15%
P65_2Male4 yearsIncluded in the manuscript cohortsodium valproate 50 mg/dayspeech/language delaySleepCz → Pz-C420%
P82Female12 yearsIncluded in the manuscript cohortlevetiracetam 250 mg/dayFocal structural epilepsySleepO2 → O110%
P83Female10 yearsIncluded in the manuscript cohortsodium valproate 600 mg/dayFocal genetic epilepsySleep and wakefulnessCz-Fz → diffuse spread30%
P84Female11 yearsIncluded in the manuscript cohortNo anti-seizure medicationNo epilepsy diagnosis recordedSleep and wakefulnessO1 → O2, T5, P310%
P85Female7 yearsIncluded in the manuscript cohortNo anti-seizure medicationglobal developmental and language delaySleepP4-T6-O2 → C4-T4, periodic discharges/polyspikes (PDP)25%
P92Female7 yearsIncluded in the manuscript cohortNo anti-seizure medicationSelf-limited epilepsy with centrotemporal spikes (SeLECTS)SleepC3 → P3-T3-T530%
P01Female11 yearsIncluded in the manuscript cohortNo anti-seizure medicationNo epilepsy diagnosis recordedSleep and wakefulnessF7-T310%
P02Male13 yearsIncluded in the manuscript cohortcarbamazepine 600 mg/dayStructural epilepsy; spastic right hemiplegiaSleep and wakefulnessF7-T315%
P05Female5 yearsIncluded in the manuscript cohortlevetiracetam 700 mg/day; sodium valproate 400 mg/dayAtaxic cerebral palsy (G80.4)Sleep and wakefulnessF730%

References

  1. Öztoprak, Ü.; Köken, Ö.Y.; Aksoy, E.; Yüksel, D. Spike-wave index assessment and electro-clinical correlation in patients with encephalopathy associated with epileptic state during slow sleep (ESES/CSWS); single-center experience. Epilepsy Res. 2021, 170, 106549. [Google Scholar] [PubMed]
  2. Reus, E.E.; Visser, G.H.; Cox, F.M. Determining the spike–wave index using automated detection software. J. Clin. Neurophysiol. 2021, 38, 198–201. [Google Scholar] [PubMed]
  3. Kozhokaru, A. Epileptiform activity index for the evaluation of treatment efficacy in patients with epileptic encephalopathy. Zhurnal Nevrol. i Psikhiatrii Im. SS Korsakova 2019, 119, 121–126. [Google Scholar] [CrossRef]
  4. Maulsby, R.L. Some guidelines for assessment of spikes and sharp waves in EEG tracings. Am. J. Eeg Technol. 1971, 11, 3–16. [Google Scholar] [CrossRef]
  5. Kural, M.A.; Duez, L.; Sejer Hansen, V.; Larsson, P.G.; Rampp, S.; Schulz, R.; Tankisi, H.; Wennberg, R.; Bibby, B.M.; Scherg, M.; et al. Criteria for defining interictal epileptiform discharges in EEG: A clinical validation study. Neurology 2020, 94, e2139–e2147. [Google Scholar] [PubMed]
  6. Pachori, R.B. Time-Frequency Analysis Techniques and Their Applications; CRC Press: Boca Raton, FL, USA, 2023. [Google Scholar]
  7. Morales, S.; Bowers, M.E. Time-frequency analysis methods and their application in developmental EEG data. Dev. Cogn. Neurosci. 2022, 54, 101067. [Google Scholar] [CrossRef] [PubMed]
  8. Yang, Y.; Peng, Z.; Zhang, W.; Meng, G. Parameterised time-frequency analysis methods and their engineering applications: A review of recent advances. Mech. Syst. Signal Process. 2019, 119, 182–221. [Google Scholar] [CrossRef]
  9. Nonclercq, A.; Foulon, M.; Verheulpen, D.; De Cock, C.; Buzatu, M.; Mathys, P.; Van Bogaert, P. Cluster-based spike detection algorithm adapts to interpatient and intrapatient variation in spike morphology. J. Neurosci. Methods 2012, 210, 259–265. [Google Scholar] [CrossRef] [PubMed]
  10. Zhou, W.; Zhao, X.; Wang, X.; Zhou, Y.; Wang, Y.; Meng, L.; Fan, J.; Shen, N.; Zhou, S.; Chen, W.; et al. A hybrid expert system for individualized quantification of electrical status epilepticus during sleep using biogeography-based optimization. IEEE Trans. Neural Syst. Rehabil. Eng. 2022, 30, 1920–1930. [Google Scholar] [CrossRef] [PubMed]
  11. Chaibi, S.; Lajnef, T.; Ghrob, A.; Samet, M.; Kachouri, A. A robustness comparison of two algorithms used for EEG spike detection. Open Biomed. Eng. J. 2015, 9, 151–156. [Google Scholar] [CrossRef] [PubMed]
  12. Sugi, T.; Nakamura, M.; Ikeda, A.; Shibasaki, H. Adaptive EEG spike detection: Determination of threshold values based on conditional probability. Front. Med. Biol. Eng. 2002, 11, 261–277. [Google Scholar] [PubMed]
  13. Adjouadi, M.; Cabrerizo, M.; Ayala, M.; Sanchez, D.; Yaylali, I.; Jayakar, P.; Barreto, A. A new mathematical approach based on orthogonal operators for the detection of interictal spikes in epileptogenic data. Biomed. Sci. Instrum. 2004, 40, 175–180. [Google Scholar] [PubMed]
  14. De Lucia, M.; Fritschy, J.; Dayan, P.; Holder, D.S. A novel method for automated classification of epileptiform activity in the human electroencephalogram-based on independent component analysis. Med. Biol. Eng. Comput. 2008, 46, 263–272. [Google Scholar] [PubMed]
  15. Carvalho, D.; Mendes, T.; Dias, A.I.; Leal, A. Interictal spike quantification in continuous spike–wave of sleep (CSWS): Clinical usefulness of a wearable EEG device. Epilepsy Behav. 2020, 104, 106902. [Google Scholar] [CrossRef] [PubMed]
  16. Hironaga, N.; Hagiwara, K.; Ogata, K.; Hayamizu, M.; Urakawa, T.; Tobimatsu, S. Proposal for a new MEG–MRI co-registration: A 3D laser scanner system. Clin. Neurophysiol. 2014, 125, 2404–2412. [Google Scholar] [PubMed]
  17. Jing, J.; Herlopian, A.; Karakis, I.; Ng, M.; Halford, J.J.; Lam, A.; Maus, D.; Chan, F.; Dolatshahi, M.; Muniz, C.F.; et al. Interrater reliability of experts in identifying interictal epileptiform discharges in electroencephalograms. JAMA Neurol. 2020, 77, 49–57. [Google Scholar] [CrossRef] [PubMed]
  18. Bagheri, E.; Dauwels, J.; Dean, B.C.; Waters, C.G.; Westover, M.B.; Halford, J.J. Interictal epileptiform discharge characteristics underlying expert interrater agreement. Clin. Neurophysiol. 2017, 128, 1994–2005. [Google Scholar] [CrossRef] [PubMed]
  19. Grant, A.C.; Abdel-Baki, S.G.; Weedon, J.; Arnedo, V.; Chari, G.; Koziorynska, E.; Lushbough, C.; Maus, D.; McSween, T.; Mortati, K.A.; et al. EEG interpretation reliability and interpreter confidence: A large single-center study. Epilepsy Behav. 2014, 32, 102–107. [Google Scholar] [CrossRef] [PubMed]
  20. da Silva Lourenço, C.; Tjepkema-Cloostermans, M.C.; van Putten, M.J. Machine learning for detection of interictal epileptiform discharges. Clin. Neurophysiol. 2021, 132, 1433–1443. [Google Scholar] [CrossRef] [PubMed]
  21. Gromov, N.V.; Smirnov, L.A.; Levanova, T.A. Prediction of extreme events and chaotic dynamics using WaveNet. Cybern. Phys. 2024, 13, 20–31. [Google Scholar]
  22. Antoniades, A.; Spyrou, L.; Martin-Lopez, D.; Valentin, A.; Alarcon, G.; Sanei, S.; Took, C.C. Detection of interictal discharges with convolutional neural networks using discrete ordered multichannel intracranial EEG. IEEE Trans. Neural Syst. Rehabil. Eng. 2017, 25, 2285–2294. [Google Scholar] [CrossRef] [PubMed]
  23. Tjepkema-Cloostermans, M.C.; de Carvalho, R.C.; van Putten, M.J. Deep learning for detection of focal epileptiform discharges from scalp EEG recordings. Clin. Neurophysiol. 2018, 129, 2191–2196. [Google Scholar] [CrossRef] [PubMed]
  24. Lin, N.; Zheng, M.; Li, L.; Hu, P.; Gao, W.; Sun, H.; Xu, C.; Yuan, G.; Liang, Z.; Dong, Y.; et al. An EEG dataset for interictal epileptiform discharge with spatial distribution information. Sci. Data 2025, 12, 229. [Google Scholar] [CrossRef] [PubMed]
  25. Duan, C.; Zhang, Y.; Kanai, S.; Ding, Y.; Daida, A.; Yu, P.; Zheng, T.; Kuroda, N.; Hussain, S.A.; Asano, E.; et al. Omni-iEEG: A Large-Scale, Comprehensive iEEG Dataset and Benchmark for Epilepsy Research. In Proceedings of the International Conference on Learning Representations, Rio de Janeiro, Brazil, 23–27 April 2026. [Google Scholar]
  26. Fasil, O.; Rajesh, R.; Rajith, K.R. Scalp EEG recordings of pediatric epilepsy patients: A dataset for automatic detection of interictal epileptiform discharges from routine EEG. Data Brief 2021, 39, 107680. [Google Scholar] [CrossRef]
  27. Sun, C.; Jing, J.; Turley, N.; Alcott, C.; Kang, W.Y.; Cole, A.J.; Goldenholz, D.M.; Lam, A.; Amorim, E.; Chu, C.; et al. Harvard Electroencephalography Database: A comprehensive clinical electroencephalographic resource from four Boston hospitals. Epilepsia 2025, 66, 3411–3425. [Google Scholar] [CrossRef] [PubMed]
  28. Svantesson, M.; Eklund, A.; Thordstein, M. Interrater agreement of annotations of epileptiform discharges and its impact on deep learning–A pilot study. medRxiv 2024. [Google Scholar] [CrossRef]
  29. Tăuțan, A.M.; Jing, J.; Basovic, L.; Hadar, P.N.; Sartipi, S.; Fernandes, M.P.; Kim, J.; Struck, A.F.; Westover, M.B.; Zafar, S.F. Automated estimation of frequency and spatial extent of periodic and rhythmic epileptiform activity from continuous electroencephalography data. J. Neural Eng. 2025, 22, 066027. [Google Scholar] [CrossRef]
  30. Ronneberger, O.; Fischer, P.; Brox, T. U-net: Convolutional networks for biomedical image segmentation. In Proceedings of the International Conference on Medical Image Computing and Computer-Assisted Intervention; Springer: Cham, Switzerland, 2015; pp. 234–241. [Google Scholar]
  31. Krithika Alias AnbuDevi, M.; Suganthi, K. Review of semantic segmentation of medical images using modified architectures of UNET. Diagnostics 2022, 12, 3064. [Google Scholar] [CrossRef] [PubMed]
  32. Salpea, N.; Tzouveli, P.; Kollias, D. Medical image segmentation: A review of modern architectures. In Proceedings of the European Conference on Computer Vision; Springer: Cham, Switzerland, 2022; pp. 691–708. [Google Scholar]
  33. Gupta, V.; Kumar, V.; Prince; Singh, S.; Lee, Y.S.; Ra, I.H. Deep Learning Model for Analyzing EEG Signal Analysis. IEEE Access 2025, 13, 91034–91045. [Google Scholar] [CrossRef]
  34. Gromov, N.V.; Lebedeva, A.V.; Sharkov, A.A.; Grebenyukova, A.D.; Malkov, A.E.; Gerasimova, S.A.; Smirnov, L.A.; Levanova, T.A.; Pisarchik, A.N. Automated sleep spindle analysis in epilepsy EEG using deep learning. Technologies 2025, 13, 524. [Google Scholar] [CrossRef]
  35. Karchkov, D.; Rostov, D.; Kotikhina, E.; Smirnov, L.; Osipov, G. Finding Myocardial Activation Moments in Rat Electrograms Using Deep Learning Segmentation Models. In Proceedings of the International Conference on Mathematical Modeling and Supercomputer Technologies; Springer: Cham, Switzerland, 2025; pp. 108–121. [Google Scholar]
  36. Kotikhina, E.; Karchkov, D.; Moskalenko, V.; Nikolskiy, A.; Osipov, G.; Smirnov, L. Study of the L-Carnitine Effect on Myocardial Bioelectrical Activity by Microelectrode Arrays and Artificial Intelligence Application. J. Cardiovasc. Transl. Res. 2025, 18, 1865–1875. [Google Scholar] [CrossRef] [PubMed]
  37. Moskalenko, V.; Zolotykh, N.; Osipov, G. Deep learning for ECG segmentation. In Proceedings of the International Conference on Neuroinformatics; Springer: Cham, Switzerland, 2019; pp. 246–254. [Google Scholar]
  38. Hu, L.; Cai, W.; Chen, Z.; Wang, M. A lightweight U-Net model for denoising and noise localization of ECG signals. Biomed. Signal Process. Control 2024, 88, 105504. [Google Scholar]
  39. Lebedeva, A.; Samburova, M.; Elshina, O.; Borisova, A.; Borisov, V.; Gromov, N.; Sharkov, A.; Yashanova, M.; Gerasimova, S.; Levanova, T.; et al. Application of U-net neural network for automatic spike detection in EEG recordings from patients with rolandic epilepsy. In Proceedings of the 2024 Sixth International Conference Neurotechnologies and Neurointerfaces (CNN); IEEE: Piscataway, NJ, USA, 2024; pp. 102–105. [Google Scholar]
  40. Akiba, T.; Sano, S.; Yanase, T.; Ohta, T.; Koyama, M. Optuna: A next-generation hyperparameter optimization framework. In Proceedings of the 25th ACM SIGKDD International Conference on Knowledge Discovery & Data Mining; Association for Computing Machinery: New York, NY, USA, 2019; pp. 2623–2631. [Google Scholar]
  41. Zijlmans, M.; Jiruska, P.; Zelmann, R.; Leijten, F.S.; Jefferys, J.G.; Gotman, J. High-frequency oscillations as a new biomarker in epilepsy. Ann. Neurol. 2012, 71, 169–178. [Google Scholar] [CrossRef] [PubMed]
  42. Park, C.J.; Hong, S.B. High frequency oscillations in epilepsy: Detection methods and considerations in clinical application. J. Epilepsy Res. 2019, 9, 1–13. [Google Scholar] [CrossRef] [PubMed]
  43. Nevalainen, P.; von Ellenrieder, N.; Klimeš, P.; Dubeau, F.; Frauscher, B.; Gotman, J. Association of fast ripples on intracranial EEG and outcomes after epilepsy surgery. Neurology 2020, 95, e2235–e2245. [Google Scholar] [CrossRef] [PubMed]
  44. Sheybani, L.; Qiu, Y.; Singh, P.K.; Vivekananda, U.; Burgess, N.; Diehl, B.; McEvoy, A.; Miserocchi, A.; Bisby, J.A.; Shekh-Ahmad, T.; et al. Fast-ripples are emergent properties of neuronal networks. bioRxiv 2026. [Google Scholar] [CrossRef]
  45. Malkov, A.E.; Lebedeva, A.V.; Gerasimova, S.A.; Levanova, T.A.; Smirnov, L.A.; Sharkov, A.A.; Pisarchik, A.N. Multiparametric machine learning for predicting epileptic hyperexcitability from interictal EEG background activity. Commun. Nonlinear Sci. Numer. Simul. 2026, 152, 109210. [Google Scholar]
Figure 1. The schematic representation of the 1D U-Net network architecture. Here L is a number of upsampling blocks, D is a number of convolutional layers with residual connections.
Technologies 14 00403 g001
Figure 2. Example of epileptiform spike segmentation on the F4–C4 lead recorded from a patient with epilepsy. Expert annotations are shown in blue, and the automatic segmentation produced by the 1D U-Net is shown in red.
Technologies 14 00403 g002
Figure 3. Mean expert opinion of spike-wave index (SWI) values across five expert opinions for each record from the two rounds of assessments shown in blue. The ground truth (GT) SWI, calculated from the experts’ annotations of the all epileptiform activities over a 10 min window, is shown in green. SWI predicted by the neural network is shown in red.
Technologies 14 00403 g003
Figure 4. Box plots of the spike length per record. Blue bars: experts’ assessments; red bars: model predictions. Asterisks indicate recordings with a statistically significant difference between expert-annotated and model-predicted spike-wave durations according to two-sided Mann–Whitney U- and Brunner–Munzel tests, with the significance threshold set at α = 0.01 .
Technologies 14 00403 g004
Figure 5. Mean difference in SWI scores between the first and second run for each expert and the DL model. Two runs were compared for the model, with the original recordings shifted by 5 s. Error bars indicate the standard deviation.
Technologies 14 00403 g005
Figure 6. All detected spikes (thin lines) from two representative recordings. (Upper) panel: Patient P6, who exhibited the highest inter-expert variability in the first assessment. (Lower) panel: Patient P3, who exhibited the lowest inter-expert variability across both assessments. The bold line in each subfigure denotes the average spike waveform.
Technologies 14 00403 g006
Table 1. A comprehensive overview of SWI measurements across the test patient cohort. For each patient record, the table displays demographic characteristics (sex and age), SWI estimates by experts in the two rounds of assessments, ground truth (GT) SWI values, model-predicted SWI values, and corresponding F1-scores that evaluate the quality of spike segmentation.
RecordSexAge, YearsExpert’s Mean 1, %Expert’s Mean 2, %GT, %Model, %F1
P6f845.0 ± 12.234.5 ± 8.431250.92
P11m443.0 ± 4.541.5 ± 12.941290.93
P4f1031.0 ± 5.516.5 ± 5.510110.91
P10m1029.0 ± 5.524.5 ± 12.524140.84
P39f827.0 ± 8.415.5 ± 7.612110.85
P18m323.0 ± 4.522.5 ± 8.719180.95
P37m819.0 ± 5.512.5 ± 6.115110.86
P3m813.0 ± 4.56.5 ± 2.2750.95
P2m611.0 ± 5.59.5 ± 5.7640.76
P7m49.0 ± 8.97.5 ± 5.0760.78
Table 2. Event-based detection performance.
RecordF1-ScorePrecisionRecallFNR
P60.9190.9680.8750.125
P110.9300.9600.9010.099
P40.9080.8530.9720.028
P100.8420.9110.7830.217
P390.8460.8100.8850.115
P180.9470.9830.9130.087
P370.8560.9260.7950.205
P30.9460.9670.9260.074
P20.7570.8850.6620.338
P70.7770.8160.7410.259
Mean ± SD0.873 ± 0.0680.908 ± 0.0640.845 ± 0.0960.155 ± 0.096
Table 3. Point-wise segmentation performance.
RecordF1-ScorePrecisionRecallFPRFNR
P60.8240.9330.7370.0240.263
P110.7890.9430.6780.0290.322
P40.8660.8410.8930.0190.107
P100.6930.9460.5470.0100.453
P390.8330.8420.8240.0210.176
P180.8740.9070.8430.0210.157
P370.7750.9310.6640.0090.336
P30.8170.9730.7040.0020.296
P20.7430.8810.6430.0050.357
P70.6920.7630.6330.0150.367
Mean ± SD0.791 ± 0.0650.896 ± 0.0640.717 ± 0.1080.016 ± 0.0090.283 ± 0.108
Disclaimer/Publisher’s Note: The statements, opinions and data contained in all publications are solely those of the individual author(s) and contributor(s) and not of MDPI and/or the editor(s). MDPI and/or the editor(s) disclaim responsibility for any injury to people or property resulting from any ideas, methods, instructions or products referred to in the content.