Article

Novel Technologies for Diagnosis of Conveyor Belt Looseness via Motor Current Signature Analysis


1
Department of Engineering, School of Computing and Engineering, The University of Huddersfield, Huddersfield HD1 3DH, UK
2
Syscada Dynamic Engineering Limited, 29 Woodside Road, Bournemouth BH5 2AZ, UK
*
Author to whom correspondence should be addressed.
Technologies 2026, 14(4), 214; https://doi.org/10.3390/technologies14040214
Submission received: 8 January 2026 / Revised: 25 March 2026 / Accepted: 31 March 2026 / Published: 7 April 2026

Abstract

This paper proposes and investigates two novel worldwide non-invasive, low-cost, online automatic diagnostic technologies for conveyor belt looseness by motor current signature analysis. Belt looseness causes impulsive transient spikes due to intermittent belt–motor engagement, which are captured and essentially enhanced using spectral kurtosis (SK). Two diagnostic technologies are as follows: Cross-Correlations of Spectral Moduli of orders three and four to extract supply frequency harmonic cross-correlations from SK-filtered current signals, and Consolidated Spectral Kurtosis, a band-independent technology, which enables effective diagnosis by summing essential spectral kurtosis values across the entire frequency range. Comprehensive experimental trials on an industrial grain belt conveyor system demonstrate that the proposed technologies are effective for conveyor belt looseness diagnosis. The Cross-Correlations of Spectral Moduli technologies achieved a maximum total probability of correct diagnosis value of 98%. The Consolidated Spectral Kurtosis technology captures overall impulsive energy across the whole frequency range, achieving a maximum total probability of correct diagnosis value of 99.6%. This study highlights the diagnostic effectiveness and computational efficiency of the proposed technologies for the reliable diagnosis of conveyor belt looseness. Experimental comparison of the proposed technologies is undertaken.

1. Introduction

Belt conveyor systems are essential to continuous and efficient functioning of material handling operations in industries such as mining, manufacturing, power generation, and logistics. These systems, comprising motors, gearboxes, pulleys, idlers, and conveyor belts, often operate under harsh environmental and loading conditions, making them prone to various mechanical faults. Failures such as idler defects, belt misalignment, looseness, bearing wear, and structural damage can cause unplanned downtime, increase maintenance costs, and, in severe cases, lead to catastrophic failures and safety risks.
Bortnowski et al. [1] offer a foundational contribution through a comprehensive review and classification of conveyor belt damage types, establishing a matrix-based framework that maps failure modes to operational, design, or maintenance-related causes. Their innovative use of decision diagrams and Spearman’s rank correlation matrix illustrates that many damage symptoms, though outwardly distinct, often stem from shared root causes—particularly external influences such as improper loading conditions or idler misalignment, rather than inherent component defects. While they propose a structured damage management system integrating monitoring, classification, and corrective loops, the study does not offer specific signal-processing techniques or diagnostic approaches to detect high-amplitude vibration or motor current spikes caused by belt looseness.
Li et al. [2] introduced a vibration-based conveyor belt fault detection technology using wavelet packet decomposition (WPD) and support vector machines (SVMs) to identify idler faults. By extracting frequency-domain energy features, their approach achieved high classification accuracy while minimising sensor complexity. However, their technology largely emphasises frequency-domain characteristics, making it less effective for capturing high-amplitude, short-duration transient events that often accompany belt looseness or impact loading.
Extending the focus toward machine learning-enabled diagnostics, Alharbi et al. [3] surveyed acoustic and vibration-based monitoring techniques, highlighting the growing role of machine learning in automating fault detection. They categorise traditional ML pipelines alongside emerging deep learning models for idler and bearing fault identification. While their review demonstrates advances in feature extraction and classification accuracy, it notes persistent challenges in monitoring spatially distributed components and complex time-domain behaviours associated with sudden impacts or belt reengagement events. Thus, although the work recognises looseness-related transients conceptually, it does not propose concrete diagnostic technologies to address the issue.
Hou and Meng [4] examined the complex dynamics of conveyor belt vibration under the influence of longitudinal and transverse modes, nonlinear stiffness, and varying tension. Their theoretical analysis shows that transient responses can amplify vibrations and impact loads, contributing to belt fatigue and wear. While highly informative regarding vibration amplification mechanisms, the study does not provide diagnostic frameworks or signal-processing techniques to detect looseness-induced high-amplitude transients. Complementing this, Bortnowski et al. [5] experimentally studied how idler spacing influences transverse belt vibration: beam models describe behaviour at short spacing, while string models suffice for longer spans. Their results indicate that tension levels significantly influence vibration frequencies, while belt speed has limited effect; however, they do not address the extraction of features from vibration signals for impact analysis.
The integration of artificial intelligence (AI) into health monitoring has seen rapid advancement, as reviewed by Mahmood and Shareef [6]. Synthesising findings from over 70 studies, they report that Convolutional Neural Networks (CNNs) can detect conveyor belt surface defects with over 95% accuracy, while SVMs and Light Gradient Boosting Machine (LightGBM) models effectively classify vibration patterns. Additionally, the use of Internet of Things (IoT) platforms has enabled real-time multi-sensor data acquisition, reducing unplanned downtime by up to 30%. While they advocate for the integration of edge AI and Digital Twin technologies for adaptive fault prediction, their review remains conceptually oriented and does not deeply address the time-domain signal-processing techniques required to detect high-energy, short-duration events like sudden belt reengagements due to belt looseness.
Farhat [7] propose novel diagnostic technology based on motor current signature analysis (MCSA) to diagnose conveyor belt mis-tracking. Their technology introduces multiple higher-order spectral diagnostic features, which are based on the detection of increased friction between a belt and a conveyor wall, caused by a belt misalignment. Experimental validation trials under varying load and belt alignment/misalignment conditions showed this technology to be accurate and non-invasive, offering a compelling alternative to vibration or vision-based systems. Importantly, their current-based technology works effectively under conditions of load variations, which holds promise for detecting conveyor belt mis-tracking. However, this work focuses on belt conveyor mis-tracking rather than belt looseness-induced spikes, leaving a gap for looseness-specific diagnostics of conveyor belts.
Meanwhile, experimental insights from Andrejiova et al. [8] focus on the effects of impact-induced wear on rubber–textile conveyor belts, simulating material drop events using different impactor shapes and storage durations. Their statistical analysis, employing chi-square tests and decision trees, indicates that sharp-edged impacts and long-term belt storage significantly exacerbate damage severity. While focused on mechanical testing rather than real-time diagnostics, this work contributes valuable empirical evidence supporting the importance of impact events in overall system degradation. Although this study highlights conditions that exacerbate belt looseness and vibration, it does not propose diagnostic technologies for either vibration or current transients.
Guo et al. [9] provided a detailed review of conveyor belt tear detection technologies, with an emphasis on non-destructive testing (NDT) and machine vision. Comparing sensor-based, multispectral, and deep learning-based technologies, their study shows that Convolutional Neural Network (CNN)-based models perform well on custom belt damage datasets. Notably, the integration of infrared imaging and edge computing shows potential in dusty, low-visibility environments like underground mining. While these technologies address structural defects and surface wear, they are limited in detecting subsurface or high-amplitude, short-duration vibration or current spikes, including those caused by belt looseness.
Zeng et al. [10] define conveyor belt slippage as a temporary speed mismatch between the drive drum and the belt, usually due to insufficient tension. During slip, the pulley fails to drive the belt fully, allowing the motor to accelerate with reduced load torque. When traction is suddenly regained, the load is reapplied to the motor, resulting in a spike in torque and current—a phenomenon well documented in the literature. Abdullahi [11] introduce a “power feature”, which measures integrated power in a narrow frequency band near the fundamental supply harmonic, to detect increased friction caused by belt misalignment. Experimental validation under varying load and alignment conditions showed this technology to be accurate and non-invasive, offering a compelling alternative to vibration or vision-based systems. Importantly, their current-based technology captures load variations indirectly via motor current signature—an approach that holds promise for detecting conveyor belt mis-tracking. This work focuses on mis-tracking rather than belt looseness-induced spikes. He et al. [12] similarly reports uncontrolled acceleration waves and tension fluctuations during belt slip events, again highlighting the occurrence but not providing a detection framework.
The literature reviewed in the work by Rupali Tupkar et al. [13] explores the critical importance of conveyor belt tension and stretch management in medium-duty conveyor systems, particularly in variable operational environments. The authors emphasise that precise belt tensioning directly impacts conveyor performance, reduces slippage, and prolongs equipment lifespan by preventing overstrain on mechanical components. Under-tensioning can lead to slippage, misalignment, and increased wear on both the belt and pulleys. The paper highlights how operational stresses—arising from fluctuating loads, environmental factors (like temperature, dust, and chemicals), and repetitive motion—lead to elastic deformation and eventual belt stretch. This elongation contributes to the conveyor belt looseness, resulting in misalignments in systems, increases maintenance needs, and heightens the risk of costly equipment failures. While this study identifies the operational conditions that generate transient events, it does not offer diagnostic signal-processing strategies to monitor or quantify these spikes.
Zakharov and Erofeeva [14] investigate the dual nature of vibration in belt conveyors. Their main contribution lies in classifying the causes of conveyor belt vibration—constructive, operational, electromechanical, and technological—and demonstrating how controlled vibration can be harnessed for processes such as intermediate unloading, cleaning, and material segregation. A key focus is the transverse vibrations induced by belt sag between roller supports, where the frequency depends on belt tension and speed. These vibrations often contribute to dynamic load spikes and operational instability. The authors emphasise that improper loading, mismatched drives, and hard conveyor starts amplify these oscillations, while controlled application can reduce wear and energy consumption. However, the work does not provide techniques for diagnosing high-amplitude vibration or motor current spikes associated with looseness or flapping.
Rao et al. [15] offer a simplified and structured overview of belt conveyor systems. The book clearly explains conveyor components, their functions, and types, while also addressing key topics such as bulk material properties, belt tension, and troubleshooting. A notable inclusion is the discussion on improper belt tension, which can cause looseness and flapping—leading to vibration spikes and irregular motor engagement and disengagement. By avoiding technical depth, the book fills a gap in the specialised literature, serving as an accessible guide for those new to bulk material handling, but does not provide diagnostic or signal-processing technologies for either vibration or current spikes.
Hills [16] addresses the limitations of traditional vibration-based condition monitoring in low-speed and variable-speed conveyor systems, highlighting that such technologies often fail to detect early-stage faults due to masking by dominant low-frequency signals. His key contribution lies in proposing intelligent online motor condition monitoring and acoustic emission (AE) techniques as superior alternatives for detecting mechanical and electrical anomalies in conveyor systems. By advocating AE for slow and variable-speed drives and suggesting hybrid monitoring systems combining mechanical and electrical fault detection, Hills provides a comprehensive and practical framework for predictive maintenance in industrial conveyor operations. However, the study does not consider the effects of belt looseness, slips, flapping, or sagging—factors that can induce vibration spikes and cause erratic motor engagement or disengagement—which are critical to conveyor system reliability.
Horihata et al. [17] propose an automatic and centralised diagnostic system for detecting conveyor belt faults in large-scale steel plants. Recognising the challenges of maintaining hundreds of weather-exposed conveyor belts spread across vast outdoor areas, the authors address the impracticality of operator-based condition monitoring. Their main contribution is the development of a system that continuously monitors the electric current of induction motors driving the conveyors. By analysing current fluctuations, the system can detect serious faults such as belt slip and meander. Tested at Kimitsu Works—the world’s largest steel plant—the approach offers a practical and scalable solution for non-intrusive, real-time monitoring of distributed conveyor systems. This work explicitly demonstrates the potential of current-based diagnostics for distributed conveyor systems; however, details on detecting looseness-induced short-duration, high-amplitude spikes remain limited in the available description.
In summary, the literature reveals substantial progress in monitoring and diagnosing faults for conveyor belt systems—from structural vibration modelling and AI-powered vision systems to current-based condition monitoring. Several recent studies acknowledge the physical consequences of belt looseness, slippage, and sudden reengagement, including their impact on tension waves, vibration surges, and motor current spikes. However, while these works describe the occurrence of such phenomena, they largely fall short of providing diagnostic insight and proposing effective signal-processing techniques to extract diagnostic features that characterise these high-amplitude spikes. They remain underexplored from a diagnostic standpoint. This constitutes a critical gap in the existing body of research. Addressing this gap through the use of motor current signals could significantly enhance predictive maintenance capabilities, enabling the early and accurate diagnosis of high-risk belt looseness before it escalates into a severe failure.
Therefore, there is a need to develop novel signal-processing and diagnostic frameworks—particularly leveraging motor current signals—to identify and to diagnose such faults for improved predictive maintenance for conveyor systems. Hence, for the first time, this paper theoretically and experimentally investigates the problem of conveyor belt looseness, which induces short-duration current spikes due to sudden engagement events in the electric motor. To address this, the transient events are analysed using spectral kurtosis-based filtering [18,19] under variable load conditions.
The spectral kurtosis (SK) has also emerged as a sensitive technique for revealing non-Gaussian transients masked within complex signals [20,21]. Unlike the classical kurtosis, the SK decomposes this information across frequency bins, producing the kurtogram, which identifies the most informative spectral bands for demodulation [22,23]. The SK-based technologies have been successfully applied for fault diagnostics [24,25,26,27,28,29,30,31,32,33,34,35] and typically culminate in the squared envelope (SE) analysis of SK-selected bands.
However, despite its wide adoption, the conventional SK–SE technology suffers from some critical limitations, which restrict its effectiveness in practical monitoring. The squared envelope (SE), based on filtering and Hilbert demodulation, cannot effectively separate impulsive fault transients from structural resonances. Consequently, dominant resonance harmonics often overshadow fault-induced impacts, leading to poor diagnostics.
Phase misalignment further distorts transient localisation, while its multi-step implementation adds computational overhead. To overcome these limitations, this study introduces, for the first time worldwide, Consolidated Spectral Kurtosis (CSK) technology, a scalar technology that operates by integrating all threshold-exceeding SK values across the frequency spectrum. This allows CSK technology to effectively capture dispersed fault energy and to yield a single interpretable scalar with minimal parameterisation, enabling a load-independent and effective measure of impulsiveness, making it well suited for detecting transients without requiring prior knowledge of specific frequency bands.
The subsequent envelope analysis demodulates the filtered signal, thereby highlighting impact-related frequency harmonics and enabling accurate extraction of harmonic intensities at the fundamental and higher-order impact frequencies. Cross-Correlation of Spectral Moduli (CCSM) technologies leverage higher-order spectral analysis (orders three and four) to reveal harmonic interactions arising from belt conveyor nonlinearities under loads.
Although the investigation presented in this study employs a belt grain conveyor system, the proposed diagnostic technologies rely on the fundamental electromechanical features of belt slip–reengagement events rather than on belt-grain-conveyor-specific electromechanical features. Therefore, the proposed technologies can be easily adapted to other belt conveyor systems with different belt materials, operational speeds, and loading conditions. For other belt conveyors, signal-processing parameters such as segment length, harmonic combinations, and diagnostic thresholds may be adjusted while preserving the proposed underlying general diagnostic principles/technologies.
The novelties presented in this paper include:
  • Experimental investigation of short-duration motor current spikes caused by conveyor belt looseness, establishing their physical origin, electromechanical interpretation, and diagnostic relevance.
  • Proposition, for the first time worldwide, of Consolidated Spectral Kurtosis technology for the diagnosis of conveyor belt looseness via motor current data.
  • Proposition, for the first time worldwide, of spectral Cross-Correlation technologies for the diagnosis of conveyor belt looseness via motor current data.
  • Comparison of the proposed technologies.
The objectives of this paper are to:
  • Investigate theoretically and experimentally the short-duration current spikes induced by conveyor belt looseness and establish their physical and electromechanical basis.
  • Apply the proposed technologies for diagnosing looseness-induced spikes in motor current signals.
  • Perform experimental validation of the proposed technologies on an industrial conveyor system.
  • Compare the diagnostic effectiveness of the proposed technologies.
Although the present study is based on industrial-scale experiments, the proposed diagnostic technologies—Cross-Correlation of Spectral Moduli (CCSM) and Consolidated Spectral Kurtosis (CSK)—are based on fundamental electromechanical behaviour associated with belt slip–reengagement dynamics. These phenomena are not system-specific and can be reproduced under controlled laboratory conditions. Therefore, the proposed technologies can be extrapolated to laboratory-based investigations, in which key parameters such as speed and loading conditions and slip characteristics can be systematically varied to provide deeper physical insight and validation of the diagnostic performance.
The manuscript is organised into four main sections. Section 2 introduces the novel technologies to diagnose conveyor belt looseness via motor current data. Section 3 describes the experimental setup and outlines the testing procedures, including data acquisition and analysis technologies. Section 4 evaluates the effectiveness of the proposed technologies by analysing experimental data collected under different loading conditions.

2. Materials and Methods

2.1. Theoretical Analysis

Conveyor belt looseness represents a critical failure mode, which compromises both the efficiency and reliability of bulk material handling systems. Looseness arises when the belt is maintained at insufficient effective tension or when the wrap traction at the drive pulley is inadequate to sustain steady power transmission. Under such conditions, the belt is more susceptible to intermittent slip, erratic reengagement, and the propagation of longitudinal tension waves along its length. Several operational and environmental factors contribute to this phenomenon, including poor or sluggish take-up response, deterioration or wear of pulley lagging, contamination by water or clay, temperature-induced variations in belt stiffness, and fluctuating material loads in the charging zone. Each of these events reduces the effective friction coefficient and diminishes the traction reserve at the drive pulley, thereby increasing the likelihood of a slip during torque transients.
Belt conveyor systems are inherently complex electromechanical systems, composed of polymer–fabric composite belts interacting with pulleys, idlers, and bulk material loads. These systems exhibit nonlinear mechanical behaviour, distributed contact forces, and viscoelastic effects associated with belt materials.
The present study is not constructing a comprehensive mechanical model of the belt–pulley interaction. The primary focus is on the data-driven diagnostics of belt looseness through its detectable impulsive events in motor current signals. In particular, intermittent slip–reengagement events at the drive pulley generate short transient torque disturbances, which manifest as short-duration motor current spikes. The proposed diagnostic technologies employ these current spikes.
The classical traction analysis of belt drives is often based on Euler’s belt equation, which assumes a weightless and inextensible belt operating under steady-state conditions with uniform steady friction distribution along the belt–pulley contact region. While this formulation is useful for theoretical estimation of the static belt traction capacity for idealised belt drives, industrial belt conveyor systems typically operate under highly dynamic conditions involving fluctuating speeds, heavy fluctuating loads, and varying friction.
Under such conditions, belt looseness produces time-varying slip–reengagement impulsive events, during which belt tension and friction conditions change rapidly and frequently. These dynamic processes violate the main assumptions of Euler’s steady-state formulation. Therefore, the present study focuses on employing the transient electromechanical impulsive responses of the belt conveyor system through motor current signals rather than relying on static traction modelling.
When a slip occurs, the dynamics of the belt–pulley interaction become highly nonlinear [10]. The drive pulley accelerates relative to the belt until traction is re-established, at which point the belt rapidly snaps back into synchronous motion. This stick–slip or reengagement process excites longitudinal tension waves [5], which propagate and reflect between pulleys and the take-up unit, producing steep, short-duration variations in belt force at the drive. Effective tensioning can attenuate the severity of these peaks but rarely eliminate them entirely.
Conveyor belts are complex structures, composed of rubber and fabric reinforcement layers, which exhibit nonlinear elastic and viscoelastic behaviour, including creep and stress relaxation. These material properties contribute to the long-term evolution of belt tension and may contribute to the gradual development of belt looseness in conveyor systems.
In the present study, the diagnostic focus is on short-duration dynamic events associated with slip–reengagement at the drive pulley. These events produce rapid tension redistribution and transient torque disturbances, which generate impulsive components in the motor current signal.
The electromechanical consequence of this dynamic process is clearly observed in the motor drive system. In conveyors powered by induction motors, the abrupt rise in required torque to arrest slip and re-accelerate the belt mass manifests as sharp current surges. These surges appear as short-duration motor current spikes. These spikes are essentially deviating from Gaussian behaviour. Motor current data provide a practical and non-intrusive means of capturing these disturbances, as the motor current directly reflects the instantaneous torque demand and belt–drive interaction.
The stress distribution and friction conditions along the wrap arc between the belt and the drive pulley are influenced by numerous factors, including belt tension, pulley speed, lagging condition, and bulk material loading. These interactions result in complex contact mechanics, which are difficult to accurately model for practical industrial environments.
Rather than modelling these contact phenomena analytically, the present study focuses on their detectable outcome, namely, on an intermittent slip followed by rapid belt reattachment. This process excites tension waves and produces abrupt torque variations, which are directly reflected in a motor current signal.
A distinctive aspect of conveyor belt looseness, compared with many other conveyor faults, is that impulsive events are not always isolated. Once the drive enters a marginal traction state, slip and reengagement may repeat in a regular fashion, producing a repetitive impact frequency and its harmonics in the signal spectrum. This impact frequency reflects the recurrence interval of the slip–reengagement cycle or the resonant response of the belt–pulley–take-up system. At times, a clear periodic modulation emerges, resembling the signature of classical mechanical impacts.
Despite the distinct electrical signatures that these events imprint on the motor current, conventional diagnostic techniques often fail to provide reliable detection. The primary challenges are twofold. First, the periodic component may appear during severe marginal traction but may not be the same under lighter loads because the slip–reengagement cycle changes based on the load scenario. Second, the impulses themselves are sometimes weak, particularly under light loads, and are easily masked by background noise.
These limitations underscore the necessity of diagnostic technology, capable of detecting periodic impulsive components. The spectral kurtosis is well suited for the detection of looseness-induced impulsive phenomena because it selectively highlights frequency bands, in which non-stationary, intermittent, or impulsive energy is concentrated. The spectral kurtosis accentuates localised deviations from Gaussianity, making it possible to highlight weak slip–reengagement impulses.
It is important to distinguish belt looseness from other common conveyor faults that may influence motor current signals. Belt looseness is characterised by intermittent slip–reengagement events at the drive pulley, which generate irregular torque restoration impulses and low-frequency harmonics. In contrast, a belt misalignment typically produces changes in the magnitudes of supply frequency harmonics [7,11], associated with a persistent frictional loading, while local defects in motor rolling-element bearings generate sidebands around harmonics of supply frequency, due to localised defect-related mechanical impacts [36,37]. These differences in the underlying physical mechanisms result in distinct electromechanical signatures in motor current signals, enabling the proposed diagnostic technologies to discriminate belt looseness-induced transients from belt misalignment and local faults of motor rolling-element bearings.
In the case of conveyor belt looseness, the impulsive activity is not only load-dependent but also intermittent in its manifestation. The sSpectral kurtosis can capture this intermittency by mapping how the impulsive content varies with frequency. Moreover, the periodicity of the impulses generates distinct harmonic structures, and the spectral kurtosis provides the ability to identify the optimal frequency bands, in which these structures are prominent. Another important advantage is that the SK does not require prior knowledge of optimal demodulation frequency band or load state. Its adaptive nature allows us to reveal hidden impact-related bands that conventional techniques might overlook.
Mathematically, the spectral kurtosis S K f at frequency f is defined as in Equation (1) [18,19]:
S K f = 1 N n = 1 N X n ( f ) 4 1 N n = 1 N X n ( f ) 2 2 2
where X n ( f ) represents the Fourier transform of the n t h windowed segment. N refers to the total number of segments, and the subtraction of 2 aligns the spectral kurtosis with the excess kurtosis of the Gaussian distribution (which has a kurtosis of 3).
Thus, for the purely Gaussian process, S K ( f ) = 0 at all frequencies. The value of SK reflects the extent to which the signal at a specific frequency differs from Gaussian behaviour, with larger values signifying higher impulsiveness. This produces a spectral profile in which prominent peaks identify frequency bands containing impulsive, and potentially fault-related, activity. Such characteristics make the spectral kurtosis effective for isolating impact-induced components in motor current signals arising from belt looseness, thereby facilitating improved fault diagnosis through subsequent filtering and feature extraction.
The spectral kurtosis also underpins adaptive filtering strategies, designed to extract transient components embedded within stationary background noise. The spectral kurtosis of a composite signal K x f can be analytically linked to the SK of the transient component K y f through the following expression in Equation (2) [18]:
K x f = K y f 1 + ρ f 2 ;      f 0 ,
where ρ f = S n f S y f denotes the noise-to-signal power ratio, with S y f being the estimated signal power and S n f being the estimated noise power at frequency f .
From this expression, a spectral kurtosis-based Wiener filter can be derived to enhance the signal components corresponding to the impulsive features while suppressing stationary background noise. The filter selectively suppresses stationary components while preserving non-stationary transients. A simplified adaptive filter in Equation (3) is as follows [19]:
W ^ f = K x f for   K x f > S α 0 otherwise
where S α is a derived threshold.
The filtered signal in the frequency domain, referred to as the R S K f , is computed by Equation (4):
R S K f = W ^ f . X f
where X ( f ) is the Fourier transform of the original current signal x ( t ) .
Applying the inverse Fourier transform yields the time-domain filtered signal, which contains enhanced transient content in Equation (5) as r S K :
r S K = F 1 R S K f
To further amplify the impulsive modulations, the envelope of r S K is computed using the Hilbert transform H { } , yielding a demodulated signal that highlights non-stationary amplitude variations, as shown in Equation (6):
e n v ( t ) = H { r S K }
This envelope signal captures the amplitude variations caused by periodic impacts and highlights low-frequency modulation patterns. To explore the time-varying spectral content of these modulations, the Short-Time Fourier Transform (STFT) is applied to the envelope signal e n v ( t ) . The STFT is defined in Equation (7):
E ( f , τ ) = + e n v ( t ) w ( t τ ) e j 2 π f t d t
where τ is the time shift and f is frequency in Hz.
This time–frequency representation enables the identification of low-frequency components that correlate with impulsive impact behaviour.
While the spectral kurtosis (SK) is excellent at pinpointing frequency bands that contain intermittent, impulsive energy, it does not provide a direct measure of cross-harmonic relationships—whether impulsive events occurring at different frequencies tend to co-occur, or how their magnitudes are statistically dependent. In conveyor looseness, slip–reengagement dynamics can produce impulsive bursts, whose energy is distributed across multiple frequencies; the diagnostic value lies not only in identifying those bands, but also in detecting their joint, repetitive behaviour.
The Cross-Correlation of Spectral Moduli (CCSM) technologies [36,38] quantify correlations among the magnitudes [39] of spectral components, created by damage-related spikes. Measuring how spectral moduli co-vary across frequency combinations (and exploiting higher-order cross-correlations) without imposing restrictions, based on the dependencies between their central frequencies, reveals repetitive impact structures and cross-harmonic couplings. For these technologies, spectral analysis of the envelope of the SK-filtered signal identifies impact-related harmonics, which serve as a basis for the Cross-Correlation of Spectral Moduli technologies to explore cross-spectral patterns associated with slip–reengagement events in the nonlinear belt–pulley system.
The mathematical equations for the two technologies—Cross-Correlation of Spectral Moduli of orders 3 and 4 (CCSM3, CCSM4)—are represented in Equations (8) and (9):
C C S M 3 f 1 , f 2 , f 3 = j = 1 J E f 1 j · E f 2 j · E f 3 j j = 1 J E f 1 j E f 1 ¯ 3 3 · j = 1 J E f 2 j E f 2 ¯ 3 3 · j = 1 J E f 3 j E f 3 ¯ 3 3
C C S M 4 f 1 , f 2 , f 3 , f 4 = j = 1 J E f 1 j · E f 2 j · E f 3 j · E f 4 j j = 1 J E f 1 j E f 1 ¯ 4 4 · j = 1 J E f 2 j E f 2 ¯ 4 4 · j = 1 J E f 3 j E f 3 ¯ 4 4 · j = 1 J E f 4 j E f 4 ¯ 4 4
where E f ¯ = 1 J j = 1 J E f j , E f j represents the Short-Time Chirp Fourier Transform j-th segment of the envelope signal e n v t corresponding to f .
The Short-Time Chirp Fourier Transform (STCFT) [37,40] is shown in Equation (10):
E f , τ , c 2 = 1 T i + e n v ( t ) w i ( t τ ) e 2 π j f t + c 2 ( t ) 2 t 2 d t
where j = 1 , and w i ( t ) is the time window (Hamming) with a duration of T i , i = 1,2 , , N ,   N is the number of linear parts in the piecewise frequency–time dependency; f is frequency; c 2 ( t ) is the variable chirp rate of the transform; and τ is the window centre.
The STCFT is preferred over the traditional Short-Time Fourier Transform (STFT) due to its superior performance in analysing non-stationary signals, which are typical in varying motor conditions.
The use of the STCFT is particularly important in the present study because belt looseness generates transient electromechanical responses with time-varying instantaneous frequencies. During slip–reengagement events, the torque transmitted by the drive pulley changes abruptly, producing non-stationary components in the motor current signal, whose frequency trajectories may deviate from standard harmonic patterns. In practical operating conditions, these components may, therefore, appear as variable frequency harmonics in the time–frequency domain.
Unlike conventional transforms, based on stationary kernels, the STCFT employs a chirp-adaptive non-stationary kernel, which allows the transform to follow signals with time-dependent frequency evolution. This property enables an accurate localisation of transient spectral components, associated with slip–reengagement dynamics. As a result, the STCFT provides a reliable basis for extracting the fault-related harmonics used in the subsequent CCSM analysis.
The process of estimating the Cross-Correlation of Spectral Moduli technology involves several steps. Initially, the current signal is divided into either overlapping or non-overlapping time segments. In the second step, each segment undergoes a selected transformation in the time–frequency domain. Subsequently, the moduli of the spectral components are calculated for specific frequency components. Finally, instantaneous cross-correlations are computed within each segment and averaged across all segments to obtain the overall estimation.
However, its performance is highly dependent on the choice of frequency combinations. In practice, the instability of looseness-induced impacts and inconsistency of the periodic spectral components sometimes make it challenging to consistently identify the optimal set of frequency interactions. Moreover, the CCSM technologies require careful selection of segment length, overlap, and transformation parameters, all of which may vary with operating conditions. These practical challenges underscore the need for another novel technology that can effectively identify impulsive behaviour in a more direct and band-independent manner.
This motivates the novel proposition of Consolidated Spectral Kurtosis (CSK) technology, which consolidates spectral kurtosis information across the entire frequency. CSK technology extends the diagnostic capability of the CCSM technologies into an effective, band-independent measure that can capture impulsiveness without relying on unstable periodicity or parameter tuning.
Consolidated Spectral Kurtosis (CSK) technology operates by summing the spectral kurtosis (SK) values over the entire frequency, providing a measure of the overall impulsiveness of the signal. By eliminating the need for steps such as selecting frequency bands, designing filters, or performing envelope analysis, the CSK technology enables more effective diagnostic performance, simpler automation, and a reduction in computational requirements.
Let K ( f ) denote the spectral kurtosis, computed at frequency bin f , and S α be a threshold. A binary selection function Γ ( f ) is defined to retain only those frequency components whose SK values exceed the threshold shown in Equation (11):
Γ f = 1 for   K f > S α 0 for   other
The Consolidated Spectral Kurtosis is then formulated as the summation over the full spectral domain with the SK values passing the threshold shown in Equation (12):
C S K = f = f m i n f m a x K f . Γ ( f )
This technology provides a comprehensive measure of impulsive behaviour across the entire frequency spectrum. It can reliably detect broadband transient events, making it well suited for real-time fault diagnosis in conveyor systems with non-stationary conditions.

2.2. Methodology

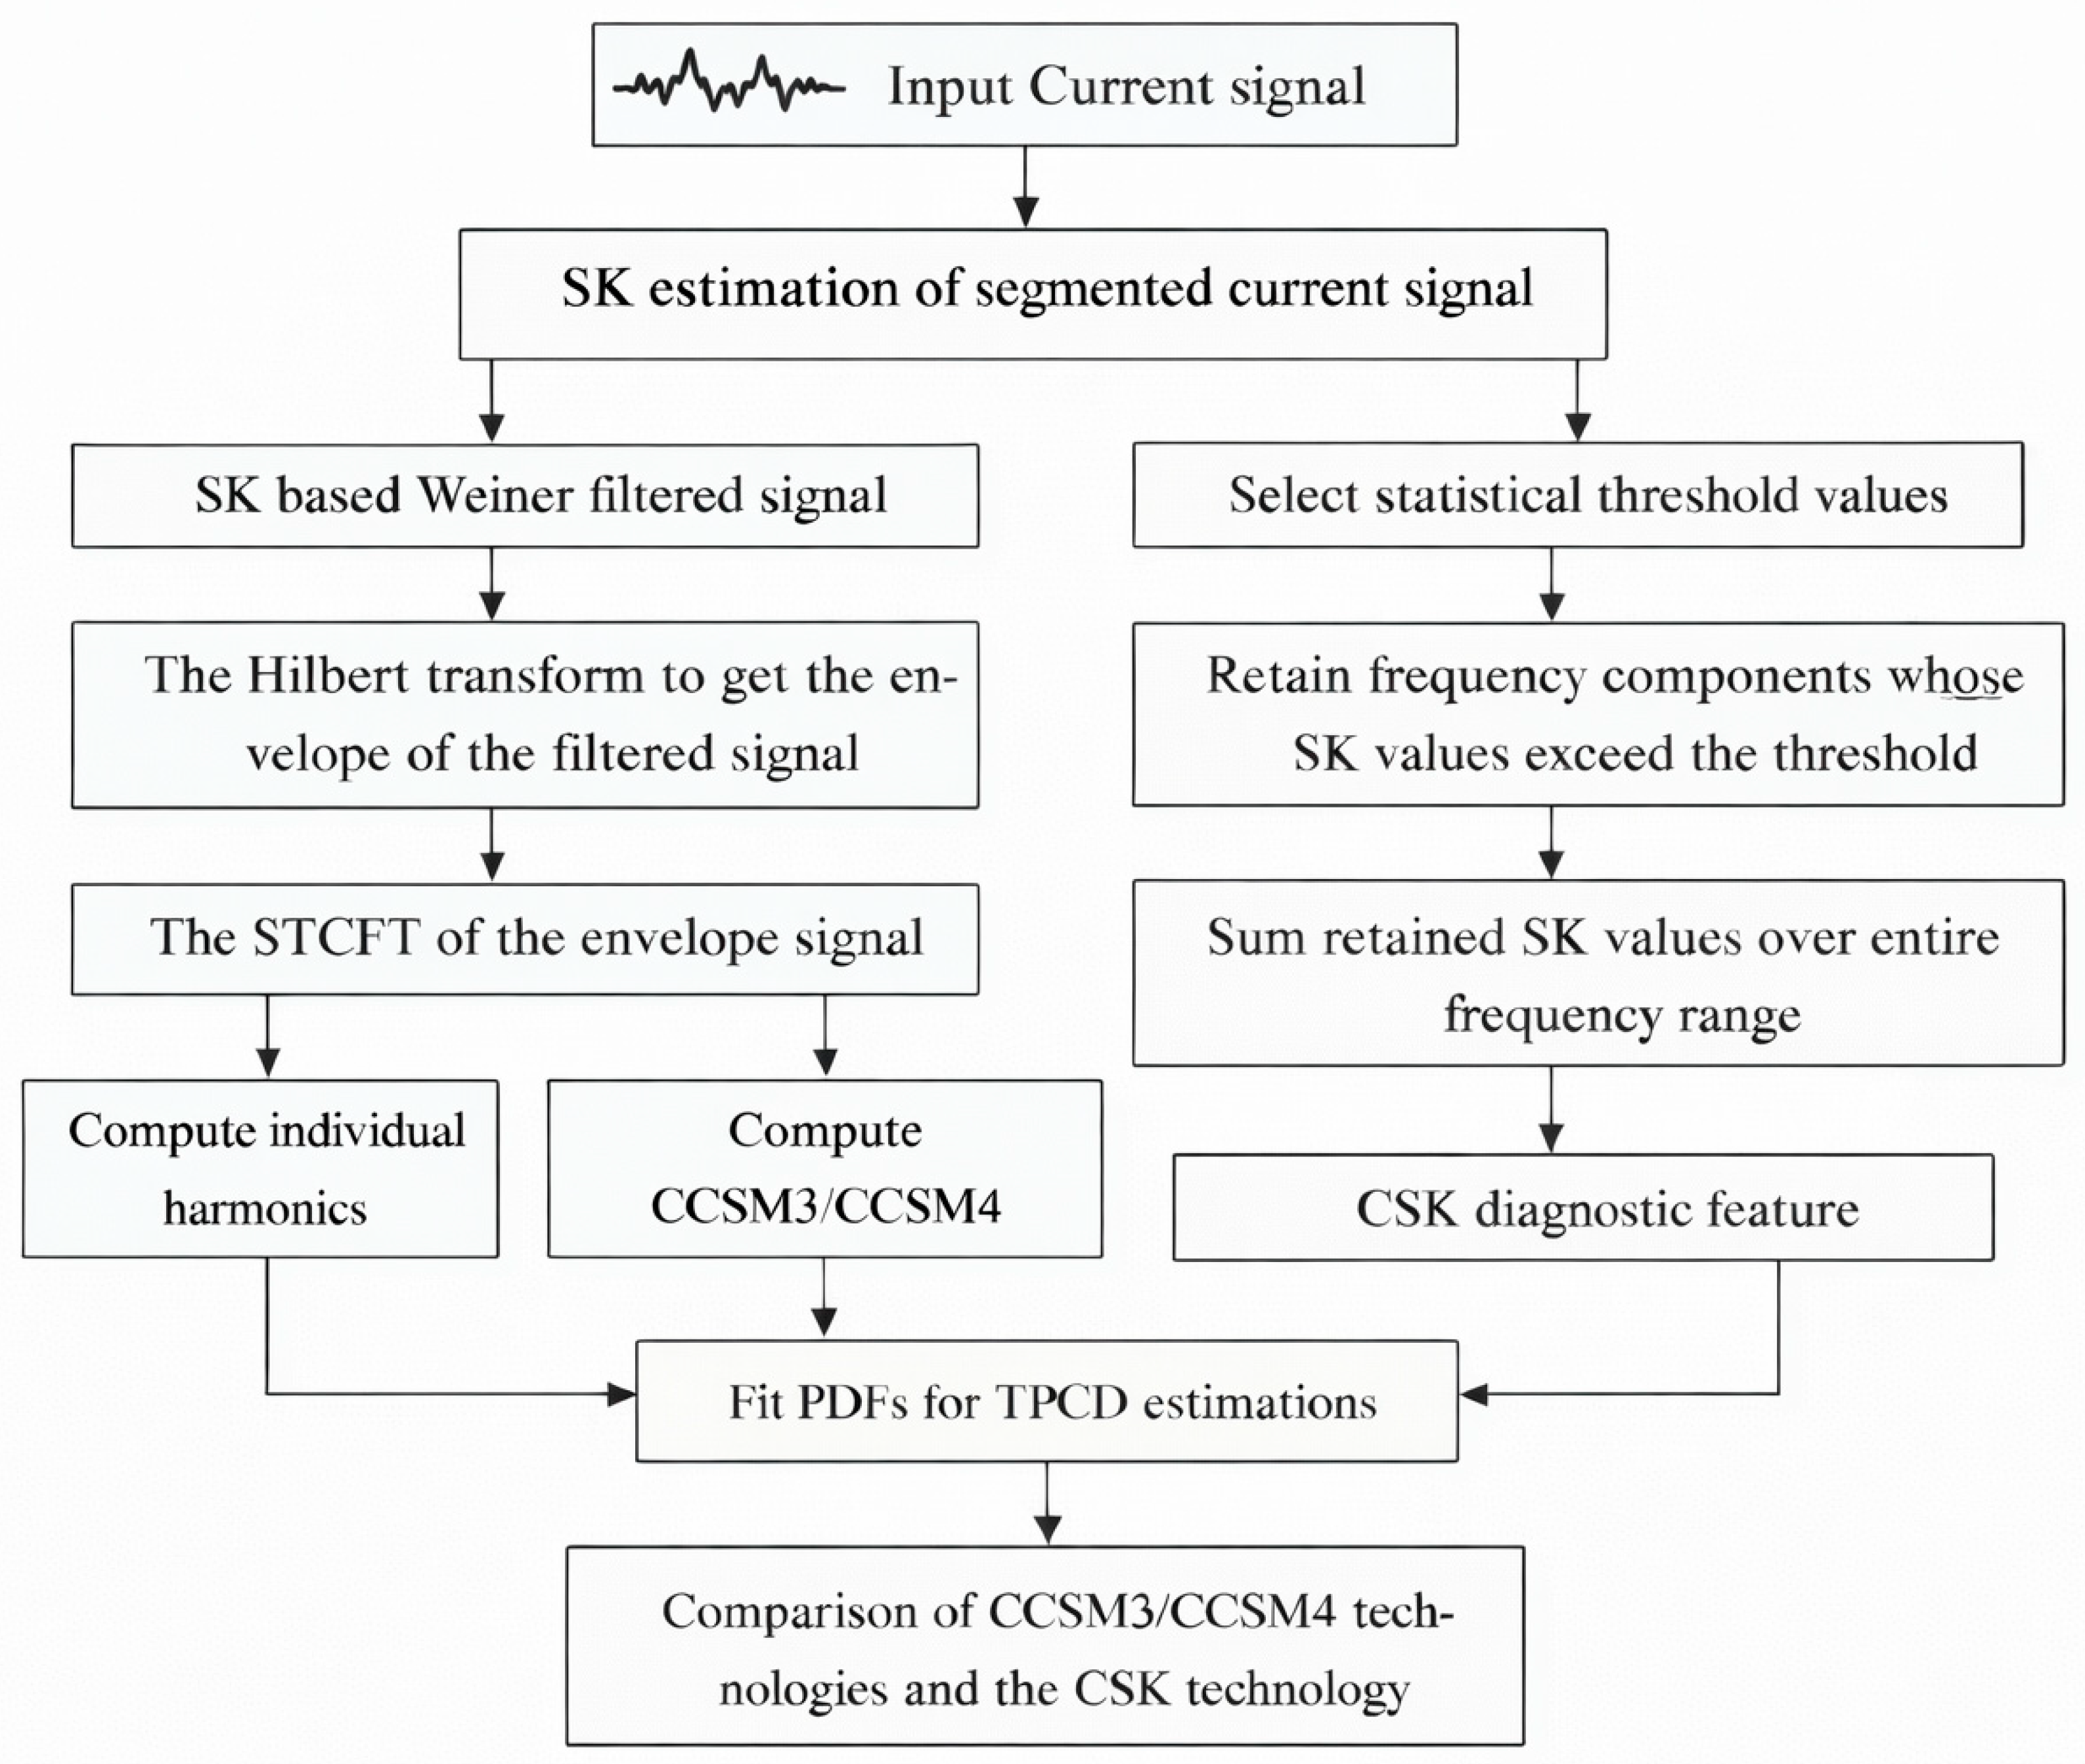
Motor current from a three-phase induction drive is acquired using LEM ATO-B10 sensors passed through KEMO anti-aliasing filters, and digitised using a WebDAQ 504 at a sampling rate of 25.6 kHz with 24-bit resolution. The sensors belong to the ATO series manufactured by LEM (Meyrin, Geneva, Switzerland) and are based on a split-core transformer design, providing galvanic isolation between the primary (supply) circuit and the secondary (measurement) circuit for accurate stator current measurement. Recordings are obtained under representative operating conditions of the belt–pulley system, including no-load and loaded cases, to capture natural variability and non-stationarity. The raw current is first analysed in the spectral kurtosis (SK) domain to expose frequency bands dominated by intermittent transients. A simplified SK-based Wiener filter is formed by thresholding the SK map, which selectively preserves non-stationary components while attenuating stationary background. The filter is applied in the frequency domain to produce a shaped spectrum R S K f that is transformed back to the time domain r S K ( t ) . To demodulate impact-related amplitude variations, the analytic signal is computed via the Hilbert transform and its modulus is taken as the envelope e n . To locate impact bands, the Short-Time Chirp Fourier Transform (STCFT) of e n v ( t ) is computed; the time–frequency representation shows the presence of low-frequency components and their harmonics attributable to slip–reengagement events.
Two complementary technology paths are then derived from these analyses. In the CCSM technology path, the envelope e n is segmented into overlapping frames, and each frame is transformed by the Short-Time Chirp Fourier Transform (STCFT) to produce magnitude coefficients E f j at the harmonic frequencies identified from the STCFT. Higher-order Cross-Correlations of Spectral Moduli are formed across segments to quantify the joint, repetitive behaviour of those harmonics: the third-order CCSM3 and the fourth-order CCSM4 technologies measure how magnitudes at multiple frequencies co-vary in time without imposing stationarity assumptions. The resulting CCSM features and their empirical histograms are modelled with the Gaussian probability density functions, and the Bayes intersection [41] provides a decision threshold from which we compute the total probability of correct diagnosis (TPCD).
In the second band-independent path, the Consolidated Spectral Kurtosis (CSK) technology is computed directly from the SK map without band selection, filtering, and demodulation. A derived threshold S α retains only frequencies whose spectral kurtosis values exceed threshold levels, and the retained values are integrated over frequency to yield a scalar CSK for each signal.
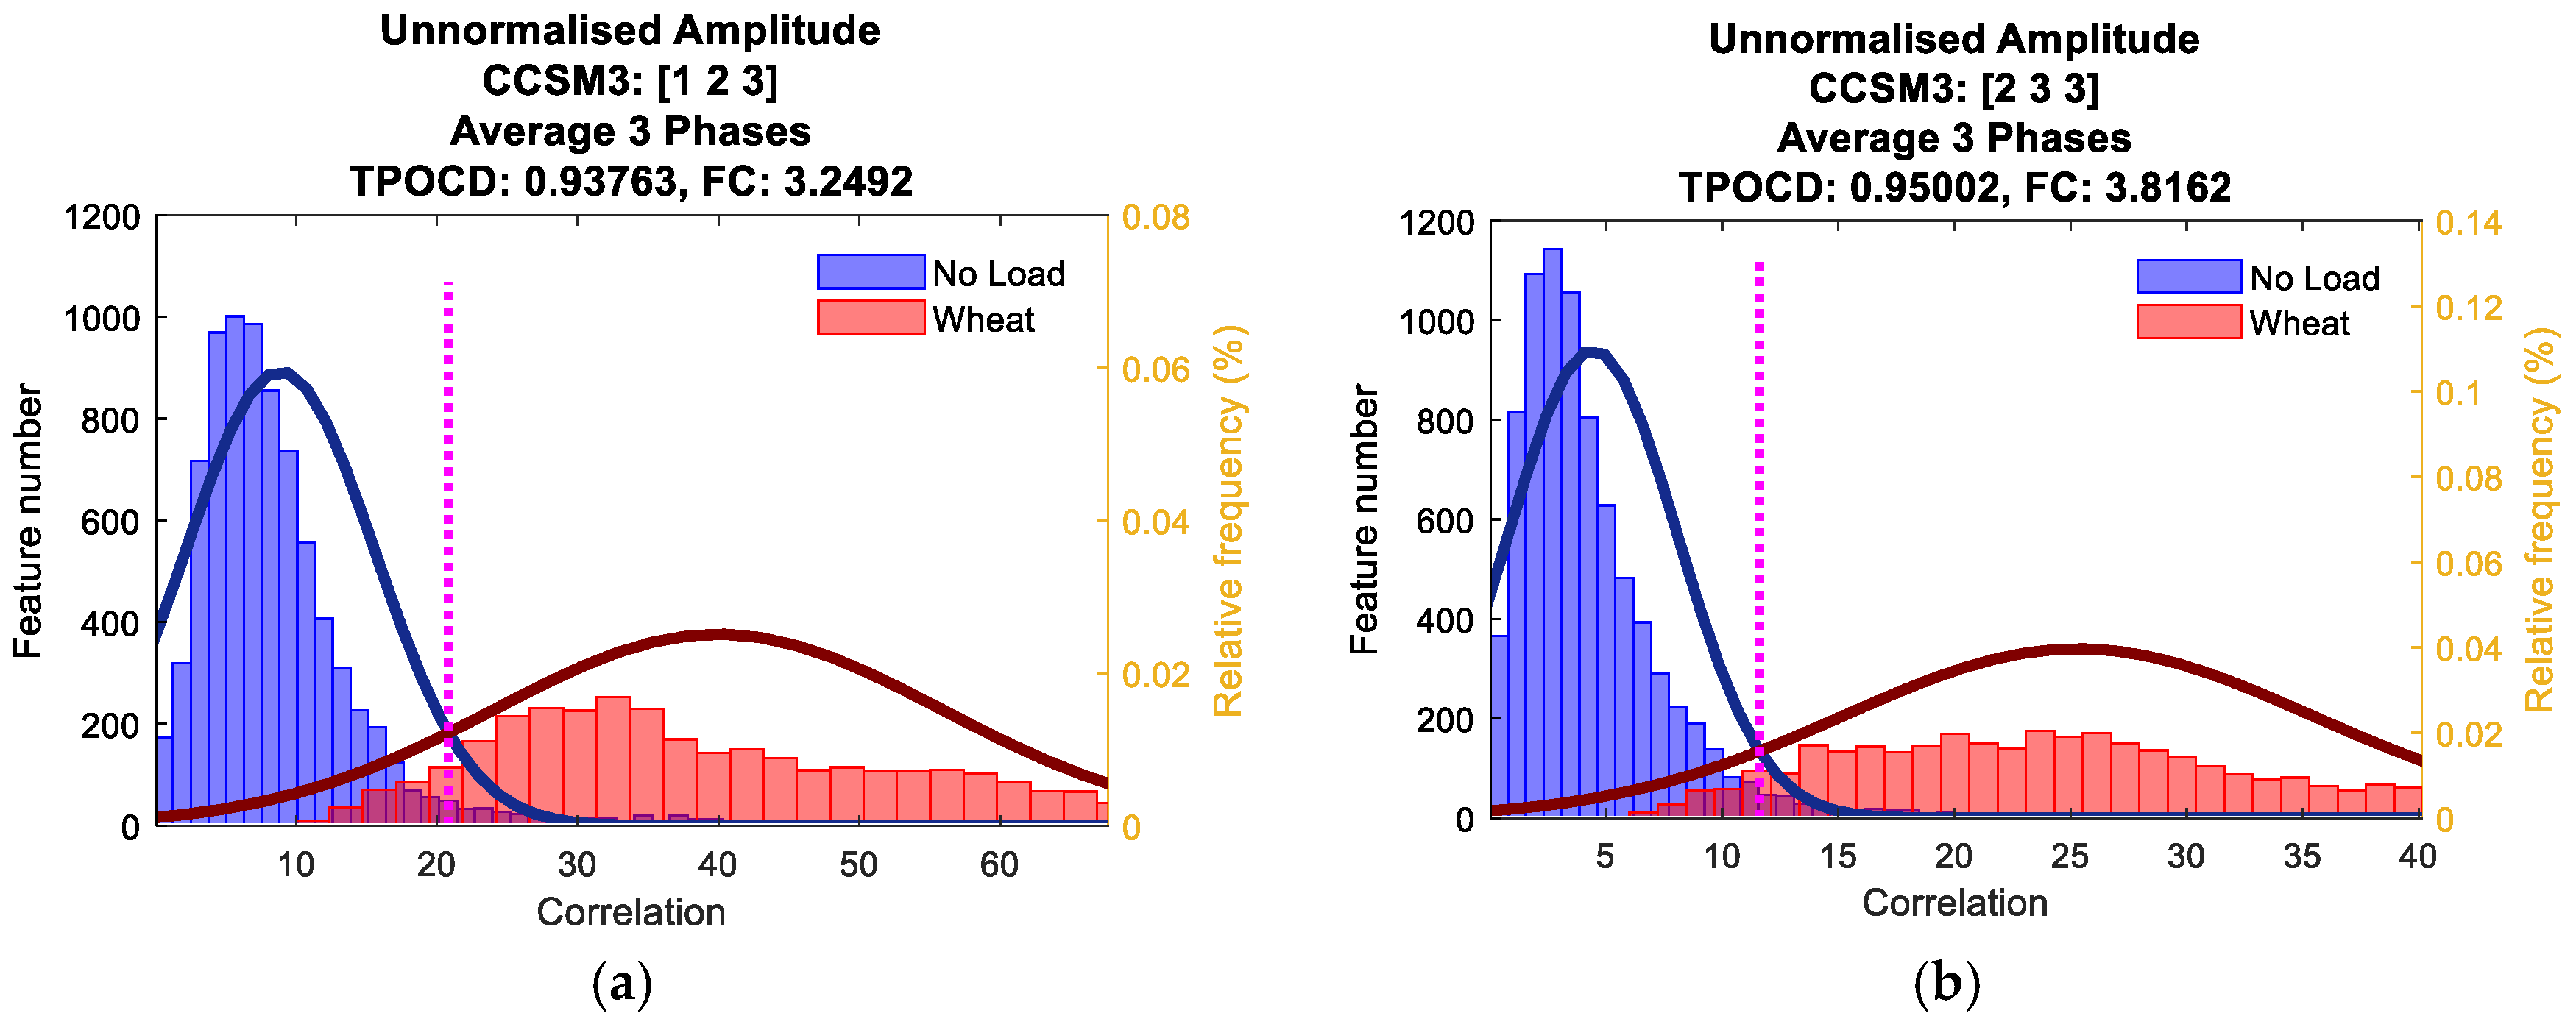
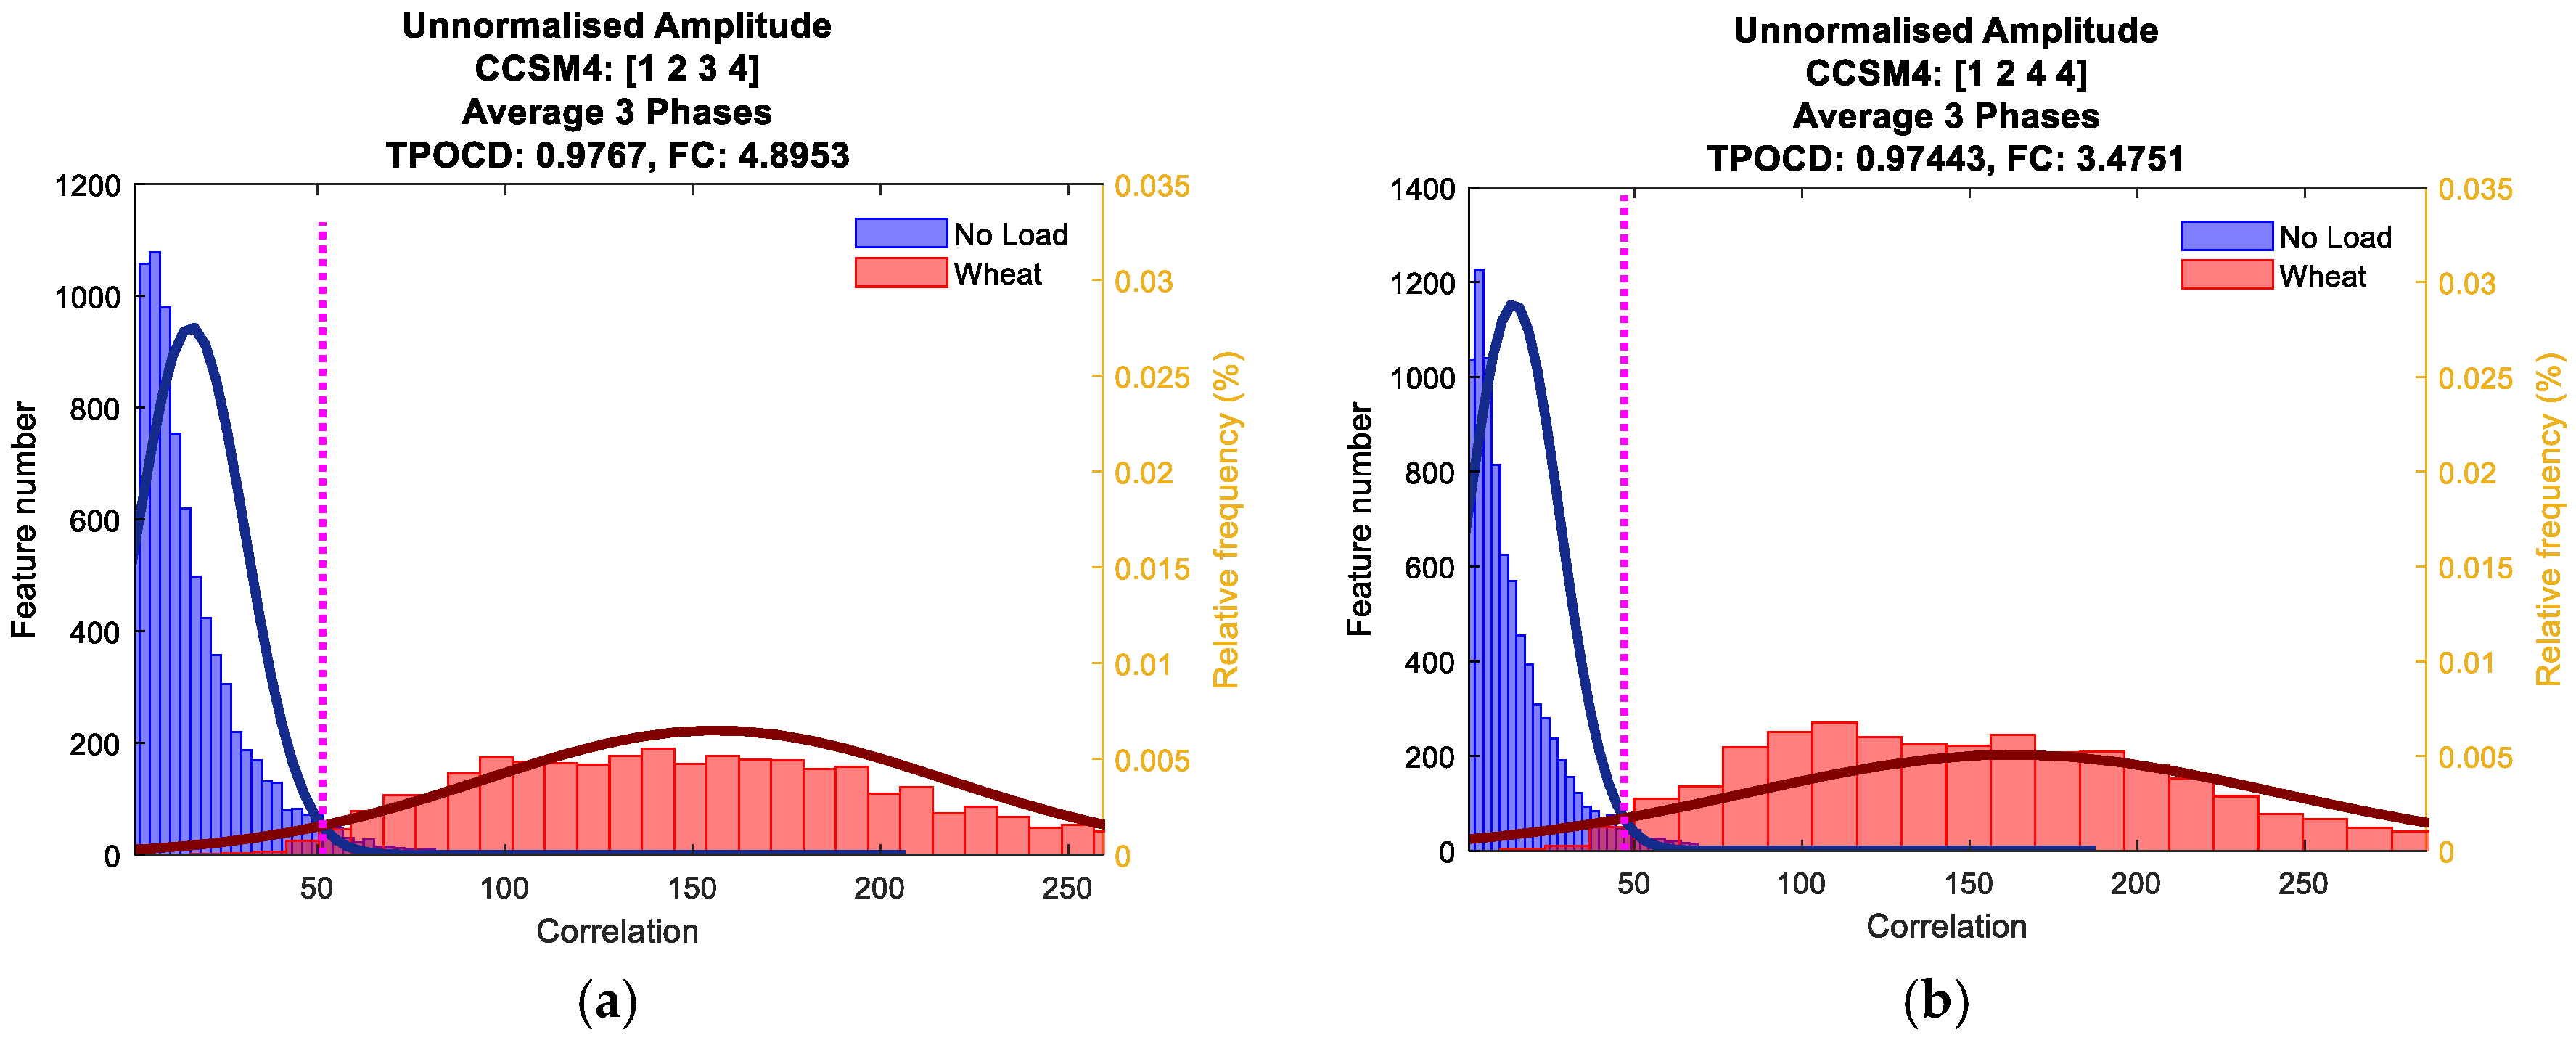
A diagnostic threshold is established at the intersection of two probability density functions (PDFs) based on the Bayesian decision rule [41] for evaluating efficiency of each one-dimensional diagnostic feature. If the feature value, associated with a healthy belt condition, falls below this threshold while the corresponding feature for a faulty belt exceeds it (represented by a pink-coloured dotted line indicating the threshold), the separation between the two states is achieved. The TPCD represents the ratio of correctly diagnosed cases to the total number of cases examined, providing a measure of diagnostic accuracy.
To evaluate the effectiveness of the technologies in diagnosing conveyor belt looseness, the probability density functions were estimated against each histogram based on the assumption that the features follow the normal distribution, represented by the Gaussian probability density functions (PDFs).
The mathematical expression for the probability density function of a normally distributed random variable X is defined in terms of its mean and standard deviation. To evaluate the effectiveness of the technologies in detecting conveyor belt looseness, the probability density functions were estimated against each histogram based on the assumption that the features follow the normal distribution, represented by the Gaussian probability density functions (PDFs) in Equation (13) [37]:
P D F X = 1 σ 2 π e ( x μ ) 2 2 σ 2
where X denotes the analysed feature value, μ represents the mean of the distribution, and σ denotes the standard deviation.
The total probability of correct diagnosis is determined by the following equation (Equation (14)) [42]:
T P C D = r N + p r N r N t + p r N t × 100 %
where r N and p r N represent the total number of correct diagnoses for the load condition and the unload condition, respectively, while r N t and p r N t denote the total number of diagnostic features associated with the conveyor belt load and unloaded conditions, respectively.
The feature distributions of the CCSM and the CSK technologies are fitted with the Gaussian distributions and assessed using the TPCD via the Bayesian threshold [41].
The comparison reports accuracy (i.e., the TPCD) and gains to quantify the comparative diagnostic effectiveness of the technologies for identifying belt looseness in real operating conditions. Figure 1 summarises the end-to-end workflow.

3. Experimental Setup

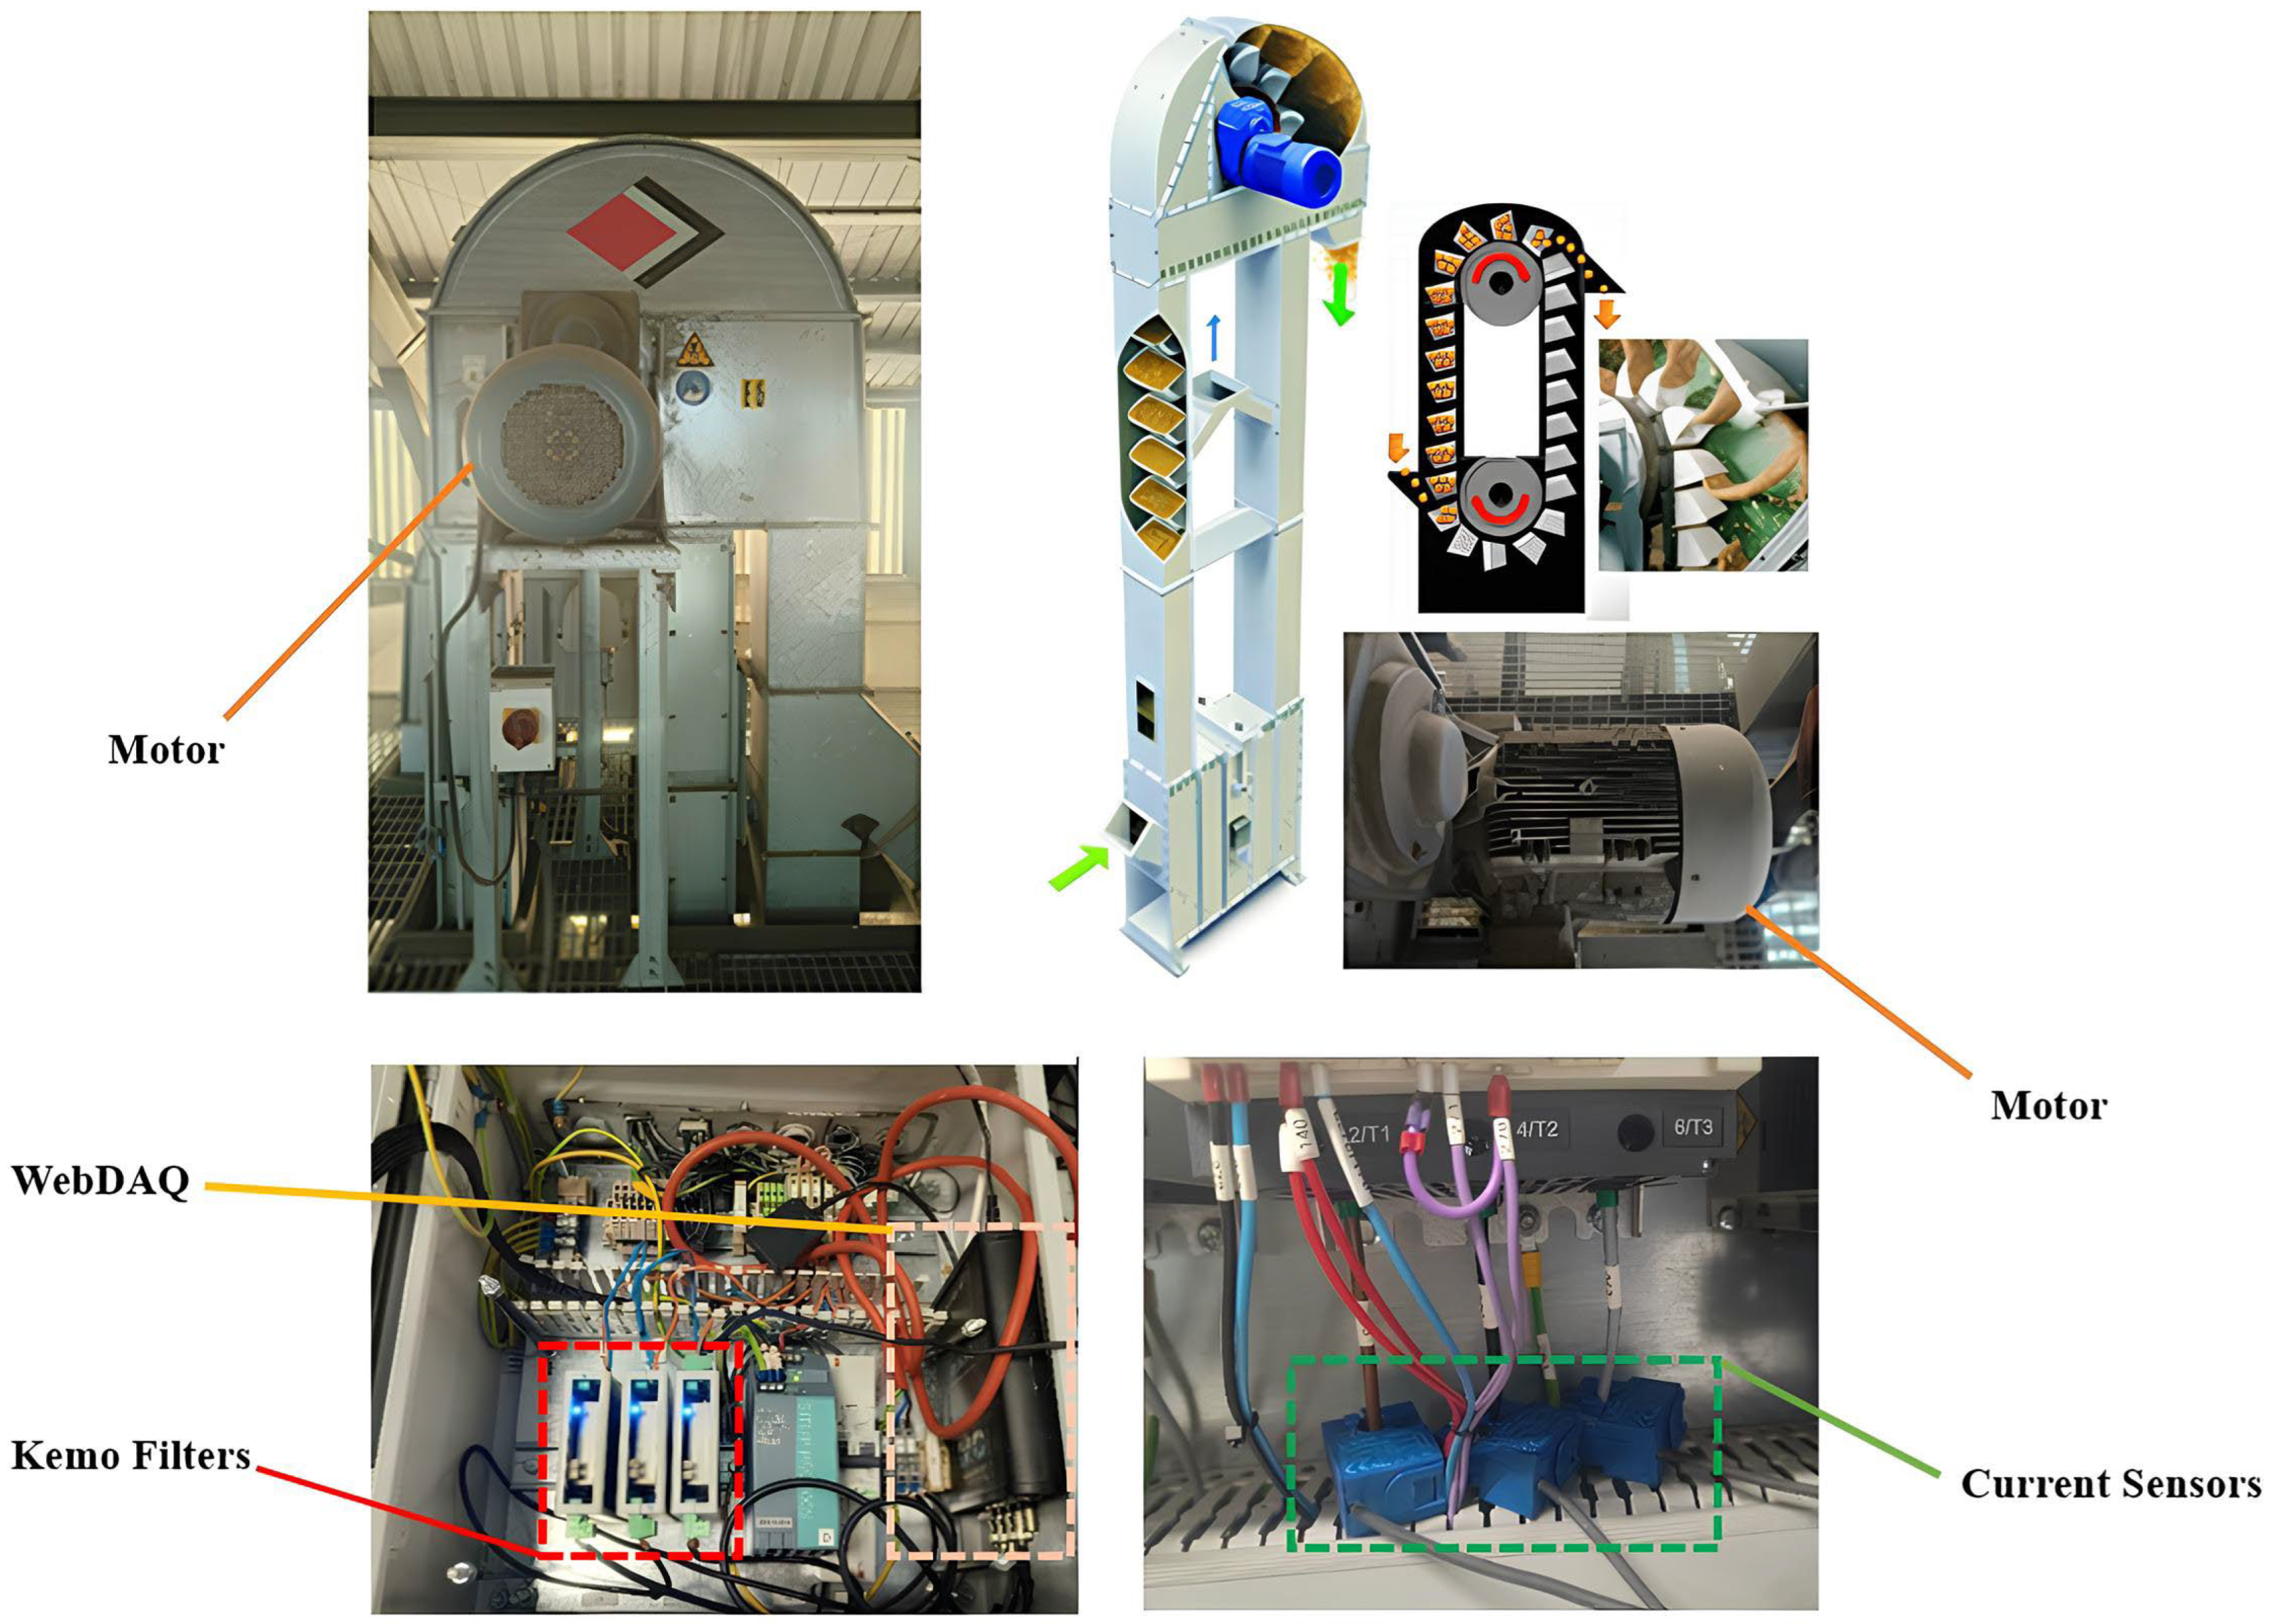
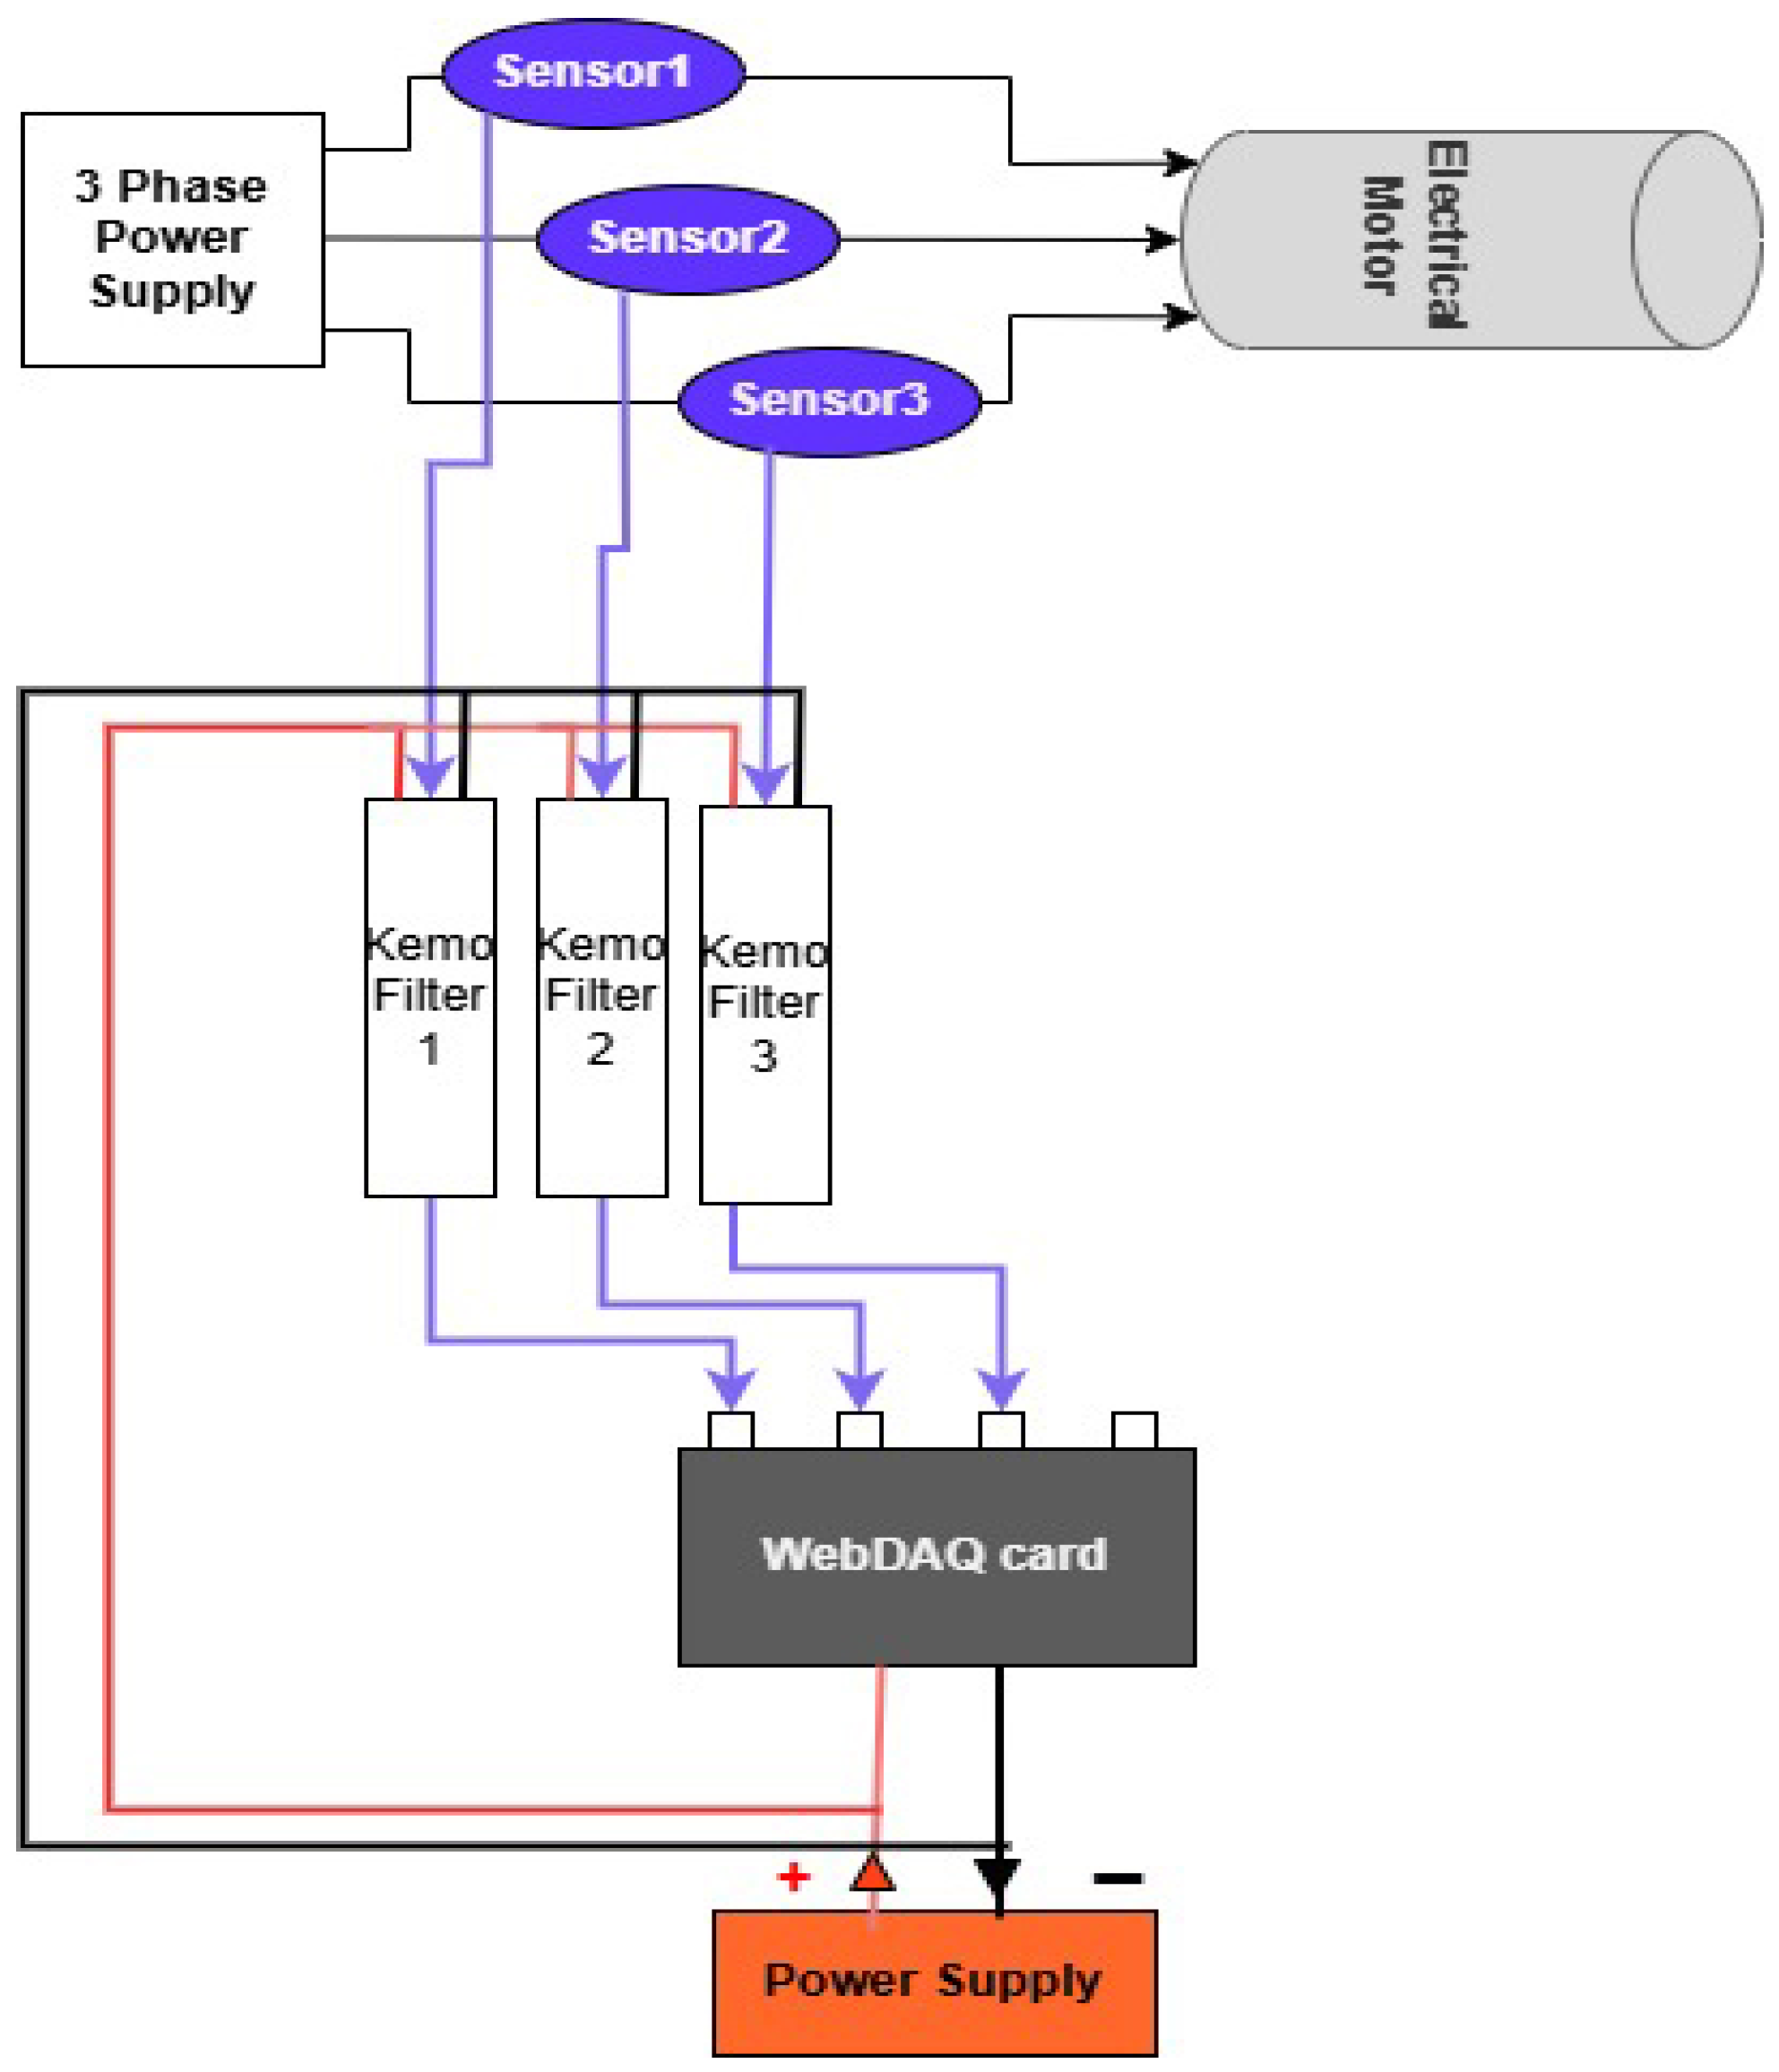
The experiment is conducted for a conveyor belt system at a grain site, in which the conveyor belt is powered by a three-phase AC induction motor. The experimental investigation is carried out using a three-phase induction motor manufactured by NORD, model number SK 180MP/4 TF (Motor No. 37753890). This motor conforms to the IEC 60034 standard and is classified under efficiency class IE3. It has a power rating of 18.5 kW and operates under continuous duty (S1) with a thermal class of 155 (F) and IP55 enclosure protection. The motor is designed for dual-frequency operation. At 50 Hz, it operates with a voltage of 400/690 V (Δ/Y), drawing 34.0/19.6 A of current, with a speed of 1480 rpm and a power factor of 0.84. At 60 Hz, it operates at 460 V (Δ), drawing 30.3 A, delivering the same power output of 18.5 kW at a slightly higher speed of 1780 rpm and a power factor of 0.82. The motor exhibits high efficiency, rated at 93.1% for 50 Hz and 93.6% for 60 Hz operation. The vertical conveyor belt system had metal cups attached to the belt to carry grain. To capture the electrical signal of the three-phase motor, LEM ATO-B10 current sensors are employed. These sensors, belonging to the ATO series, support a frequency bandwidth of 1.5 kHz at an attenuation level of −1 dB. Featuring a split-core current transformer design, they facilitate AC waveform current capture while ensuring galvanic isolation between the power and data capturing circuits. The selected sensor bandwidth should sufficiently capture all relevant frequency components. A higher bandwidth is intentionally retained to avoid attenuation of higher-order harmonics and transient components, and to maintain flexibility for broader diagnostic applications. With a primary current rating of 10 A, these sensors deliver an output voltage of 333 mV. The analogue signals, derived from each phase, are processed through KEMO DR 1600 anti-aliasing filters with a cut-off frequency of 20 kHz and a gain of ×20. The selected cut-off frequency ensures preservation of a wide signal bandwidth at the signal conditioning stage. This is important because the data capture chain is intended to support multiple diagnostic analyses, including those involving higher-frequency components. Therefore, the chosen cut-off avoids premature attenuation of potentially informative signal content prior to further processing. Figure 2 shows the experimental setup with the three-phase induction motor and data acquisition panel.
The WebDAQ 504 data acquisition card digitises and logs the processed signals, featuring four simultaneously sampled IEPE inputs, 24-bit resolution, a ±5 V input range, and a sampling rate of 25,600 Hz, ensuring high-resolution data capture while accurately preserving phase information and enabling reliable detection of low-amplitude motor current variations associated with fault-related transients. In addition, its stable sampling performance and standalone data logging capability improve data capture reliability during long-duration experiments. The WebDAQ 504 system is connected to a PC via Ethernet for data monitoring, storage, and subsequent signal processing. In addition, the device includes internal memory, providing backup capability for reliable data acquisition. A schematic of the data acquisition system is shown in the figure below (Figure 3).
The data capture process by employing current sensors is inherently non-ideal and is subject to unavoidable errors. In the present study, the main sources of data capture process errors are sensor errors, filtering/amplification errors, and data quantisation errors. Several measures are taken to reduce these errors, including the use of high-quality sensors, high-quality anti-aliasing filters/amplification units, and high-resolution (24-bit) data quantisation by the WebDAQ card. The current sensors provide a 1% ratio error and a 0.1% linearity error. The anti-aliasing filters/amplification units provide a total harmonic distortion error < 0.003%. The 24-bit quantisation by WebDAQ provides an interference floor of −144 dB, which is well below the interference floor of the sensors. Therefore, a quantisation error could be ignored.

4. Results and Discussion

4.1. Spectral Kurtosis Results

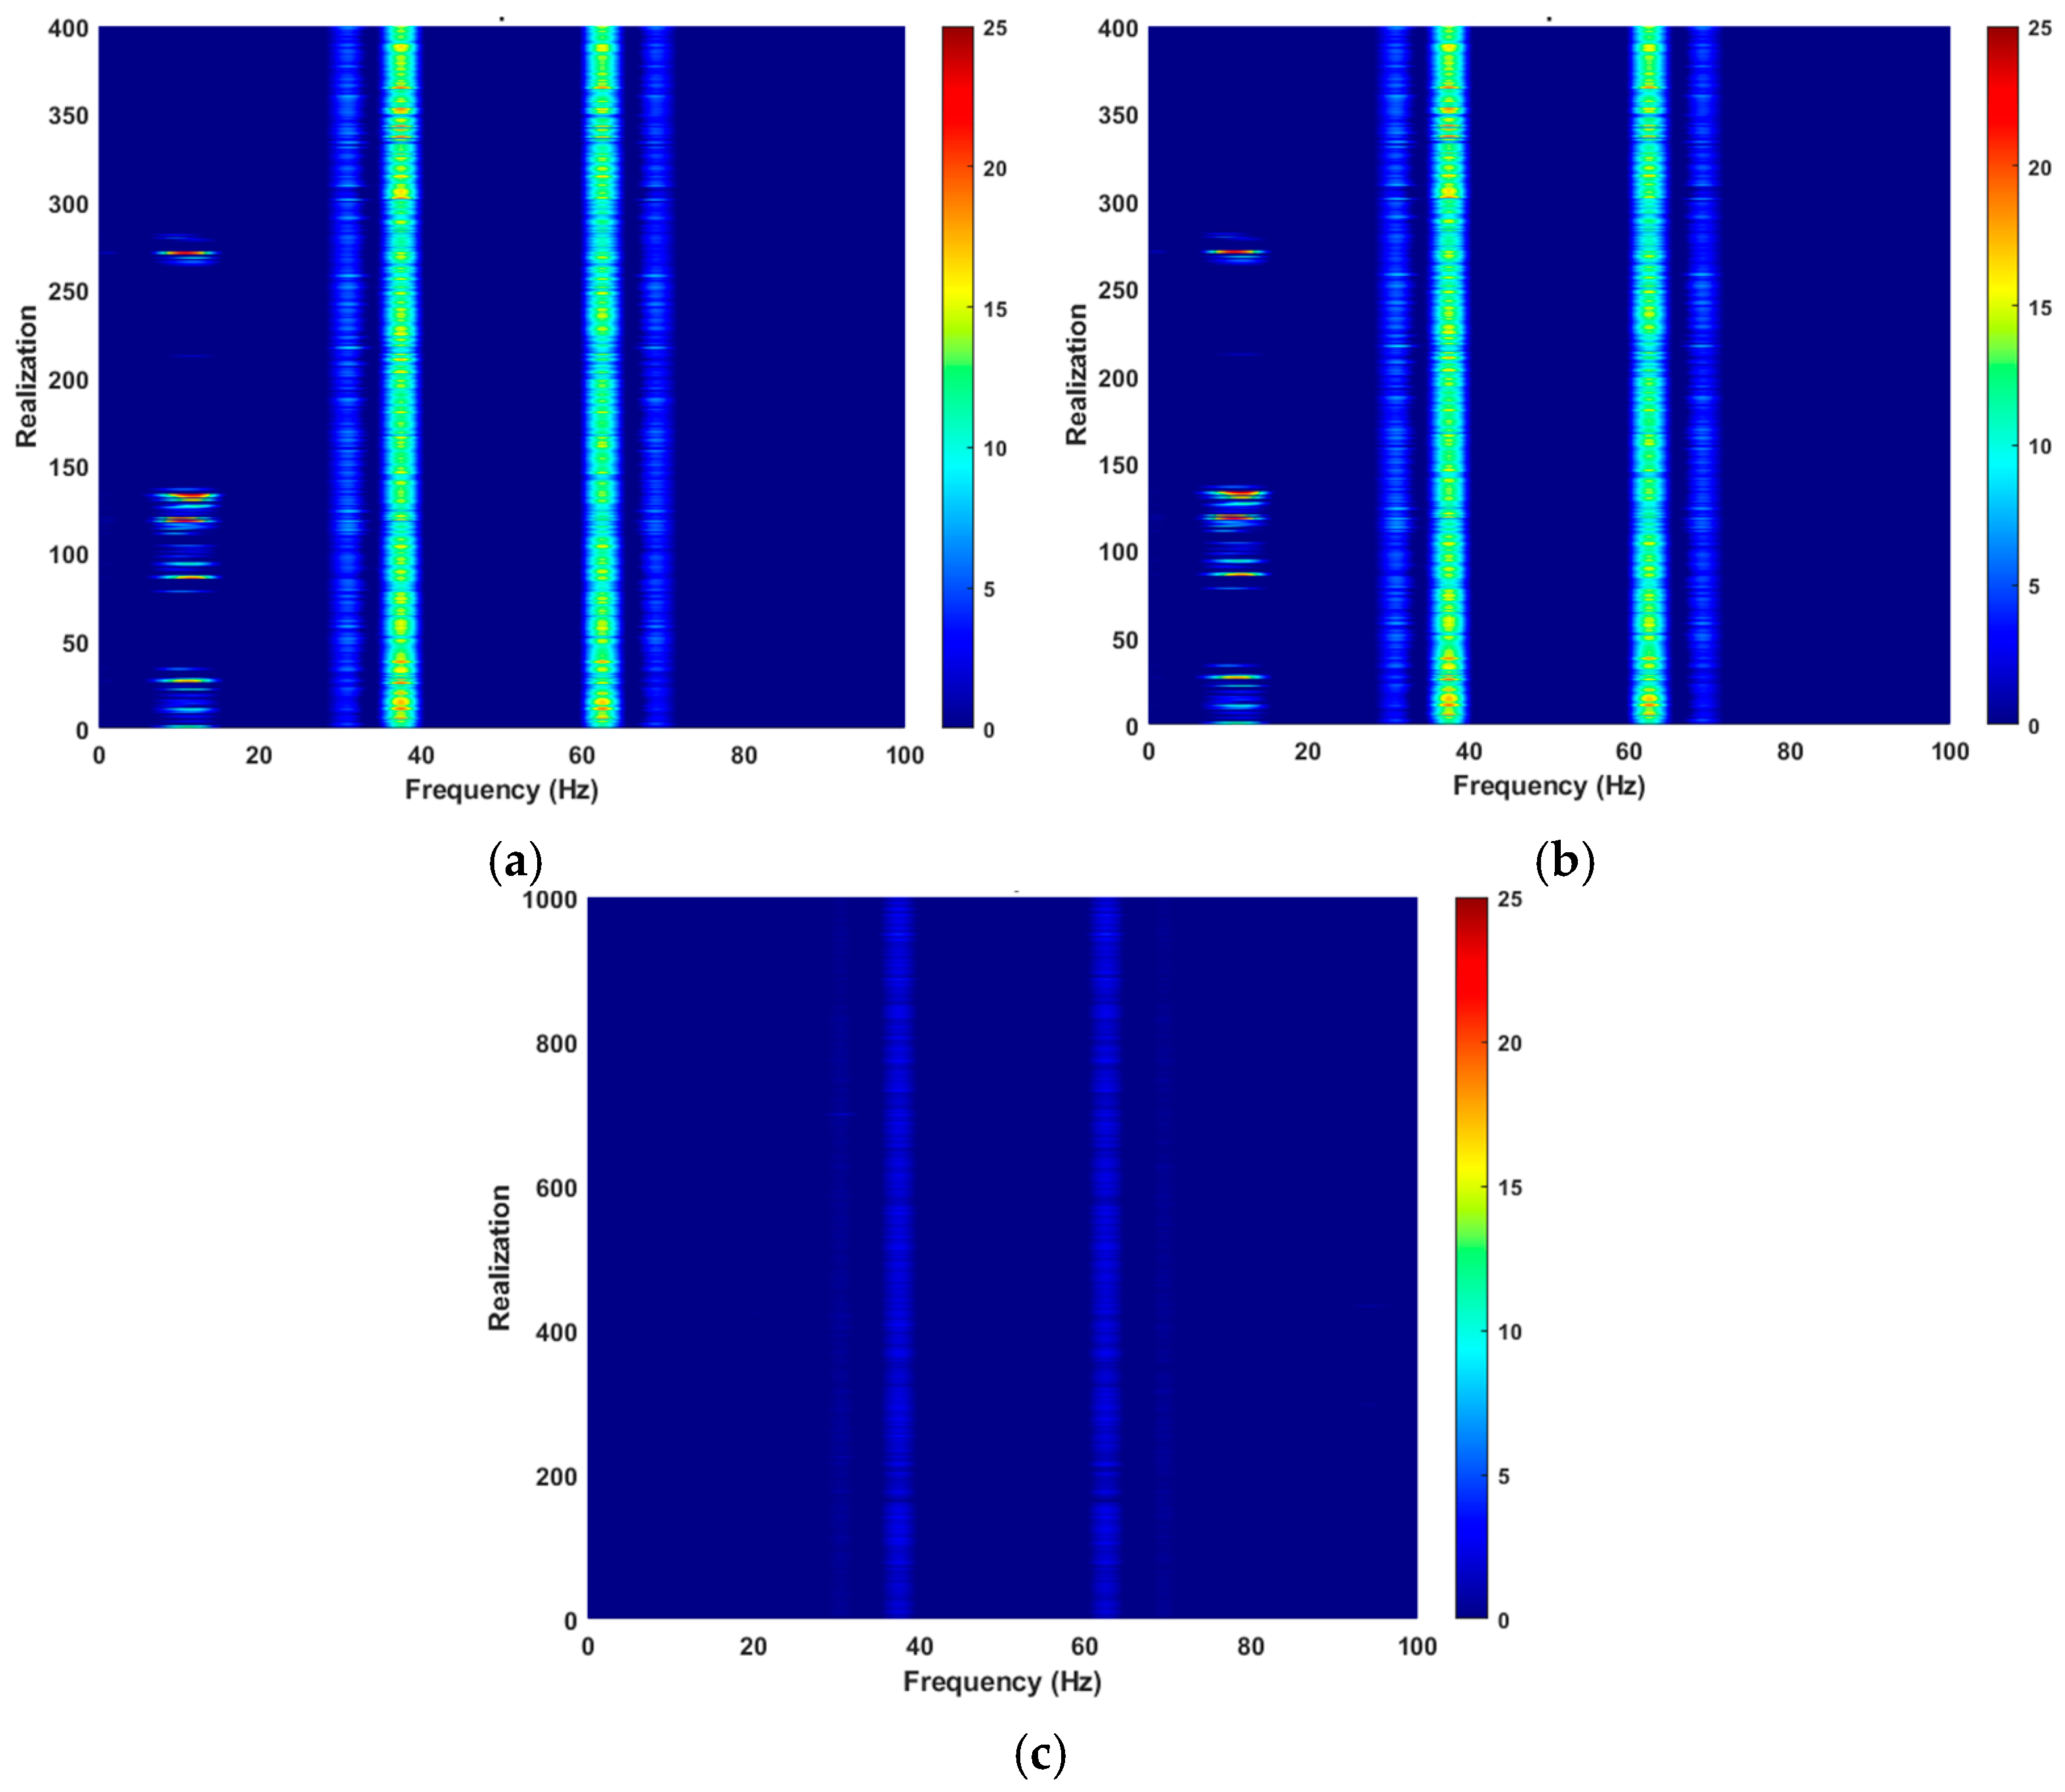
Under no-load conditions, the motor current signal remains relatively smooth with very-low-intensity spikes, resulting in consistently low spectral kurtosis (SK) values, concentrated in specific frequency bands. However, under loaded conditions, increased belt–motor interactions cause pronounced transient spikes, resulting in higher spectral kurtosis values, also concentrated in specific frequency bands.
Importantly, the same characteristic frequency bands, associated with transient activity, are present across all operating conditions, including no load, wheat load, and oat load. These patterns are clearly reflected in the three spectral kurtosis maps shown in Figure 4. In the no-load condition, the spectral kurtosis values are very low across the frequency bands. The absence of strong spectral kurtosis values suggests that the motor is running under stable conditions without essential transient spikes. In contrast, for the loaded condition, prominent frequency bands of high spectral kurtosis values appear around the same frequency bands, indicating strong transient spikes.
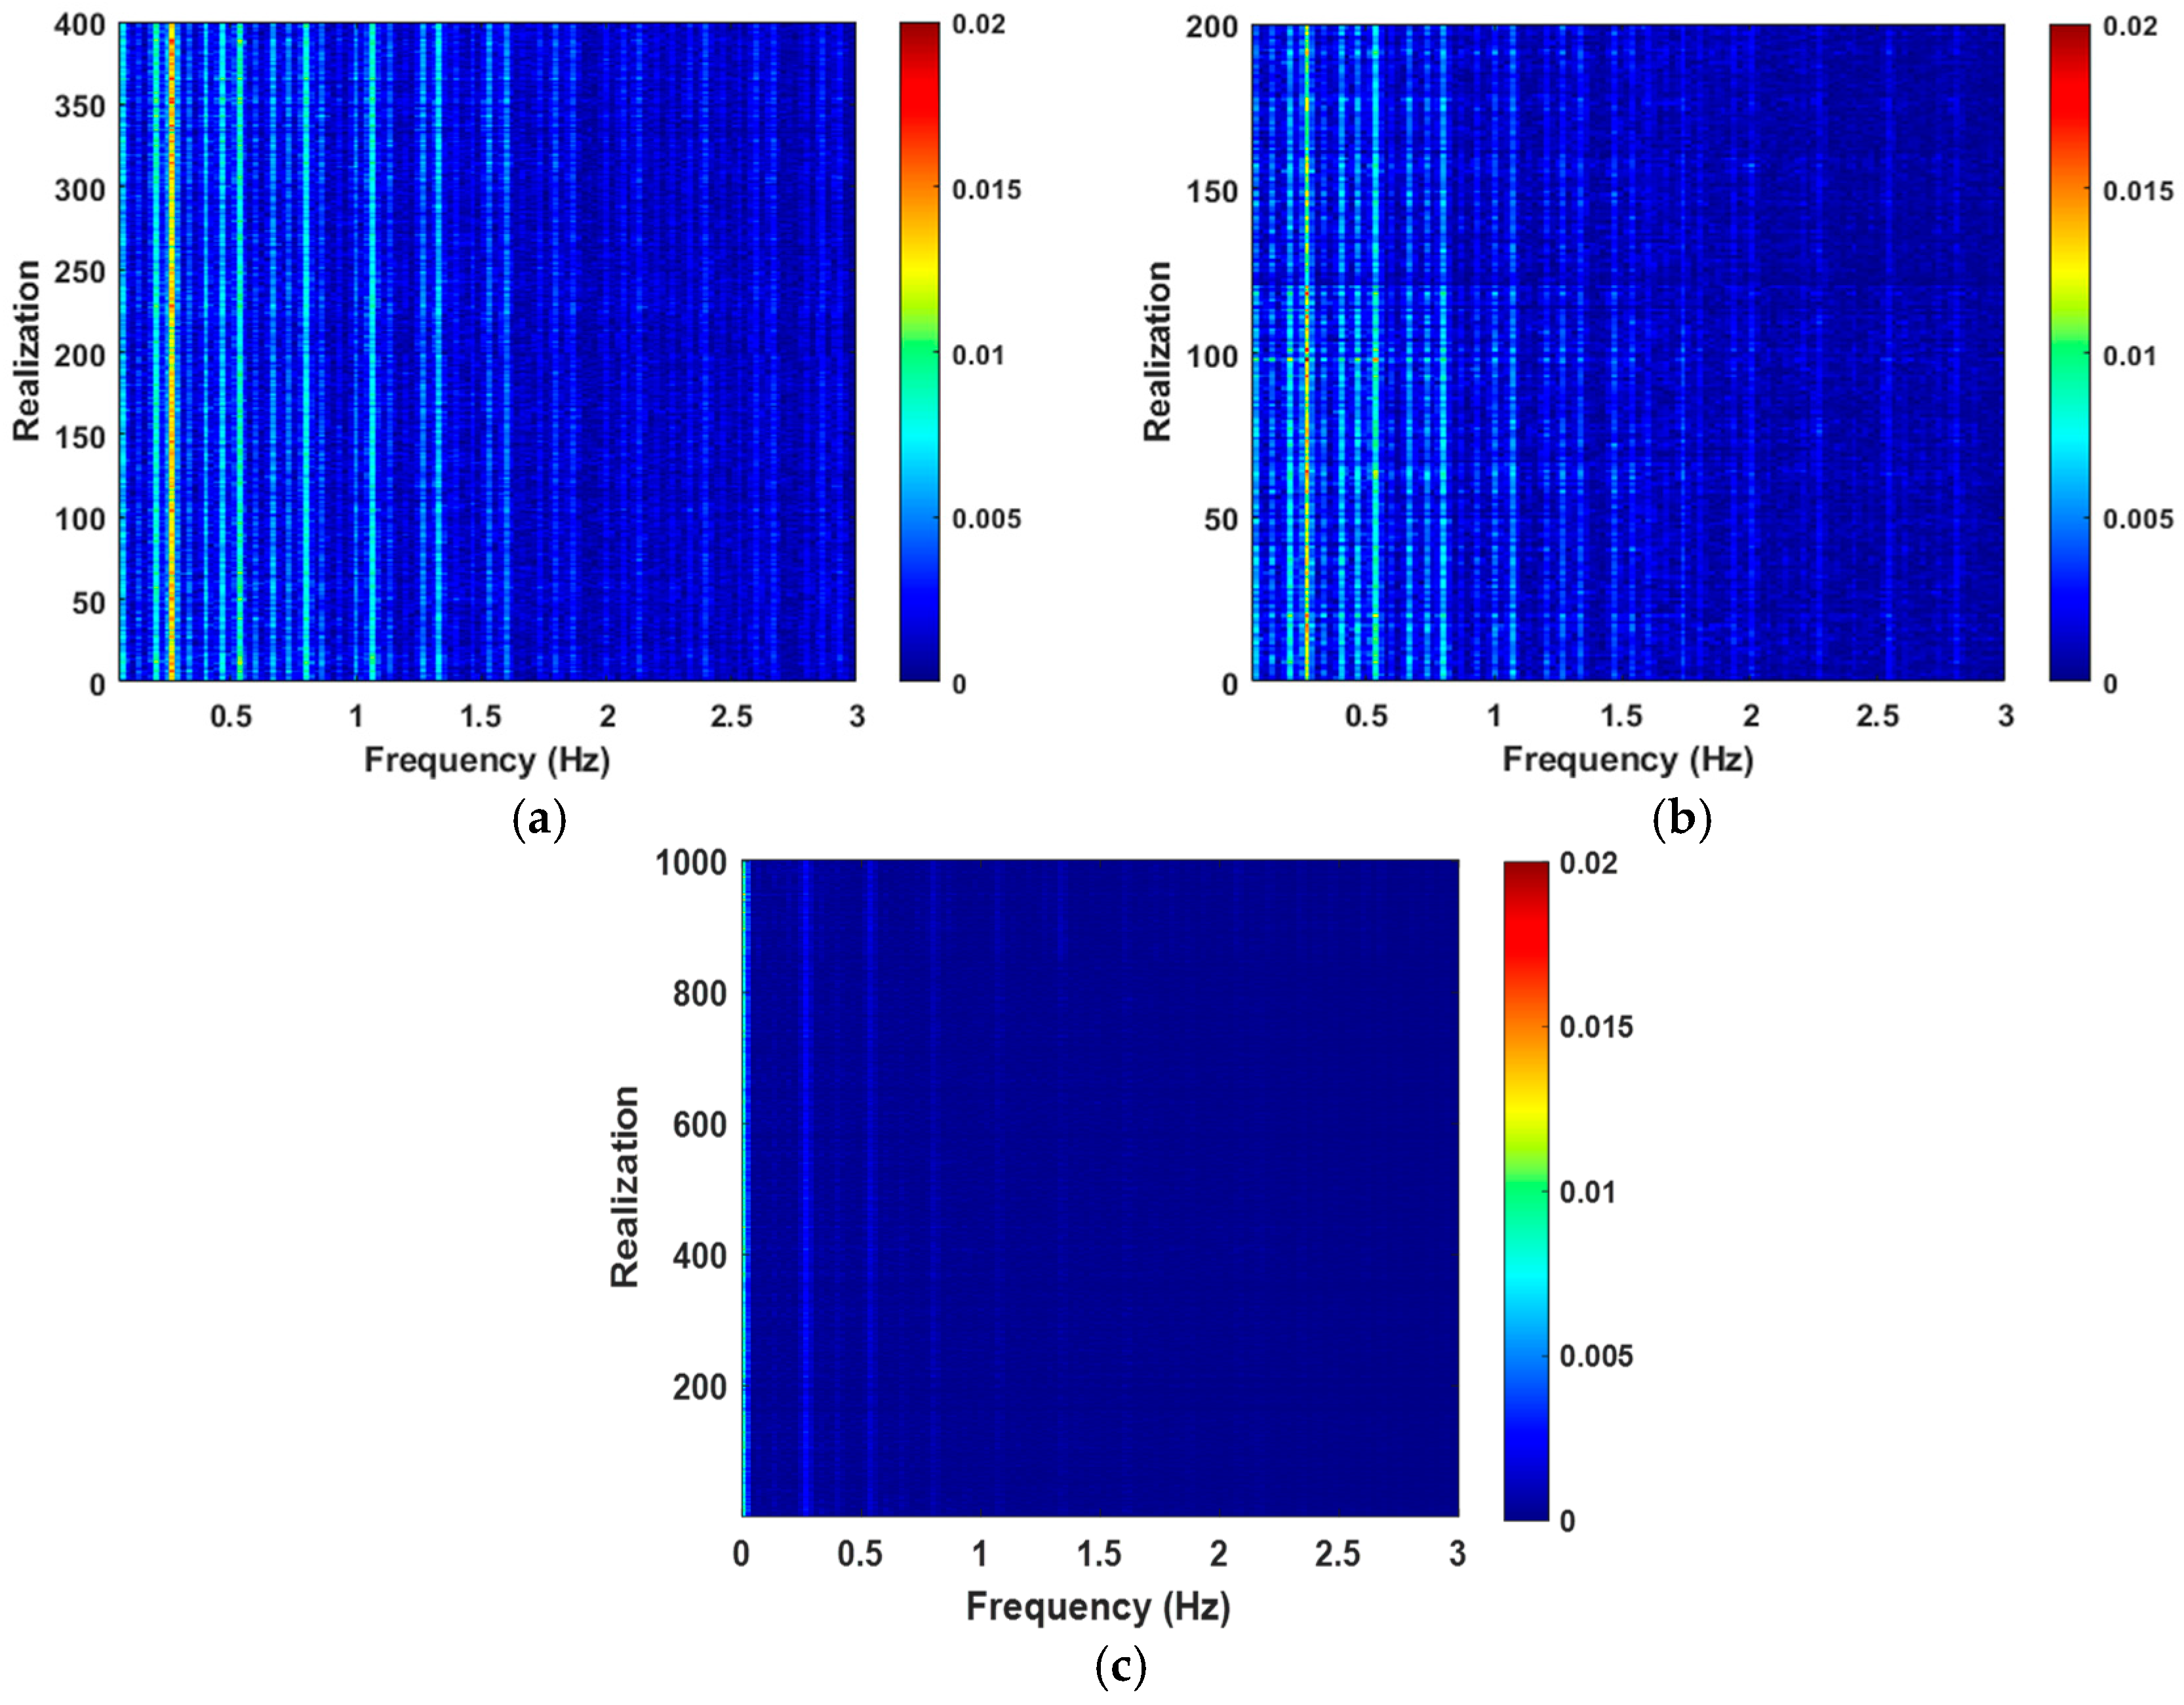
To enhance the transient components identified through the spectral kurtosis analysis, a Wiener filtering approach is employed to get the filtered signal of period 15 s (termed as Realisation). The filter window length is set to 0.16 s, corresponding to the estimated impact duration, while the regularisation parameter (ε) is fixed at 1 × 10⁻⁶ to maintain numerical stability during the inversion process. The envelope and the STFT of the filtered signal reveal dominant impact-related frequencies: f1 = 0.2675 Hz (1x); f2 = 0.5351 Hz (2x); f3 = 0.8026 Hz (3x).
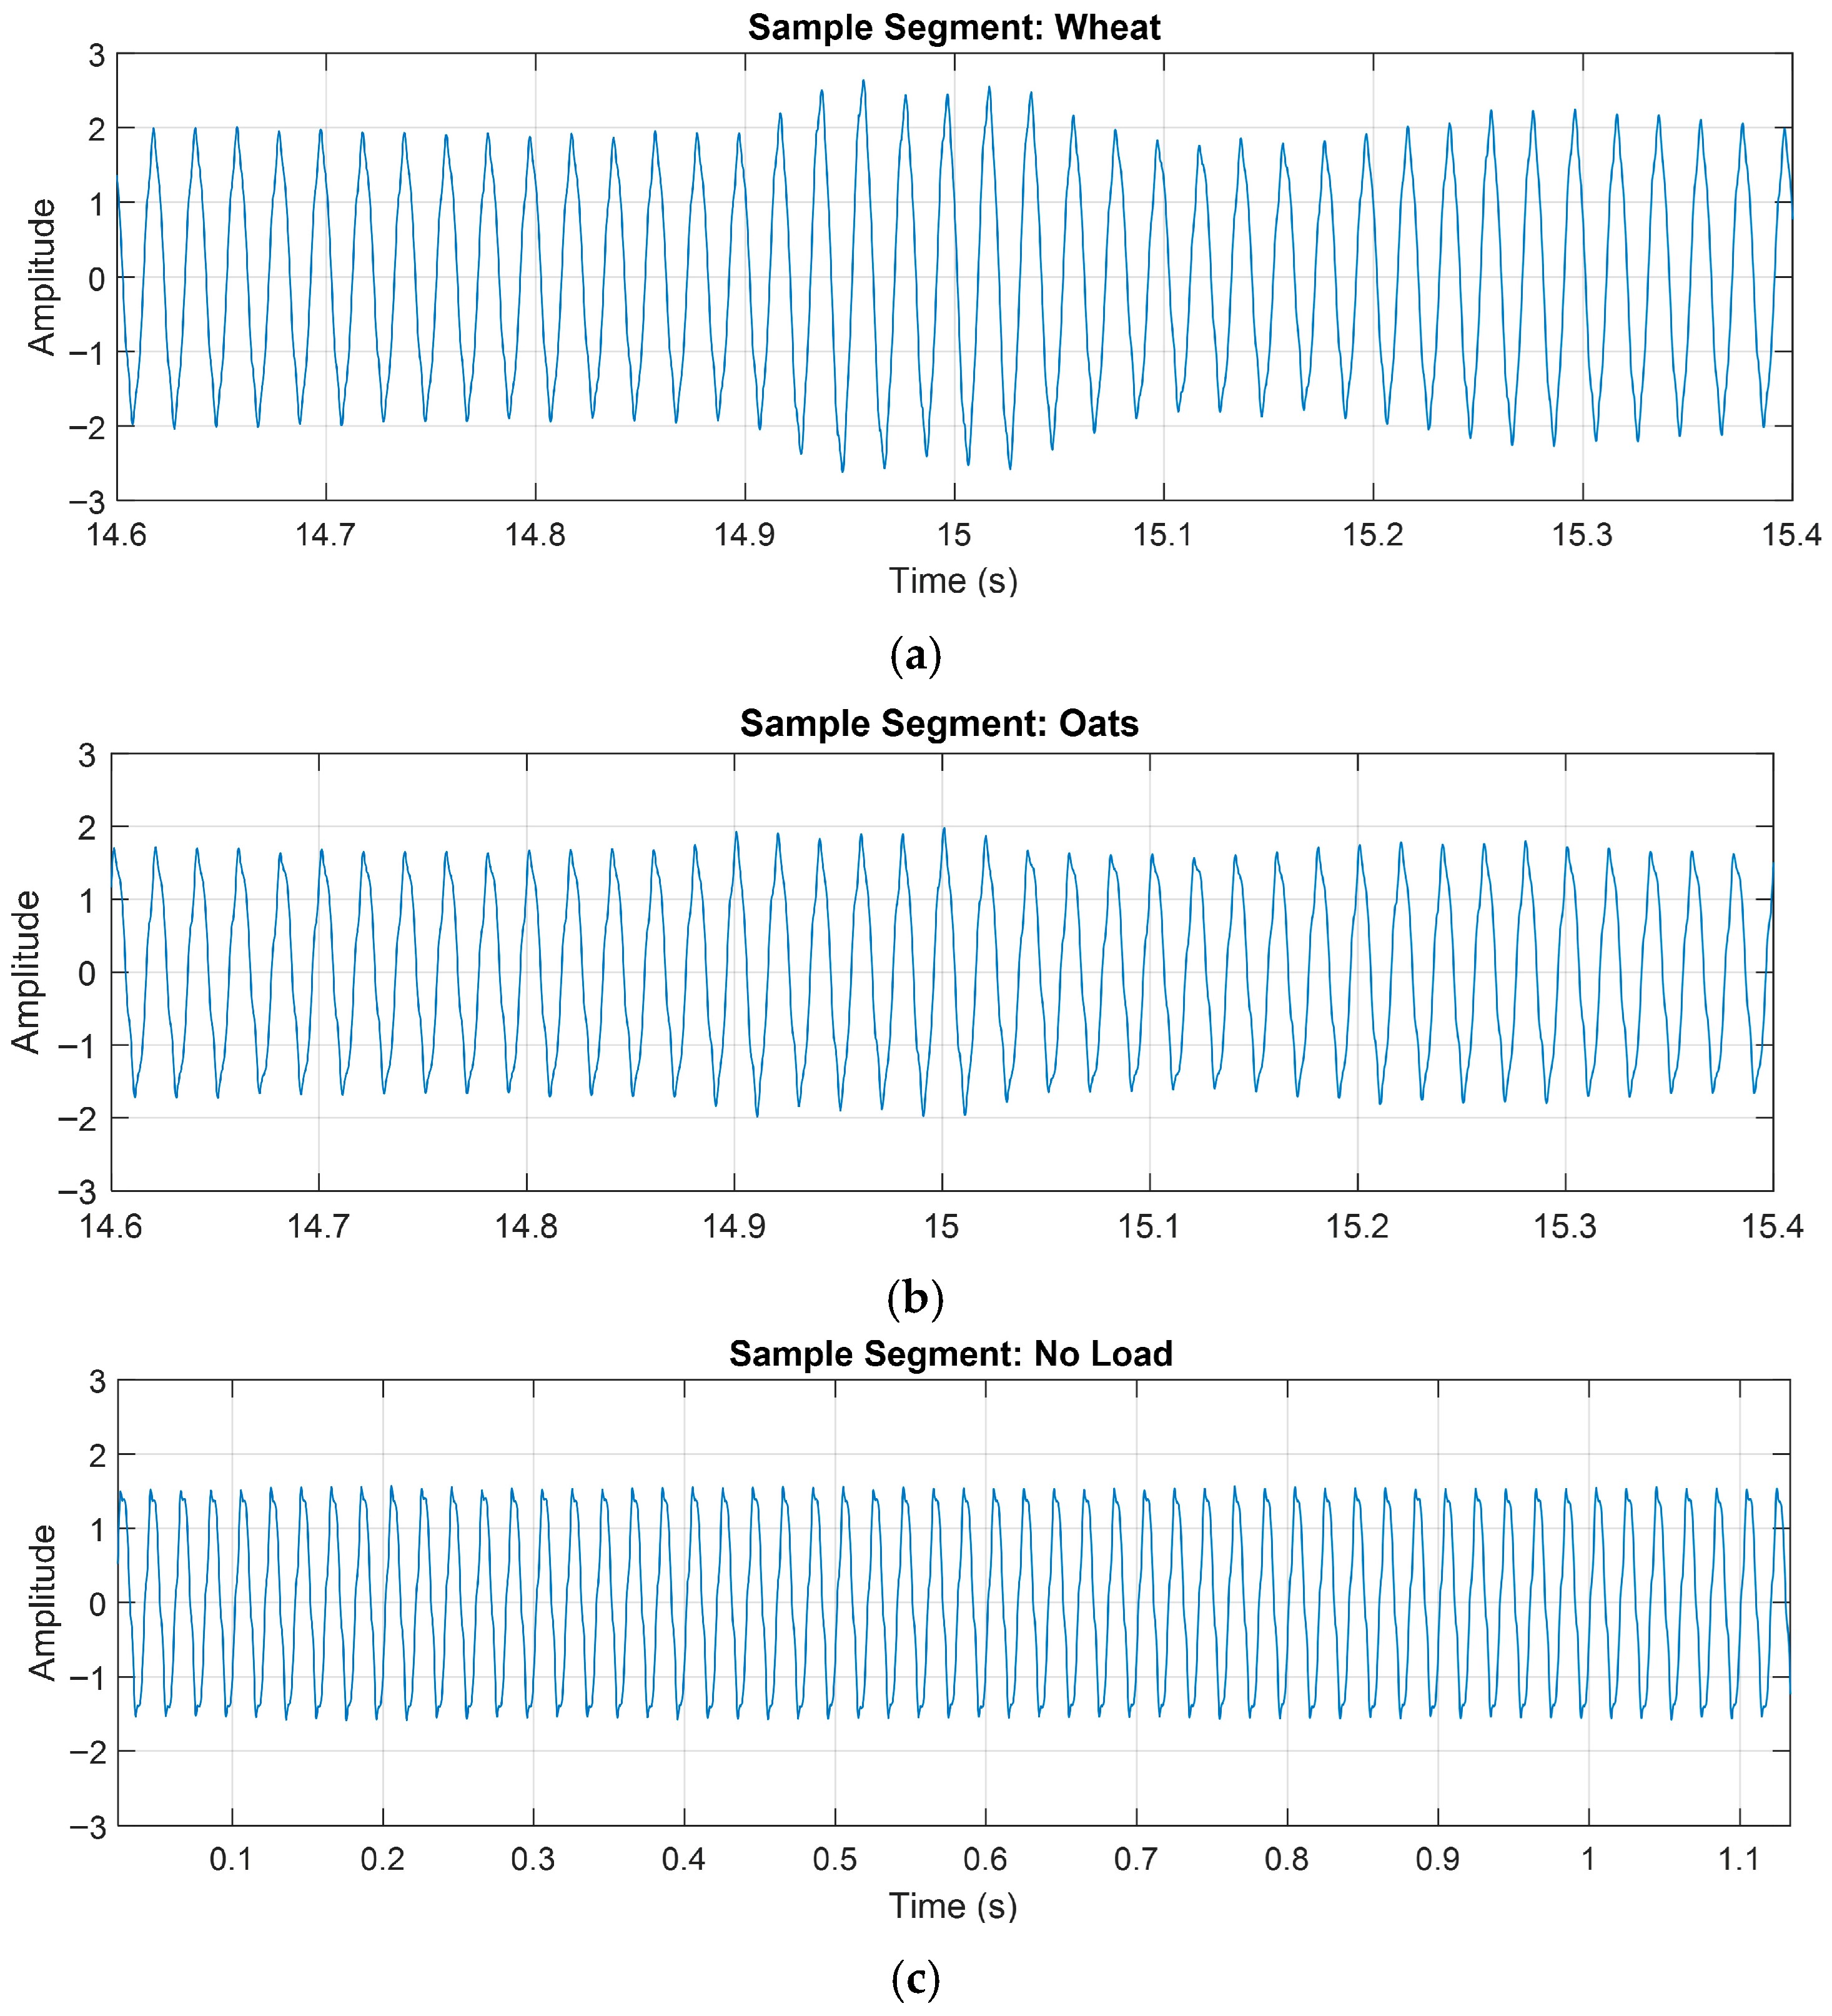
These impact-related frequency components are evident in the STFT plots (shown in Figure 5) for all three cases—the no load, the wheat loading, and the oat loading—as well as in the corresponding time-domain segments. The time-domain signals confirm the presence of transient spikes in all load conditions, with the amplitudes of these events increasing with the applied mechanical load. Time-domain segments of current signals for the wheat-loading, the oat-loading, and the no-load conditions are shown in Figure 6.
Comparative evaluation shows that the wheat and the oat loadings exhibit the most intense transients. This is clearly reflected in Figure 6a,b, while the no-load condition shows the weakest impact activity (Figure 6c). These findings are consistent across SK analysis, the STFT spectra, and time-domain observations.

4.2. Diagnostic Technology Results

4.2.1. The Cross Correlation of Spectral Moduli of Orders 3 and 4 (CCSM3, CCSM4)

The computation of Cross-Correlation of Spectral Moduli technology of order 3 is performed on the envelope of the filtered segments using unnormalised amplitudes [43,44] of harmonic triplet combinations of the impact frequency (0.2675 Hz): (1, 2, 3), (2, 3, 3), and (1, 3, 3). Similarly, for order 4, the analysis utilised quartets (1, 2, 3, 4), (1, 2, 4, 4), (1, 1, 2, 4), (1, 2, 2, 4), (1, 1, 2, 3), and (1, 2, 2, 3). These specific frequency combinations are selected to capture interaction effects among the first four harmonics, which are typically associated with system nonlinearity patterns [45]. The analysis is conducted using an external window length of 300 s and an internal window length of 30 s with 80% overlap to ensure reliable statistical estimation.
Figure 7 demonstrates that two harmonic frequency combinations for Cross-Correlation of Spectral Moduli technology of order 3 yield comparable diagnostic results for the wheat loading, with the combination (2, 3, 3) achieving the highest TPCD of 95%. The diagnostic results for the CCSM technology of order 4 are presented in Figure 8.
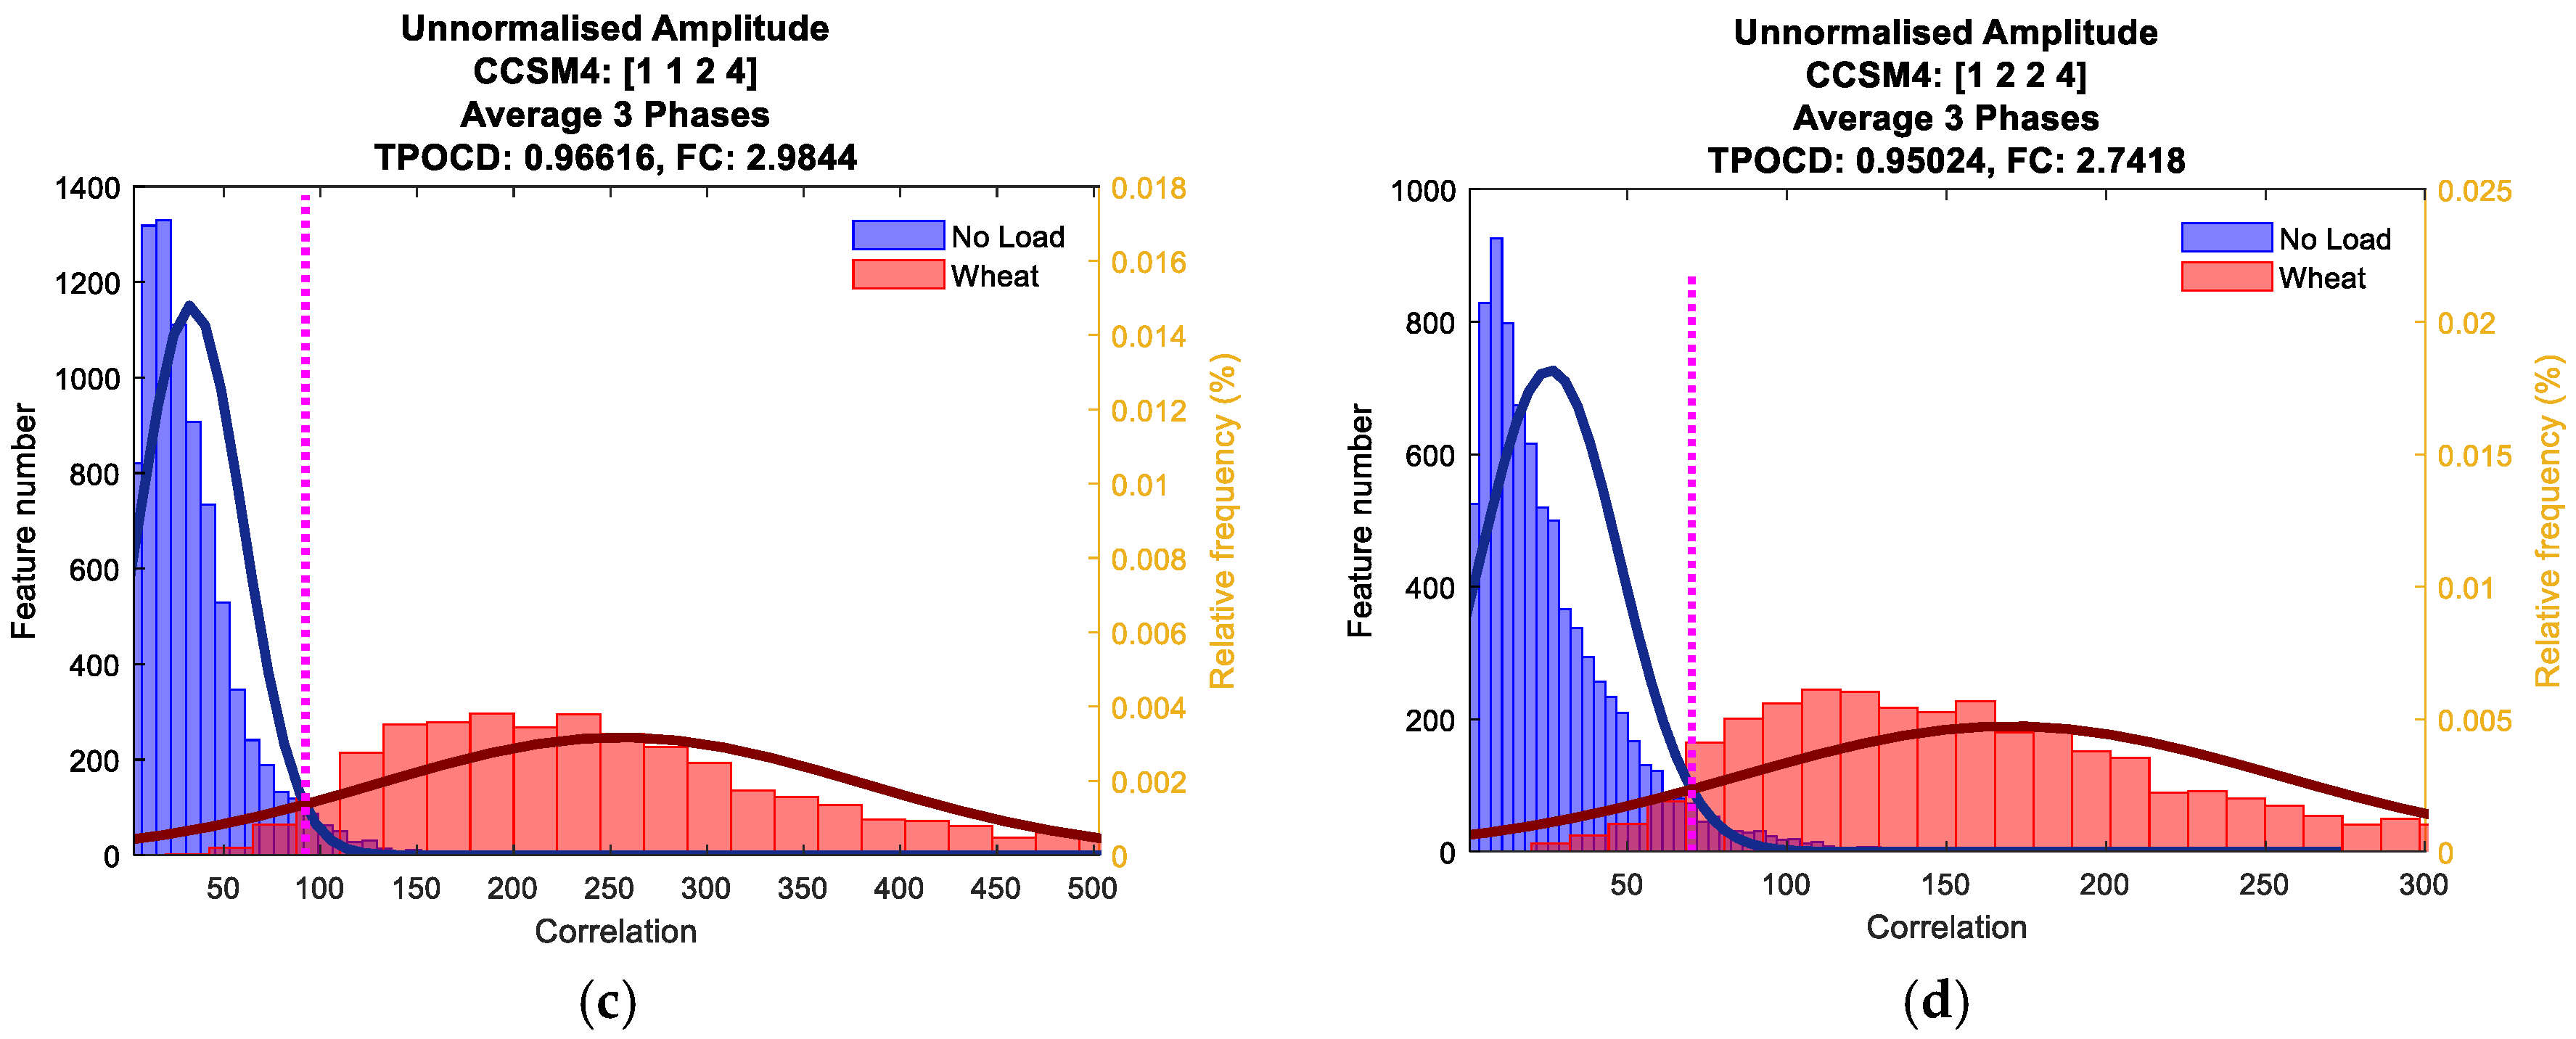
As observed from Figure 8, the Cross-Correlation of Spectral Moduli technology of order 4 demonstrates consistent diagnostic performance across all tested frequency combinations. Among these, the harmonic combination (1, 2, 3, 4) yields the highest total probability of correct diagnosis (TPCD), reaching 98%.
In comparison, oat loading shows comparatively low performance, with maximum TPCD values achieved only for specific harmonic combinations of (2, 3, 3) and (1, 2, 3, 4) at 79% and 83% respectively.
For the Cross-Correlation of Spectral Moduli technology to perform well, the technology relies on stable and well-defined harmonic correlations between the harmonic of the fundamental impact frequency (i.e., 0.2675 Hz) and higher harmonics (2x, 3x, 4x, etc.). This harmonic structure needs to be consistently present and stable across the signal’s time–frequency representation, so that the cross-correlation between spectral moduli remains high and statistically separable. Under lighter mechanical loads (oats), belt–motor engagement is more irregular, leading to greater variability in the amplitude of these harmonic components over time. Although the technology operates on the spectral moduli (and it is, therefore, phase-independent), inconsistent harmonic amplitudes across analysis segments reduce the cross-correlation that the CCSM technologies are designed to capture, making feature distributions for the healthy and the defective cases less separable.
The reduced effectiveness of this technology for the oat loading can be explained directly from the signal characteristics, revealed by the processing results. The envelope STFT and time-domain segments show that the oat loading produces harmonics similar to the wheat loading (at frequencies of 0.2675, 0.5351, and 0.8026 Hz), but, with lower amplitudes. As a result, the spectral moduli of these harmonics are degrading the averaged cross-harmonic correlations computed over the 300 s estimation window. This behaviour is visible in Figure 5 (i.e., weaker harmonics for the oat loading) and Figure 6, indicating that the diagnostic feature overlap increases for the oat loading. Quantitatively, only selected harmonic combinations achieve moderate separability for the oat loading for technologies—Cross-Correlation of Spectral Moduli of order 3 (2, 3, 3) ≈ 79% TPCD and for order 4 (1, 2, 3, 4) ≈ 83%—whereas the wheat loading maintains effective separation across combinations (CCSM4 (1, 2, 3, 4) achieves 98% of the TPCD. This reduced harmonic interaction for the oat load explains the lower cross-correlation values and the drop in diagnostic effectiveness by the Cross-Correlation of Spectral Moduli technologies. By contrast, feature distributions of the CSK technology are not dependent on harmonic stability, as it integrates impulsiveness over the full frequency range above a threshold. Transient spikes, related to belt looseness, contribute to the total sum of the CSK.
The diagnostic effectiveness of the CCSM technologies depends on the presence of stable harmonics, associated with repeated slip–reengagement events. Under very light loading conditions, these harmonics may become unstable, reducing the cross-harmonic correlations and, therefore, decreasing CCSM diagnostic performance.

4.2.2. The Consolidated Spectral Kurtosis (CSK) Technology

Under the no-load conditions, the Consolidated Spectral Kurtosis values are typically lower compared to those observed under the loading conditions, reflecting reduced impulsive behaviour in the signal. A threshold parameter is introduced to isolate spectral kurtosis components, that exceed a predefined significance level, thereby enhancing sensitivity to transient fault-related events.
The threshold used for the CSK technology is determined through the proposed threshold optimisation methodology below. The total probability of correct diagnosis (TPCD) is evaluated across a range of threshold values, and the optimal thresholds correspond to the maximum of the TPCD. The results show that the TPCD remains high and stable across a threshold range, indicating that the CSK technology provides an effective diagnosis.
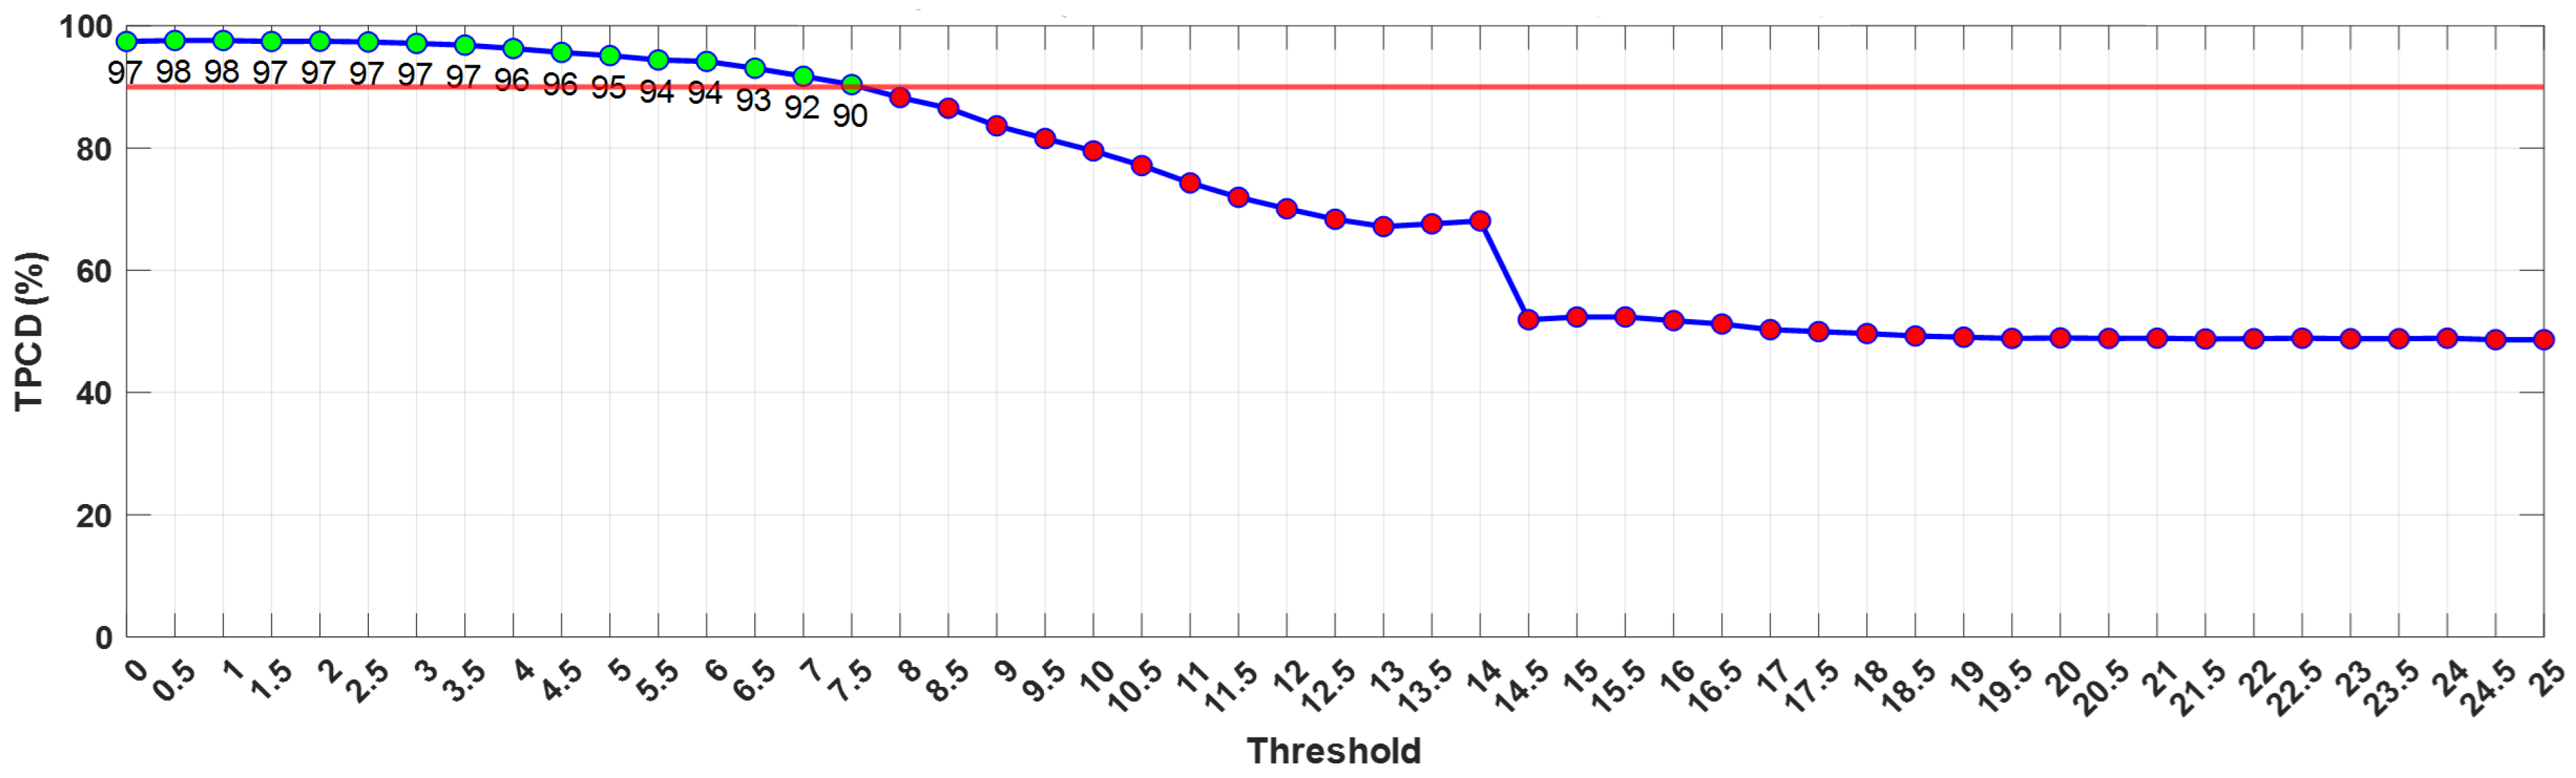
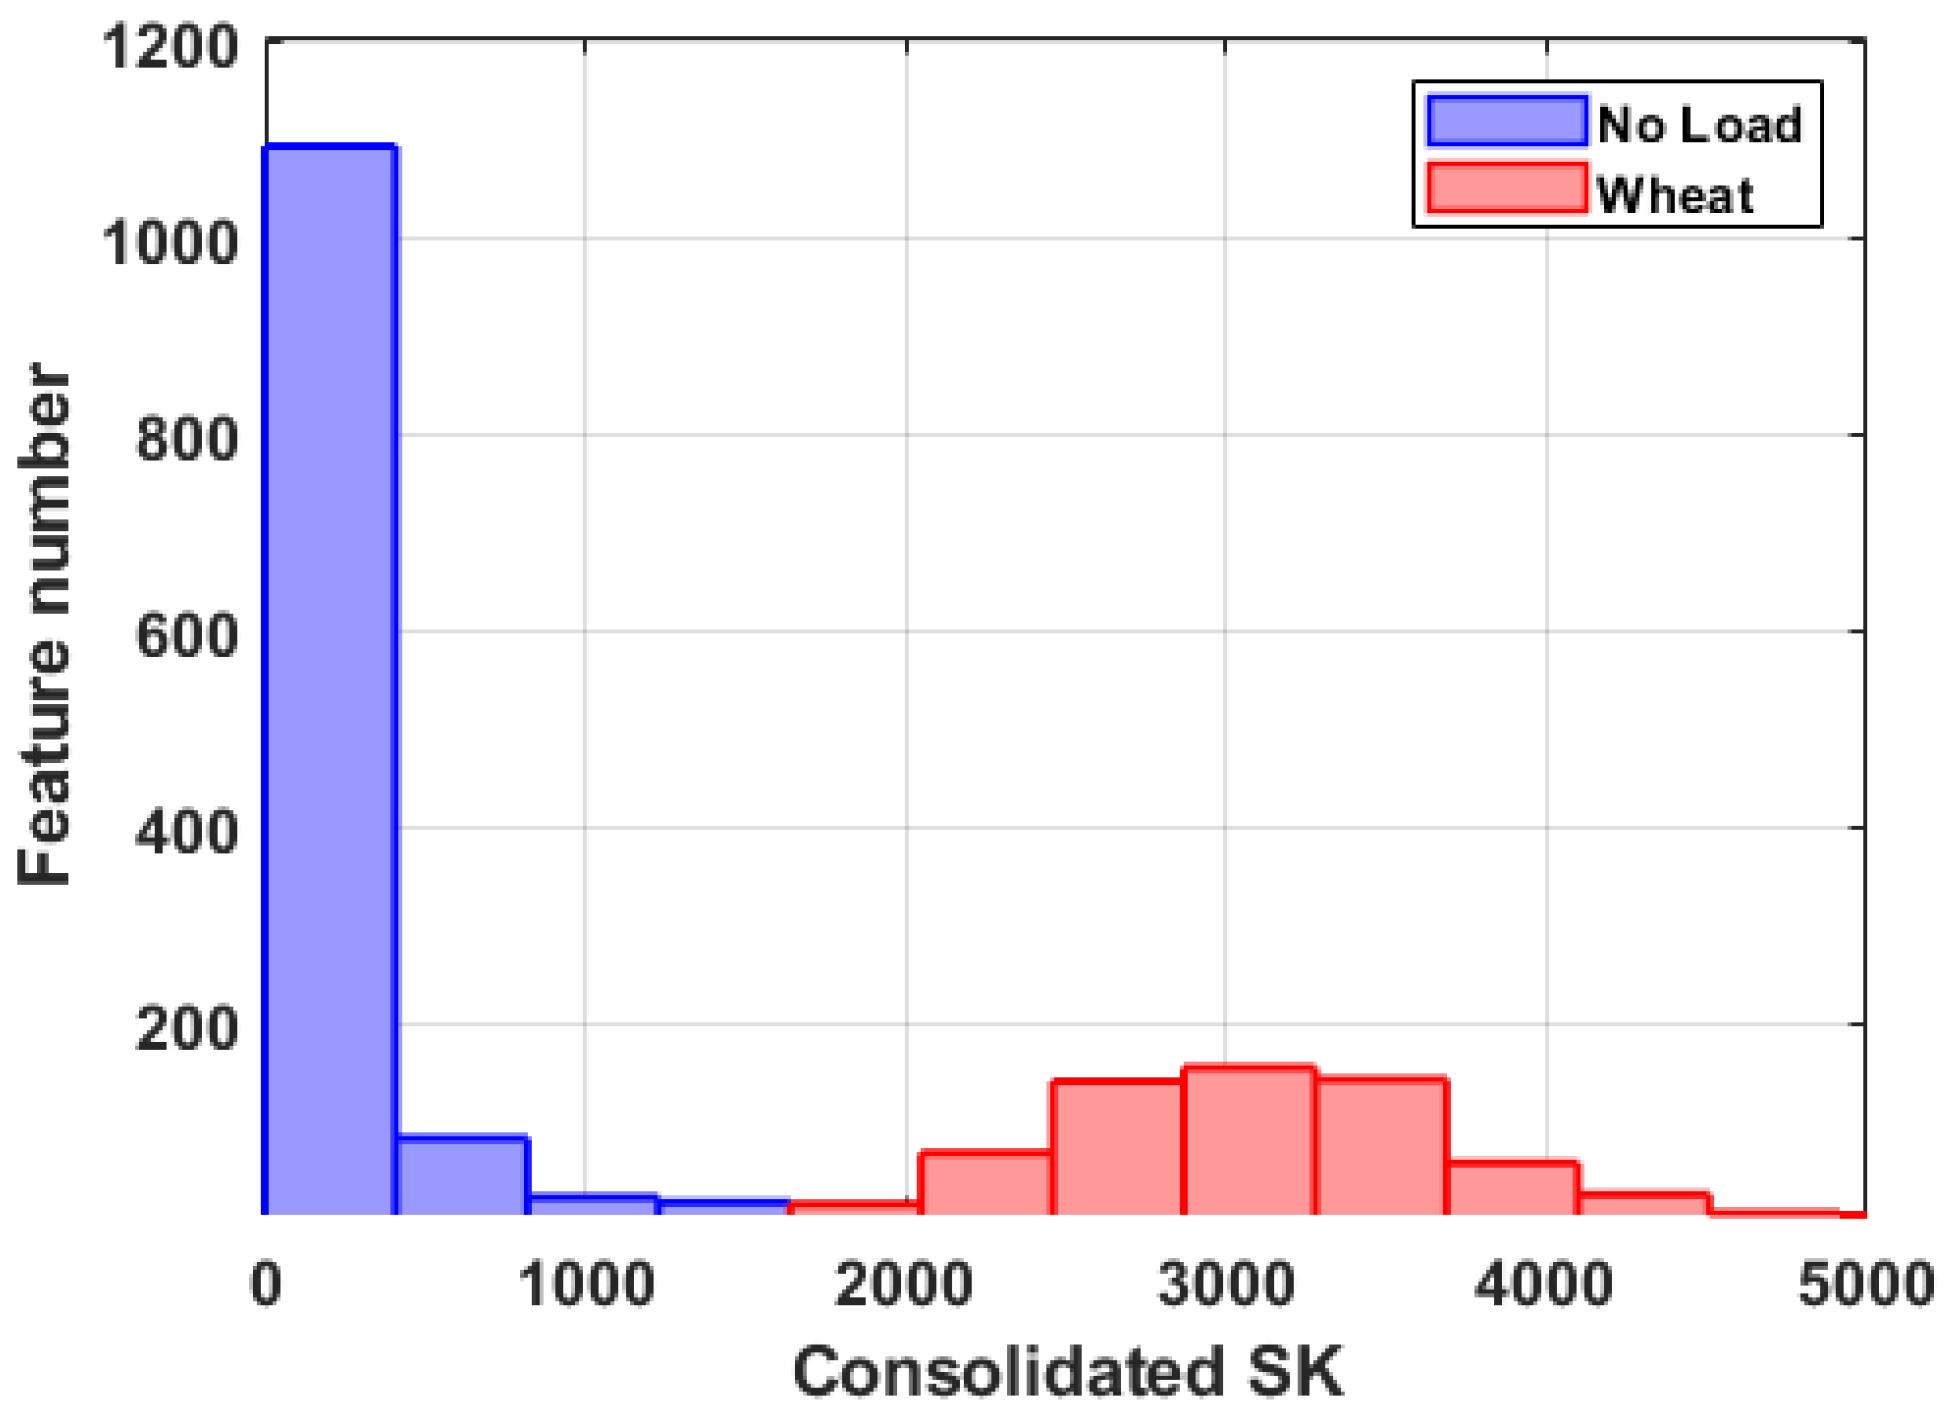
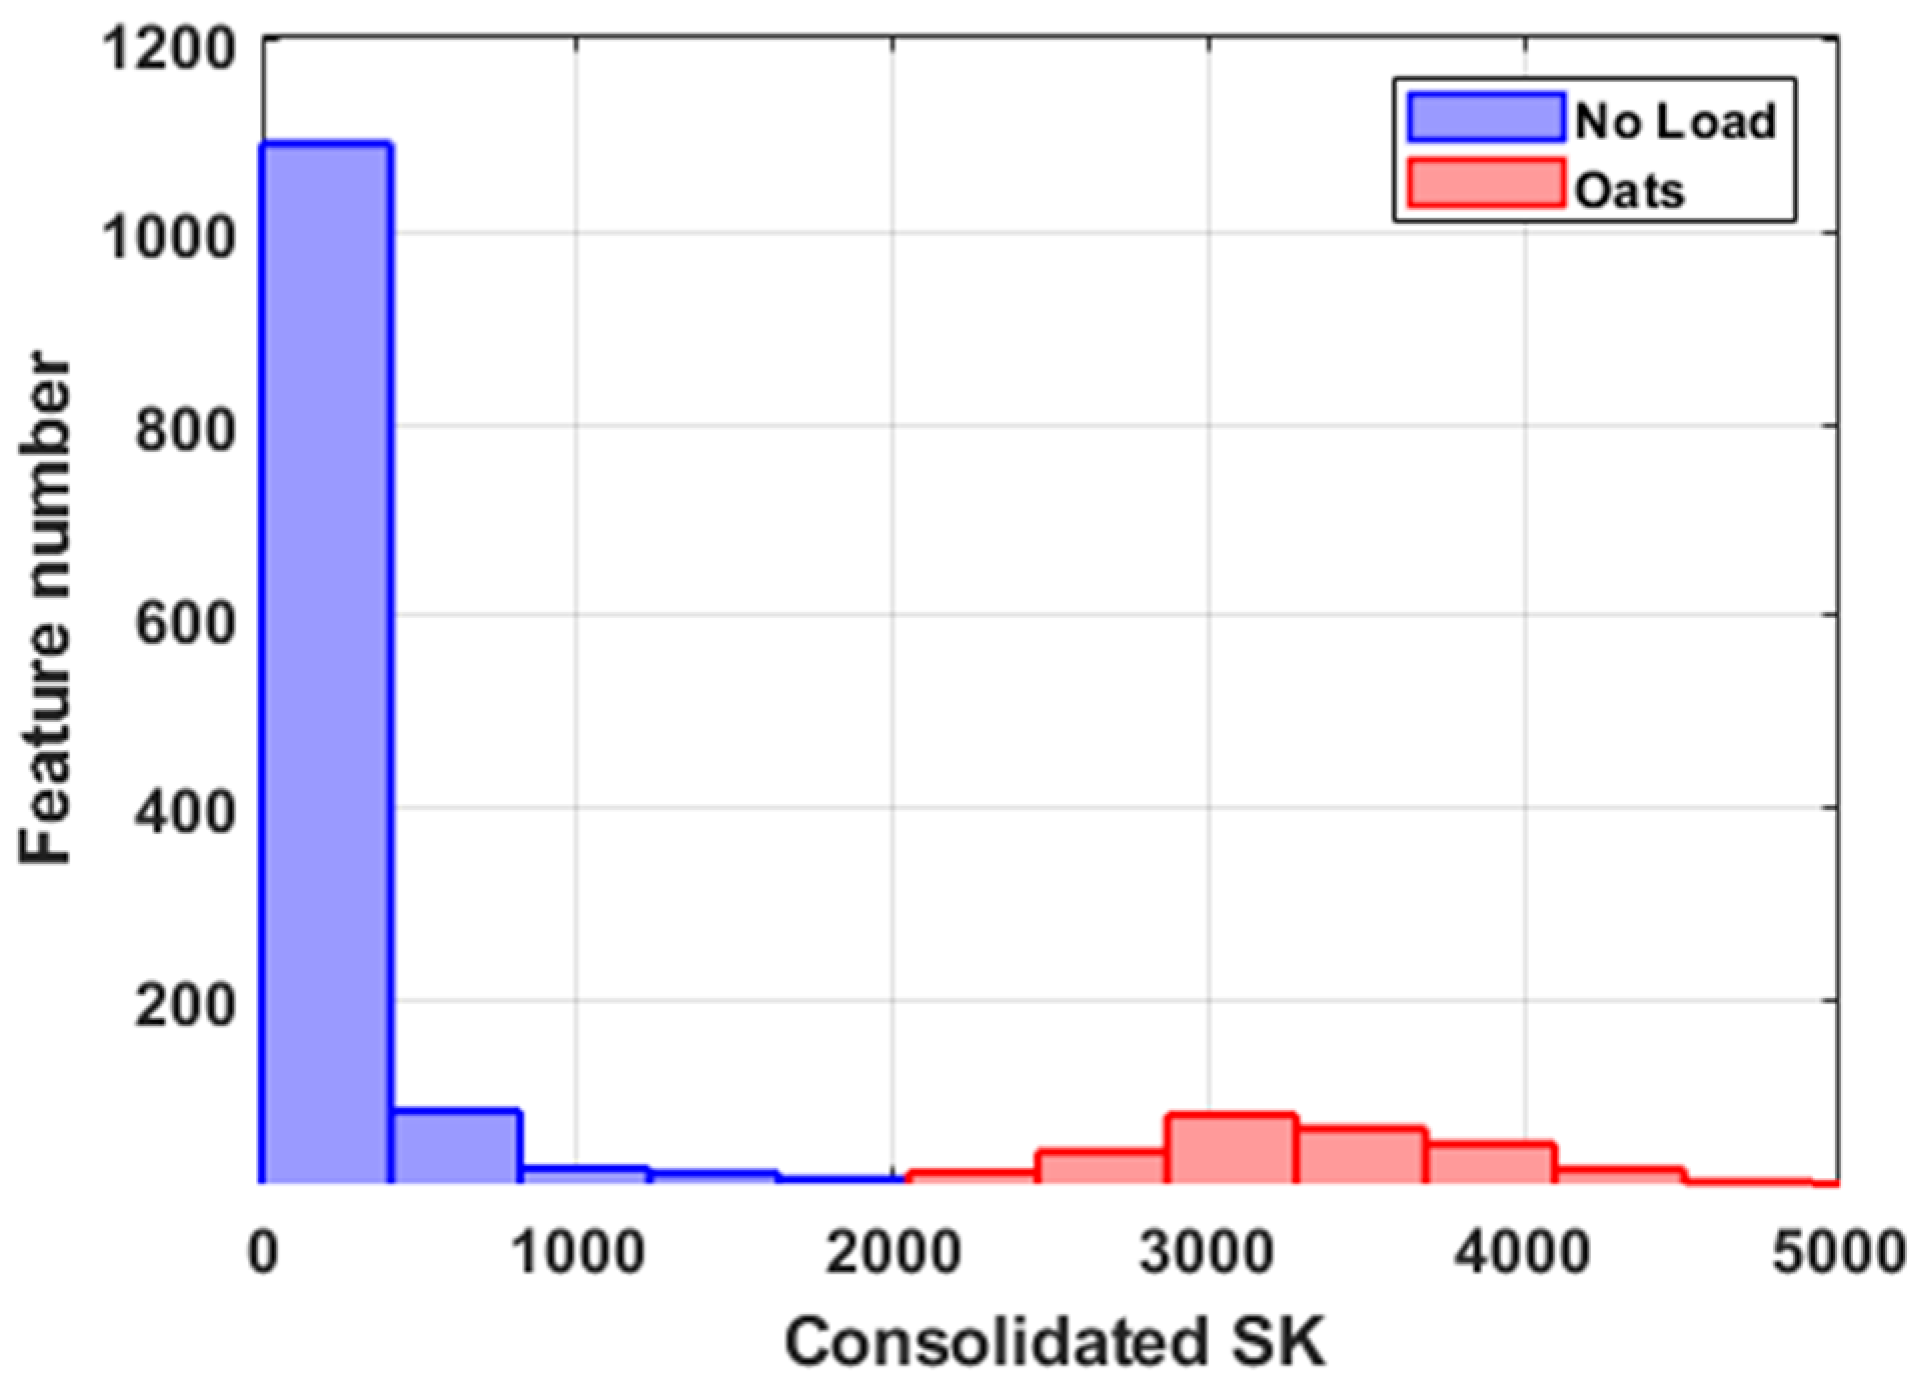
As the threshold increases, fewer components surpass this limit, resulting in a steady reduction in CSK values. For sufficiently high thresholds, the values under the no-load conditions approach zero, while those under the loading conditions also essentially reduce, making the CSK feature less separable. Consequently, employing a lower threshold enhances the separation capability between the no-load and the loaded conditions in terms of the total probability of correct diagnosis (TPCD). Figure 9 shows the TPCD of the Consolidated Spectral Kurtosis for the no-load condition and the wheat loading across a range of threshold values. It can be seen from the figure that the TPCD values fall below 90% at threshold values greater than 7.5, and the maximum TPCD value (98%) is obtained at thresholds of 0.5 and 1; histogram representations for the CSK feature for threshold 1 are shown in Figure 10.
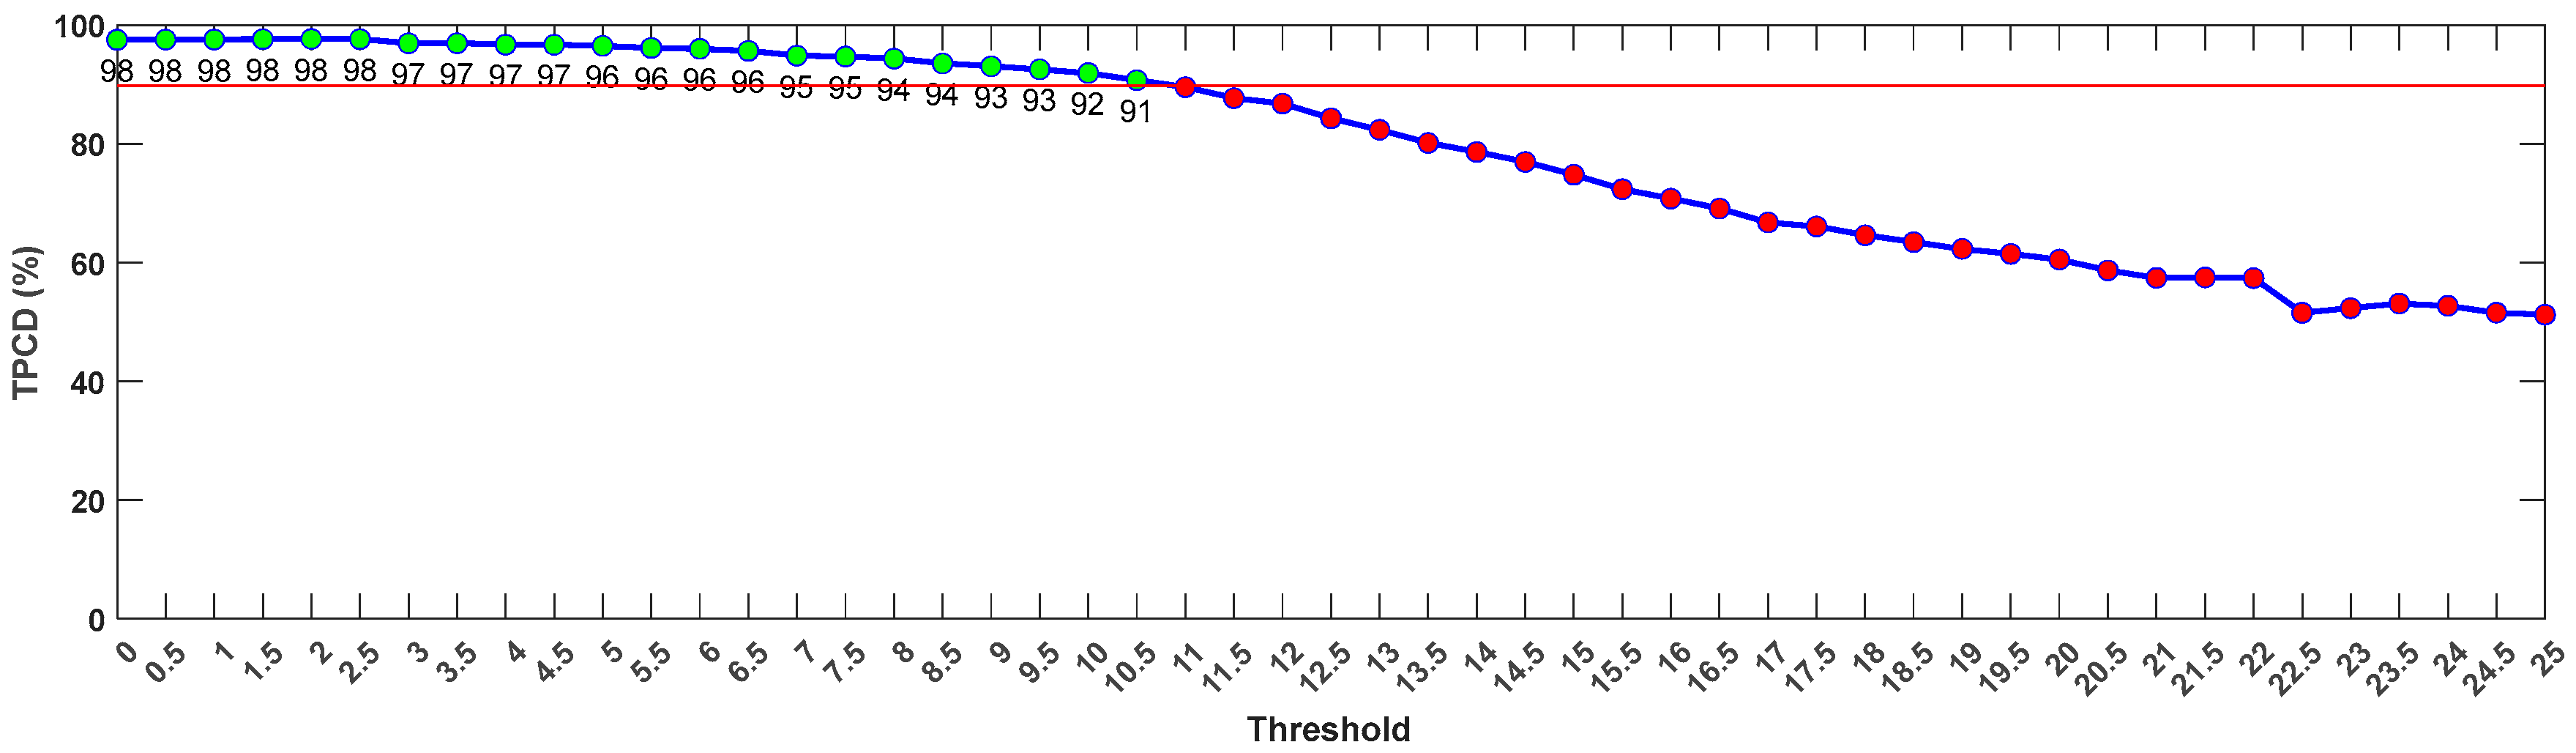
Figure 11 corresponds to the TPCD values obtained from the no-load condition and the load condition (oats) under different threshold values. The figure shows a similar dependency, which is explained in the wheat case.
It can be seen from Figure 11 that the TPCD values fall below 90% at threshold values of more than 11, and the maximum TPCD value (98%) is obtained in the range of [0–2.5]; histogram representations for the CSK feature for threshold 2 are shown in Figure 12.
The diagnostic effectiveness of the two proposed technologies—the Cross-Correlation of Spectral Moduli of order 4 and the CSK—is further evaluated by comparing the probabilities of incorrect diagnosis. As summarised in Table 1, the gain is quantified as the ratio of error probabilities between the two technologies. For the wheat loading, the Cross-Correlation of Spectral Moduli technology yielded the best incorrect diagnosis probability of 2.33%, compared to an incorrect diagnosis probability of 2.39%, observed in the case of the CSK technology, resulting in no gain: i.e., both technologies yield similar diagnosis results. For the oat loading, the CSK technology yielded an incorrect diagnosis probability of 2.34%, much lower than the best incorrect diagnosis probability of 16.6%, observed in the case of the Cross-Correlation of Spectral Moduli technology of order 4, resulting in a gain of 7.09.
The Consolidated Spectral Kurtosis (CSK) technology outperforms the Cross-Correlation of Spectral Moduli technology, due to its fundamental reliance on the consolidated values of the spectral kurtosis to capture impulsive transients across the entire frequency spectrum. The CSK technology quantifies overall impulsiveness by summing SK values exceeding a threshold, making it highly sensitive to irregular, low-amplitude spikes caused by intermittent belt–motor engagement. In contrast, the Cross-Correlation of Spectral Moduli technologies depend on a fault-related frequency band selection. As a result, the diagnostic effectiveness and the absence of a need for fault-related frequency band selection for the CSK technology ensure more effective fault diagnosis across varying load scenarios.
From a computational perspective, both diagnostic technologies share a common pre-processing stage involving spectral kurtosis estimation. However, the CSK technology performs a summation of threshold-exceeding spectral kurtosis values, resulting in computational complexity that grows linearly with the number of frequency bins. In contrast, the CCSM technologies require filtering based on the spectral kurtosis and higher-order cross-correlation computations among spectral components across multiple segments, which also increases computational cost and memory requirements. Therefore, while the CCSM technologies provide detailed nonlinear harmonic analysis, the CSK technology offers a computationally efficient alternative suitable for real-time monitoring applications. A detailed comparison has been presented in Table 2.

5. Conclusions

This study proposes, for the first time worldwide, the Consolidated Spectral Kurtosis (CSK) diagnostic technology for conveyor belt looseness, which manifests through short-duration spikes in motor current signals. The novel concept of the CSK technology lies in integrating statistically essential spectral kurtosis values across the entire frequency band.
This study also proposes, for the first time worldwide, Cross-Correlation of Spectral Moduli technology for conveyor belt looseness, based on the fundamental and the higher harmonics of spike frequency.
Unlike the Cross-Correlation of Spectral Moduli technology, which requires fault-related frequency band selection, the CSK technology captures weak transient spikes without prior knowledge of fault-related frequency bands. This makes the CSK technology particularly suited for conveyor/transportation systems, subject to variable and uncertain load profiles. Comparative analysis is performed between the proposed technologies via comprehensive experimental validations under different loading conditions.
Experiments are performed on a vertical grain conveyor, driven by a three-phase induction motor (NORD SK 180MP/4, 18.5 kW). Phase currents are measured with LEM ATO-B10 split-core sensors, anti-aliased by KEMO DR1600 filters, and digitised with a WebDAQ 504 at 25.6 kHz (24-bit). Data are collected in three operating states—the no load, the oat load, and the wheat load—to represent realistic load variations.
The experimental assessments reveal that the CSK technology demonstrates clear advantages compared to the Cross-Correlation of Spectral Moduli technology. For the wheat loading, the CCSM3 technology achieves 95% of the diagnostic performance of the TPCD. However, for the oat loading, the Cross-Correlation of Spectral Moduli of order 3 technology drops to 78.87% of the TPCD, whereas the CSK technology maintains an effective diagnosis performance of 97.6% of the TPCD for both loadings; i.e., the CSK technology remains load-independent. The corresponding error probabilities translate into a gain factor of 9.03 for the oat loading.
A similar pattern is observed against the Cross-Correlation of Spectral Moduli technology of order 4. For the wheat loadings, the CSK and the Cross-Correlation of Spectral Moduli technologies perform almost identically, with TPCDs of 98%. For the oat loading, the CCSM4 technology falls to 83.4% of the TPCD compared to CSK’s 97.66% of the TPCD. The corresponding gain factor of 7.09 demonstrates CSK’s better effectiveness in scenarios in which the Cross-Correlation of Spectral Moduli technology becomes less effective.
The experimental findings, consistent with the theoretical expectations, highlight that the CSK technology maintains accuracy and stability across varying thresholds and load conditions. This stands in contrast to the Cross-Correlation of Spectral Moduli-based technologies, whose performance remains sensitive to fault-related frequency band selection, harmonic selection, and loading variability.
According to the comprehensive evaluations, the proposed CSK technology emerges as a statistically grounded novel conceptualisation that closes a critical gap between advanced research techniques and reliable field deployment for a conveyor belt looseness diagnosis. By enabling accurate and effective diagnosis of a belt looseness directly from motor current signals, the technology offers a practical, industry-ready solution for predictive maintenance of belt conveyors across various industrial sectors: the mining industry, cement industry, steel manufacturing industry, airport baggage handling industry, etc.

6. Future Work

The scope for future research is to:
  • Prove the effectiveness of the proposed technologies for other motor current diagnostic applications, including other conveyor faults such as a belt misalignment, pulley defects, and rolling-element bearing faults.
  • Combine the proposed technologies by an optimal technology fusion.
  • Investigate the detailed mechanics of the belt–pulley interaction and contact phenomena in conveyor systems and integrate these insights with the proposed motor current diagnostic technologies.
  • Experimentally validate the proposed diagnostic technologies on other conveyor systems operating with different belt materials, operational speeds, and loading conditions.
  • Investigate real-time implementation of the proposed technologies for online monitoring of industrial conveyor systems.
  • Include controlled laboratory-based experiments to further investigate the physical mechanisms of slip–reengagement dynamics and to validate the performance of the CCSM and the CSK technologies under systematically varied operating conditions.

Author Contributions

Conceptualisation, L.G.; methodology, L.G.; software, D.M.; validation, L.G., D.M., and D.W.; investigation, L.G., D.M., and D.W.; resources, data curation, D.M.; writing—original draft preparation, D.M.; writing—review and editing, L.G. and D.W.; visualisation, D.M.; supervision, L.G. All authors have read and agreed to the published version of the manuscript.

Funding

This research received no external funding.

Institutional Review Board Statement

Not applicable.

Informed Consent Statement

Not applicable.

Data Availability Statement

Data are unavailable due to privacy restrictions.

Acknowledgments

The authors would like to acknowledge and thank the following people for their encouragement and kind support: Dan Brooks, Emma Green, and Martin Bullock from Advanced Machinery & Productivity Institute and SIPF.

Conflicts of Interest

Author Dean Wright was employed by the company Syscada Dynamic Engineering Limited. The remaining authors declare that the research was conducted in the absence of any commercial or financial relationships that could be construed as a potential conflict of interest.

Abbreviations

The following abbreviations are used in this manuscript:
AEAcoustic Emission
AIArtificial Intelligence
CCSMCross-Correlation of Spectral Moduli
CCSM3Cross-Correlation of Spectral Moduli of Order 3
CCSM4Cross-Correlation of Spectral Moduli of Order 4
CSKConsolidated Spectral Kurtosis
IEPEIntegrated Electronics Piezo-Electric
IoTInternet of Things
NDTNon-Destructive Testing
PDFProbability Density Function
SESquared Envelope
SKSpectral Kurtosis
STCFTShort-Time Chirp Fourier Transform
STFTShort-Time Fourier Transform
TPCDTotal Probability of Correct Diagnosis

References

  1. Bortnowski, P.; Kawalec, W.; Król, R.; Ozdoba, M. Types and causes of damage to the conveyor belt—Review, classification and mutual relations. Eng. Fail. Anal. 2022, 140, 106520. [Google Scholar] [CrossRef]
  2. Li, W.; Wang, Z.; Zhu, Z.; Zhou, G.; Chen, G. Design of online monitoring and fault diagnosis system for belt conveyors based on wavelet packet decomposition and support vector machine. Adv. Mech. Eng. 2013, 5, 797183. [Google Scholar] [CrossRef]
  3. Alharbi, F.; Luo, S.; Zhang, H.; Shaukat, K.; Yang, G.; Wheeler, C.A.; Chen, Z. A brief review of acoustic and vibration signal-based fault detection for belt conveyor idlers using machine learning models. Sensors 2023, 23, 1902. [Google Scholar] [CrossRef]
  4. Hou, Y.F.; Meng, Q.R. Dynamic characteristics of conveyor belts. J. China Univ. Min. Technol. 2008, 18, 629–633. [Google Scholar] [CrossRef]
  5. Bortnowski, P.; Gładysiewicz, L.; Król, R.; Ozdoba, M. Models of transverse vibration in conveyor belt—Investigation and analysis. Energies 2021, 14, 4153. [Google Scholar] [CrossRef]
  6. Mahmood, M.S.; Shareef, I.R. Applications of artificial intelligence for smart conveyor belt monitoring systems: A comprehensive review. J. Eur. Syst. Autom. 2024, 57, 1195. [Google Scholar] [CrossRef]
  7. Farhat, M.H. Novel fault diagnosis of a conveyor belt mis-tracking via motor current signature analysis. Sensors 2023, 23, 3652. [Google Scholar] [CrossRef]
  8. Andrejiova, M.; Grincova, A.; Marasova, D. Measurement and simulation of impact wear damage to industrial conveyor belts. Wear 2016, 368–369, 400–407. [Google Scholar] [CrossRef]
  9. Guo, X.; Liu, X.; Zhou, H.; Stanislawski, R.; Królczyk, G.; Li, Z. Belt tear detection for coal mining conveyors. Micromachines 2022, 13, 449. [Google Scholar] [CrossRef]
  10. Zeng, F.; Yan, C.; Wu, Q.; Wang, T. Dynamic behaviour of a conveyor belt considering non-uniform bulk material distribution for speed control. Appl. Sci. 2020, 10, 4436. [Google Scholar] [CrossRef]
  11. Abdullahi, A.O. Innovative conveyor belt monitoring via current signals. Electronics 2023, 12, 1804. [Google Scholar] [CrossRef]
  12. He, D.; Pang, Y.; Lodewijks, G.; Liu, X. Healthy speed control of belt conveyors on conveying bulk materials. Powder Technol. 2018, 327, 408–419. [Google Scholar] [CrossRef]
  13. Tupkar, R.; Kumar, D.; Sakhale, C.; Shelare, S. Optimizing belt tension and stretch dynamics: A modeling approach for medium-duty conveyor systems. Eng. Res. Express 2025, 7, 025413. [Google Scholar] [CrossRef]
  14. Zakharov, A.Y.; Erofeeva, N.V. Vibration of the belt and workflows of the conveyor. Vestn. Kuzbass State Tech. Univ. 2015, 112, 78–83. [Google Scholar]
  15. Rao, D.S. The Belt Conveyor: A Concise Basic Course, 3rd ed.; CRC Press: Boca Raton, FL, USA, 2020. [Google Scholar]
  16. Hills, P.W. Condition monitoring keeps conveyors conveying. In Proceedings of Beltcon 15, Johannesburg, South Africa, 2–3 September 2009; South African Institute of Materials Handling: Johannesburg, South Africa, 2009; pp. 2–3. [Google Scholar]
  17. Horihata, S.; Kitagawa, H.; Shirakawa, Y. Conveyor-belt diagnostic system using time-frequency analysis. In Advances in Manufacturing: Decision, Control and Information Technology; Springer: London, UK, 1999; pp. 123–132. [Google Scholar] [CrossRef]
  18. Patel, T.H. Novel technology based on the spectral kurtosis and wavelet transform for rolling bearing diagnosis. Int. J. Progn. Health Manag. 2013, 4, 1–8. [Google Scholar] [CrossRef]
  19. Gelman, L.; Patel, T.H. Novel intelligent data processing technology, based on nonstationary nonlinear wavelet bispectrum, for vibration fault diagnosis. IAENG Int. J. Comput. Sci. 2023, 50, 1–6. [Google Scholar]
  20. Dwyer, R. Detection of non-Gaussian signals by frequency domain kurtosis estimation. In Proceedings of the IEEE International Conference on Acoustics, Speech, and Signal Processing (ICASSP), Boston, MA, USA, 14–16 April 1983. [Google Scholar] [CrossRef]
  21. Nita, G.M. Spectral kurtosis statistics of transient signals. Mon. Not. R. Astron. Soc. 2016, 458, 2530–2540. [Google Scholar] [CrossRef]
  22. Murray, B. Vibration diagnostics of rolling bearings by novel nonlinear non-stationary wavelet bicoherence technology. Eng. Struct. 2014, 80, 514–520. [Google Scholar] [CrossRef]
  23. Combet, F.; Gelman, L. Optimal filtering of gear signals for early damage detection based on the spectral kurtosis. Mech. Syst. Signal Process. 2009, 23, 652–668. [Google Scholar] [CrossRef]
  24. Wang, Y.; Liang, M.; Xiang, J.; Wang, X. Spectral kurtosis for fault detection, diagnosis, and prognostics of rotating machines: A review with applications. Mech. Syst. Signal Process. 2016, 66–67, 679–698. [Google Scholar] [CrossRef]
  25. Wang, T.; Chu, F.; Han, Q. Compound faults detection in gearbox via meshing resonance and spectral kurtosis methods. J. Sound Vib. 2017, 392, 367–381. [Google Scholar] [CrossRef]
  26. Wang, Z.; Wang, J.; Du, W. A novel fault diagnosis method of gearbox based on maximum kurtosis spectral entropy deconvolution. IEEE Access 2019, 7, 29520–29532. [Google Scholar] [CrossRef]
  27. Wang, C.; Gan, M.; Zhu, X. Identification of planetary gearbox weak compound fault based on parallel dual-parameter optimized resonance sparse decomposition and improved MOMEDA. Measurement 2020, 165, 108079. [Google Scholar] [CrossRef]
  28. Kong, Y.; Chen, Z.; Zhang, X.; Hu, N. Fault feature extraction of planet gear in wind turbine gearbox based on spectral kurtosis and time wavelet energy spectrum. Front. Mech. Eng. 2017, 12, 406–419. [Google Scholar] [CrossRef]
  29. Liu, H.; Han, M.; Zhang, X. Adaptive spectral kurtosis filtering based on Morlet wavelet and its application for signal transients detection. Signal Process. 2014, 96, 118–124. [Google Scholar] [CrossRef]
  30. Rahmoune, C.; Benazzouz, D. Early detection of pitting failure in gears using a spectral kurtosis analysis. Mech. Ind. 2012, 13, 245–254. [Google Scholar] [CrossRef]
  31. Shanbr, S.; Ding, K.; Gu, F.; Ball, A. Detection of natural crack in wind turbine gearbox. Renew. Energy 2018, 118, 172–179. [Google Scholar] [CrossRef]
  32. Gelman, L.; Chandra, N.H.; Kurosz, R.; Pellicano, F.; Barbieri, M.; Zippo, A. Novel spectral kurtosis technology for adaptive vibration condition monitoring of multi-stage gearboxes. Insight Non-Destr. Test. Cond. Monit. 2016, 58, 409–416. [Google Scholar] [CrossRef]
  33. Gelman, L.; Persin, G. Novel fault diagnosis of bearings and gearboxes based on simultaneous processing of spectral kurtoses. Appl. Sci. 2022, 12, 9970. [Google Scholar] [CrossRef]
  34. Hashim, S.; Shakya, P. A spectral kurtosis-based blind deconvolution approach for spur gear fault diagnosis. ISA Trans. 2023, 142, 492–500. [Google Scholar] [CrossRef] [PubMed]
  35. Kolbe, S. Novel adaptation of the spectral kurtosis for vibration diagnosis of gearboxes in non-stationary conditions. Insight Non-Destr. Test. Cond. Monit. 2017, 59, 434–439. [Google Scholar] [CrossRef]
  36. Ciszewski, T. Current-based higher-order spectral covariance as a bearing diagnostic feature for induction motors. Insight Non-Destr. Test. Cond. Monit. 2016, 58, 431–434. [Google Scholar] [CrossRef]
  37. Gryllias, K.C. Local Damage Diagnosis in Gearboxes Using Novel Wavelet Technology. Insight Non-Destr. Test. Cond. Monit. 2010, 52, 437. [Google Scholar] [CrossRef]
  38. Gelman, L.; Ottley, M. New processing techniques for transient signals with non-linear variation of the instantaneous frequency in time. Mech. Syst. Signal Process. 2006, 20, 1254–1262. [Google Scholar] [CrossRef]
  39. Braun, S. The optimal usage of the Fourier transform for pattern recognition. Mech. Syst. Signal Process. 2001, 15, 641–645. [Google Scholar] [CrossRef]
  40. Gelman, L.; Kırlangıç, A.S. Novel vibration structural health monitoring technology for deep foundation piles by non-stationary higher order frequency response function. Struct. Control Health Monit. 2020, 27, e2526. [Google Scholar] [CrossRef]
  41. Ao, S.I.; Gelman, L.; Karimi, H.R.; Tiboni, M. Advances in Machine Learning for Sensing and Condition Monitoring. Appl. Sci. 2022, 12, 12392. [Google Scholar] [CrossRef]
  42. Zhao, D. Vibration health monitoring of rolling bearings under variable speed conditions by novel demodulation technique. Struct. Control Health Monit. 2021, 28, e2672. [Google Scholar] [CrossRef]
  43. Petrunin, I. Novel health monitoring technology for in-service diagnostics of intake separation in aircraft engines. Struct. Control Health Monit. 2020, 27, e2479. [Google Scholar] [CrossRef]
  44. Kripak, D.A. Condition Monitoring Diagnosis Methods of Helicopter Units. Mech. Syst. Signal Process. 2000, 14, 613–624. [Google Scholar] [CrossRef]
  45. Klepka, A. Triple correlation for detection of damage-related nonlinearities in composite structures. Nonlinear Dyn. 2015, 81, 453–468. [Google Scholar] [CrossRef][Green Version]
Figure 1. Methodology workflow.
Technologies 14 00214 g001
Figure 2. Experimental setup with three-phase induction motor and data acquisition panel.
Technologies 14 00214 g002
Figure 3. Schematic diagram of the data acquisition system.
Technologies 14 00214 g003
Figure 4. Spectral kurtosis map: (a) the wheat-loading, (b) the oat-loading, and (c) the no-load condition.
Technologies 14 00214 g004
Figure 5. Envelope STFT of the filtered signal: (a) the wheat-loading, (b) the oat-loading, and (c) the no-load conditions.
Technologies 14 00214 g005
Figure 6. Time-domain segments showing the transient events for (a) the wheat-loading, (b) the oat-loading, and (c) the no-load conditions.
Technologies 14 00214 g006
Figure 7. Diagnostic results for the Cross-Correlation of Spectral Moduli of order 3 for (a) harmonic combination of (1, 2, 3) and (b) harmonic combination of (2, 3, 3).
Technologies 14 00214 g007
Figure 8. Diagnostic results for the Cross-Correlation of Spectral Moduli of order 4 for harmonic combinations (a) (1, 2, 3, 4), (b) (1, 2, 4, 4), (c) (1, 1, 2, 4), and (d) (1, 2, 2, 4).
Technologies 14 00214 g008aTechnologies 14 00214 g008b
Figure 9. The TPCD for the Consolidated Spectral Kurtosis for the no-load condition and the wheat loading.
Technologies 14 00214 g009
Figure 10. Histograms for the Consolidated SK feature for threshold 1.
Technologies 14 00214 g010
Figure 11. The TPCD for the Consolidated Spectral Kurtosis for the no-load condition and the oat loading.
Technologies 14 00214 g011
Figure 12. Histograms for the Consolidated SK feature for threshold 2.
Technologies 14 00214 g012
Table 1. Comparison of the CCSM and the CSK technologies.
The Total Probabilities of Incorrect Diagnosis
The Wheat LoadingThe Oat Loading
CCSM3 (2, 3, 3)CSKGainCCSM3 (2, 3, 3)CSKGain
5%2.39%2.0921.13%2.34%9.03
CCSM4 (1, 2, 3, 4)CSKGainCCSM4 (1, 2, 3, 4)CSKGain
2.33%2.39%-16.6%2.34%7.09
Table 2. Comparison of computational efficiency of the CCSM and the CSK technologies.
CriterionCSKCCSMComputational Load/Effectiveness
Pre-ProcessingSK STCFT + SKCCSM is heavier
Post-SK ProcessingThresholding + SK summationSK filtering + enveloping + harmonic selection + cross-correlationsCCSM is heavier
Dimensionality After Post-ProcessingSingle CSK scalarMulti-frequency CCSM vector CCSM is heavier
Computational GrowthLinear with frequency binsLinear with frequency bins × segmentsCCSM is heavier
Scalability (Large-Scale Monitoring)High (lightweight post-SK stage)Moderate (heavy post-SK stage)CSK is more scalable
Real-Time FeasibilityShorter post-SK processing chainAdditional higher-order correlation stage increases latencyCSK is more time-efficient
Online Implementation PlatformSuitable for standard industrial monitoring platformsMore suitable for high-performance computing platformsCSK is easy for an online implementation
Disclaimer/Publisher’s Note: The statements, opinions and data contained in all publications are solely those of the individual author(s) and contributor(s) and not of MDPI and/or the editor(s). MDPI and/or the editor(s) disclaim responsibility for any injury to people or property resulting from any ideas, methods, instructions or products referred to in the content.