Review

From Sensing to Transforming: An AI-Enabled Capability Framework for Circular Construction and Demolition Waste Management


1
Department of Management Sciences, Abbottabad University of Science & Technology (AUST), Abbottabad 22500, Pakistan
2
Malaysian Institute of Industrial Technology (UniKL MITEC), Universiti Kuala Lumpur, Persiaran Sinaran Ilmu, Bandar Seri Alam, Masai 81750, Johor, Malaysia
3
Strategic Research Institute (SRI), Asia Pacific University of Technology and Innovation (APU), Technology Park Malaysia, Kuala Lumpur 57000, Malaysia
4
UniKL Business School, Universiti Kuala Lumpur, Kuala Lumpur 57000, Malaysia
*
Author to whom correspondence should be addressed.
Technologies 2026, 14(10), 659; https://doi.org/10.3390/technologies14100659
Submission received: 2 September 2026 / Revised: 29 September 2026 / Accepted: 8 October 2026 / Published: 12 October 2026

Abstract

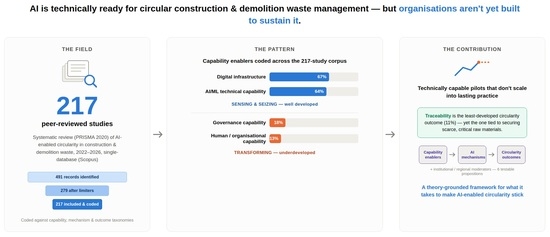
Artificial intelligence (AI) and AI-enabled digital technologies are increasingly proposed as enablers of circularity in construction and demolition (C&D) waste management, yet existing reviews are organised around technology and lifecycle stage and rarely examine the organisational conditions under which technically capable applications move from pilot to sustained practice. This review addresses that gap through a PRISMA 2020-guided systematic review of 217 recent Scopus records (2022–2026), interpreted through dynamic capabilities theory, diffusion of innovation theory, and the circular economy value-retention hierarchy. Abstract-level coding of capability enablers, AI mechanism clusters, and circularity outcomes is triangulated with latent Dirichlet allocation topic modelling, bibliographic coupling, co-citation and keyword co-occurrence analyses, and statistical tests of association. The central finding concerns where research attention has concentrated: digital infrastructure and AI/machine learning technical capability appear in 64–67% of studies, whereas governance and human/organisational capability appear in only 13–18%, and traceability/material security is the least-examined outcome (11.1%). These patterns describe the published literature rather than organisational practice. They are integrated into a four-layer framework that separates observed associations from theoretical inferences, and into six propositions for organisational-level testing. Substantive policy instruments appear in only 4.1% of studies, so the policy implications are presented as exploratory.

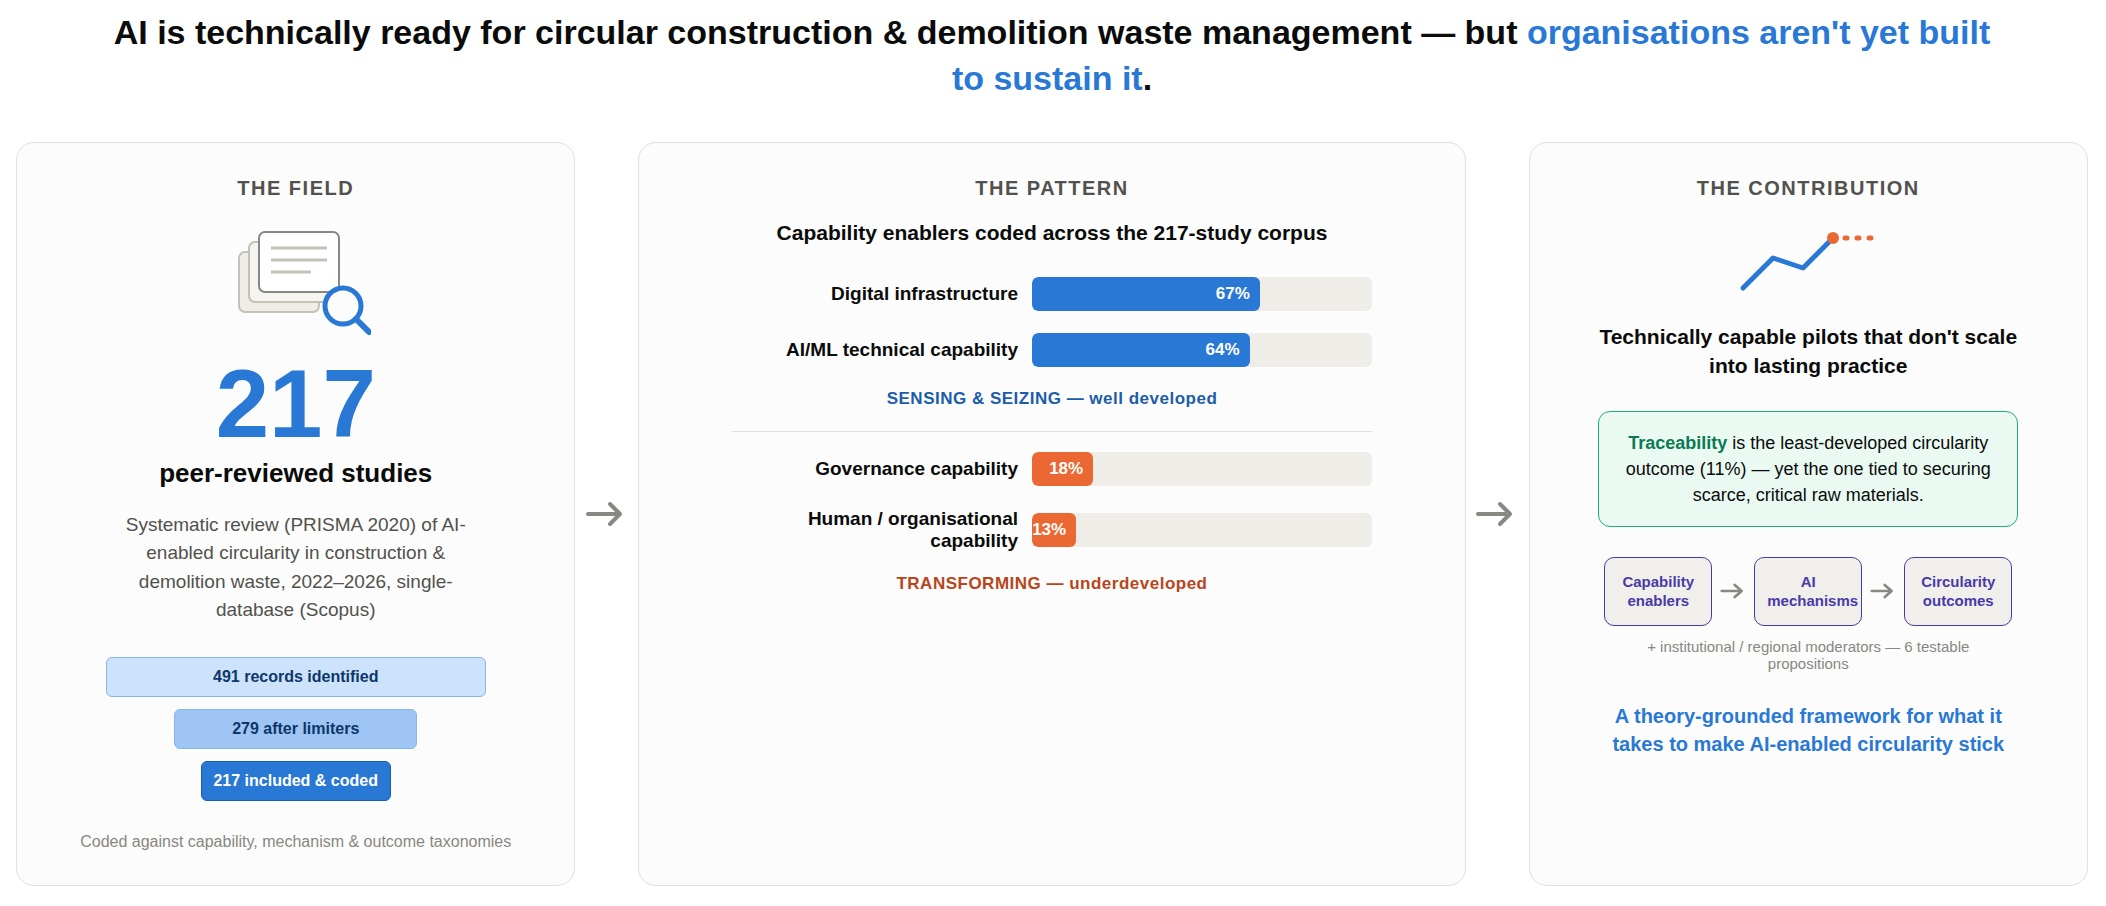
Graphical Abstract

1. Introduction

Construction and demolition (C&D) waste is the largest waste stream by mass in most industrialised economies, and demolition and redevelopment cycles are accelerating rather than easing its trajectory [1]. The built environment sector’s exposure runs in two directions at once: it is a major source of embodied and operational emissions, and its material stock is a large, under-exploited reserve of recoverable resources whose recovery is central to decoupling construction growth from virgin-material extraction [2,3]. Artificial intelligence (AI) has moved from a peripheral research interest to a central enabler proposed for closing this loop. Forecasting models anticipate demolition waste volumes before a building comes down [4], computer vision and deep learning classifiers sort mixed waste streams into recoverable material fractions [5,6,7], building information modelling (BIM) and digital twin platforms track material flows across the building lifecycle [8,9], and blockchain-based ledgers are beginning to certify material provenance for cross-jurisdictional reuse [10,11].
The literature has grown quickly enough to support its own reviews. Gao et al. [12] reviewed 98 articles (2012–2023) on machine learning across the stages of C&D waste management, Dodampegama et al. [13] analysed 132 papers on AI- and robotics-based sorting, Zhang et al. [14] traced the field’s contribution to the Sustainable Development Goals, and Oluleye et al. [15] reviewed 30 studies on AI for circularity across the building lifecycle. Adjacent reviews cover circular economy strategies in construction supply chains [16], digital technologies for circular construction [17], and AI and circular economy research across sectors [18]. These reviews map what has been tried and where, but none sets out to explain why an AI application that improves material recovery in one organisation fails to diffuse in a similar one: they are organised around technology, lifecycle stage, or process rather than the organisational conditions that turn a demonstrated technical capability into an adopted one.
This gap matters theoretically as well as practically. Where prior work explains adoption, it tends to list enablers and barriers [15,17] rather than connect them to an explanatory mechanism. Individual-level technology acceptance models explain a user’s intention to adopt a tool, not how an organisation builds and reconfigures the routines needed to keep using it. Dynamic capabilities theory [19,20] addresses that organisational question by distinguishing the sensing, seizing, and transforming capacities needed to convert a new technology into sustained practice, and it has been applied to digital transformation [21] and to digitally enabled circular economy practices [22]. Diffusion of innovation theory [23] complements it by explaining why adoption varies across organisations and institutional contexts, the “succeeds here, stalls there” pattern that existing reviews document without theorising. Together with a circular economy conceptualisation of value retention [24], these theories allow the corpus to be organised into an explanatory rather than a descriptive structure.
This study addresses the resulting gap through a PRISMA 2020-guided systematic review [25] whose main output is a theory-grounded, testable conceptual framework rather than a further technology map. Two features distinguish the approach from the reviews cited above. Methodologically, the review combines rubric-based coding with probabilistic topic modelling (latent Dirichlet allocation [26], with a covariate-augmented Dirichlet multinomial regression model [27] as a stability check) and with bibliographic coupling, co-citation, and keyword co-occurrence analyses, so that each finding can be checked against sources of evidence that do not depend on the same procedure. Substantively, the framework treats AI-enabled traceability as a distinct outcome pathway linking material recovery to supply chain and resource security concerns for critical and secondary raw materials, rather than as a minor extension of waste diversion outcomes [28].
Accordingly, this review has three objectives: (i) to map the thematic structure and recent evolution of research on AI-enabled circular C&D waste management, (ii) to identify which organisational capability enablers, AI mechanisms, and circularity outcomes this research reports, and how they co-occur, and (iii) to integrate these patterns with dynamic capabilities theory, diffusion of innovation theory, and circular economy principles into a framework, a set of testable propositions, and a set of exploratory policy implications. Because the evidence base is published research, the review characterises where research attention has concentrated—it does not measure organisational capability directly.
Diffusion of innovation theory also treats policy and governance as part of the social system surrounding an innovation [23], and recent studies show that this dimension is active but not yet synthesised: they compare the efficacy of policy tools [29], digitalisation, and circular economy policy in the EU, UK, and China [30], soft measures against rigid mandates [31], and policy interventions in transitional economies [32], while stakeholders in some countries still find policy guidance “very limited” [33]. Policy instruments are, therefore, treated as a fourth analytical strand.
Four research questions guide this study:
RQ1. What is the intellectual structure, thematic and temporal, of research on AI-enabled circular C&D waste management, and how has it evolved as the field has grown?
RQ2. Which organisational capability enablers, AI mechanism clusters, and circularity outcomes are reported in this literature, and how are they related to one another?
RQ3. How can these empirically derived themes be integrated with dynamic capabilities theory, diffusion of innovation theory, and circular economy principles into a theory-grounded, testable framework, and what research agenda follows from it?
RQ4. What policy instruments and governance mechanisms are reported as enabling or constraining AI-enabled circularity in C&D waste management, and what policy implications follow from the framework?
The remainder of the paper is organised as follows. Section 2 describes the methods and Section 3 presents the results. Section 4 develops the framework and propositions, Section 5 discusses the contribution, policy implications, and prior reviews, Section 6 sets out the limitations, and Section 7 concludes.

2. Methodology

2.1. Search, Screening, and Coding

This study follows PRISMA 2020 [25] and uses a single database (Scopus). A Boolean search with three concept blocks (digital/AI technology AND C&D waste AND a circularity or waste management outcome, in TITLE-ABS-KEY) was run on 19 August 2026 and returned 491 records. Sequential limiters removed 212 records: publication year outside 2022–2026 (107), document type (73), source type (18), publication stage (10), and language (4), leaving 279 records (229 journal articles and 50 conference papers). The PRISMA checklist is in the Supplementary S1.
The complete search string was: TITLE-ABS-KEY ((“artificial intelligence” OR “machine learning” OR “deep learning” OR “computer vision” OR “digital twin” OR “building information model” OR “BIM” OR “blockchain” OR “robot” OR “predictive analytic *”) AND (“construction and demolition waste” OR “C&D waste” OR “demolition waste” OR “construction waste”) AND (“circular economy” OR “circularity” OR “waste management” OR “material recovery” OR “resource recovery” OR “waste diversion”)) AND (LIMIT-TO (SRCTYPE, “j”) OR LIMIT-TO (SRCTYPE, “p”)) AND (LIMIT-TO (PUBSTAGE, “final”)) AND (LIMIT-TO (DOCTYPE, “ar”) OR LIMIT-TO (DOCTYPE, “cp”)) AND (LIMIT-TO (PUBYEAR, 2022) OR LIMIT-TO (PUBYEAR, 2023) OR LIMIT-TO (PUBYEAR, 2024) OR LIMIT-TO (PUBYEAR, 2025) OR LIMIT-TO (PUBYEAR, 2026)) AND (LIMIT-TO (LANGUAGE, “English”)). The string, the record count after each limiter, and the export date are also reported in Supplementary S2.
Scopus was chosen as the single source because it offers broad coverage of engineering, construction, and environmental journals [34] and exports complete reference fields for every record, which the bibliographic coupling and co-citation analyses require. Using one database also avoids merging citation records from sources that format references differently, which would otherwise distort the citation networks.
The window was restricted to 2022–2026 by design, to characterise the current state and direction of the field rather than its history. The most recent five publication years cover a period of rapid methodological change, from conventional machine learning towards deep learning and the first foundation model and generative AI applications. Earlier work has been synthesised by prior reviews [12,13,15], which this review complements. Foundational pre-2022 studies still enter the analysis through co-citation: 42 of the 66 most co-cited references (63.6%) predate 2022, including [35,36,37].
For this review, AI refers to machine learning, deep learning, computer vision, and foundation models. AI-enabled technologies are digital platforms, such as BIM, digital twins, and robotics, when they embed or are coupled with AI models. AI-adjacent technologies, notably blockchain, are included where they supply the data, provenance, or governance infrastructure on which AI applications depend, following the grouping of digital technologies for circular construction used in prior work [17]. The term “AI-enabled” in the title covers all three.
After a duplicate check against DOI and title (no duplicates were found), all 279 records were screened on title and abstract against three criteria: C&D waste management at any lifecycle stage, an AI or AI-enabled/AI-adjacent technology, and a circularity-related outcome. Screening removed 41 records: 38 were excluded (25 with no meaningfully applied AI/digital technology, E2; 8 not concerning C&D waste, E1; 4 off-topic, E3; 1 with no genuine circularity outcome, E8) and 3 judged Unsure were not carried forward. All 238 remaining records were retrieved and assessed as full text, which excluded 21 more (14 E2, 4 E1, 2 E8, and 1 E3), leaving 217 included records (Figure 1). Every decision and its reason is recorded in Supplementary S3.
Title/abstract screening and full-text eligibility assessment were conducted by a single reviewer assisted by a large language model (Claude, Anthropic), which applied the written eligibility criteria to each record. The criteria and codebook given to the model are provided in Supplementary S4. Every inclusion and exclusion decision was checked by the reviewer against the record before it was accepted. Because LLM screening performance varies with the model, the prompt, and the balance of relevant and irrelevant records [38,39], a second human reviewer, blind to the original decisions, independently screened a random sample of 56 title/abstract records (20%) and 30 full-text records (all 21 full-text exclusions and 9 randomly selected inclusions). Agreement was 92.9% at title/abstract level (52 of 56; Cohen’s κ = 0.76) and 83.3% at full-text level (25 of 30; κ = 0.66). All three records the second reviewer would have excluded at title/abstract level were excluded later at full-text level, and all five full-text disagreements were studies the original screening had excluded but the second reviewer would have included; after discussion, the original decisions were retained.
The 217 included records were coded at abstract level against four taxonomies (capability enablers, AI mechanism clusters, circularity outcomes, and policy instruments), the last after a keyword filter, with open coding for mechanisms outside the a priori categories. A fifth field recorded any reported moderator (firm size, institutional or regulatory context, or regional context). Coding was multi-label: a record could carry several categories within a taxonomy when its abstract discussed them substantively, because single studies often combine mechanisms (for example, BIM with computer vision) and report several outcomes. Percentages within a taxonomy, therefore, sum to more than 100%.

2.2. Theoretical Lens and Coding Taxonomies

The coding taxonomies were derived deductively from the theoretical lens and from prior reviews and then extended inductively. Capability enablers follow dynamic capabilities theory [19,20], which decomposes an organisation’s capacity to convert a new technology into a sustained advantage into sensing (identifying opportunities), seizing (mobilising resources to capture them), and transforming (renewing routines and governance to sustain the change). The four enabler categories (digital infrastructure, AI/ML technical capability, human and organisational capability, and governance capability) operationalise these capacities at the level of detail an abstract typically reports, following work that links dynamic capabilities to digital transformation [21] and to digitally enabled circular economy practices [22].
AI mechanism clusters were derived from the technology groupings of prior reviews [12,13,15,17]. Four clusters were specified a priori (computer-vision-enabled sorting, BIM/digital twin integration, predictive analytics, and blockchain traceability), three more (robotics/automated sorting, simulation/system dynamics, and knowledge graph/ontology reasoning) were added when they recurred during coding, and the remaining mechanisms were open-coded. Circularity outcomes follow the value-retention hierarchy [24] (material/resource recovery, waste minimisation/diversion, carbon/emissions performance, and traceability/material security), with decision-support performance recorded separately as an enabling condition. Diffusion of innovation theory [23] informs the moderator field. Dynamic capabilities theory was preferred to individual-level acceptance models because the question concerns how organisations turn technical capability into sustained practice. Diffusion of innovation theory adds an account of variation across institutional contexts.

2.3. Topic Modelling Procedure

The intellectual structure was analysed with latent Dirichlet allocation (LDA) [26] and Dirichlet multinomial regression (DMR) [27], a covariate-augmented LDA variant related to the structural topic model [40], both fitted in the Python library tomotopy (version 0.14.0), which was chosen because it estimates the two models with the same Gibbs sampler, so their results are directly comparable. Topic modelling identifies latent themes from the full wording of titles and abstracts rather than from author keywords, which is why it is recommended for literature reviews [41]. Combining topic modelling and science mapping with a PRISMA-guided review is, therefore, not new in itself [41,42]. What this review adds is the use of these unsupervised methods to cross-check a theory-driven coding scheme. Publisher copyright statements were removed, and the text was lowercased, stripped of non-alphabetic tokens, and filtered against scikit-learn’s English stopword list plus 79 generic academic and domain terms (for example, “waste”, “construction”, and “study”; Supplementary S5). Rare terms (fewer than 3 occurrences or 2 documents) and the 5 most frequent remaining terms were removed, leaving 1795 terms and an average of 111.5 tokens per document.
The number of topics (K) was examined from 5 to 15, comparing 5 seeds per value on mean c_v coherence and on stability, measured as the average best-match Jaccard similarity of the topics’ 10 top words across seeds [43]. Neither criterion showed a clear optimum (coherence 0.62–0.68; stability 0.36–0.47; Supplementary S5). K = 8 was retained because it matches the granularity of the coding scheme: at K = 5 distinct mechanisms merged, whereas at K = 12 waste generation prediction split into three overlapping topics and a weakly interpretable topic appeared. Ten models were fitted at K = 8 and, by a rule fixed in advance, the one with the highest coherence was kept (seed 6; c_v = 0.677). All models were trained on a single thread for exact reproducibility (100 burn-in and 1000 sampling iterations, 2000 for DMR; α = 0.1, optimised during training; η = 0.01), and a DMR model with publication year as a covariate served as a stability check. All settings and the topic assignment of every record are provided in Supplementary S5.

2.4. Bibliometric Network Analysis

Here, 3 analyses were run on the 217 included documents in VOSviewer 1.6.20 [44], chosen because it builds and clusters citation and keyword networks with a single method, following established guidance on science mapping [42,45,46]: bibliographic coupling (documents, full counting, minimum 10 citations), which groups included studies that cite the same prior work, co-citation (cited references, full counting, minimum 10 citations), which identifies the shared intellectual base, and keyword co-occurrence (author keywords, full counting, minimum 2 occurrences), which shows how authors describe their own work. In the Scopus export, the authors within each cited reference are separated by semicolons, the character VOSviewer uses to separate references, which splits references and labels them by their last author. The References field was, therefore, re-parsed so that each cited work appears once, with its authors in order and one consistent rendering (Supplementary S6). After re-parsing, 239 cited works reached 5 citations, too many for an interpretable map, so the co-citation threshold was set at 10. For keywords, a thesaurus merged 18 acronym and spelling variants (e.g., “bim” and “building information modeling (bim)”). Density, degree, and betweenness centrality and k-cores [47] were computed with NetworkX [48], and these diagnostics are reported in Supplementary S6.

2.5. Statistical Tests of Association Between Enablers, Mechanisms, and Outcomes

Co-occurrence patterns among capability enablers, AI mechanism clusters, and circularity outcomes were tested with chi-square tests with Yates’ continuity correction, or Fisher’s exact test, where any observed 2 × 2 cell count fell below 5, with the phi coefficient as the effect size. Tests were computed with SciPy on the coded indicator variables (n = 217 throughout). Because eight tests were run, p-values were adjusted with the Holm–Bonferroni procedure [49]. These tests show whether two codes appear in the same studies more often than chance would predict—they do not establish causal relationships between capabilities, mechanisms, and outcomes.

2.6. Coding Reliability

Coding reliability was assessed in 2 rounds covering 68 distinct included studies (31.3% of 217). A second human coder, who had not seen the original codes, first coded a random sample of 25 studies and then a second random sample of 45, working from titles and abstracts with the same codebook—2 studies appeared in both rounds, and their second-round codes are used. Agreement was calculated with Cohen’s kappa for each category, treating each category as a separate present/absent judgement, and then averaged within each field [50]. Open-coded mechanisms were excluded because free-text labels cannot be matched reliably.
Across the 68 studies, agreement was substantial for capability enablers (mean κ = 0.76) and almost perfect for the 6 named mechanism categories present (mean κ = 0.93) [51]. In the second round the coder marked the outcome field “Unsure” for four studies. Because the handling of these studies affects the result, outcome kappa is reported three ways: 0.60 with them excluded, 0.59 with Unsure treated as no outcome, and 0.47 with Unsure treated as full disagreement, which is moderate under all three treatments. The weakest categories were digital infrastructure (κ = 0.55), which the second coder applied less often than the original coder (28 against 42 studies), and decision-support performance (κ = 0.48 excluding Unsure records), which the second coder applied more often (36 against 27). Both are broad categories whose boundaries are hard to judge from an abstract. All four Unsure studies, for example, were prediction studies whose abstracts did not say how the forecasts would be used. Agreement rose from the first round to the second (0.67, 0.85, and 0.55 against 0.80, 0.96, and 0.63 for the three fields, excluding Unsure records; Supplementary S7).
Agreement on whether a moderator was reported was poor (κ = 0.26; the original coder recorded a moderator in 16 of the 68 studies and the second coder in 3), so moderator results are reported descriptively and are not used as quantitative evidence. Policy instrument coding, checked in the second round, agreed for all 45 studies, but only 1 carried a policy instrument, so this agreement says little about positive cases.
To test whether abstract-level coding under-records organisational content, the second coder also coded the 4 capability enablers from the full texts of a random sample of 30 included studies. Twenty of them had been coded at abstract level with neither governance nor human/organisational capability, and none of these twenty discussed either capability substantively in the full text (0 of 20; 95% confidence interval 0–17%). Of the ten studies coded with one of these capabilities at abstract level, the full-text coding confirmed five. Although this comparison also involves a change of coder, it gives no indication that abstract-level coding understates the organisational layers.

3. Results

3.1. The Intellectual Structure and Temporal Evolution of the Field

3.1.1. Topic Structure

The 8-topic LDA solution resolves into clearly interpretable topics of different sizes, from 10 to 44 dominant-topic records: circular economy strategy and resource efficiency (44 records; top words: circular, economy, practices, strategies, sector, efficiency, and resource), deep learning image classification and segmentation (41; classification, segmentation, deep, recognition, images, accuracy, detection, and dataset), design-stage planning and environmental assessment (35; environmental, design, impact, sustainability, assessment, stage, and planning), machine learning waste generation prediction (26; machine, learning, prediction, performance, generation, algorithms, and neural), digital integration, blockchain, and deconstruction (22; digital, technologies, integration, blockchain, stakeholders, and deconstruction), urban waste generation and stock quantification (21; urban, estimation, generation, quantification, and area), computer vision and robotic sorting (18; sorting, automated, vision, computer, manual, recovery, and robotic), and recycled-aggregate concrete (10; concrete, recycled, strength, aggregates, and compressive). Top words and the assignment of every record are listed in Supplementary S5.
Because each record’s dominant topic and its coded AI mechanism were derived by separate procedures, one lexical and unsupervised and the other a rubric-based reading of the abstract, their correspondence is an independent check. It is strong for the 4 topics with a one-to-one mechanism counterpart: 25 of the 26 records in the prediction topic (96.2%) are coded as predictive analytics, 39 of 41 in the deep learning classification topic (95.1%) as computer-vision-enabled sorting, 17 of 18 in the computer vision and robotic sorting topic (94.4%) as computer vision or robotic sorting, and 29 of 35 in the design-stage planning topic (82.9%) as BIM/digital twin integration. Across all eight topics the association is strong (Cramér’s V = 0.53, p < 0.001; Supplementary S5). The broader topics are more mixed: digital integration combines blockchain (10 records) and BIM/digital twin (8) studies, and circular economy strategy spans BIM/digital twin (16), predictive analytics (8), and simulation (6).

3.1.2. Temporal Evolution

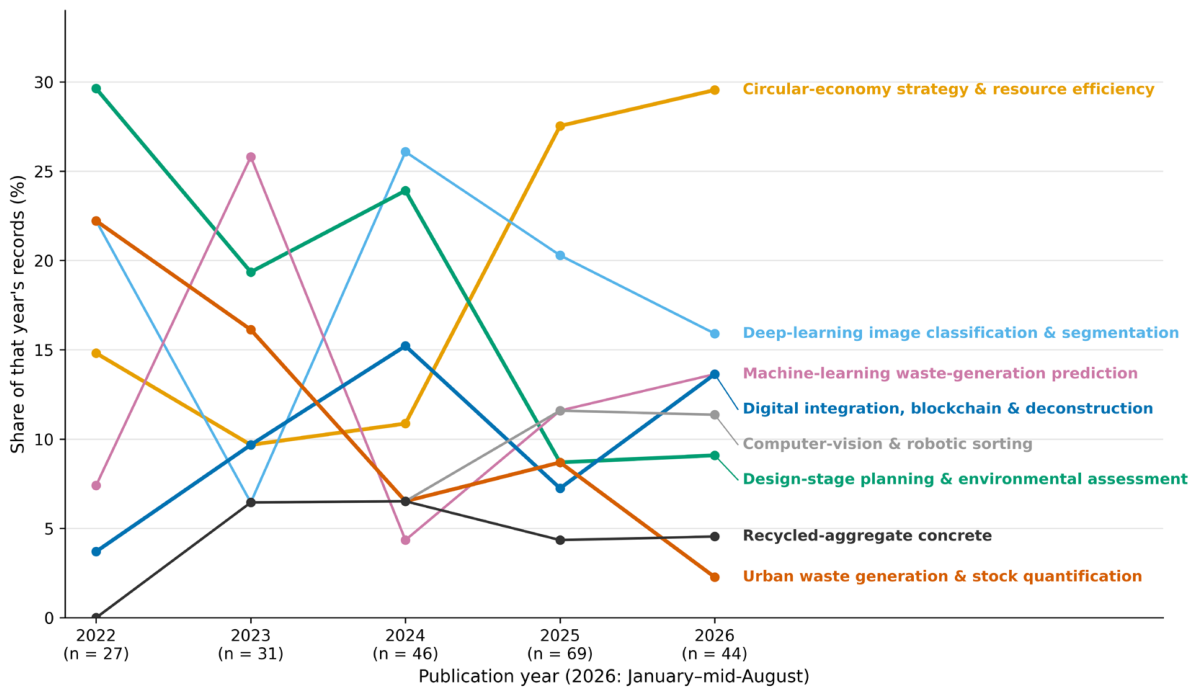
Figure 2 plots each topic’s yearly share of records, 2022–2026 (annual counts: 27, 31, 46, 69, and 44). Urban waste generation and stock quantification fell from 22.2% of records in 2022 to 2.3% in 2026, and design-stage planning and environmental assessment from 29.6% to 9.1%, while circular economy strategy grew from 14.8% to 29.5%, becoming the largest topic in 2025 and 2026, and digital integration, blockchain, and deconstruction grew from 3.7% to 13.6%. Deep learning classification peaked in 2024 (26.1%). The 2023 peak in machine learning prediction (25.8%) reflects concentrated output from two research groups (seven of the fifteen predictive-analytics records of 2023) rather than a sustained trend. The DMR model with year as a covariate recovers the same eight topics (top-word Jaccard similarity 0.54–0.82), so the structure is not an artefact of one model. The 2026 data cover about seven and a half months, so 2026 shares are provisional.
The 2 open-coded clusters absent from the a priori taxonomy, geospatial/remote sensing intelligence (14 records), and foundation model/generative AI (10) do not form LDA topics of their own: the geospatial records fall mainly in deep learning classification (7 of 14) and urban stock quantification (3), and the foundation model records are spread across 5 topics, none holding more than 4 of the 10.
Cross-tabulating the dominant topic against coded capability enablers gives a further check that does not depend on the coding rubric alone. Governance capability records (n = 39) fall almost entirely in the two broad applied topics, circular economy strategy (17) and digital integration, blockchain, and deconstruction (15), together 82.1%, and human/organisational capability records (n = 29) show the same pattern but less strongly (18 of 29, 62.1%). Neither enabler appears in any record of the deep learning classification or concrete topics, and governance appears in none of the computer vision sorting records. The transforming layer is thus discussed mainly in the applied, strategy-oriented part of the literature (42 of the 60 studies coding either capability) and is nearly absent from its technical core (6 of the 95 studies in the classification, sorting, prediction, and concrete topics).

3.1.3. Citation-Based Structure

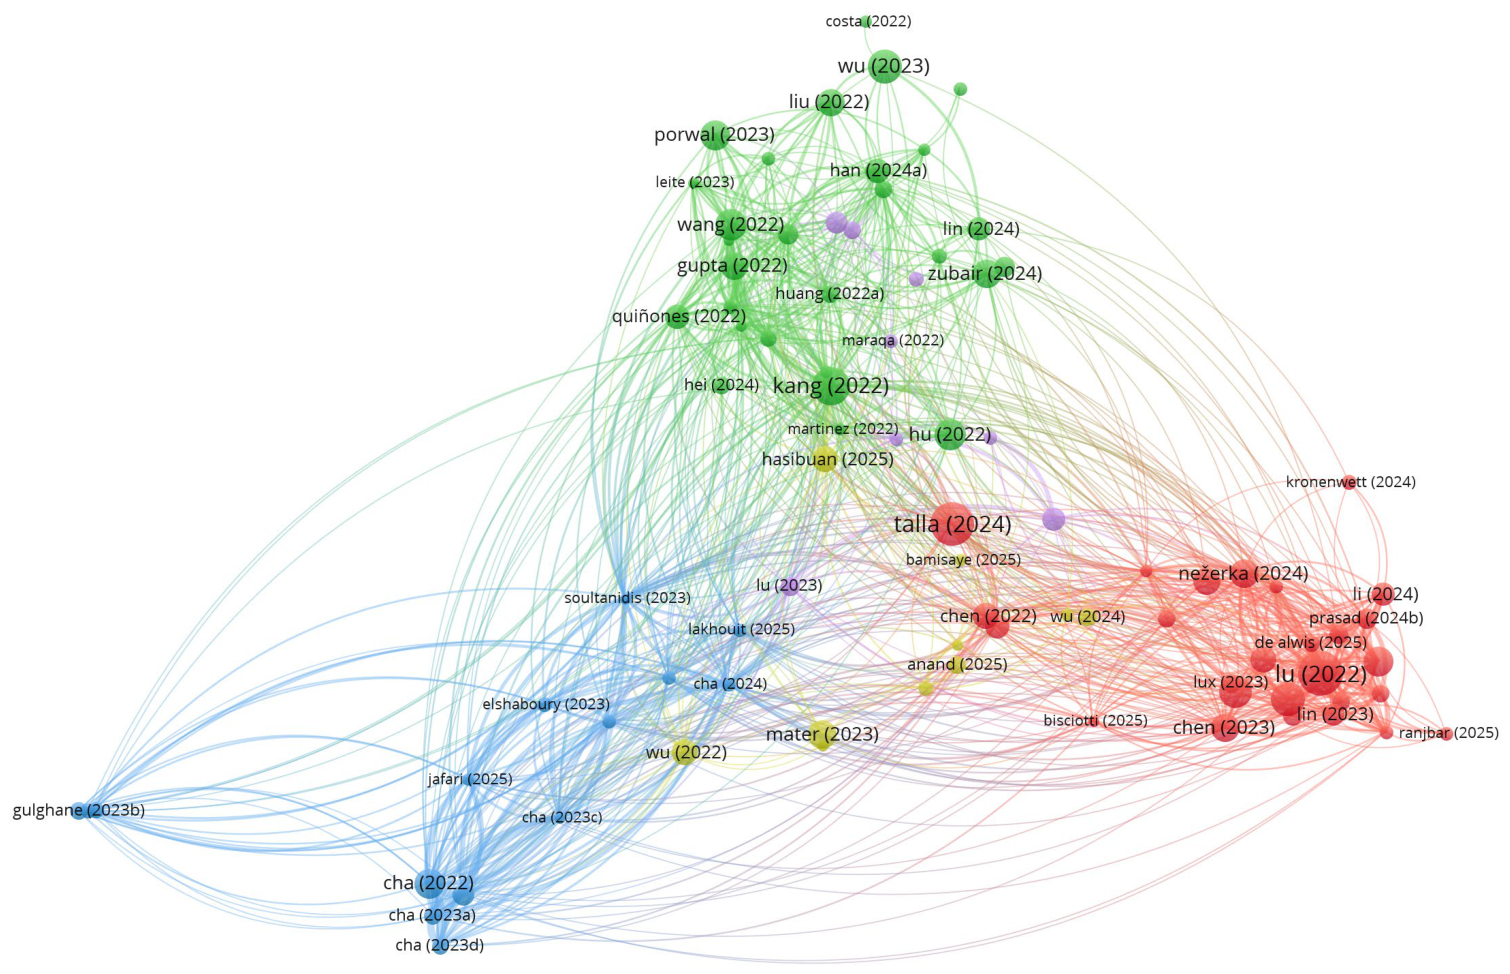
Bibliographic coupling produced a single connected network of the 89 included documents that met the citation threshold, comprising 1215 coupling links with a total link strength of 3135 and 5 thematic clusters (Figure 3). The network was generated in VOSviewer using full counting and the re-parsed reference field. Two clusters correspond closely to the LDA topics. The first, comprising 15 documents, is predominantly focused on machine-learning-based waste generation prediction (86.7%) and is largely structured around 2 research programmes on demolition waste generation rates: 6 studies by Cha and co-authors, including [4], and 3 by Gulghane, Sharma, and Borkar (Supplementary S6). The second, comprising 28 documents, focuses on computer vision and deep learning classification (82.1%) and is anchored by segmentation and classification studies, such as [6,7,52]. A third cluster, also containing 28 documents, combines design-stage planning (14 documents) with digital integration and blockchain applications (7 documents) and includes 10 of the 13 governance-coded documents in the network. In contrast, the computer vision and waste prediction clusters contain no governance-coded documents. The two smaller clusters comprise recycled-aggregate concrete studies (n = 10) and material-stock and BIM data studies (n = 8). Overall, the text-based and citation-based structures converge most clearly in the methodologically focused clusters, while the bibliographic network reinforces the distinction between a technical core and an applied, governance-oriented periphery. Detailed cluster membership is provided in Supplementary S6.
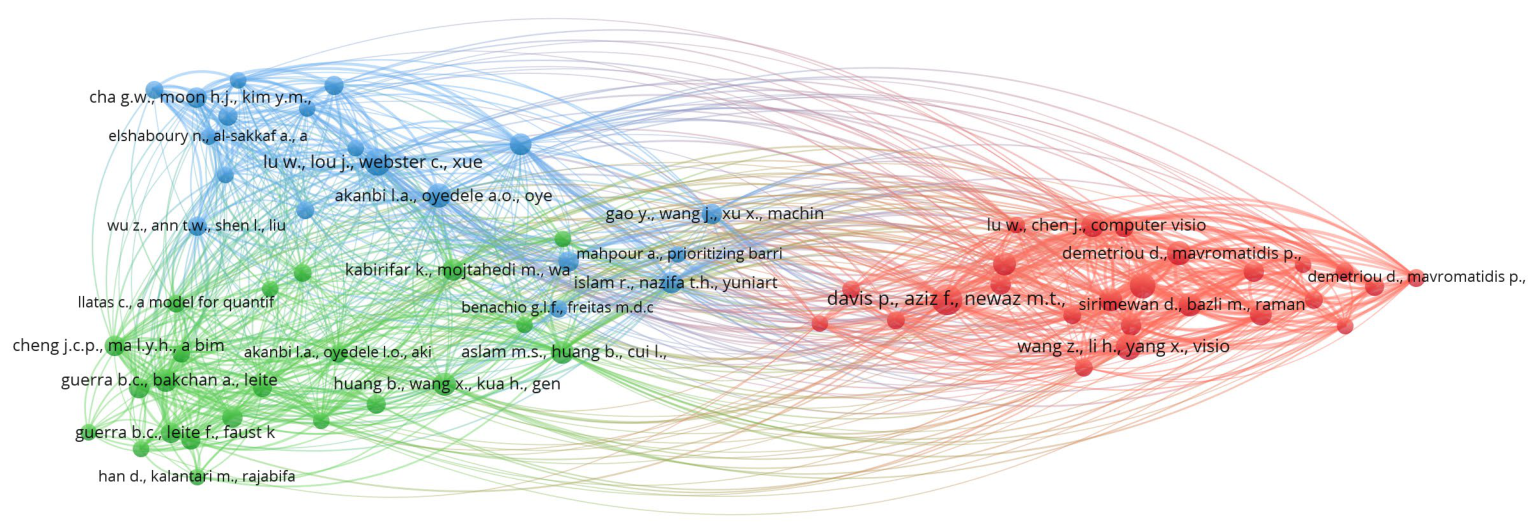
Co-citation analysis (minimum 10 citations) identifies 66 cited works connected by 1282 co-citation links in 3 clusters (Figure 4). The largest cluster (25 references) is the computer vision and robotic sorting literature, led by Davis et al.’s deep convolutional classification of construction waste material [35] (34 citations), Lu et al.’s semantic segmentation of waste mixtures [7] (25), and Wang et al.’s vision-based robotic sorting system [53] (24). The second (19 references) is the waste generation estimation and prediction literature, led by Lu et al.’s machine learning estimation for the Greater Bay Area [36] (26) and Akanbi et al.’s deep learning demolition waste prediction model [37] (21). The third (22 references) is an older literature on BIM-based waste estimation and C&D waste management practice (median publication year 2018–2019). Forty-two of the sixty-six references (63.6%) were published before 2022, so foundational earlier studies are represented through the corpus’s citations even though they fall outside the review window. None of the 3 clusters are organised around governance, policy, or organisational adoption—only 2 of the 66 co-cited works concern adoption, 1 of them a study of barriers to circular economy adoption in C&D waste management [54].

3.1.4. Keyword Co-Occurrence

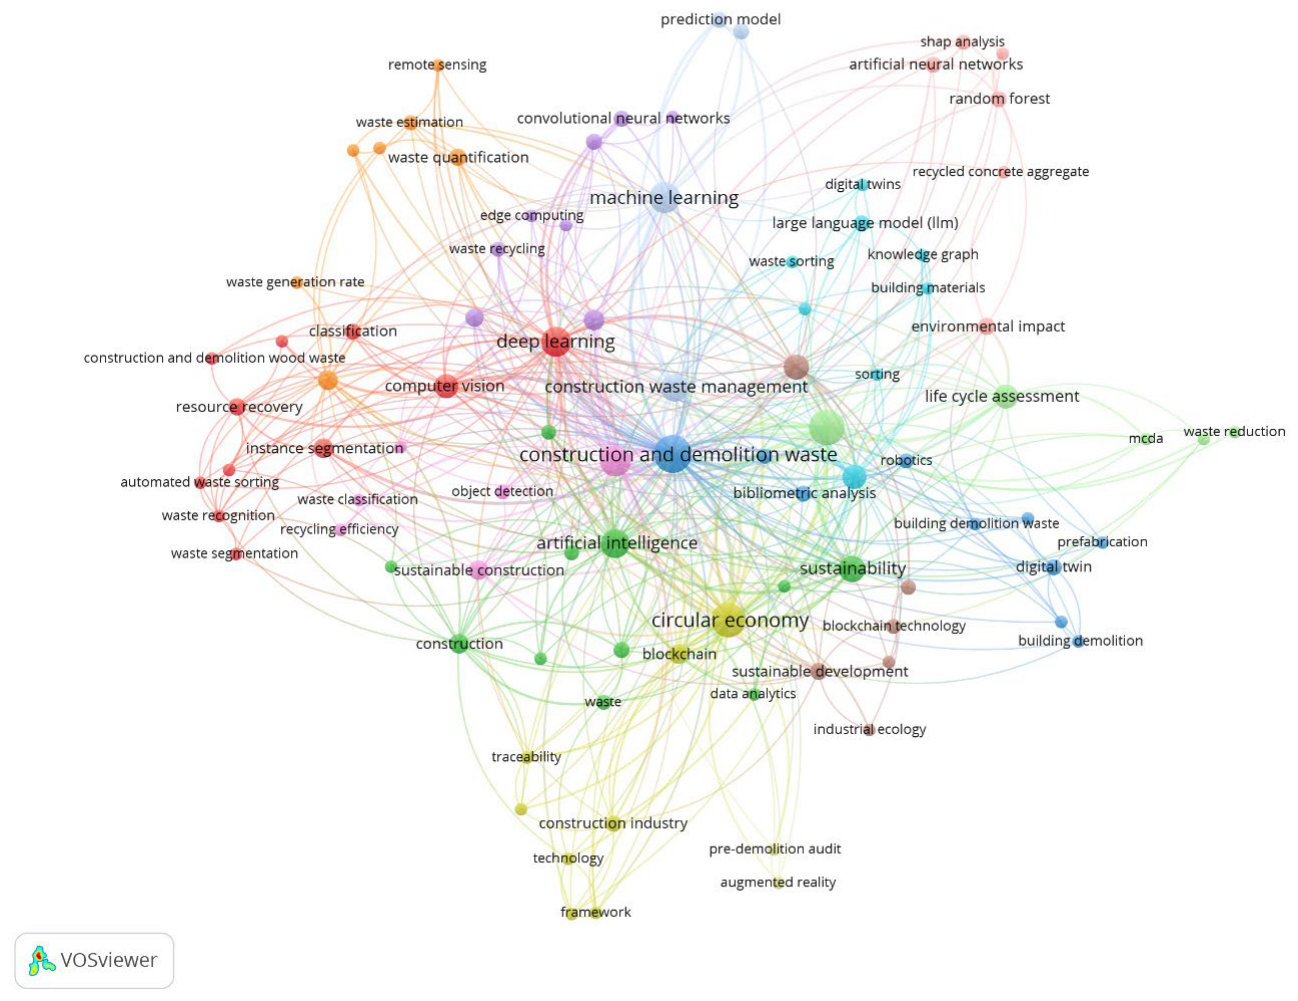
Keyword co-occurrence analysis produced a network of 92 author keywords (minimum 2 occurrences) connected by 483 co-occurrence links in 13 clusters (Figure 5). In such networks, the occurrence count shows how often a term is used, total link strength shows how often it appears together with other terms, and clusters group terms that tend to be used together [45,46]. Four general terms have both the highest occurrence and the highest total link strength: “construction and demolition waste” (63 occurrences; total link strength 137), BIM (48; 116), circular economy (44; 111), and waste management (34; 99). These act as bridges between otherwise separate vocabularies.
The clusters separate two vocabularies. A technical vocabulary is organised around deep learning (29 occurrences) and computer vision (15), with segmentation and image classification, around machine learning (31) and prediction, with random forests, neural networks, and SHAP in a neighbouring cluster, and around artificial intelligence (24) and sustainability (20). An applied vocabulary is organised around circular economy (44) with blockchain (8) and traceability (2), around BIM (48) with lifecycle assessment (14) and multi-criteria decision analysis, and around demolition waste, quantification, building stock, remote sensing, and urban mining. By average publication year of the documents in which they appear, robotics, system dynamics, remote sensing, IoT and digital twins (2026.0), large language models (2025.8), and automation (2025.3) are the newest recurring keywords, while semantic segmentation (2023.2) is among the oldest. No keyword on governance, policy, organisational capability, stakeholders, or adoption reaches the threshold; the only related terms, “barriers” and “traceability”, occur twice each. Authors’ own labels thus show the same technical emphasis as the coding of capability enablers, from a source independent of the coding rubric.

3.2. Capability Enablers: A Technical–Organisational Imbalance

Table 1 summarises the coding results for the four taxonomies. Decision-support performance, coded within the outcome field, is shown as a separate row group because it is an enabling condition rather than a circularity outcome.
Categories within a taxonomy are not mutually exclusive, because a record may be coded with more than one enabler, mechanism, outcome, or instrument, so percentages do not sum to 100%. Indented rows break down the category immediately above them. Each of the 87 records with an open-coded mechanism was assigned to 1 of the 3 sub-categories shown—the last of these groups’ mechanisms that fit neither emergent cluster (Supplementary S9). Decision-support performance is reported separately because it is an enabling condition rather than a circularity outcome in the value-retention sense. Policy records are counted once each—the sub-type counts sum to 11 because 2 of the 9 records carry 2 sub-types (Supplementary S10).
Research attention, as reflected in abstracts, is concentrated on the technical half of the capability stack. Digital infrastructure is discussed in 146 studies (67.3%) and AI/ML technical capability in 139 (64.1%), whereas governance capability appears in only 39 (18.0%) and human and organisational capability (workforce skills, change management, and cross-functional coordination) in just 29 (13.4%). Studies addressing both include work on AI adoption for circular procurement [55], the challenges of implementing AI in timber construction for circular economy goals [56], and blockchain-integrated circular roadmaps for waste management [57]. Four studies (1.8%), all literature reviews or bibliometric analyses, carry no capability enabler. Because abstracts of technical papers may omit organisational content, we checked how robust this imbalance is. Sixty studies (27.6%) are coded with governance or human/organisational capability or both. For this share to reach the 64.1% of AI/ML technical capability, the lower of the 2 technical figures, at least 79 of the remaining 157 studies (50.3%) would need to discuss 1 of these capabilities substantively in the full text without mentioning it in the abstract. In a full-text check of a random sample of 30 studies, none of the 20 studies coded with neither capability at abstract level discussed either in the full text (0 of 20; 95% confidence interval 0–17%), far below this threshold.
Individual studies show what this imbalance leaves out. One of the few studies built around organisational capability [58] interviewed 18 construction professionals in the UAE and found digital–circular integration “contingent on socio-technical conditions, including leadership commitment, early stakeholder engagement, data governance, and procurement practices”, with “fragmented digital systems and cost-driven decision-making” constraining circular outcomes, even where tools such as BIM and digital twins support recovery. The corpus-wide figures suggest this study is the exception: most of the literature reports what an AI system can technically do, not the organisational capacity needed to sustain it.

3.3. AI Mechanism Clusters: Established Technologies and an Emerging Frontier

Of the 4 a priori mechanism clusters, 3 are large and 1 is small: computer-vision-enabled sorting (65 records, 30.0%, including a recent adaptation of the segment anything model to C&D waste imagery [59]), BIM/digital twin integration (64, 29.5%), predictive analytics (53, 24.4%), and, considerably smaller, blockchain traceability (13, 6.0%). Of the 3 categories named during coding, robotics/automated sorting accounts for 15 records (6.9%), simulation/system dynamics for 13 (6.0%), and knowledge graph/ontology reasoning for 2 (0.9%).
What the a priori taxonomy does not anticipate is the size of what is left over. Eighty-seven records (40.1% of the corpus) carry at least one mechanism that falls outside all seven named categories, a share larger than any single named category. Open-coding these 87 mechanisms surfaces 2 clusters coherent and large enough to warrant naming in their own right. The first is geospatial and remote sensing intelligence: satellite imagery, UAV/drone photogrammetry, GIS-based stock mapping, and GPS trajectory analytics, appearing in 14 records and used for demolition debris mapping, change detection, urban building stock mapping, and city-scale waste estimation [60,61,62,63]. The second is foundation model and generative AI: large language models, vision language models, and prompt-guided or few-shot segmentation, appearing in 10 records, 8 of them published in 2025–2026, including vision language models for waste material recognition [64,65], prompt-guided segmentation [66], demolition waste estimation from photographs [67], and a large language model and augmented reality interface for human–robot sorting [68]. Neither cluster featured in the technology lists of prior reviews of this literature [12,13], which is consistent with their recency rather than a prior oversight.
Both clusters are too recent and small for the topic model to recover as separate topics, a resolution limit of the current corpus rather than evidence against them. The corpus has already outgrown the a priori mechanism taxonomy, which is itself a finding.

3.4. Circularity Outcomes: Recovery-Centred, Security-Thin

Material and resource recovery is the outcome most studies target, appearing in 132 records (60.8%). Decision-support performance (better planning or decision-making rather than a physical outcome) follows in 92 records (42.4%). Much of this literature stops at “improves decisions” without showing that better decisions led to measured recovery, diversion, or carbon outcomes. Waste minimisation/diversion follows at 52 records (24.0%), carbon/emissions performance at 30 (13.8%), and traceability/material security, the outcome this review’s novelty claim rests on, at 24 (11.1%). It is examined mainly (17 of the 24 studies) in blockchain, material passport, and BIM-based tracking studies [10,69,70,71,72].

3.5. How Enablers, Mechanisms, and Outcomes Relate

Cross-tabulating the codes within each record, rather than reporting each taxonomy in isolation, surfaces three patterns clear enough to anchor testable propositions (Table 2).
Computer vision sorting is almost exclusively a technical capability mechanism. Of its 65 records, 64 co-occur with AI/ML technical capability, 2 with human/organisational capability, and none with governance capability. Its outcome profile is narrow: 57 (87.7%) target material recovery, 15 (23.1%) decision support, and the other outcomes are in single digits. The mechanism has been engineered intensively for accuracy, speed, and robustness but rarely examined as an adoption problem. The finding that state-of-the-art segmentation models degrade on realistic, cluttered waste streams [52] suggests that the remaining barrier may lie as much in operational conditions (data infrastructure and workforce processes) as in model performance. Dedicated benchmark datasets for C&D waste sorting have appeared only recently [73].
BIM/digital twin integration is the most versatile mechanism, the only one registering across all 5 outcomes (37 recovery, 33 decision support, 31 waste minimisation, 13 carbon, and 8 traceability). It is tied to digital infrastructure (60 of 64 records) far more than to AI/ML technical capability (9), consistent with an information backbone that other mechanisms plug into. A BIM-based deconstruction framework [74] illustrates this: in a Budapest case, selective manual demolition raised high-value reuse from 19.6% to 56.8% compared with mechanical demolition, a gain that comes from planning and sequencing rather than from an AI model.
Blockchain traceability is the one mechanism disproportionately tied to governance capability. Twelve of its thirteen records co-occur with governance capability, a far higher rate than for any other mechanism, and traceability/material security (9) is as frequent as material recovery (9) among its outcomes, whereas every other mechanism’s traceability count is in single digits. In this literature, traceability is, therefore, not a generic add-on outcome but one closely associated with blockchain and with governance rather than technical capability. The link extends beyond blockchain: 18 of the 39 governance capability records (46.2%) also report a traceability outcome, 4 times the corpus rate of 11.1%.
Predictive analytics is a decision-support mechanism first and a recovery mechanism second: 36 of its 53 records (67.9%) link to decision-support performance and 15 (28.3%) to material recovery, the inverse of computer vision’s profile. A hybrid simulation and machine learning study of 1005 residential projects in Shenzhen [31] shows why this matters: a soft “guidance” policy raised recycling rates by 14.13% and voluntary measures by 7.24%, against 0.24% for a mandatory policy, so the mechanism’s contribution was to reveal which governance lever works rather than to recover material. Firm size is rarely examined as a moderator; where studies report one, it is almost always institutional or regional context. Given the poor inter-coder agreement on moderator coding reported earlier, this observation is descriptive only.
The patterns above are co-occurrence counts. Table 3 tests whether each pairing occurs in the same studies more often than chance would predict. Seven of the eight associations tested are statistically significant and remain so after Holm–Bonferroni adjustment for eight tests (adjusted p < 0.001), with effect sizes from φ = 0.29 to φ = 0.52. These results show that the codes co-occur within studies—they do not show that one causes the other.
The one non-significant result is informative: studies that discuss human/organisational capability do not systematically also discuss governance capability, consistent with both being under-discussed separately rather than forming a single “soft capability” theme.

3.6. Policy Instruments and Governance Mechanisms

Policy instruments were coded conservatively (a governmental, regulatory, or institutional lever, not a loose organisational use of “policy”). All 217 records were first screened with a keyword filter (the stems “polic”, “regulat”, “mandat”, “passport”, “extended producer”, “enforcement”, and “compliance”, searched in titles and coded study summaries; Supplementary S10), and the 23 records it returned were coded manually from their abstracts. Records without a match were coded as having no policy instrument. Nine records (4.1%) discuss a substantive policy instrument. Because this share depends on the filter, it is best read as a lower bound, although in the 45 studies that the second coder coded without any filter during the reliability check, the only policy-relevant study was one the filter had already returned. Policy and governance content is, therefore, present but marginal in this literature.
The instruments identified are jurisdiction-specific enforcement mechanisms (4 records, including illegal dumping and waste-hauling monitoring and a system-dynamics model of a combined BIM regulation and recycling-incentive package for Indonesia), material passport or traceability regulation (2, including the EU Digital Product Passport), procurement mandates (2), soft or voluntary measures (1, [31]), extended producer responsibility (1), and the 70% recovery target of the EU Waste Framework Directive (1, in a review arguing that apparent compliance conceals downcycling). Two records carry two sub-types, so the sub-type counts sum to eleven across nine records—no record discusses a deconstruction ordinance. The EU, UK, China, India, Türkiye, and Indonesia are each represented—the jurisdiction of the other two records cannot be determined from the abstract.
Six of the nine policy-tagged records (66.7%) also carry a governance capability code; the other three, monitoring and prediction studies built on computer vision or predictive analytics, treat policy only as institutional context around a technical contribution. This supports the framework’s treatment of institutional and regional context as a diffusion of innovation moderator: policy shapes how mechanisms are adopted rather than being a mechanism itself.
Table 4 summarises the main results of the review, the evidence behind each, and what they imply for future reviews and for practice.

4. Towards a Theory-Grounded Framework

4.1. Dynamic Capabilities Theory: An Uneven Capability Stack

Read through the lens of dynamic capabilities theory, the coded corpus suggests an uneven capability stack. We interpret digital infrastructure and AI/ML technical capability (67.3% and 64.1% of studies) as closest to sensing and seizing: the literature is rich in studies that identify a technical opportunity (a waste stream to classify, a volume to forecast) and mobilise a model to capture it. We interpret governance and human/organisational capability (18.0% and 13.4%) as closest to the transforming layer, which the corpus underrepresents. This mapping is a theoretical interpretation rather than an empirically established correspondence, because the coding recorded capability enablers, not sensing, seizing, and transforming processes. On this reading, dynamic capabilities theory would expect sensing and seizing without transforming to produce technically capable pilots that do not scale into sustained practice. This expectation is consistent with evidence in the corpus that South African construction firms have widely adopted GIS, GPS, and drones while blockchain, digital twins, robotics, and AI remain underused [75], and that awareness of BIM for waste management in Nigeria is high but adoption is low [76].
Two clarifications apply. First, the coding distinguishes capability enablers, not sensing and seizing processes, so digital infrastructure and AI/ML technical capability are treated jointly as the sensing-and-seizing complex; conceptually, digital infrastructure does more of the sensing and AI/ML capability more of the seizing, but the coding cannot separate them. Second, the percentages describe research attention, not organisational practice. The imbalance is consistent with an organisational capability gap, but also with a disciplinary explanation, since more engineering and computer science venues publish classification and prediction work than management venues study adoption. Because the present design cannot separate the two, the propositions developed below are literature-derived hypotheses.

4.2. Diffusion of Innovation Theory: Explaining Where Adoption Stalls

Where dynamic capabilities theory explains the internal capability gap, diffusion of innovation theory [23] explains variation across institutional contexts and adoption pathways. The “intentional, emergent, and hybrid” digital–circular integration pathways found in the UAE [58] can be read as Rogers’ diffusion process operating unevenly across similar firms. The Shenzhen comparison [31] can be read through two of Rogers’ innovation attributes: soft, voluntary measures outperformed a rigid mandate, consistent with their greater compatibility with existing routines and lower complexity. This reframes the recurring pattern of technology “available” but not “adopted” from a list of barriers into a diffusion phenomenon tied to compatibility and organisational readiness. The reading is illustrative: the corpus was not coded systematically against Rogers’ five innovation attributes, and such coding is a natural extension of this review.

4.3. Circular Economy Principles: Locating Outcomes on the Value-Retention Hierarchy

The four circularity outcomes are not equivalent in circular economy terms. Following [24], material/resource recovery and waste minimisation/diversion sit towards the lower, recycling-adjacent end of the value-retention hierarchy, whereas traceability/material security serves the higher-value logic of slowing and closing loops by keeping materials and their provenance information intact for reuse. The outcome distribution (60.8% recovery, 11.1% traceability), therefore, places most AI-enabled circularity research at the lower-value end of the hierarchy, with the outcome tied to critical and secondary raw material security still nascent. Decision-support performance (42.4%) does not map onto the hierarchy—the framework treats it as an enabling condition for the substantive outcomes.

4.4. The Integrated Framework

The findings above synthesise into a framework with four layers:
  • Capability enablers (dynamic capabilities theory): digital infrastructure, AI/ML technical capability, human and organisational capability, and governance capability, unevenly developed, with the transforming layer (governance and human/organisational) the weakest.
  • AI mechanism clusters: the four a priori clusters (computer vision sorting, BIM/digital twin, predictive analytics, and blockchain traceability), the three categories added during coding (robotics, simulation/system dynamics, and knowledge graph reasoning), and two open-coded emergent clusters (geospatial/remote sensing intelligence and foundation model/generative AI), which the corpus supports but the a priori taxonomy did not anticipate.
  • Circularity outcomes (circular economy value-retention hierarchy): waste minimisation, material recovery, carbon performance, and traceability/material security, with decision-support performance positioned as a cross-cutting enabling condition rather than a fifth outcome.
  • Moderators (diffusion of innovation theory): institutional/regional context and firm size. The corpus offers little direct evidence on either, and moderator coding was not reliable enough to quantify. Firm size in particular is almost never examined, so the field cannot yet say whether these AI mechanisms behave differently in small contractors and large developers.
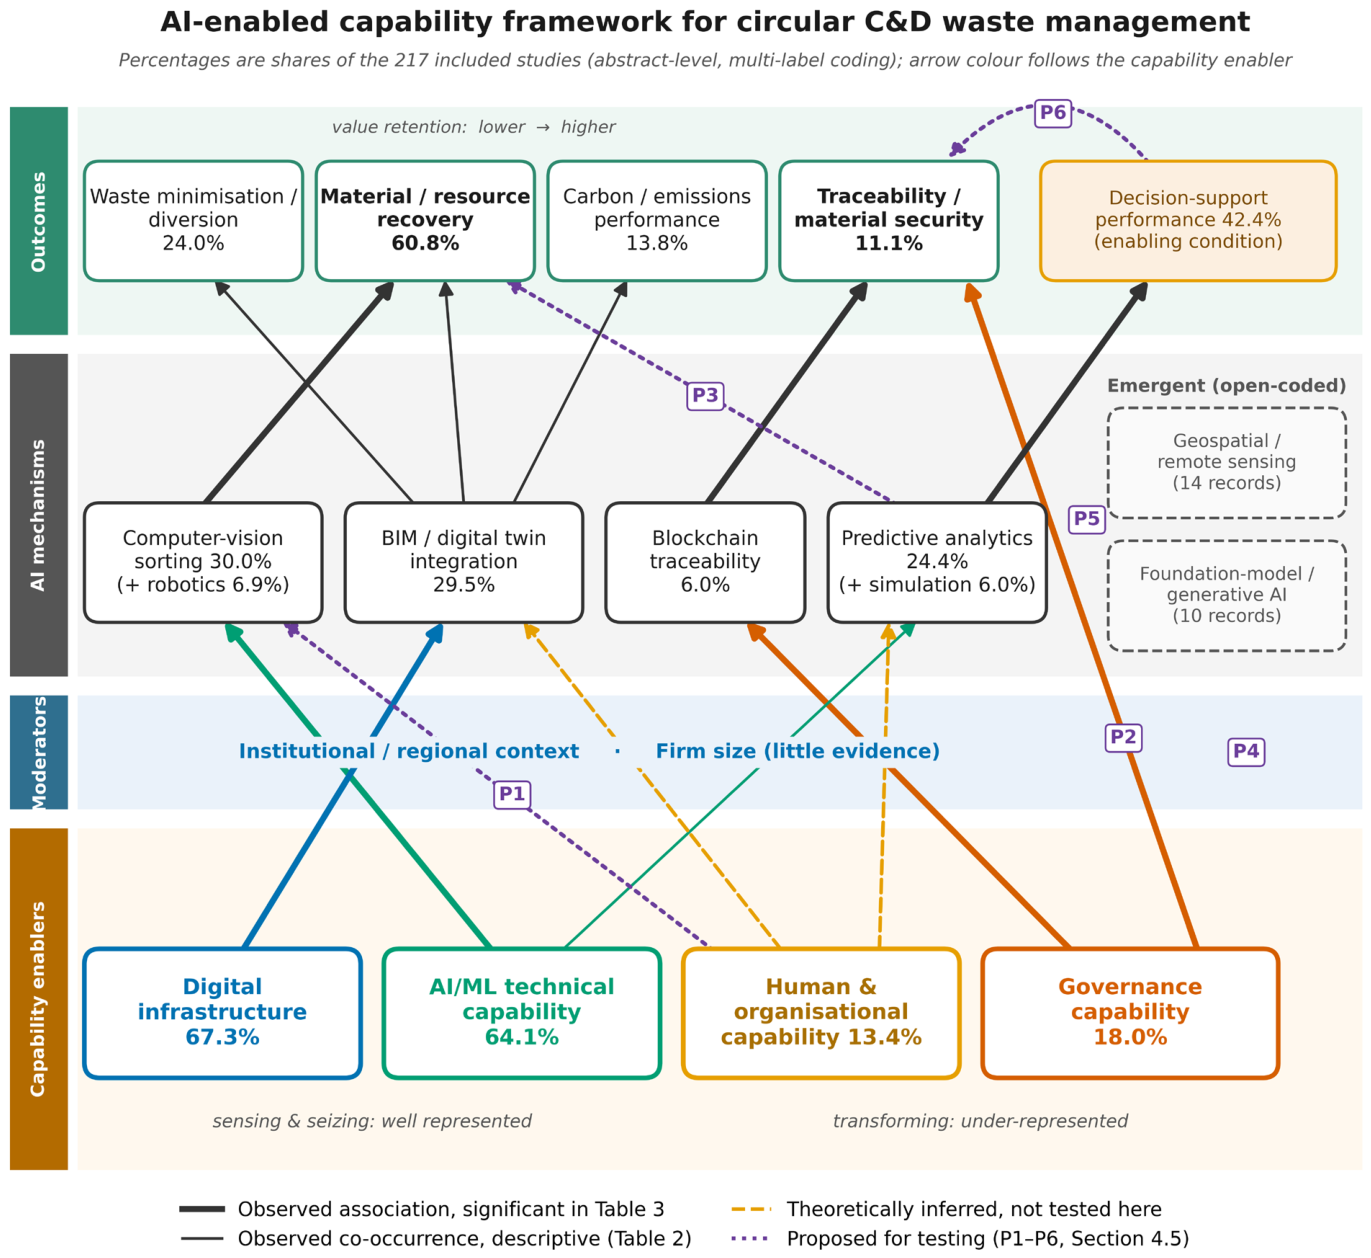
These co-occurrence patterns populate the links between layers: AI/ML technical capability is most often associated with computer vision sorting and predictive analytics, digital infrastructure with BIM/digital twin, and governance capability with blockchain traceability, and each mechanism has a characteristic outcome profile. Figure 6 distinguishes associations observed in the coded literature (solid arrows, thick where significant in Table 3), relationships inferred from theory (dashed), and relationships proposed for testing in the propositions that follow (dotted). The emergent mechanism clusters have dashed borders because they are identified by qualitative coding but not by the topic model.

4.5. Testable Propositions

To connect the framework with future empirical research, the relationships among capability enablers, AI mechanism clusters, circularity outcomes, and contextual moderators are formalised as six propositions. Because the corpus is a body of published research rather than a sample of organisational deployments, each proposition is a literature-derived hypothesis to be tested with organisational data, not a confirmed empirical claim. Table 5 sets out, for each proposition, the constructs to measure, the level of analysis, and a suggested research design.
Proposition 1
(organisational complements to technical mechanisms). Among organisations deploying technically mature AI mechanisms, such as computer vision sorting, those that also invest in governance and human/organisational capability are expected to achieve broader and more sustained operational use than those that invest in technical capability alone.
Proposition 2
(governance and traceability). Blockchain-based traceability initiatives embedded in supportive governance arrangements (for example, shared data standards and regulatory recognition of material passports) are expected to achieve more verified material provenance than technically comparable initiatives without such arrangements.
Proposition 3
(indirect pathway of predictive analytics). The contribution of predictive analytics and simulation to physical circularity outcomes is expected to operate largely through better policy and managerial decisions, so that their association with recovery outcomes weakens once decision quality is taken into account.
Proposition 4
(context and firm size). The adoption of AI mechanisms is expected to vary with institutional and regional context. The scarcity of firm-size evidence in the literature is hypothesised to reflect limited research coverage rather than an absence of firm-size effects, which studies comparing small contractors with large developers could test.
Proposition 5
(compatibility and emergent mechanisms). Emergent AI mechanisms (geospatial intelligence and foundation models) that can be integrated with existing digital platforms, such as GIS layered onto BIM, are expected to diffuse faster than mechanisms that require new, capital-intensive infrastructure.
Proposition 6
(decision support as an intermediate outcome). Improved decision-support performance is expected to be associated with physical circularity outcomes (recovery, diversion, emissions reduction, and traceability) mainly where the organisation also has the transforming capabilities needed to act on the improved decisions.

5. Discussion

5.1. Theoretical Contribution

The framework (Figure 6) differs from prior reviews [12,13,15] in kind rather than coverage: they organise the literature by technology and lifecycle stage, describing what has been tried, whereas this review organises it by capability layer, mechanism, outcome, and moderator, to explain why a technically similar application succeeds in one setting and stalls in another. Its core is the capability imbalance, also visible in the topic model and keyword network: research attention has concentrated on sensing- and seizing-adjacent capabilities far more than on transforming-adjacent ones. This is a pattern in what has been published, consistent with, but not proof of, an organisational capability gap. Dynamic capabilities theory would expect it to produce technically capable pilots that do not scale, as the uneven uptake of Industry 4.0 technologies and the gap between awareness and adoption of BIM reported in the corpus suggest [75,76]. Diffusion of innovation theory explains variation across otherwise similar organisations and jurisdictions. Together, they turn “AI adoption barriers” from an unordered list into a layered structure.

5.2. Exploratory Policy Implications

Only nine studies (4.1%) engage substantively with a policy instrument, so three implications are offered as exploratory. First, because mechanisms and outcomes specialise, no single policy lever serves every AI mechanism: material passport and traceability regulation, although discussed in only two records, fits blockchain traceability specifically rather than serving as a generic circular economy policy. Second, the finding that soft, voluntary measures outperformed a rigid mandate (14.13% against 0.24%) [31] is consistent with diffusion of innovation theory but rests on one study and is best treated as a claim for policy pilots to test. Third, with nine policy-engaged records, geographic patterns are tentative: jurisdiction is identifiable for seven (EU, UK, China, India, Türkiye, and Indonesia, the last modelling a coordinated multi-instrument package), and a full-text check would be needed before any regional claim.

5.3. Comparison with Prior Reviews

Table 6 compares the present review with the most closely related prior reviews, and each is discussed in turn below.
The present findings agree with and extend prior reviews. Consistent with Gao et al. [12], machine learning applications to waste generation and sorting dominate, and prediction is one of the three largest mechanism clusters. Consistent with Dodampegama et al. [13], who found few AI-enabled robotic sorting systems in use, computer vision sorting is technically intensive. The present review adds that these studies almost never discuss governance (0 of 65) or human/organisational capability (2 of 65), an organisational explanation for the gap they identified. Oluleye et al. [15] and Rodrigo et al. [17] identified integration and implementation barriers, and the present review organises such barriers into capability layers. Chen et al. [16] found that legislation and incentives drive circular supply chain strategies, whereas policy content is marginal in the AI-specific literature (4.1%). Compared with the cross-sector mapping of Khakbazan et al. [18], this review is narrower but adds rubric-based coding, topic modelling, and tests of association. Two findings are new: the governance–traceability association (46.2% against 11.1%) and the rise of geospatial and foundation model mechanisms, two-thirds of whose studies date from 2025 to 2026.
Methodologically, the close correspondence between the topic model and the independent coding (82.9–96.2% for the four one-to-one topics; Cramér’s V = 0.53) shows that combining unsupervised topic modelling with rubric-based coding [41] is a useful cross-check on a theory-driven coding scheme.

6. Limitations

Several limitations qualify the findings.
Database selection. The search used a single database, Scopus. Scopus offers broad coverage of engineering and construction journals [34], but studies indexed only in Web of Science or other databases may be missing.
Temporal window. Restricting the review to 2022–2026 captures recent research but excludes earlier primary studies. Foundational works appear only through co-citation, and the 2026 data cover roughly seven and a half months.
Abstract-level coding. Capability enablers, mechanisms, outcomes, and policy instruments were coded from abstracts, which in technical papers may omit governance and organisational content discussed in the full text, so the reported shares of these capabilities may be understated. However, the sensitivity analysis showed that the imbalance would disappear only if more than half of the technically focused studies discussed these capabilities in their full text but not in their abstract, and in a full-text check of a random sample none of the 20 studies coded with neither capability discussed them. Outcome coding was sensitive to how ambiguous abstracts were treated, and moderator coding was not reliable enough to quantify.
LLM-assisted screening and coding. Screening and coding were carried out by a single reviewer assisted by a large language model. Every decision was checked, and a second human reviewer reached substantial agreement on random samples of screening decisions and coded studies, but model-assisted screening can err in ways that are hard to detect [38]. To allow these decisions to be audited, the full list of included studies with their codes is given in Supplementary S11, and the code that reproduces the reliability statistics, association tests and policy keyword filter in Supplementary S12.
Association rather than causation. The statistical tests and co-occurrence patterns describe which concepts appear together in published studies; they cannot establish causal relationships between capabilities, mechanisms, and outcomes in organisations.
Research attention rather than practice. The capability-enabler distribution measures where research attention has concentrated, not organisational capability directly, and it is also consistent with a disciplinary explanation (more technical than management venues publish on this application area), which this design cannot rule out.
Other limitations. Grey literature is excluded. Study quality and risk of bias were not appraised, because the review maps research attention rather than pooling effects. The topic model cannot isolate the two emergent mechanism clusters, so the dashed-border clusters in Figure 6 rest on qualitative coding alone, and the policy synthesis rests on nine studies. The framework and propositions should, therefore, be read as literature-derived hypotheses awaiting testing against organisational-level data.

7. Conclusions

This review set out to explain why AI-enabled circularity interventions in construction and demolition waste management appear to succeed in some settings yet stall in others. By combining abstract-level coding of 217 studies published between 2022 and 2026 with topic modelling, bibliometric network analysis, and statistical tests of association, it offers an answer that distinguishes what the evidence shows, what theory suggests, and what still requires empirical testing.
The evidence shows that research attention in this field is concentrated on the technical side of adoption. Digital infrastructure and AI/machine learning technical capability are discussed in 64–67% of the reviewed studies, whereas governance and human/organisational capability appear in only 13–18%, and no governance or organisational term features among the authors’ recurring keywords. AI mechanisms also display distinct outcome profiles within the reviewed literature. Computer vision sorting co-occurs significantly with material recovery, predictive analytics with decision support, and both blockchain and governance capability with traceability. Traceability and material security remain the least-examined outcome (11.1% of studies), and substantive policy instruments are discussed in only 4.1%.
Interpreted through dynamic capabilities theory, this imbalance suggests that the field has concentrated on sensing and seizing the technical potential of AI. Far less attention has gone to the transforming capabilities that organisations need to sustain its use. Diffusion of innovation theory complements this reading by indicating that institutional context and compatibility with existing routines shape where adoption advances. These inferences characterise the published literature and should not be read as measurements of organisational behaviour.
Confirming these inferences requires organisational-level evidence. The six propositions and the research agenda in Table 5 set out the studies needed, including comparisons between small contractors and large developers and designs that follow decision-support tools through to measured recovery, diversion, and emissions outcomes.
Earlier syntheses have organised this literature by technology [13,17], lifecycle stage [15], or management process [12,16]. Relative to them, this review makes three contributions. First, it offers an organisational capability framework directed at explaining variation in adoption rather than cataloguing applications. Second, it identifies the association between governance capability and traceability, together with the recent emergence of geospatial and foundation model mechanisms. Third, it demonstrates how topic modelling and bibliometric networks can serve as an independent check on a theory-driven coding scheme. Future updates should code organisational content from full texts and examine whether the transforming layer attracts greater attention as the field matures.

Supplementary Materials

The following supporting information can be downloaded at: https://www.mdpi.com/article/10.3390/technologies14100659/s1. Supplementary S1: Supplementary_S1_PRISMA_2020_Checklist.docx, the completed PRISMA 2020 checklist with the location of each item. Supplementary S2: Supplementary_S2_Search_Strategy.docx, the full Scopus search string, limiters, and record counts. Supplementary S3: Supplementary_S3_Screening_Log.xlsx, the title/abstract and full-text decision and exclusion reason for each of the 279 screened records. Supplementary S4: Supplementary_S4_Eligibility_and_Coding_Instructions.docx, the eligibility criteria and coding definitions used with the language model and by the second reviewer. Supplementary S5: Supplementary_S5_Topic_Model_Diagnostics.xlsx, including the stopword list, settings, LDA and DMR top words, records per year, the dominant-topic × mechanism cross-tabulation, and the topic assignment of every record. Supplementary S6: Supplementary_S6a_Bibliometric_Networks.xlsx and Supplementary_S6b_Corrected_References_n217.csv, the network summaries, cluster tables, node-level network topology and k-core results, and the corrected reference field. Supplementary S7: Supplementary_S7_Second_Reviewer_Reliability_Data.xlsx, the second reviewer’s screening decisions (56 title/abstract and 30 full-text records), abstract-level codes in two rounds (68 studies), and full-text enabler codes (30 studies), with the original decisions and codes and the agreement statistics (Section 2.1 and Section 2.6). Supplementary S8: Supplementary_S8_Coded_Corpus_n217.csv, record-level coding of all 217 included studies (Table 1, Table 2 and Table 3, Section 3.2, Section 3.3, Section 3.4 and Section 3.5). Supplementary S9: Supplementary_S9_Open_Coded_Mechanism_Classification.xlsx, the classification of the 87 open-coded mechanism records. Supplementary S10: Supplementary_S10_Policy_Instrument_Coding.xlsx, the keyword filter and the coding of the 23 candidate records (Table 1, Section 3.6). Supplementary S11: Supplementary_S11_Included_Studies_n217.xlsx, the full bibliographic list of the 217 included studies with their codes. Supplementary S12: Supplementary_S12_Python_Code.zip, Python code for the reliability analysis, the tests of association, and the policy keyword filter.

Author Contributions

Conceptualisation, H.S.; methodology, H.S.; software, H.S.; validation, H.S., N.K., M.A.M.D. and I.M.; formal analysis, H.S.; investigation, H.S.; resources, H.S.; data curation, H.S.; writing—original draft preparation, H.S.; writing—review and editing, M.A.M.D., I.M., N.K. and K.S.; visualisation, H.S., M.A.M.D., I.M. and N.K.; supervision, M.A.M.D. and I.M.; project administration, M.A.M.D.; N.K. acted as the blinded second screener and second coder, including the full-text checks. All authors have read and agreed to the published version of the manuscript.

Funding

This research received no external funding.

Institutional Review Board Statement

Not applicable. This study is a systematic literature review and bibliometric analysis of previously published, publicly available bibliographic records. It did not involve human participants, human data, or animals, and, therefore, did not require ethical review or approval.

Informed Consent Statement

Not applicable.

Data Availability Statement

The abstract-level coding of all 217 included studies is provided as Supplementary S8, the second reviewer’s screening and coding data as Supplementary S7, the policy instrument coding as Supplementary S10, and the classification of the 87 open-coded mechanism records as Supplementary S9. The search strategy, PRISMA checklist, bibliometric network data, topic model diagnostics, coding instructions, and the list of included studies are provided as Supplementaries S1, S2, S4–S6 and S11, the Python code for the reliability analysis, tests of association, and policy keyword filter as Supplementary S12, and the screening log as Supplementary S3. The VOSviewer map, network, and thesaurus files are available from the corresponding author upon request.

Acknowledgments

During the preparation of this manuscript, the authors used Claude Opus 5.5 (Anthropic; accessed through claude.ai, 7 October 2026) to assist the single reviewer in executing the Scopus search strategy, applying title/abstract and full-text screening criteria, and coding included records against the capability-enabler, AI mechanism, circularity outcome, and policy instrument taxonomies described in Section 2. The authors have reviewed and edited the output and take full responsibility for the content of this publication.

Conflicts of Interest

The authors declare no conflicts of interest.

Abbreviations

The following abbreviations are used in this manuscript:
AIArtificial Intelligence
BIMBuilding Information Modelling
C&DConstruction and Demolition
LDALatent Dirichlet Allocation
IoTInternet of Things
MLMachine Learning (used as “AI/ML”)
UAVUnmanned Aerial Vehicle
GPSGlobal Positioning System
DMRDirichlet Multinomial Regression
PRISMAPreferred Reporting Items for Systematic Reviews and Meta-Analyses

References

  1. Lee, S.; Chang, H.; Lee, J. Construction and demolition waste management and its impacts on the environment and human health: Moving forward sustainability enhancement. Sustain. Cities Soc. 2024, 115, 105855. [Google Scholar] [CrossRef] [Scilit]
  2. Pacheco-Torgal, F. The rise of AI-enabled startups in creating a low-carbon built environment. Buildings 2026, 16, 632. [Google Scholar] [CrossRef] [Scilit]
  3. Sharma, N.; Kalbar, P.P.; Salman, M. Global review of circular economy and life cycle thinking in building demolition waste management: A way ahead for India. Build. Environ. 2022, 222, 109413. [Google Scholar] [CrossRef] [Scilit]
  4. Cha, G.-W.; Moon, H.J.; Kim, Y.-C. A hybrid machine-learning model for predicting the waste generation rate of building demolition projects. J. Clean. Prod. 2022, 375, 134096. [Google Scholar] [CrossRef] [Scilit]
  5. Lin, K.; Zhou, T.; Gao, X.; Li, Z.; Duan, H.; Wu, H.; Lu, G.; Zhao, Y. Deep convolutional neural networks for construction and demolition waste classification: VGGNet structures, cyclical learning rate, and knowledge transfer. J. Environ. Manag. 2022, 318, 115501. [Google Scholar] [CrossRef] [Scilit] [PubMed]
  6. Dong, Z.; Chen, J.; Lu, W. Computer vision to recognize construction waste compositions: A novel boundary-aware transformer (BAT) model. J. Environ. Manag. 2022, 305, 114405. [Google Scholar] [CrossRef] [Scilit] [PubMed]
  7. Lu, W.; Chen, J.; Xue, F. Using computer vision to recognize composition of construction waste mixtures: A semantic segmentation approach. Resour. Conserv. Recycl. 2022, 178, 106022. [Google Scholar] [CrossRef] [Scilit]
  8. Kang, K.; Besklubova, S.; Dai, Y.; Zhong, R.Y. Building demolition waste management through smart BIM: A case study in Hong Kong. Waste Manag. 2022, 143, 69–83. [Google Scholar] [CrossRef] [Scilit] [PubMed]
  9. Kaewunruen, S.; Lin, Y.-H.; Guo, Y. BIM-driven digital twin for demolition waste management of existing residential buildings. Sci. Rep. 2025, 15, 28989. [Google Scholar] [CrossRef] [Scilit] [PubMed]
  10. Wu, L.; Lu, W.; Peng, Z.; Webster, C. A blockchain non-fungible token-enabled ‘passport’ for construction waste material cross-jurisdictional trading. Autom. Constr. 2023, 149, 104783. [Google Scholar] [CrossRef] [Scilit]
  11. Lin, Y.-H.; Dai, J.; Li, J.; Tao, X. Efficient classification and disposal management of construction waste using blockchain technology and system dynamics. J. Constr. Eng. Manag. 2026, 152, 04025242. [Google Scholar] [CrossRef] [Scilit]
  12. Gao, Y.; Wang, J.; Xu, X. Machine learning in construction and demolition waste management: Progress, challenges, and future directions. Autom. Constr. 2024, 162, 105380. [Google Scholar] [CrossRef] [Scilit]
  13. Dodampegama, S.; Hou, L.; Asadi, E.; Zhang, G.; Setunge, S. Revolutionizing construction and demolition waste sorting: Insights from artificial intelligence and robotic applications. Resour. Conserv. Recycl. 2024, 202, 107375. [Google Scholar] [CrossRef] [Scilit]
  14. Zhang, K.; Qing, Y.; Umer, Q.; Asmi, F. How construction and demolition waste management has addressed sustainable development goals: Exploring academic and industrial trends. J. Environ. Manag. 2023, 345, 118823. [Google Scholar] [CrossRef] [Scilit] [PubMed]
  15. Oluleye, B.I.; Chan, D.W.M.; Antwi-Afari, P. Adopting Artificial Intelligence for enhancing the implementation of systemic circularity in the construction industry: A critical review. Sustain. Prod. Consum. 2023, 35, 509–524. [Google Scholar] [CrossRef] [Scilit]
  16. Chen, Q.; Feng, H.; Garcia de Soto, B. Revamping construction supply chain processes with circular economy strategies: A systematic literature review. J. Clean. Prod. 2022, 335, 130240. [Google Scholar] [CrossRef] [Scilit]
  17. Rodrigo, N.; Omrany, H.; Chang, R.; Zuo, J. Leveraging digital technologies for circular economy in construction industry: A way forward. Smart Sustain. Built Environ. 2024, 13, 85–116. [Google Scholar] [CrossRef] [Scilit]
  18. Khakbazan, M.; Ghanbari, H.; Mohammadi, E.; Kumar, R.R.; Abyaneh, A.G. Exploring the role of AI-driven innovations in circular economy: A comprehensive bibliometric analysis. Qual. Quant. 2026, 60, 3177–3222. [Google Scholar] [CrossRef] [Scilit]
  19. Teece, D.J.; Pisano, G.; Shuen, A. Dynamic capabilities and strategic management. Strateg. Manag. J. 1997, 18, 509–533. [Google Scholar]
  20. Teece, D.J. Explicating dynamic capabilities: The nature and microfoundations of (sustainable) enterprise performance. Strateg. Manag. J. 2007, 28, 1319–1350. [Google Scholar] [CrossRef] [Scilit]
  21. Warner, K.S.R.; Wäger, M. Building dynamic capabilities for digital transformation: An ongoing process of strategic renewal. Long. Range Plan. 2019, 52, 326–349. [Google Scholar] [CrossRef] [Scilit]
  22. Neri, A.; Negri, M.; Cagno, E.; Kumar, V.; Garza-Reyes, J.A. What digital-enabled dynamic capabilities support the circular economy? A multiple case study approach. Bus. Strat. Environ. 2023, 32, 5083–5101. [Google Scholar] [CrossRef] [Scilit]
  23. Rogers, E.M. Diffusion of Innovations, 5th ed.; Free Press: New York, NY, USA, 2003. [Google Scholar]
  24. Kirchherr, J.; Reike, D.; Hekkert, M. Conceptualizing the circular economy: An analysis of 114 definitions. Resour. Conserv. Recycl. 2017, 127, 221–232. [Google Scholar] [CrossRef] [Scilit]
  25. Page, M.J.; McKenzie, J.E.; Bossuyt, P.M.; Boutron, I.; Hoffmann, T.C.; Mulrow, C.D.; Shamseer, L.; Tetzlaff, J.M.; Akl, E.A.; Brennan, S.E.; et al. The PRISMA 2020 statement: An updated guideline for reporting systematic reviews. BMJ 2021, 372, n71. [Google Scholar] [CrossRef] [Scilit] [PubMed]
  26. Blei, D.M.; Ng, A.Y.; Jordan, M.I. Latent Dirichlet allocation. J. Mach. Learn. Res. 2003, 3, 993–1022. [Google Scholar]
  27. Mimno, D.; McCallum, A. Topic Models Conditioned on Arbitrary Features with Dirichlet-Multinomial Regression. In Proceedings of the 24th Conference on Uncertainty in Artificial Intelligence (UAI 2008), Helsinki, Finland, 9–12 July 2008. [Google Scholar]
  28. Elnabwy, M.T.; Martinez, P. AI-driven circular construction waste management for advancing sustainable development. Sustain. Dev. 2026, 1–23. [Google Scholar] [CrossRef] [Scilit]
  29. Mollaei, A.; Bachmann, C.; Haas, C. Assessing the impact of policy tools on building material recovery. Resour. Conserv. Recycl. 2023, 198, 107188. [Google Scholar] [CrossRef] [Scilit]
  30. Cruz, M.D.L.; López Gunn, E.; Karanafti, A.; Diez Ortiz, I. Aligning digitalization and circular economy policies towards a zero-waste construction sector: A comparative analysis of the EU, UK, and China. Sustainability 2026, 18, 7473. [Google Scholar] [CrossRef] [Scilit]
  31. Ding, Z.; Wen, X.; Teng, Y.; Wu, H. Evaluating the impact of soft management policies on construction and demolition waste recycling efficiency: A hybrid simulation-machine learning approach. Environ. Impact Assess. Rev. 2026, 117, 108161. [Google Scholar] [CrossRef] [Scilit]
  32. Rahmatia, D.; Sopha, B.M.; Kamulyan, B. System dynamics modelling of policy interventions for circular construction and demolition waste systems in Indonesia. Clean. Waste Syst. 2026, 14, 100528. [Google Scholar] [CrossRef] [Scilit]
  33. Shahid, M.U.; Ali, M. Enablers and policy framework for construction waste minimization under circular economy: Stakeholder perspectives. Sustainability 2025, 17, 4129. [Google Scholar] [CrossRef] [Scilit]
  34. Pranckutė, R. Web of Science (WoS) and Scopus: The titans of bibliographic information in today’s academic world. Publications 2021, 9, 12. [Google Scholar] [CrossRef] [Scilit]
  35. Davis, P.; Aziz, F.; Newaz, M.T.; Sher, W.; Simon, L. The classification of construction waste material using a deep convolutional neural network. Autom. Constr. 2021, 122, 103481. [Google Scholar] [CrossRef] [Scilit]
  36. Lu, W.; Lou, J.; Webster, C.; Xue, F.; Bao, Z.; Chi, B. Estimating construction waste generation in the Greater Bay Area, China using machine learning. Waste Manag. 2021, 134, 78–88. [Google Scholar] [CrossRef] [Scilit] [PubMed]
  37. Akanbi, L.A.; Oyedele, A.O.; Oyedele, L.O.; Salami, R.O. Deep learning model for demolition waste prediction in a circular economy. J. Clean. Prod. 2020, 274, 122843. [Google Scholar] [CrossRef] [Scilit]
  38. Khraisha, Q.; Put, S.; Kappenberg, J.; Warraitch, A.; Hadfield, K. Can large language models replace humans in systematic reviews? Evaluating GPT-4’s efficacy in screening and extracting data from peer-reviewed and grey literature in multiple languages. Res. Synth. Methods 2024, 15, 616–626. [Google Scholar] [CrossRef] [Scilit] [PubMed]
  39. Dennstädt, F.; Zink, J.; Putora, P.M.; Hastings, J.; Cihoric, N. Title and abstract screening for literature reviews using large language models: An exploratory study in the biomedical domain. Syst. Rev. 2024, 13, 158. [Google Scholar] [CrossRef] [Scilit] [PubMed]
  40. Roberts, M.E.; Stewart, B.M.; Tingley, D. stm: An R package for structural topic models. J. Stat. Softw. 2019, 91, 1–40. [Google Scholar] [CrossRef] [Scilit]
  41. Asmussen, C.B.; Møller, C. Smart literature review: A practical topic modelling approach to exploratory literature review. J. Big Data 2019, 6, 93. [Google Scholar] [CrossRef] [Scilit]
  42. Zupic, I.; Čater, T. Bibliometric methods in management and organization. Organ. Res. Methods 2015, 18, 429–472. [Google Scholar] [CrossRef] [Scilit]
  43. Greene, D.; O’Callaghan, D.; Cunningham, P. How Many Topics? Stability Analysis for Topic Models. In Machine Learning and Knowledge Discovery in Databases (ECML PKDD 2014); Lecture Notes in Computer Science; Springer: Berlin/Heidelberg, Germany, 2014; Volume 8724, pp. 498–513. [Google Scholar] [CrossRef] [Scilit]
  44. van Eck, N.J.; Waltman, L. Software survey: VOSviewer, a computer program for bibliometric mapping. Scientometrics 2010, 84, 523–538. [Google Scholar] [CrossRef] [Scilit] [PubMed]
  45. Donthu, N.; Kumar, S.; Mukherjee, D.; Pandey, N.; Lim, W.M. How to conduct a bibliometric analysis: An overview and guidelines. J. Bus. Res. 2021, 133, 285–296. [Google Scholar] [CrossRef] [Scilit]
  46. van Eck, N.J.; Waltman, L. Visualizing bibliometric networks. In Measuring Scholarly Impact: Methods and Practice; Ding, Y., Rousseau, R., Wolfram, D., Eds.; Springer: Cham, Switzerland, 2014; pp. 285–320. [Google Scholar] [CrossRef] [Scilit]
  47. Seidman, S.B. Network structure and minimum degree. Soc. Netw. 1983, 5, 269–287. [Google Scholar] [CrossRef] [Scilit]
  48. Hagberg, A.A.; Schult, D.A.; Swart, P.J. Exploring network structure, dynamics, and function using NetworkX. In Proceedings of the 7th Python in Science Conference (SciPy 2008), Pasadena, CA, USA, 19–24 August 2008; pp. 11–15. [Google Scholar]
  49. Holm, S. A simple sequentially rejective multiple test procedure. Scand. J. Stat. 1979, 6, 65–70. [Google Scholar]
  50. McHugh, M.L. Interrater reliability: The kappa statistic. Biochem. Med. 2012, 22, 276–282. [Google Scholar] [CrossRef] [Scilit]
  51. Landis, J.R.; Koch, G.G. The measurement of observer agreement for categorical data. Biometrics 1977, 33, 159–174. [Google Scholar] [CrossRef] [Scilit]
  52. Prasad, V.; Arashpour, M. Real-time instance segmentation of recyclables from highly cluttered construction and demolition waste streams. J. Environ. Manag. 2024, 372, 123365. [Google Scholar] [CrossRef] [Scilit] [PubMed]
  53. Wang, Z.; Li, H.; Yang, X. Vision-based robotic system for on-site construction and demolition waste sorting and recycling. J. Build. Eng. 2020, 32, 101769. [Google Scholar] [CrossRef] [Scilit]
  54. Mahpour, A. Prioritizing barriers to adopt circular economy in construction and demolition waste management. Resour. Conserv. Recycl. 2018, 134, 216–227. [Google Scholar] [CrossRef] [Scilit]
  55. Öksüz, N.K.; Omotayo, T.; Tanyer, A.M.; Muftau, A.; Deng, J. Adoption of AI systems for circular construction procurement: A comparative analysis of the UK and Türkiye. In Proceedings of the 43rd eCAADe Conference, Ankara, Turkey, 1–5 September 2025; Volume 1, pp. 217–228. [Google Scholar]
  56. Ghobadi, M.; Sepasgozar, S.M.E. Challenges and Benefits of Implementing AI in Timber Construction for Circular Economy Goals. Buildings 2025, 15, 1073. [Google Scholar] [CrossRef] [Scilit]
  57. Jayarathna, H.S.N.M.; Perera, B.A.K.S.; Atapattu, D.; Rodrigo, N. Circular economy and blockchain-integrated road map to improve construction waste management. Constr. Innov. 2025, 25, 23–49. [Google Scholar] [CrossRef] [Scilit]
  58. Alsaoudi, T.; Acquaye, A. Pathways of digital–circular integration in the construction industry: Empirical insights from the UAE. Green Technol. Sustain. 2026, 4, 100406. [Google Scholar] [CrossRef] [Scilit]
  59. Heo, S.; Na, S. Developing WasteSAM: A novel approach for accurate construction waste image segmentation to facilitate efficient recycling. Waste Manag. Res. 2025, 43, 1048–1059. [Google Scholar] [CrossRef] [Scilit] [PubMed]
  60. Jiang, Y.; Huang, Y.; Liu, J.; Li, D.; Li, S.; Nie, W.; Chung, I.-H. Automatic Volume Calculation and Mapping of Construction and Demolition Debris Using Drones, Deep Learning, and GIS. Drones 2022, 6, 279. [Google Scholar] [CrossRef] [Scilit]
  61. Zhao, X.; Yang, Y.; Duan, F.; Zhang, M.; Jiang, G.; Yan, X.; Cao, S.; Zhao, W. Identification of construction and demolition waste based on change detection and deep learning. Int. J. Remote Sens. 2022, 43, 2012–2028. [Google Scholar] [CrossRef] [Scilit]
  62. Parezanović, A.; Nadaždi, A.; Isailović, D.; Višnjevac, N.; Petojević, Z. Mapping the urban building stock for a circular economy by integrating GIS and BIM. A case study from Belgrade, Serbia. Resour. Conserv. Recycl. 2025, 215, 108075. [Google Scholar] [CrossRef] [Scilit]
  63. Bao, Z.; Chen, Y.; Ou, Y.; Yuan, L.; Zuo, J.; Ng, S.T.; Xu, N.; Gong, P. Spatiotemporal estimation of construction and demolition waste generation using novel integrated machine learning and remote sensing approaches: A study of 83 Chinese cities. Process Saf. Environ. Prot. 2026, 208, 108469. [Google Scholar] [CrossRef] [Scilit]
  64. Sun, Y.; Gu, Z.; Yang, S.B. Probing vision and language models for construction waste material recognition. Autom. Constr. 2024, 166, 105629. [Google Scholar] [CrossRef] [Scilit]
  65. Ranjbar, I.; Ventikos, Y.; Arashpour, M. Zero-shot and few-shot multimodal plastic waste classification with vision-language models. Waste Manag. 2025, 202, 114815. [Google Scholar] [CrossRef] [Scilit] [PubMed]
  66. Sirimewan, D.; Kunananthaseelan, N.; Raman, S.; Garcia, R.; Arashpour, M. Optimizing waste handling with interactive AI: Prompt-guided segmentation of construction and demolition waste using computer vision. Waste Manag. 2024, 190, 149–160. [Google Scholar] [CrossRef] [Scilit] [PubMed]
  67. Li, Y.; Wang, W.; Zhao, J.; Yang, Y.; Zhang, Z.; Skibniewski, M.J.; Yuan, J. Estimating demolition waste from residential interior photos: A Large Language Model solution. Autom. Constr. 2025, 179, 106478. [Google Scholar] [CrossRef] [Scilit]
  68. Chen, J.; Fu, Y.; Lu, W. A large language model and augmented reality integrated interface for human-robot collaborative construction waste sorting. Clean. Mater. 2026, 20, 100386. [Google Scholar] [CrossRef] [Scilit]
  69. Liu, Z.; Wu, T.; Wang, F.; Osmani, M.; Demian, P. Blockchain Enhanced Construction Waste Information Management: A Conceptual Framework. Sustainability 2022, 14, 12145. [Google Scholar] [CrossRef] [Scilit]
  70. Lin, Y.-H.; Wang, J.; Niu, D.; Tao, X. Blockchain-driven framework for construction waste recycling and reuse. J. Build. Eng. 2024, 89, 109355. [Google Scholar] [CrossRef] [Scilit]
  71. Yuan, H.; Du, W.; Zuo, J.; Ma, X. Paving a traceable green pathway towards sustainable construction: A fuzzy ISM-DEMATEL analysis of blockchain technology adoption barriers in construction waste management. Ain Shams Eng. J. 2024, 15, 102627. [Google Scholar] [CrossRef] [Scilit]
  72. Miatto, A.; Sartori, C.; Bianchi, M.; Borin, P.; Giordano, A.; Saxe, S.; Graedel, T.E. Tracking the material cycle of Italian bricks with the aid of building information modeling. J. Ind. Ecol. 2022, 26, 609–626. [Google Scholar] [CrossRef] [Scilit]
  73. Demetriou, D.; Mavromatidis, P.; Petrou, M.F.; Nicolaides, D. CODD: A benchmark dataset for the automated sorting of construction and demolition waste. Waste Manag. 2024, 178, 35–45. [Google Scholar] [CrossRef] [Scilit] [PubMed]
  74. Bukovics, Á.; Ajtayné Károlyfi, K.; Géczy, N. A BIM-based automated framework for waste quantification and management in the deconstruction of historical buildings. Sustainability 2025, 17, 11214. [Google Scholar] [CrossRef] [Scilit]
  75. Ntuli, N.; Aigbavboa, C.; Otasowie, O.; Adekunle, P.; Aghimien, L. Leveraging Industry 4.0 technologies for construction and demolition waste management in South Africa. In Proceedings of the International Conference on Construction in the 21st Century, Rabat, Morocco, 10–14 November 2025. [Google Scholar]
  76. Eze, E.C.; Sofolahan, O.; Uzoma, C.N.; Ameyaw, E.E.; Omoboye, O. Impediments to building information modelling-enabled construction waste management in Nigeria. Built Environ. Proj. Asset Manag. 2025, 15, 500–517. [Google Scholar] [CrossRef] [Scilit]
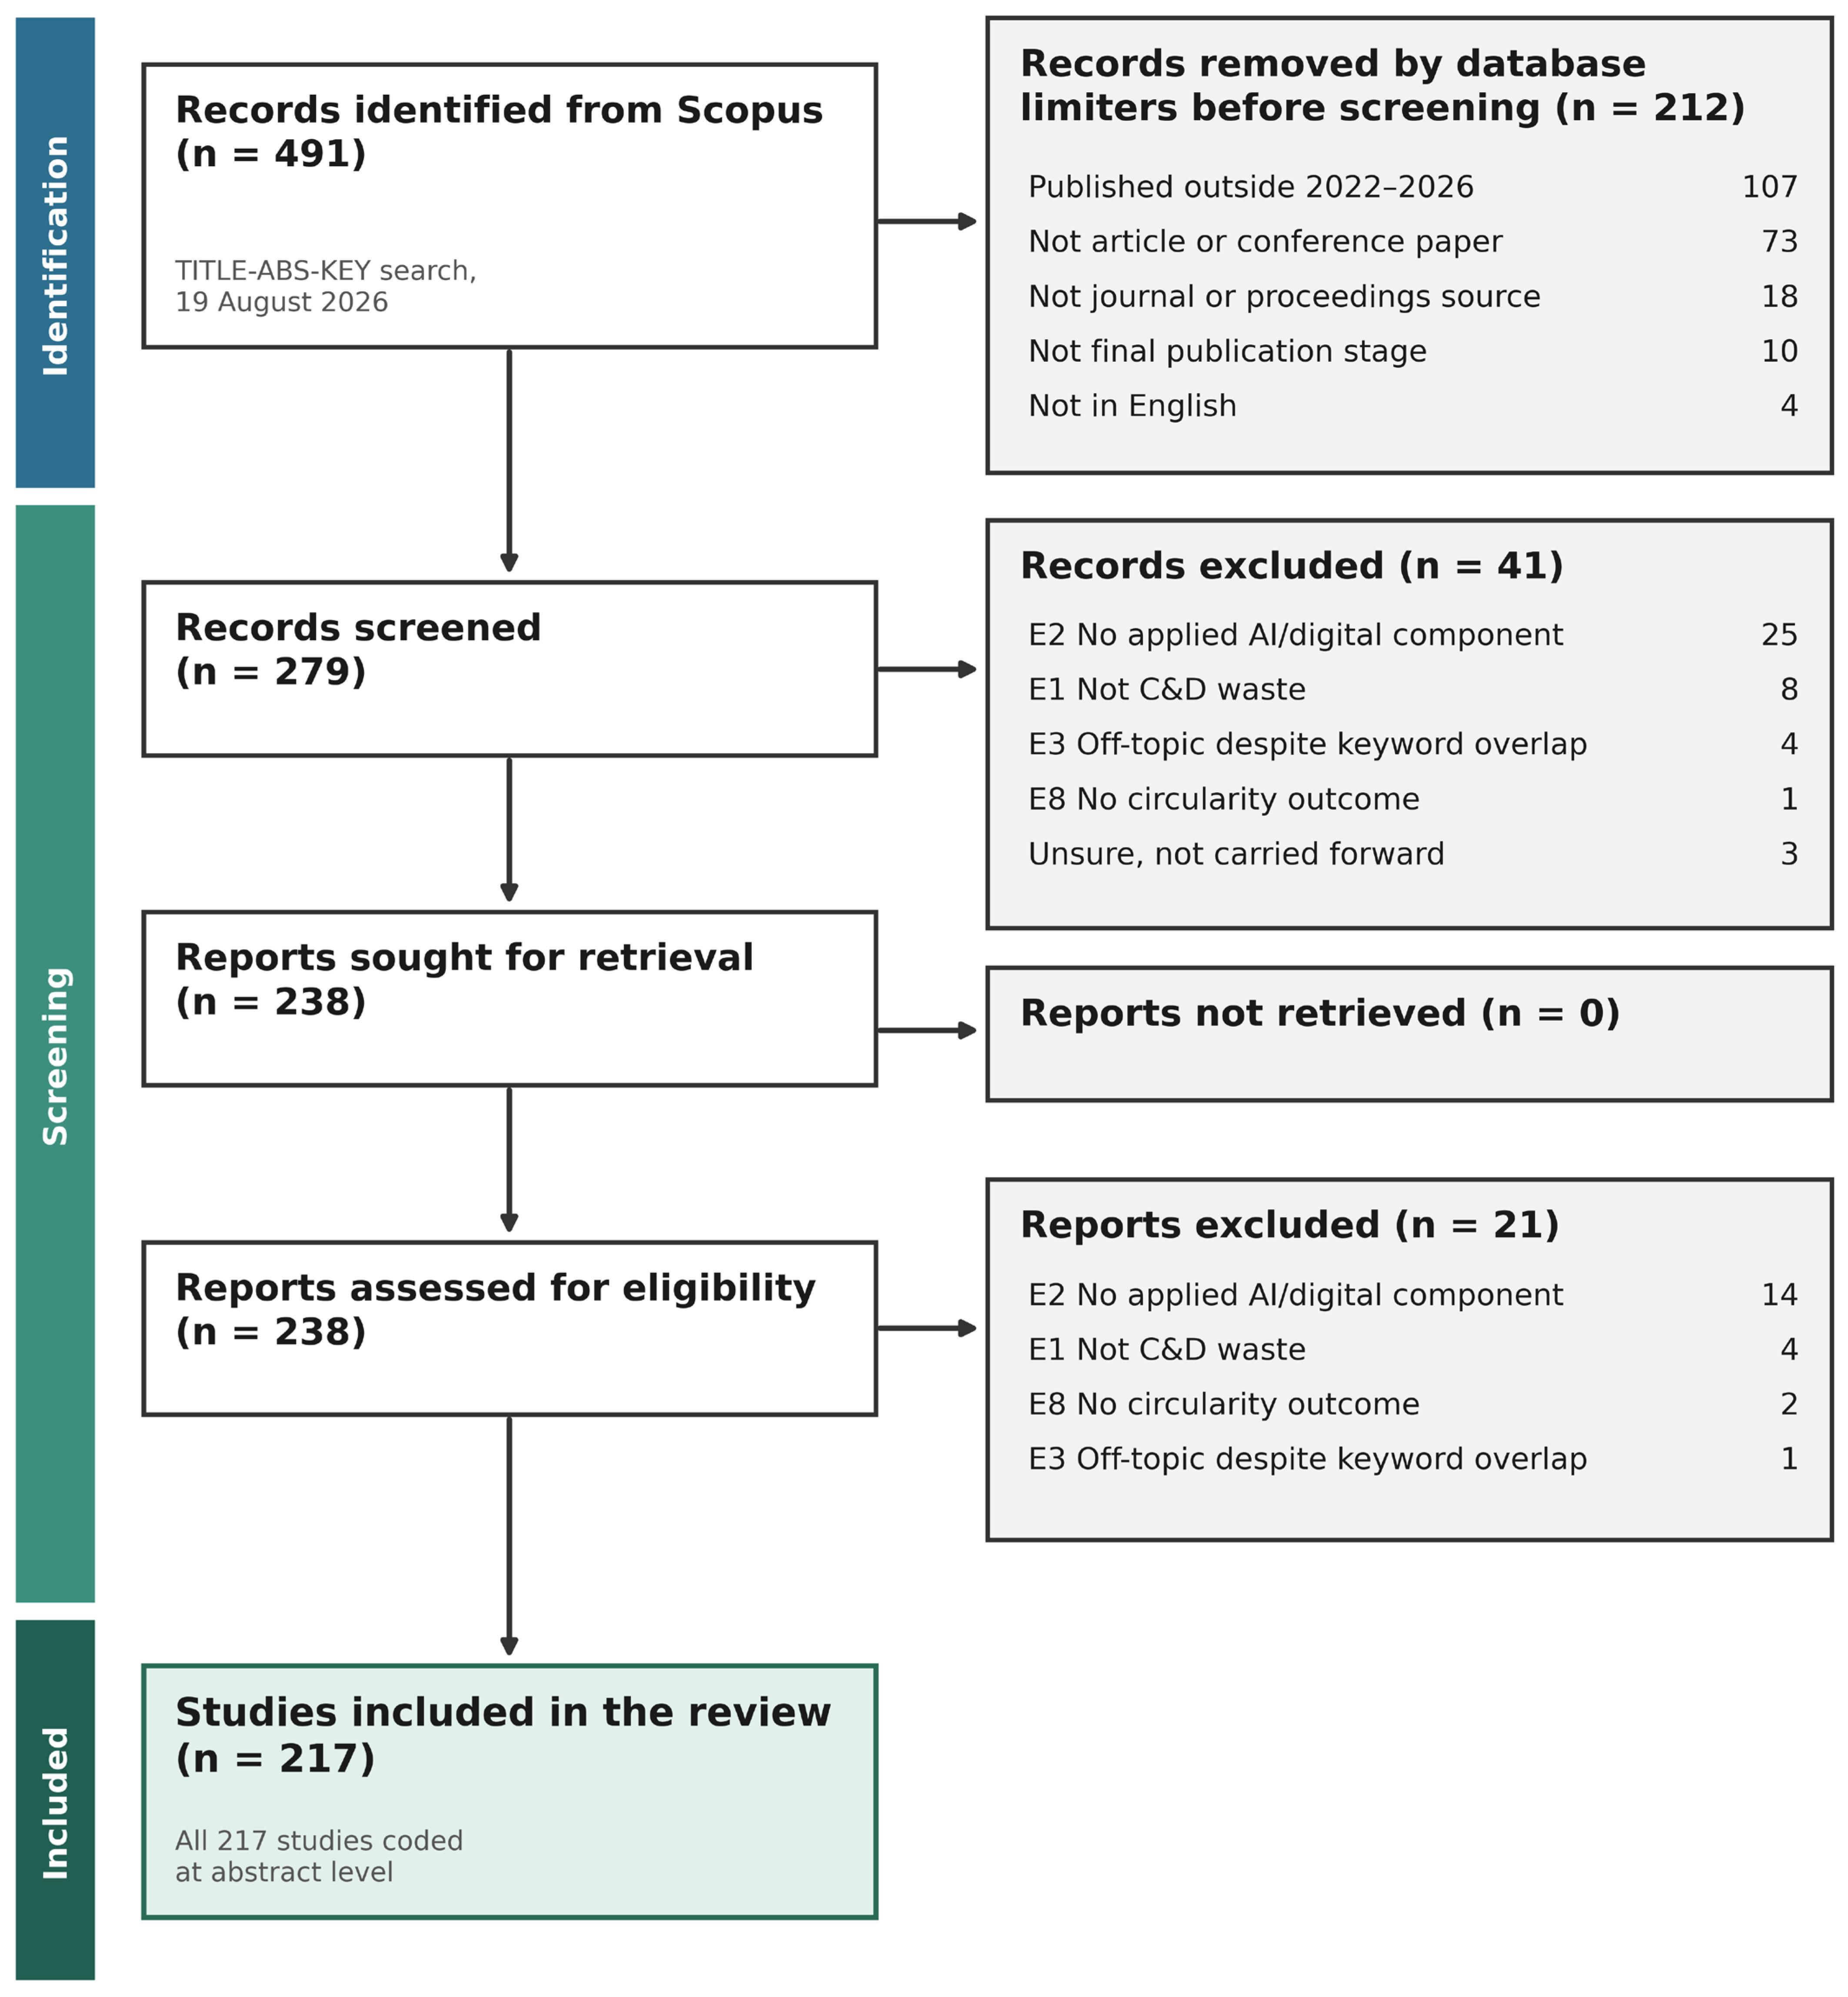
Figure 1. PRISMA 2020 flow diagram (Scopus, single database; search run on 19 August 2026).
Technologies 14 00659 g001
Figure 2. Share of each year’s records by dominant topic, eight-topic LDA model (n = 217).
Technologies 14 00659 g002
Figure 3. Bibliographic coupling network of the 89 included documents cited at least 10 times (VOSviewer). Colours show the five clusters: computer vision and deep learning classification (red), design-stage planning, digital integration and blockchain (green), waste generation prediction (blue), recycled-aggregate concrete (yellow), and material stock and BIM data (purple).
Technologies 14 00659 g003
Figure 4. Co-citation network of the 66 references cited at least 10 times by the included documents (VOSviewer). Node colours indicate the three co-citation clusters: computer vision and robotic sorting (red), BIM-based waste estimation and management practice (green), and waste generation prediction (blue). Each line takes the colour of one of the two references it connects, and line thickness reflects co-citation strength.
Technologies 14 00659 g004
Figure 5. Author–keyword co-occurrence network of the 217 included documents (VOSviewer; minimum occurrences = 2, thesaurus-merged; 13 clusters). Node colours indicate keyword clusters, and each line takes the colour of one of the two keywords it connects. Line thickness reflects how often the two keywords occur together, and line colour carries no further meaning.
Technologies 14 00659 g005
Figure 6. The integrated AI-enabled capability framework for circular C&D waste management. Thick solid arrows show associations that are statistically significant in Table 3, thin solid arrows descriptive co-occurrences (Table 2), dashed arrows relationships inferred from theory, and dotted arrows or labels P1–P6 the propositions proposed for testing.
Technologies 14 00659 g006
Table 1. Coding results for the four taxonomies (n = 217 included studies; Supplementary S8).
TaxonomyCategoryn% of Corpus
Capability enablerDigital infrastructure14667.3%
Capability enablerAI/ML technical capability13964.1%
Capability enablerGovernance capability3918.0%
Capability enablerHuman and organisational capability2913.4%
Capability enablerNot discussed41.8%
AI mechanism clusterComputer-vision-enabled sorting6530.0%
AI mechanism clusterBIM/digital twin integration6429.5%
AI mechanism clusterPredictive analytics5324.4%
AI mechanism clusterRobotics/automated sorting156.9%
AI mechanism clusterBlockchain traceability136.0%
AI mechanism clusterSimulation/system dynamics136.0%
AI mechanism clusterKnowledge graph/ontology reasoning20.9%
AI mechanism clusterOther/emergent (subtotal)8740.1%
Geospatial/remote sensing intelligence146.5%
Foundation model/generative AI104.6%
Unclassified/miscellaneous other6329.0%
Circularity outcomeMaterial/resource recovery13260.8%
Circularity outcomeWaste minimisation/diversion5224.0%
Circularity outcomeCarbon/emissions performance3013.8%
Circularity outcomeTraceability/material security2411.1%
Cross-cutting enabling conditionDecision-support performance9242.4%
Policy instrumentSubstantive policy instrument present (any)94.1%
Material passport/traceability regulation20.9%
Soft/voluntary measures10.5%
Jurisdiction-specific enforcement mechanisms41.8%
EU Waste Framework Directive 70% recovery target10.5%
Procurement mandates20.9%
Extended producer responsibility10.5%
Deconstruction ordinances00.0%
Table 2. Cross-tabulation of AI mechanism clusters against capability enablers and circularity outcomes, computed directly from the full coded dataset (Supplementary S8).
(a) Mechanism × Capability Enabler (n of The Mechanism’s Own Records that Co-Occur with Each Enabler)
Mechanism (n)Digital InfrastructureAI/ML Technical
Capability
Governance
Capability
Human and Organisational Capability
Computer-vision-enabled sorting (65)366402
BIM/digital twin integration (64)6091611
Blockchain traceability (13)112122
Predictive analytics (53)245123
(b) Mechanism × Circularity Outcome (n of the Mechanism’s Own Records that Co-Occur with Each Outcome)
Mechanism (n)Material/Resource recoveryDecision-Support performanceWaste Minimisation/DiversionCarbon/Emissions PerformanceTraceability/Material Security
Computer-vision-enabled sorting (65)5715533
BIM/digital twin integration (64)373331138
Blockchain traceability (13)92029
Predictive analytics (53)1536981
(c) Capability Enabler × Traceability/Material Security Outcome (Corpus-Wide, not Restricted to a Single Mechanism)
Capability Enabler (n)Co-Occurs with Traceability/Material Security Outcome% of the Enabler’s Own Records
Governance capability (39)1846.2%
Corpus-wide baseline2411.1% (of all 217)
All cells above are exact tallies from the 217-record coded dataset, and row and column totals are internally consistent with Table 1.
Table 3. Statistical tests of association between enablers, mechanisms, and outcomes (n = 217 throughout; associations within the coded literature, not causal effects; all p < 0.001 remain <0.001 after Holm–Bonferroni adjustment; Fisher’s exact test used where any 2 × 2 cell count fell below 5, otherwise chi-square with Yates’ continuity correction).
#Enabler/MechanismOutcome/MechanismTestStatisticpφInterpretation
1Governance capabilityBlockchain traceability (mech.)Fisher’s exactOR = 78.67<0.0010.489Large effect
2AI/ML technical capabilityCV-enabled sorting (mech.)Fisher’s exactOR = 65.71<0.0010.469Large effect
3Digital infrastructureBIM/digital twin (mech.)Fisher’s exactOR = 11.69<0.0010.365Medium–large
4Governance capabilityTraceability outcomeChi-squarechi-sq. (1) = 55.26<0.0010.524Large effect
5Blockchain traceability (mech.)Traceability outcomeFisher’s exactOR = 28.35<0.0010.468Large effect
6Predictive analytics (mech.)Decision-support outcomeChi-squarechi-sq. (1) = 17.36<0.0010.294Small–medium
7CV-enabled sorting (mech.)Recovery outcomeChi-squarechi-sq. (1) = 26.52<0.0010.360Medium effect
8Human and organisational capabilityGovernance capabilityChi-squarechi-sq. (1) = 1.410.2350.098Not significant
Table 4. Key findings at a glance.
FindingEvidenceImplication for ResearchImplication for Practice
Research attention concentrates on technical capabilityDigital infrastructure 67.3% and AI/ML technical capability 64.1% of studies vs. governance 18.0% and human/organisational 13.4% (Section 3.2); no governance or organisational term among recurring keywords (Section 3.1.4)Code organisational variables from full texts; design adoption studies, not only algorithm studiesBudget for governance, skills, and process change alongside technical pilots
AI mechanisms specialise in particular outcomesComputer vision sorting with recovery (57 of 65); predictive analytics with decision support (36 of 53); blockchain with traceability (9 of 13) (Table 2 and Table 3)Report outcomes beyond a mechanism’s typical
one; link decision support
to measured physical
outcomes
Match the mechanism to the circularity goal (recovery, traceability, or planning)
Traceability is the least-examined outcome and is linked to governanceTraceability in 11.1% of all studies but 46.2% of governance capability studies (Table 2; φ = 0.52)Study traceability jointly with governance arrangements, such as data
standards and material passports
Pair traceability technology with data-sharing agreements and regulatory recognition
Decision support often stands in for physical outcomesDecision-support performance reported in 42.4% of studies (Section 3.4)Follow decisions through to measured recovery,
diversion, or emissions
Evaluate AI tools on physical outcomes, not forecast accuracy alone
New mechanisms are emergingGeospatial (14) and foundation model/generative AI (10) studies, 16
of the 24 from 2025–2026 (Section 3.3); robotics, system dynamics, and LLMs are the newest keywords (Section 3.1.4)
Track these clusters in
future updates, for example with seeded topic models
Pilot tools that integrate with existing BIM and GIS systems first
Policy engagement
is thin
4.1% of studies discuss a substantive policy instrument (Section 3.6)Link adoption studies to specific instruments and
jurisdictions
Treat policy lessons as exploratory (Section 5.2)
Table 5. Research agenda for testing the propositions.
PropositionKey ConstructsLevel of AnalysisSuggested Design
P1Technical maturity of the AI mechanism; governance and workforce investment; breadth and duration of operational useOrganisation or project portfolioMultiple-case study or panel survey of contractors and recyclers using computer vision sorting
P2Blockchain traceability deployment; governance arrangements (data standards, regulatory recognition); share of materials with verified provenanceSupply chain or inter-organisational networkComparative case study across jurisdictions with and without material passport regulation
P3Use of predictive or simulation tools; decision quality (planning, policy choice); recovery and diversion ratesProject or municipalityMediation analysis of project-level or municipal panel data
P4Institutional and regional context; firm size; timing and extent of adoptionFirmCross-national survey stratified by firm size; event-history analysis of adoption
P5Compatibility with existing BIM/GIS platforms; infrastructure investment required; speed of diffusionOrganisation or sectorLongitudinal adoption tracking and diffusion modelling
P6Decision-support performance; transforming capabilities; physical circularity outcomesProject or organisationModerated regression or fuzzy-set qualitative comparative analysis of project data
Table 6. Comparison with closely related prior reviews.
ReviewScope and
Period
Sources and MethodOrganising LogicMain ConclusionsWhat the Present Review Adds
Oluleye et al. [15]AI for systemic circularity in construction; 30 studies, 2018–2022PRISMA systematic review; content analysis; SWOTBuilding product lifecycle; 13 application domainsAI supports sorting, material selection, design for disassembly, and reverse logistics; integration barriers remainOrganisational capability lens; 217 studies, 2022–2026; tested enabler–mechanism–outcome associations
Gao et al. [12]Machine learning in C&D waste management; 98 journal articles, 2012–2023Systematic review; Web of Science, Scopus, Google ScholarManagement stage: generation, on-site handling, transportation, disposalMachine learning models are effective across processes; rapid growth in 2021–2022Links mechanisms to capability enablers and circularity outcomes rather than to process stage; covers BIM, blockchain, and emergent mechanisms
Dodampegama
et al. [13]
AI and robotics for C&D waste sorting; 132 papers, 2000–2023Bibliometric and scientometric analysis with content reviewSix research questions on sorting (data, sensors, learning, robotics)Few AI-enabled robotic sorting systems; scarce public datasetsPlaces sorting within a wider set of mechanisms; shows sorting studies almost never address governance or organisational capability
Rodrigo et al. [17]Digital technologies for circular construction;
365 publications
Bibliometric analysis, text mining, and content
analysis
Eight technologies in two clusters; implementation barriersDigital technologies have strong potential for waste management and circularity; barriers identifiedExplains barriers through dynamic capabilities and diffusion of innovation; identifies traceability as an outcome linked to governance
Chen et al. [16]Circular economy strategies in construction supply chains; 61 publications over 10 yearsSystematic review with iterative codingFive supply chain phases; internal and external driversBIM and material tracking are internal drivers, legislation and incentives are external drivers; logistics optimisation is under-studiedFocuses on AI mechanisms and the capability conditions for adopting them
Khakbazan
et al. [18]
AI-driven innovation in the circular economy across sectors; 691 records, 2012–2024Bibliometric analysis (Web of Science)Intellectual structure and collaboration networksResearch is fragmented across disciplinesConstruction-specific; combines bibliometrics with topic modelling, rubric-based coding, and statistical tests
Disclaimer/Publisher’s Note: The statements, opinions and data contained in all publications are solely those of the individual author(s) and contributor(s) and not of MDPI and/or the editor(s). MDPI and/or the editor(s) disclaim responsibility for any injury to people or property resulting from any ideas, methods, instructions or products referred to in the content.