Article

Real-Time Prediction of Foot Placement and Step Height Using Stereo Vision Enhanced by Ground Object Awareness

1
Department of Mechanical Engineering, Chung-Ang University, 84 Heukseok-ro, Dongjak-gu, Seoul 06974, Republic of Korea
2
HUROTICS Inc., Seoul 06974, Republic of Korea
*
Authors to whom correspondence should be addressed.
These authors equally contributed to this work.
Technologies 2025, 13(9), 399; https://doi.org/10.3390/technologies13090399
Submission received: 23 July 2025 / Revised: 30 August 2025 / Accepted: 1 September 2025 / Published: 3 September 2025

Abstract

Foot placement position (FP) and step height (SH) are needed to control walking-assistive systems on uneven terrain. This study proposes a novel model that predicts FP and SH before a user takes a step. The model uses a stereo vision system mounted on the upper body and adapts to various terrains by incorporating foot motions and terrain object information. First, FP was predicted by visually tracking foot positions and was corrected based on the types and locations of objects on the ground. Then, SH was estimated using depth maps captured by an RGB-D stereo camera. To predict SH, several RGB-D frames were considered with homography, feature matching, and image transformation. The results show that the heatmap trajectory improved FP prediction on the flat-walking dataset, reducing the root mean square error of FP from 20.89 to 17.70 cm. Furthermore, incorporating object preference significantly improved FP prediction, resulting in an accuracy improvement from 52.57% to 78.01% in identifying the object a user stepped on. The mean absolute error of SH was calculated to be 7.65 cm in scenes containing rocks and puddles. The proposed model can enhance the control of walking-assistive systems in complex environments.

1. Introduction

Walking-assistive systems have the potential to assist hikers carrying heavy loads on uneven terrains [1,2,3]. Controlling assistive systems in environments with varying elevations due to rocks, trees, and slopes is significantly challenging [4]. To consider walking motion on uneven terrains, foot placement position (FP) and step height (SH) are required. FP represents the location where the swing foot lands upon ground contact, as shown in Figure 1. SH refers to the height difference between the supporting foot and the future FP of the moving foot. For example, when a user walks on flat ground, SH is always zero. If the user is ascending the stairs, SH equals the stair height. To enhance the efficiency of assistive systems in uneven terrain, they should be controlled according to the SH. For SH prediction, the assisting system must predict the FP of the moving foot. Then, the SH can be estimated by calculating the FP height. Next, the system controls its assisting force to step up (or down) the predicted SH.
Terrain information is essential for a more accurate FP prediction because walking motions are significantly influenced by the characteristics of the terrain. Terrain information can be indirectly recognized by measuring body movements using inertia measure units (IMUs) [5,6] and electromyography (EMG) [7]. For example, Su et al. [5] attached IMUs to the thighs, shanks, and ankles. Sensor signals collected during the early swing phase were analyzed using a convolutional neural network (CNN) to classify the following motions: level walking, stair ascent/descent, ramp ascent/descent, and transitional states between these steady states.
Vision sensors outperform IMU and EMG when classifying various terrain types. Kurbis et al. [8] classified flat ground and stairs by using a CNN trained with RGB images captured by an on-body camera. Laschowski et al. [9] developed a CNN-based model trained with chest-mounted RGB images to classify three walking environments (i.e., level ground, inclined staircases, and declined staircases) with 94.85% accuracy. Pham et al. [10] used an RGB-D sensor attached to a user’s body and processed point-cloud data using a Random Sample Consensus (RANSAC) algorithm to classify the environmental context. Qian et al. [11] analyzed walking modes using a CNN trained on 3D point-cloud data obtained from an RGB-D camera to classify five terrain types.
However, the terrain classification approach has limitations in irregular environments. Moreover, controlling wearable robots based on the simple terrain classification limits their applicability in uneven and complex terrains. Thus, FP prediction is needed to effectively assist users because SH can be estimated from the FP. Lee et al. [12] used three IMUs attached to the feet and body for FP prediction. Several features including acceleration, orientation, velocity, displacement, and gait phase were extracted from the IMU signals. These features were used to train a recurrent neural network (RNN)-based model. Finally, the three-dimensional (3D) FP was predicted with a mean distance error of 5.93 ± 1.69 cm. Although they successfully predicted FP, the model was tested on terrains with small variability such as flat ground and stairs. Xiong et al. [13] predicted FP by training a CNN with IMU signals and gait phases. Then, FP prediction uncertainty was modeled using a two-dimensional Gaussian distribution. Next, steep regions in the terrain were identified by obtaining the height map gradients using an RGB-D camera. Although these methods can obtain the terrain geometry, they cannot consider semantic information. Furthermore, IMU signals cannot respond to sudden changes in terrain because of their low signal-to-noise ratio. Li et al. [14] utilized a user’s gaze for FP prediction. They assumed that users always stepped on objects on the terrain. An object inside the gaze region was determined to be an FP. However, this approach is available only when the user’s gaze is directed toward the FP. In addition, previous studies focused on predicting FP and did not consider SH, which is essential for wearable robot control.
To overcome these limitations, a new step prediction model was developed in this study. The main contributions can be summarized as follows:
  • FP was predicted using a stereo camera and a camera-mounted IMU, without additional IMU or EMG sensors attached to the lower limbs, to minimize hardware and model complexity.
  • SH was estimated from the FP height using an RGB-D stereo camera, which is essential for wearable robot control on irregular terrains.
  • Both lower-limb motion and the environmental information were extracted from on-body RGB-D images and considered to increase FP prediction accuracy.
  • Real-time inference was evaluated using an embedded system to verify its practical applicability.
The remainder of this paper is organized as follows. Section 2 presents a detailed description of the FP and SH prediction model. Section 3 describes the experiments conducted and data acquisition process. Section 4 presents the model prediction results, including the effects of the trajectory heatmap and object detection on FP errors and SH prediction in elevation-varying environments. Section 5 presents a summary, the study’s limitations, and future prospects.

2. Materials and Methods

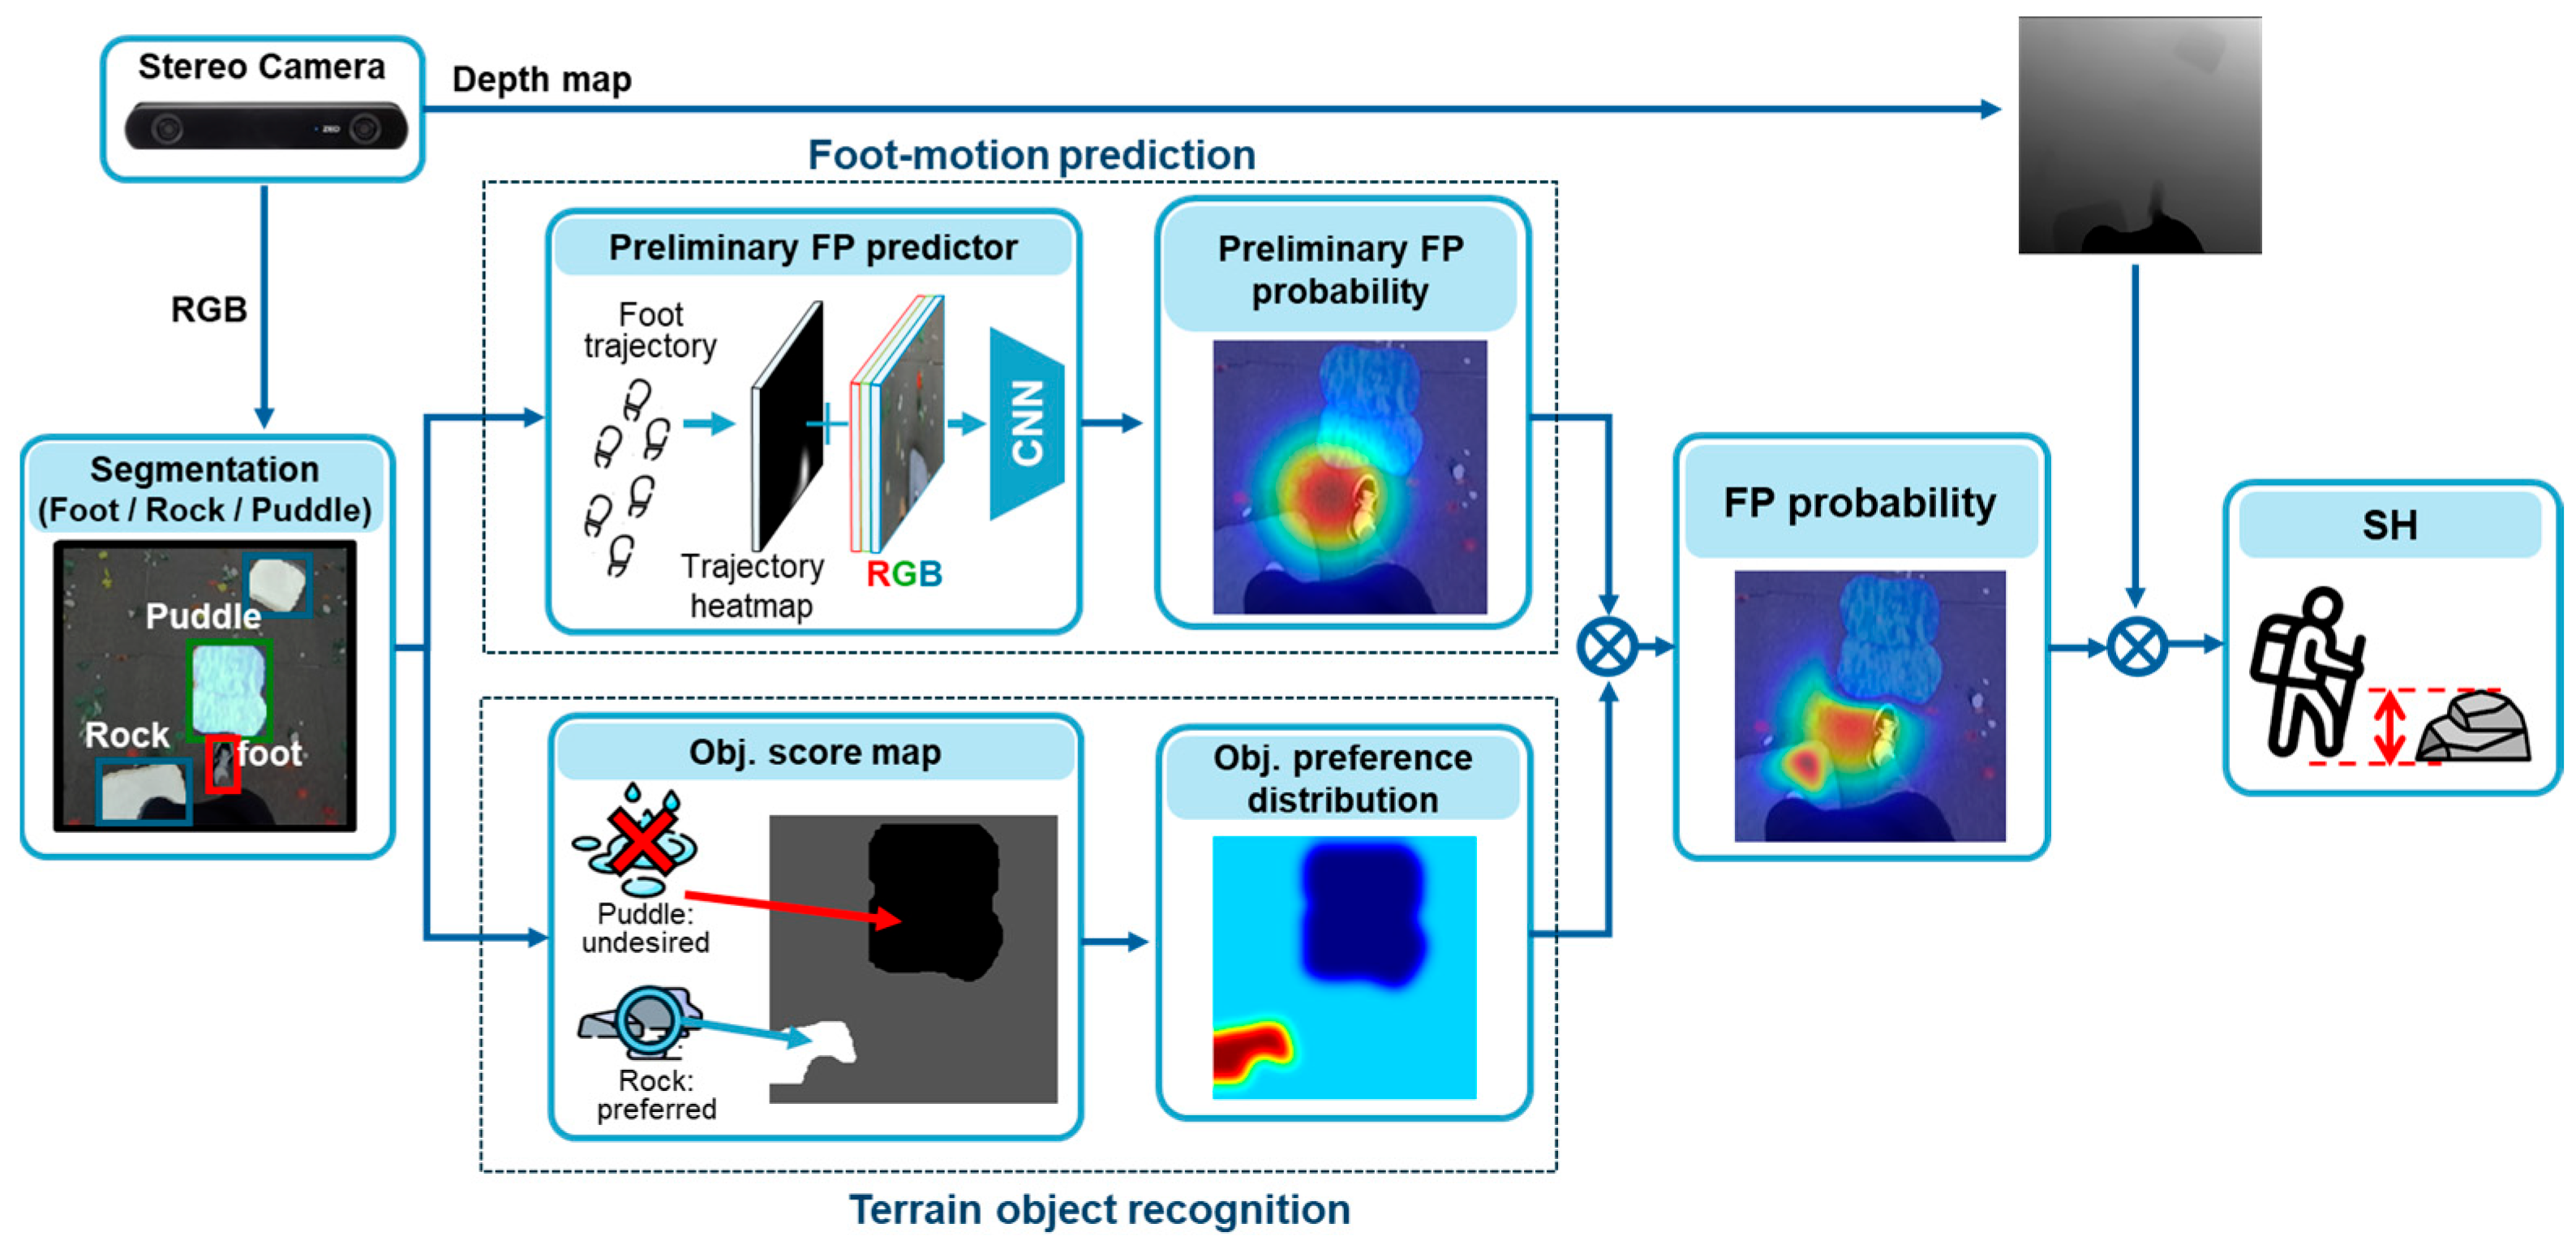
The proposed model predicts foot motion, recognizes objects on the terrain, calculates the FP probability, and estimates the SH, as shown in Figure 2. Initially, an RGB image and a depth map are captured using an RGB-D stereo camera (Stereolabs, ZED 2i, San Francisco, CA, USA). The feet and ground objects in the RGB image are simultaneously detected using Yolo-v8s Seg [15]. The bounding box of the feet is used as input for the FP prediction network. A foot-trajectory heatmap is created using the foot-position history combined with the current RGB image. This four-channel input is fed into the CNN for FP prediction. Subsequently, an FP probability distribution is generated. The object segmentation results of the RGB image are fed into the environment-recognition network. An environmental score map can be created using score values determined based on human preferences. For example, humans tend to step on flat rocks while avoiding puddles. Note that FP prediction and environment recognition are computed in parallel to reduce latency. Subsequently, the FP probability is corrected using an environmental score map. The final FP is determined as the point at which the FP probability reaches its maximum value. Finally, the SH of the final FP is calculated via homography. Foot-motion prediction, terrain object recognition, FP probability, and SH calculation are described in detail in Section 2.1, Section 2.2, Section 2.3, Section 2.4, respectively.

2.1. Foot-Motion Prediction

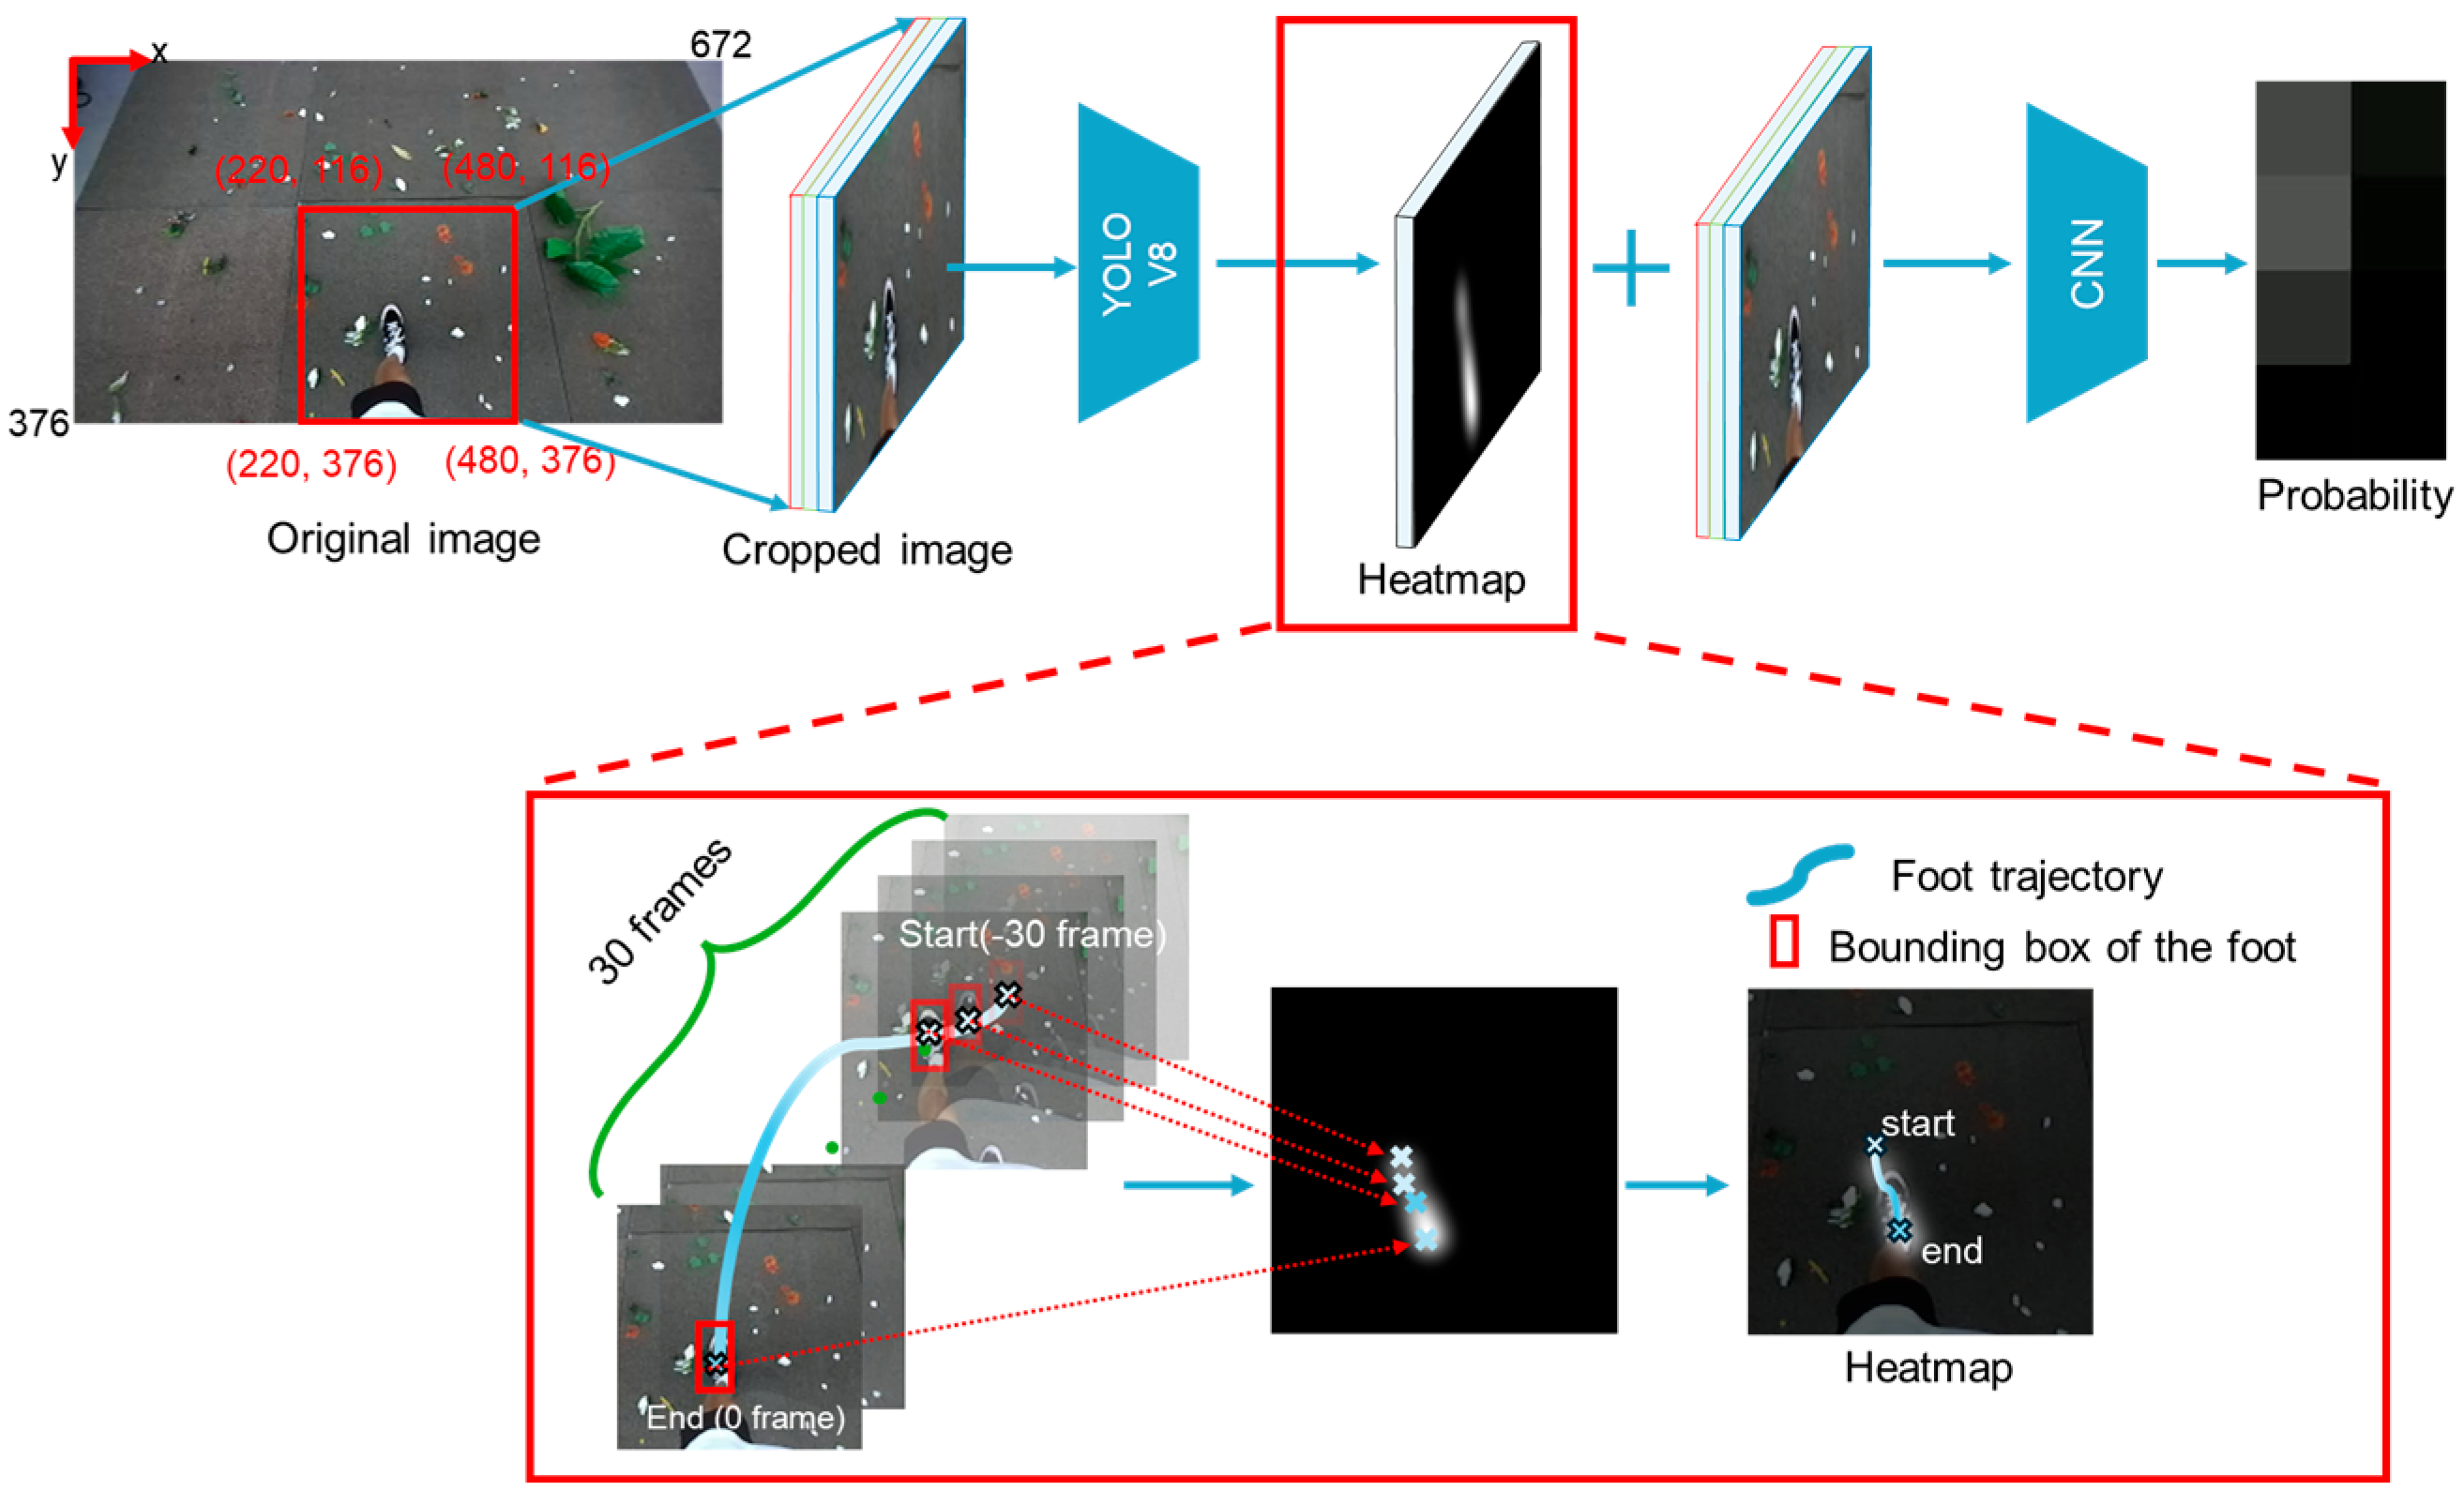
For robust FP prediction, a trajectory heatmap and grid-based classification were used. First, the trajectory heatmap can improve the FP prediction accuracy because it contains a history of foot motion. A heat map was created using the following procedure. Initially, the RGB image was cropped to 260 × 260 pixels because the feet and legs remain in this region, as shown in Figure 3. The computational cost can be reduced by focusing on this region instead of on the full image. To capture walking motion on uneven terrain, the trajectory was created using the center of the foot bounding box over the last 30 frames, corresponding to 2.4 s of foot motions. Because this window size consistently contains at least one stride, it can provide sufficient foot-trajectory information for FP prediction. Furthermore, sequential information on foot positions was represented in the heatmap by assigning different pixel values to past foot positions. Specifically, a grayscale image was created, and the default pixel value was set to zero. The pixel value was set to 255 if the pixel corresponded to the current foot position. The pixel value was set to 8.5 if the pixel corresponded to the position 2 s before. The values at the other timesteps were linearly interpolated between 255 and 8.5. Subsequently, a Gaussian filter was applied to finalize the heatmap. Finally, a four-channel matrix stacking the heat map and RGB image was used as the input for the FP predictor.
Grid-based classification was used for FP because the prediction was unreliable when the position was directly regressed. Instead, a regression approach based on the classification results was used to obtain a more accurate regression outcome [16]. A 4 × 2 grid was used to improve separability and class balance. The two columns are useful to discern left and right foot motion. Two columns were used to balance the sideway foot placement (FP) distribution. Along the longitudinal axis, entropy values were obtained as 0.8222, 0.831, 0.827, and 0.827 for the 3 × 2, 4 × 2, 5 × 2, and 6 × 2 grids, respectively. This indicates that the four rows provide balanced distribution, reducing unbalancing problems for classification. Accordingly, MobileNet-v2 [17] was trained to classify eight classes corresponding to a 4 × 2 grid, as shown in Figure 4. FP (i.e., x c and y c ) was calculated as follows:
x c = i = 0 7 p i · x c e l l , i , y c = i = 0 7 p i · y c e l l , i ,
where p i is the i t h cell probability obtained from the grid-based classification result; x c e l l , i and y c e l l ,   i represent the center position of the i t h cell.
When a user takes a step, the predicted FP can change due to the environment and the user’s intention. To model this uncertainty, the probability P F P was modeled using a Gaussian distribution as follows:
P F P ( x , y ) =   1 2 π σ x σ y e x x c 2 2 σ x     ( y y c ) 2 2 σ y ,
where σ x   and   σ y are the variances along x and y, respectively. Because the variation along the walking direction is more significant than that along the perpendicular direction, σ x was set to 83.5, which is 1/4.5 of the vertical size of the image, and σ y was set to 112, which is 1/6 of the vertical size of the image.

2.2. Terrain Object Recognition

Objects on the ground can affect the FP and walking motion. For example, users prefer to step on stones and hard roots to avoid slippery spots, whereas holes, mud, and puddles are undesirable. To consider this environmental information, objects were segmented from the RGB image using Yolo-v8s Seg. In this study, rocks and puddles were regarded as preferred and undesired objects, respectively. Because users are unlikely to step on the edges of rocks, the rock boundaries were shrunk, as shown in Figure 5. Similarly, since users tend to avoid stepping near puddles, the puddle boundaries were expanded. As the FP corresponds to the center of the foot, the amount of shrinkage and expansion should be set to half the foot size. Considering that foot sizes range from 22 and 28 cm, the shrinkage and expanding size should be 11–14 cm. The sizes of the rocks and puddles used in the experiments are approximately 43 and 112 cm. Thus, the rock boundary shrank by 30%, while the puddle boundary expanded by 10%. A score map was created by assigning preference scores of 2, 1, and 0.01 to the image pixels of rocks, ground, and puddles, respectively. These score values were empirically determined. If the rock score is too high, the model can select the rock as the FP even when the foot is moving away from it. The puddle score is very small but not zero because users can step on the puddle to maintain their body balance.

2.3. FP Probability

FP is affected by walking motion and object preference. Therefore, in this study, the FP probability was computed using the Hadamard product of the preliminary FP distribution and the object preference distribution, as shown in Figure 2. The pixel with the highest probability was selected as the final FP prediction.

2.4. SH Calculation

To compute SH, the FP and supporting foot height are required, as shown in Figure 1. A 3D displacement vector r u from the camera to the FP (or the supporting foot), represented in a fixed frame with a vertically aligned z-axis, was calculated as:
r u =   d R 1 K 1 r i m g ,
where R represents the rotation matrix of the camera orientation, which measured using the IMU attached to the camera. K and d are the camera matrix, and depth, respectively. r i m g is 3D vector consisting of the 2D position in the image and a homogeneous coordinate of 1.
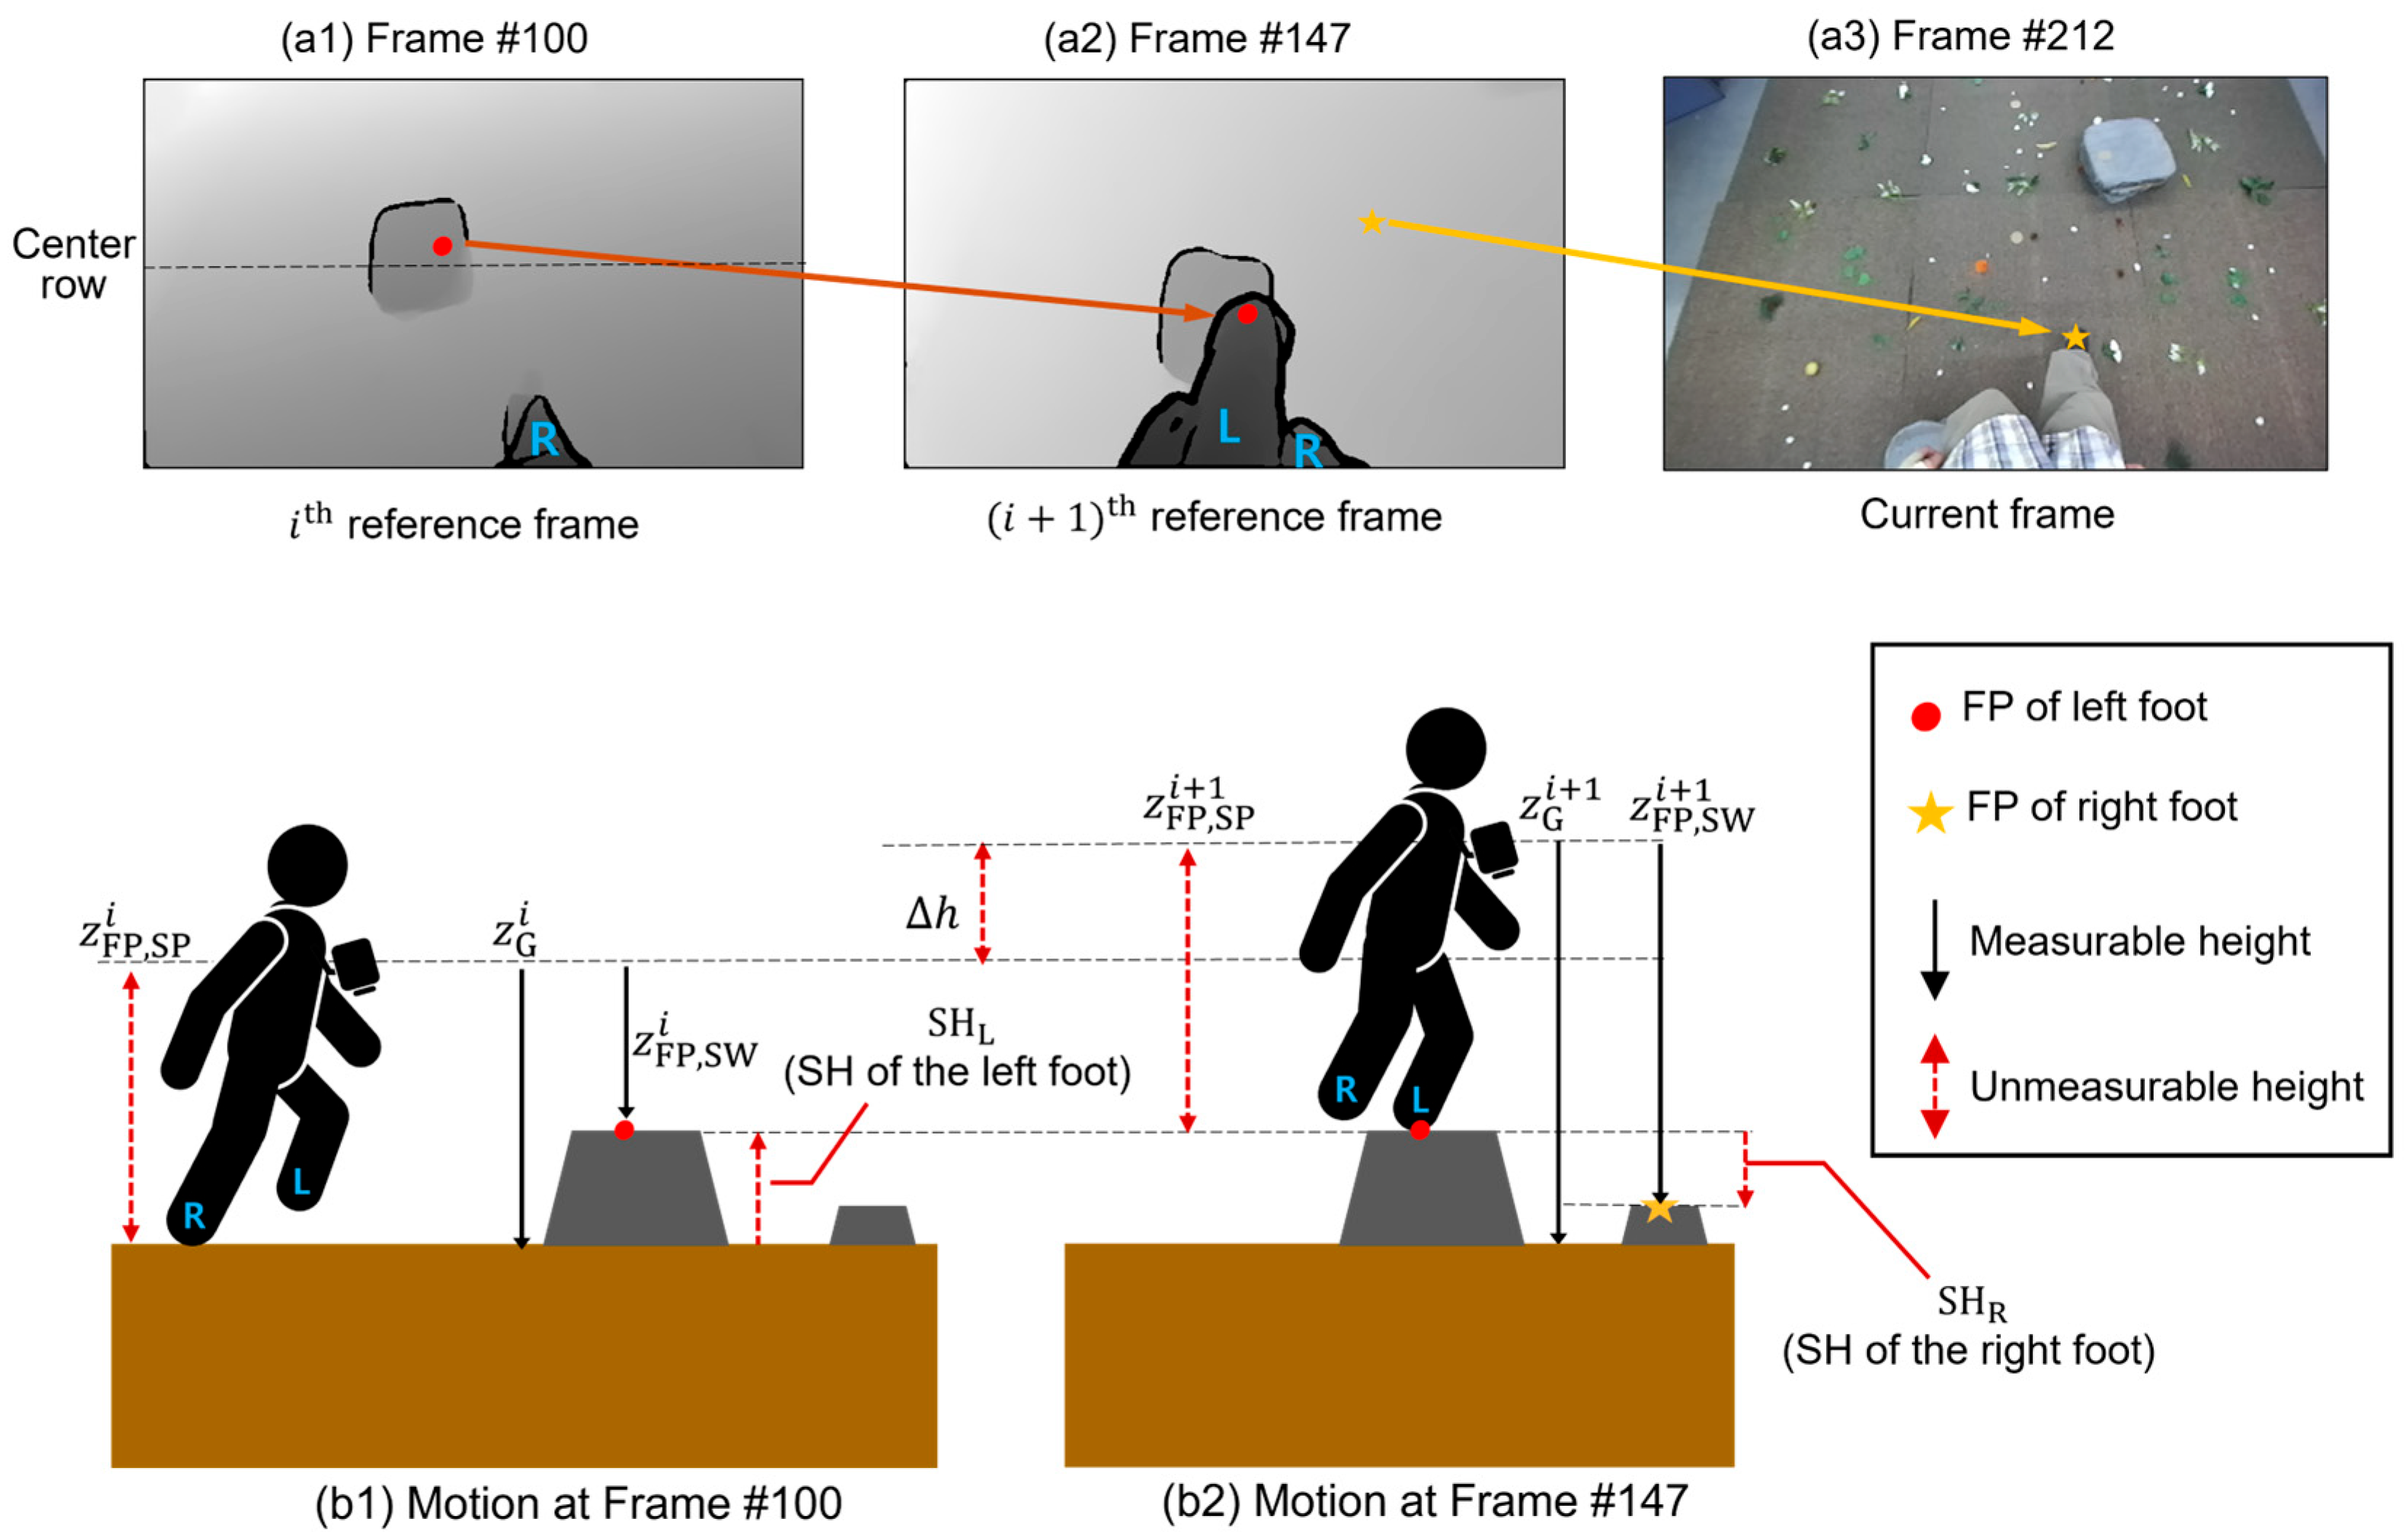
Calculating the SH in a single image frame is difficult because the FP of the swing and supporting feet are often occluded by the user’s lower limbs in some frames. To address this issue, a “reference frame” technique was developed. When a user takes steps on the ground (or on objects), the corresponding image is designated as a reference frame. The stepping time was detected when the FP point transitions between columns of the 4 × 2 FP grid, since each column corresponds to each foot’s FP (left or right). Figure 6 shows an example of how a reference frame can be used. Figure 6(a1) shows an image captured by the on-body camera when the user takes a step on the ground using the right limb. This frame can be saved as the reference frame, i.e., the i t h reference frame in this example. At this point, the FP of the left foot, indicated by the red dots in Figure 6(a1), is clearly visible. Therefore, the S H L of the swing foot (i.e., the left foot in this case) can be calculated as follows:
S H L = z F P , S W i z F P , S P i ,
where z F P , S P i and z F P , S W i are the heights from the camera to the supporting and swing feet, respectively.
When the swing foot approaches the ground (or an object), the FP is often occluded by the swing foot, as shown in Figure 6(a3). Therefore, direct z F P , S W i measurement from the depth map is infeasible. To address this issue, the FP was retrieved from the reference frame in which it was not occluded. Through this process, z F P , S W can be estimated even in the presence of occlusions.
Although z F P , S W i can be measured from the depth map of the i t h reference frame, z F P , S P i cannot be measured because the FP of the supporting foot is occluded. The method used to obtain z F P , S P i is described later (in the next paragraph). Subsequently, when the user places their left foot on a rock, as shown in Figure 6(a2,b2), the image is designated as the ( i + 1 ) t h reference frame. The S H R of the swing foot (i.e., the right foot in this case) can then be calculated as
S H R = z F P , S W i + 1 z F P , S P i + 1 = z F P , S W i + 1 Δ h + z F P , S W i = z F P , S W i + 1 ( z G i z G i + 1 ) + z F P , S W i ,
where z G i is the distance from the ground to the camera in the i t h reference frame, as shown in Figure 6(b1). As the FP of the supporting foot is occluded, the z F P , S P i + 1 is not measurable in this image. Therefore, this value should be calculated using z G i , z G i + 1 , and z F P , S W i , as in (5). To compute z G i , the height values of the pixels in the center row, indicated by the dotted line in Figure 6(a1), are collected. Subsequently, z G i is determined as the median value among the heights because the median value is likely to be the height from the ground to the camera, even when several objects exist on the ground.
Note that z F P , S W i is measured as the height of the predicted FP before the step was performed. After the stepping is complete, the FP of the foot can be corrected to the actual step point. Therefore, to increase the SH accuracy, z F P , S W i is updated with the actual step point after the stepping is complete. In particular, the FP of the foot is corrected, and its height is obtained from the previous reference frame because the FP is occluded in the current reference frame (i.e., the reference frame after the stepping is complete). A transformation between the frames is required to extract the height from the reference frame. The ORB algorithm [18] was used for this purpose because of its fast and accurate calculation process. Although other algorithms (e.g., SIFT and SURF) offer greater accuracy and robustness, they are unsuitable for this system, which requires real-time SH estimation. z F P , S P i in (4) can be calculated using z G i 1 , z G i , and z F P , S W i 1 and the approach used to obtain z F P , S P i + 1 .
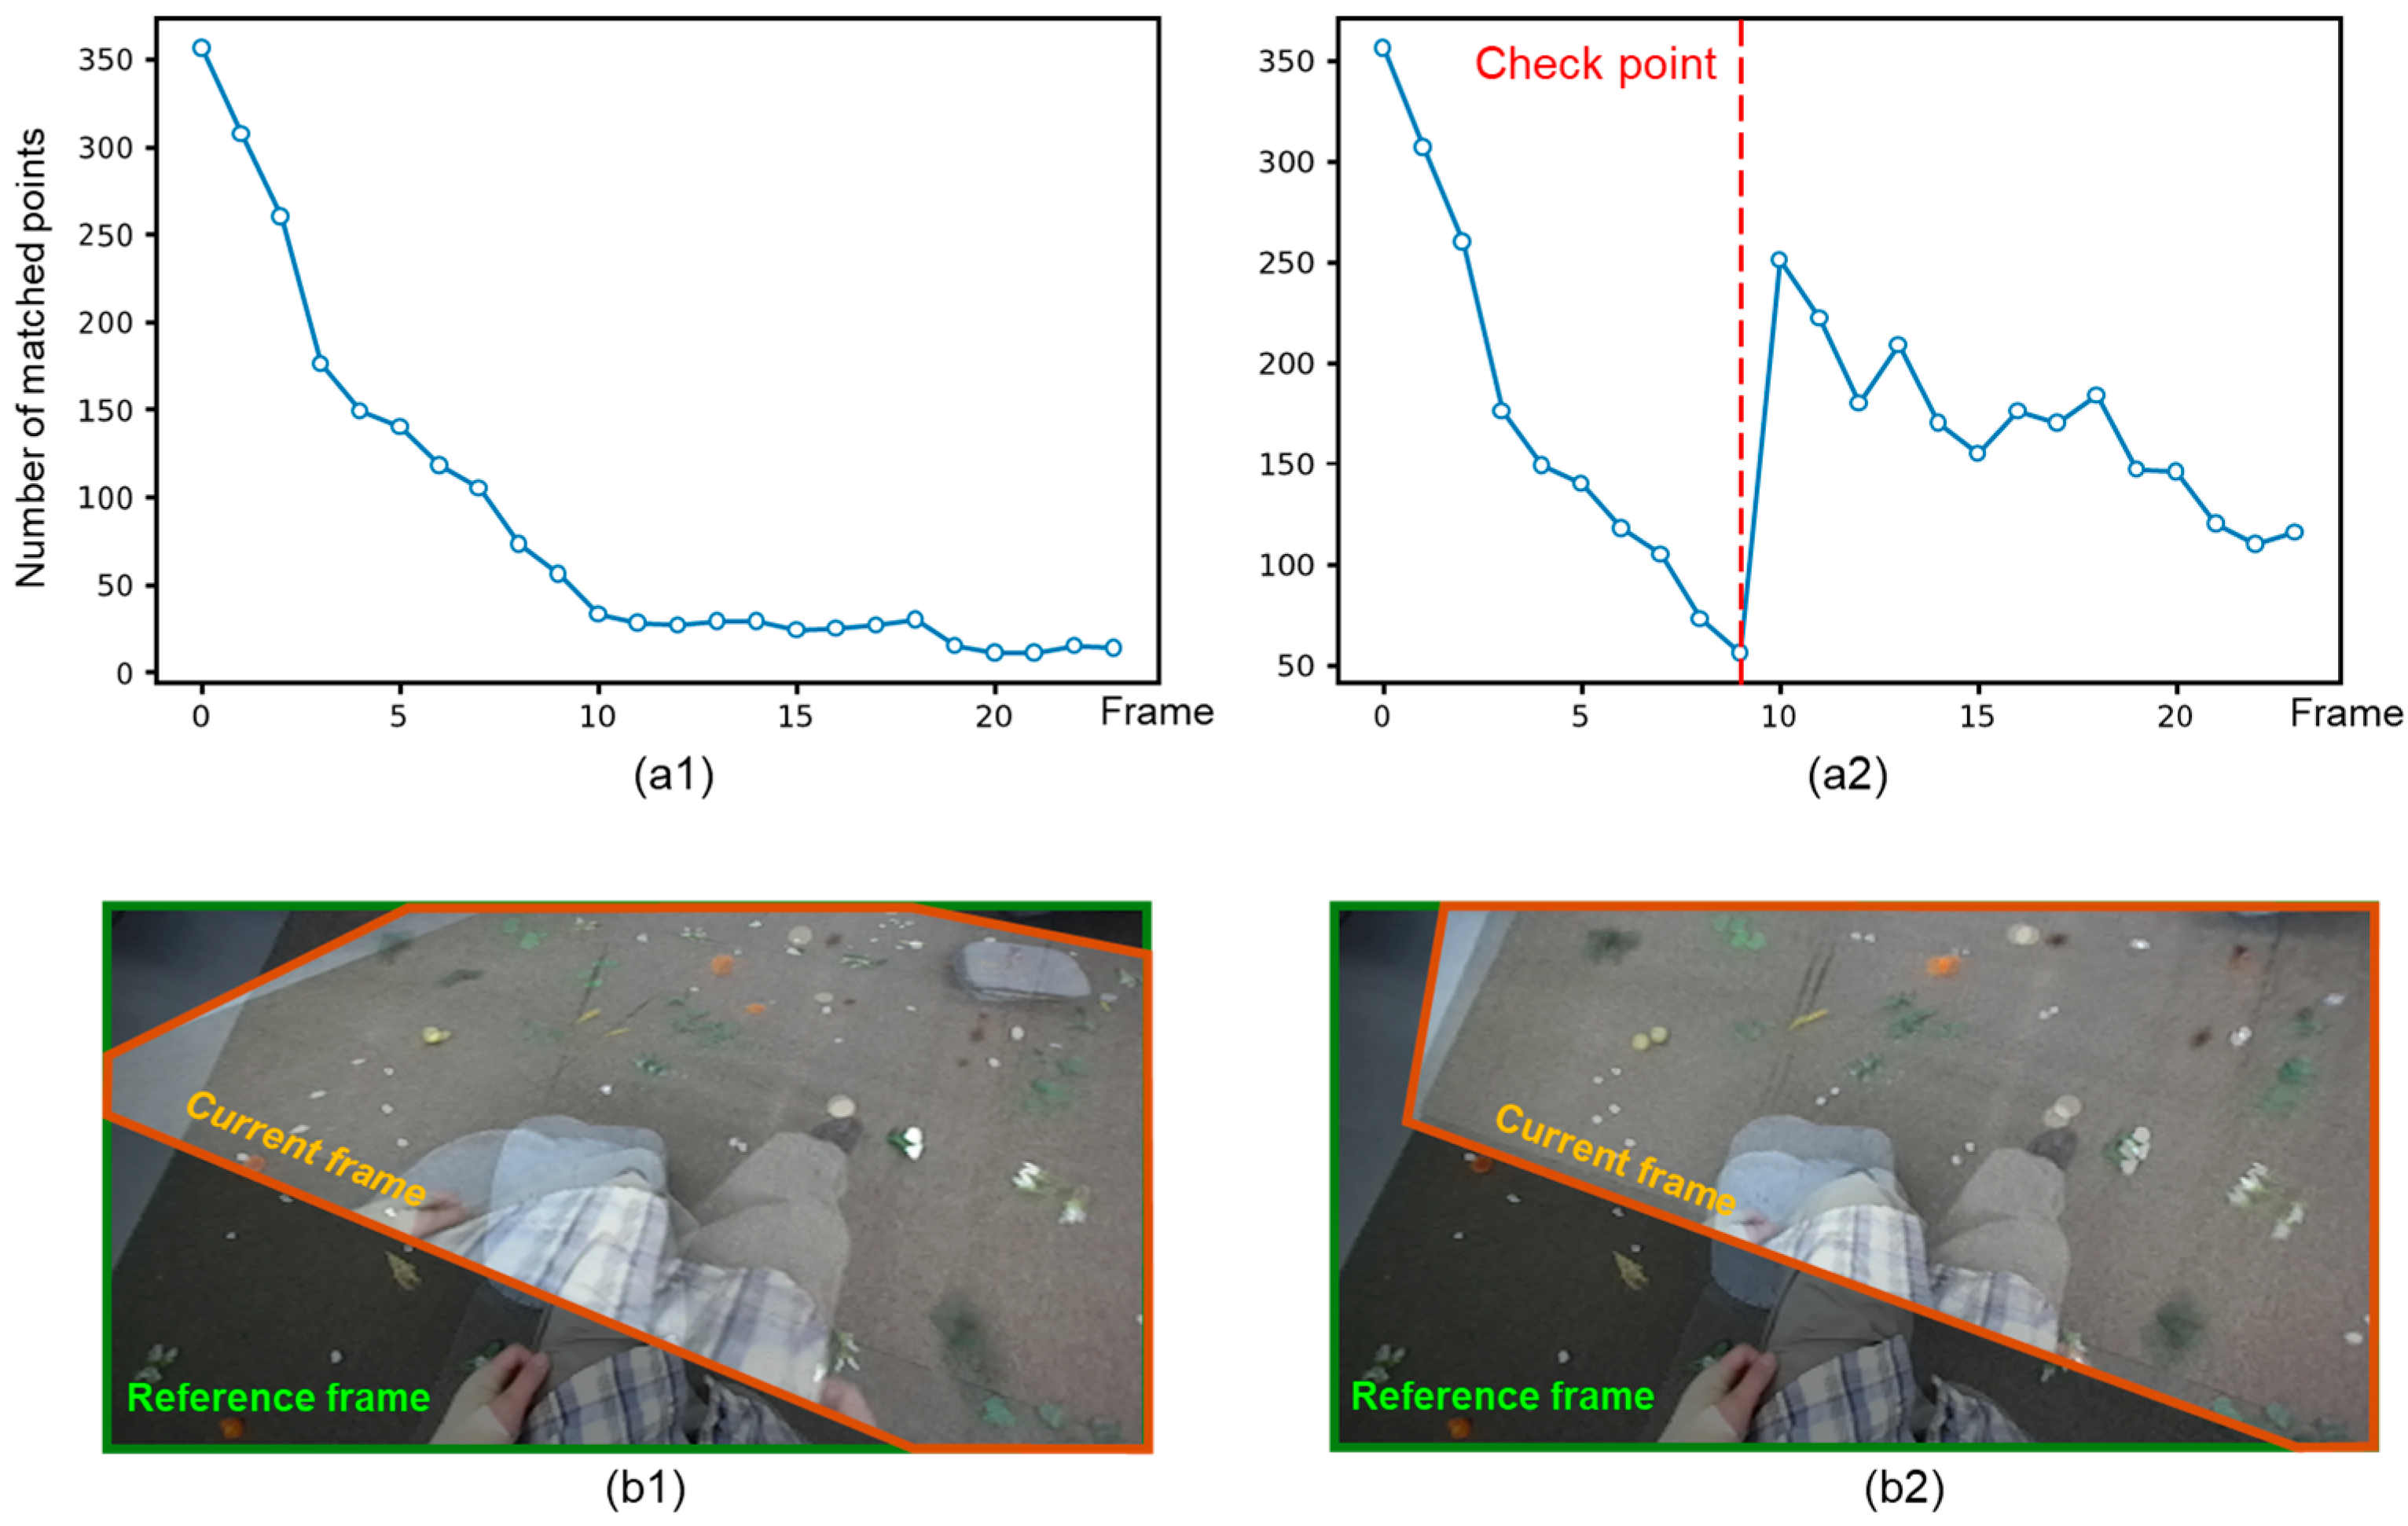
When the user moves, the visual overlap between the reference frame and current frame decreases, yielding an insufficient number of matched points to compute reliable transformation. To mitigate this, we select an additional frame, the checkpoint frame. After checkpoint frame is selected, instead of conducting the transformation from the reference frame and the current frame, two consecutive transformations were conducted. The first transformation was carried out from the last reference frame to the checkpoint frame. Then, the second transformation was conducted from the checkpoint and the current frame. This approach alleviates the transformation accuracy problem because it has more matched feature points than the single transformation case. We enable the checkpoint only if the inlier matched points between frames fall below a threshold (i.e., 70 points).

3. Experiments and Dataset

This section describes the experimental setup and introduces the data acquisition, augmentation, and annotation methods used to train the preliminary FP prediction model.

3.1. Experimental Setup

Experiments were conducted in the presence of various ground objects to create an environment similar to that of forested terrain. Objects such as leaves and gravel were scattered on the ground, as shown in Figure 7a. To build an environment with various heights, rocks with 4 cm height were stacked, as shown in Figure 7b. The height was categorized into three levels: Level 0 represents flat ground without obstacles; while Levels 1 and 2 were created by stacking three and six rocks, respectively. Puddles, which are objects that are undesirable to hikers, were also placed on the hiker’s trajectory.
A standalone hardware system was developed for outdoor applications. A stereo camera (StereoLabs, ZED 2i, San Francisco, CA, USA) and IMU (Xsens Technologies B.V., MTI-1A, Enschede, The Netherlands) were installed on the front of the harness, as shown in Figure 7c. An NVIDIA Jetson AGX Orin Developer Kit (64 GB) (Nvidia Corp., Santa Clara, CA, USA) and battery (30 Ah; 65 W) (INOVIA, Seoul, Republic of Korea) were attached to the user’s back.

3.2. Data Acquisition and Preprocessing

The preliminary FP predictor was trained using images captured when no objects were present on the ground. These training data were used because this predictor is responsible for predicting the generalized human walking motion. The reference frame described in Section 2.4 should be updated when supporting foot changes between the left and right. The system estimates the transition timing using the image frames. To train this transition predictor, the ground truth of left-right foot contact time is needed. To obtain this ground truth, pressure sensors (Interlink FSR 406; single channel; 39.6 × 39.6 m m 2 ) attached to the left and right insoles were used. The noise regarding the pressure sensor can indirectly affect the reference frame selection, which influences the SH error. However, this effect is relatively small compared to the effects of FP prediction error. Table 1 lists the physical characteristics of the participants. Each subject walked along 6 m of flat ground ten times; and 6578 walking images were obtained from the experiment. This experiment was approved by Institution Review Board of Chung-Ang University (Protocol number: 1041078-202106-HRZZ-165-01, date of approval: 8 September 2021).
FP were mostly distributed in Regions 2–5, as shown in Figure 4; the samples corresponding to Regions 0, 1, 6, and 7 were deficient. Data augmentation was applied to address this data imbalance. Samples from Regions 0, 1, 6, and 7 were augmented via flipping. If the prediction model is trained with images about walking with objects, training data on various terrain environments are needed. Otherwise, the model can be overfitted to the training environments. Thus, the preliminary FP predictor was trained with flat-ground walking in the absence of objects. Then, the effects of ground objects were considered using the object preference distribution. Adam optimization with a weight decay of 10−4, a learning rate of 10−5, 100 epochs, and a batch size of 16 was used to train the FP predictor. The optimal model weights were selected when the validation loss did not decrease for ten consecutive iterations. The training was conducted on a computer with an Intel Xeon Gold 6248 CPU (2.50 GHz), 128 GB RAM, and an NVIDIA GeForce RTX 3090 GPU.

4. Results and Discussion

4.1. Effects of the Foot Trajectory Heatmap

The backbone network FP predictor was built using VGG16 [19] and MobileNet-v2 [17], which are widely used CNNs for image analysis. To validate the effect of the trajectory heatmap on FP prediction, the errors, in terms of the root mean square error (RMSE), were calculated when only the RGB image was used and when the foot trajectory heatmap was used with the RGB images. Table 2 presents the distance error, accuracy for the classes shown in Figure 4, and the p-value between the RGB only and RGB + heatmap datasets. The distance error obtained using MobileNet-v2 was similar to that obtained using VGG16. Notably, the distance error considerably decreases when a trajectory heatmap was added. MobileNet-V2 was adopted as the prediction model for the embedded system, as its lightweight architecture provides faster inference than VGG16.

4.2. Effects of the Checkpoint Frame

To verify the effects of the checkpoint frame, the number of matched features was compared between scenarios with and without the checkpoint frame. When the checkpoint frame was not applied, the number of matched features decreased continuously over time, as shown in Figure 8(a1). This decrease resulted in an image transformation with significant errors, as shown in Figure 8(b1). To visualize these errors, the current frame was transformed into reference frame coordinates. The transformed current frame was stitched onto the current frame. However, when the checkpoint frame was introduced, the number of matched features recovered ranged from approximately 50 to 240, as shown in Figure 8(a2). Consequently, the transformation error decreased significantly, as shown in Figure 8(b2).

4.3. Effects of Object Preference

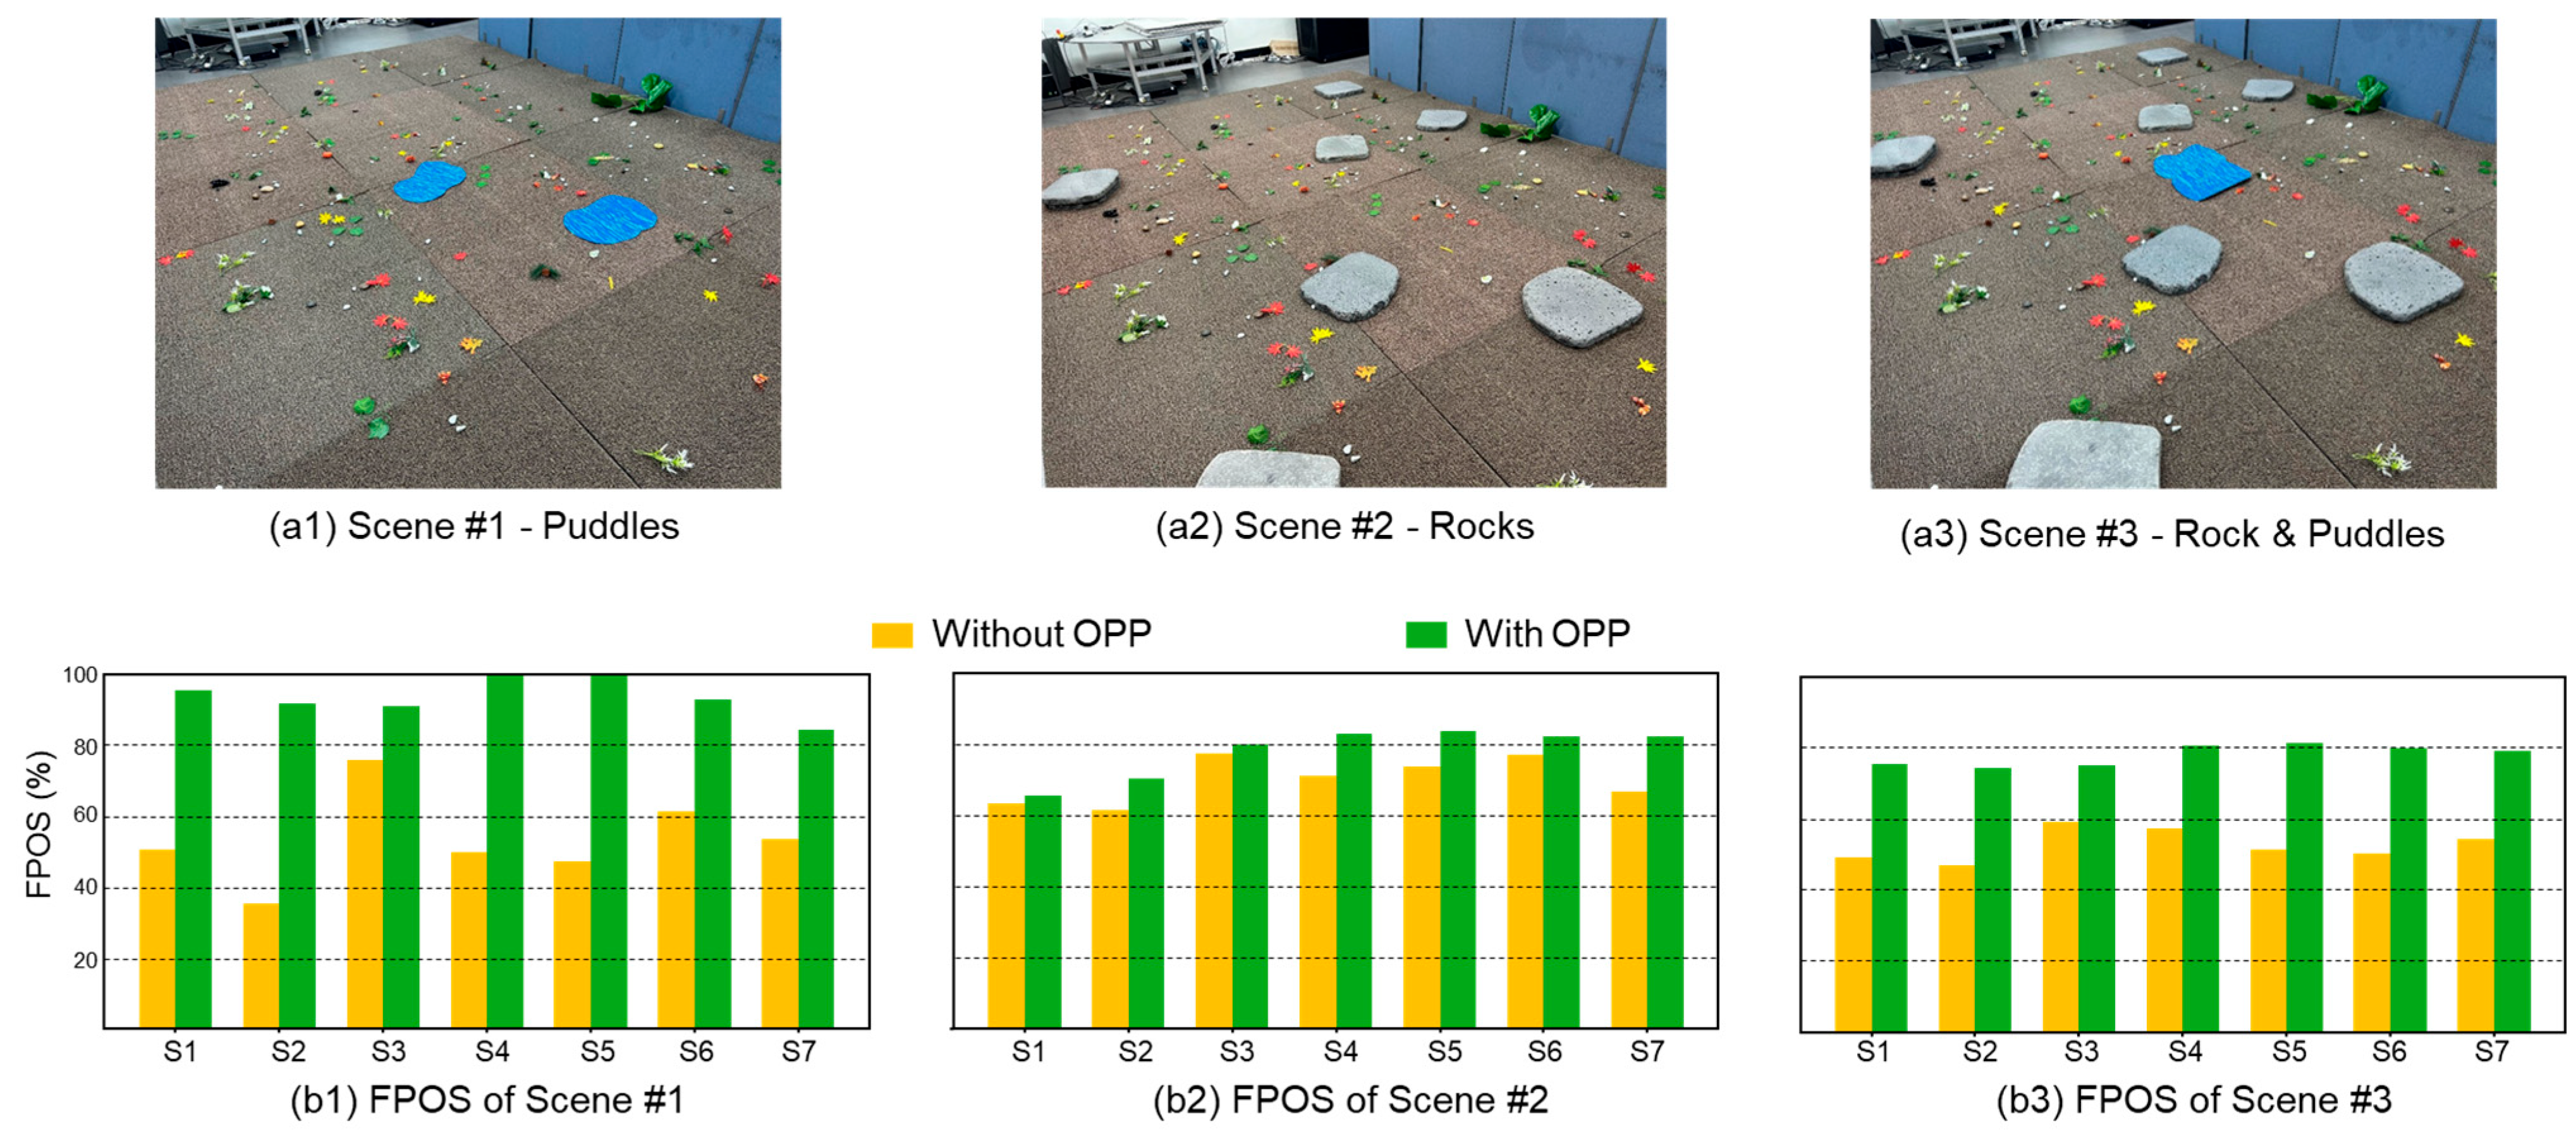
To consider the effects of object preference on FP prediction, FP values with and without the object preference probability (OPP) were compared. Participants were instructed which objects are regarded as preferred or undesired ones. Apart from the object preferences, they were free to plan their locomotion. In the experiment, preferred (e.g., rocks) and undesired (e.g., puddles) objects were randomly positioned, as shown in Figure 9a. The RMSE of the FP prediction for the seven subjects listed in Table 1 was averaged. For Scene #1, which contained puddles, the average RMSE of the preliminary FP was 26.14 cm. This error was reduced to 25.56 cm when the OPP was considered. For Scene #2, which contained rocks, the average RMSE of the preliminary FP method was 20.16 cm. The OPP decreased the error to 19.32 cm. For Scene #3, which contained both puddles and rocks, the FP errors without and with the OPP were 25.55 and 23.70 cm, respectively. The average RMSE was reduced by 2.22%, 4.17%, and 7.24% for Scenes 1–3, respectively. This error reduction suggests that the walking motion strongly depends on ground objects; therefore, the FP should be predicted based on the location of ground objects.
If FP is predicted as a point on the object where the foot is placed, SH can be accurately estimated despite substantial FP errors. Because predicting SH is the final goal of the proposed model, the FP-object success ratio (FPOS) was defined to quantify whether the FP-object was identified correctly. FPOS is defined as the ratio of the number of frames in which the FP-object is correctly predicted to the total number of frames in the experiment. Table 3 presents the FPOS results. For Scene #1, the FPOS was 56.32% when only the preliminary FP prediction was performed. This success ratio increased to 75.56% when the preference probability was added, as presented in Table 3. For Scene # 2, the FPOS with and without preference probability were 70.11% and 78.19%, respectively. For Scene #3, the FPOS increased from 52.57% to 78.01% with the addition of preference probability.

4.4. SH Prediction

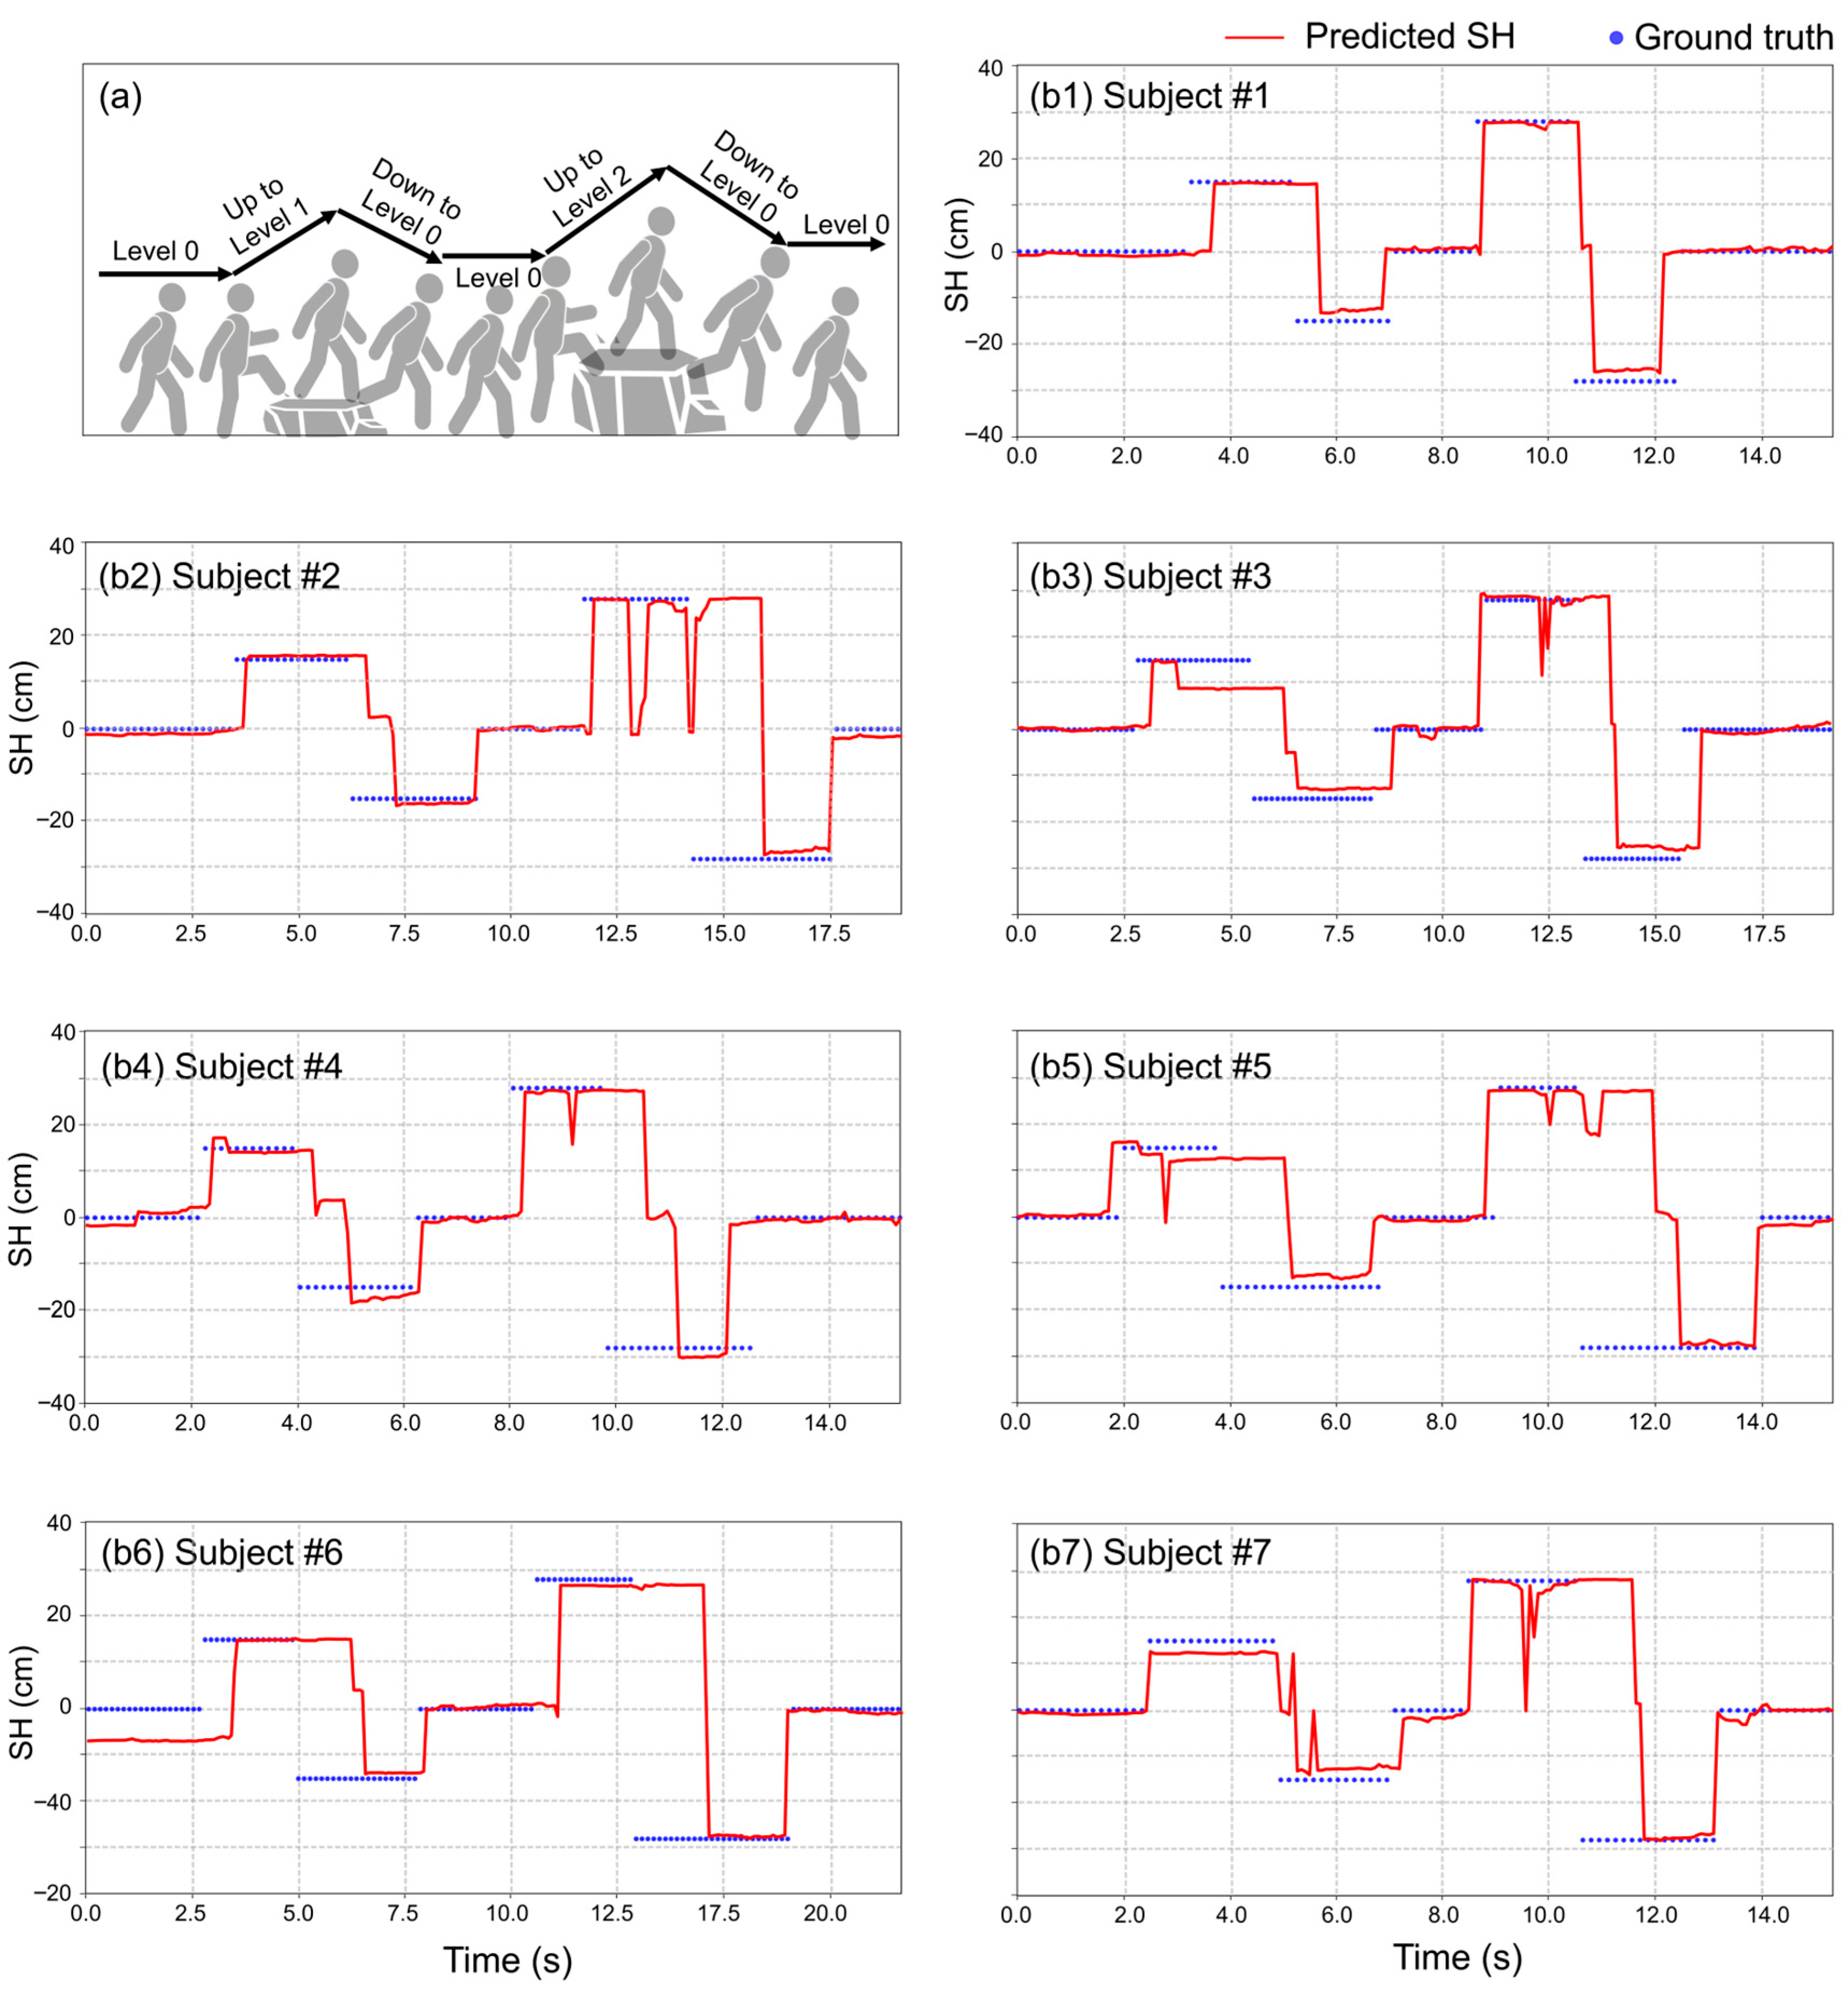
The levels of SH are assigned based on rock heights of 0 cm, 15 cm, and 28 cm, respectively. Level-1 and -2 represent descending height from 15 cm and 28 cm to the ground, respectively. Figure 10 shows the SH when the subjects walked along paths where rocks with heights of 12 and 24 cm were present. Details of the environment are shown in Figure 10a. In this scenario, the mean absolute error (MAE) of SH was 7.65 cm. The model successfully predicted the SH, except in a few cases, as shown in Figure 10b. Large SH errors were observed when descending from the rock, as shown in Figure 10. Although the FP needs to move down to the ground, the model predicts it to remain on the rock due to the object-preference map. The real-time predictions of FP and SH were visualized in the supplemental video (Video S1 in Supplementary Materials).

4.5. Inference Speed in Embedded Systems

The proposed FP prediction model was tested using an embedded system to assess its applicability to assistive systems. ROS2 was used to integrate the signals acquired from the RGB-D camera and the IMU. Real-time inference was conducted using NVIDIA Jetson AGX Orin. Yolo-v8s Seg model was selected in this study considering its reliable accuracy and fast inference speed. First, the mean Average Precision (mAP) for segmentation improves from 30.5 (nano) to 36.8 (small), and further to 40.8 (medium) [15]. Second, the inference times were 1.21 ms (nano), 1.47 ms (small), and 2.18 ms (medium) when an A100 GPU was used. Considering the mAP and inference time, Yolo-v8s was used in this study because it offers the most suitable accuracy and latency for the system. Furthermore, the inference time of Yolo-v8s on the Jetson AGX Orin was reduced from 56.94 ms to 35.54 ms using Tensor-RT [20], while preserving FP32 precision. The FP model and image-matching disparity calculation recorded inference times of 24.24 and 20.01 ms, respectively. The subsequent FP prediction calculations required 24.24 ms. The inference time for SH estimation was 20.01 ms. The total inference time was 79.78 ms (12.53 FPS). Considering that the walking stride time is approximately 1 s, the proposed model allows real-time SH prediction and is sufficiently fast for use in assistive systems.

5. Conclusions

This study proposed an SH prediction method to control assistive-walking systems on uneven terrain. The model predicts the FP by considering walking patterns and terrain preferences based on vision data. The locomotion pattern is learned by training a CNN with lower-body images and foot trajectories. The model (i.e., Mobilenet-v2) achieved an FP RMSE of 17.70 cm on the flat-walking dataset, as provided in Table 2. Additionally, surrounding objects are classified based on user preferences. The final prediction is made by integrating the walking patterns and terrain preferences. In diverse object environments, the average RMSE decreased from 23.95 to 22.86 cm by using OPP, as shown in Table 3. These results indicate that object preference enhances FP prediction. The method achieved an MAE of 7.65 cm in predicting SH by leveraging image perspective transformation and checkpoint frames to resolve the occlusion of FP. Although the method is not directly applicable to walking-assistive systems, the results show that incorporating object preference provides more accurate inputs (e.g., height dependent torque information) for such systems.
Although the developed model successfully predicted FP and SH, it had some limitations. First, the object types were not sufficiently diverse. Only rocks and puddles were considered objects on the terrain. Therefore, future studies should consider forests that are more realistic. In addition to objects on the terrain, other geometric information such as terrain slope should be considered. Second, the scope of this study was limited to straight walking. Therefore, FP should be predicted even when the user changes the walking direction. Third, an RGB-D camera is vulnerable to noise, such as changes in lighting conditions, shadows, and vibration caused by user movements. To address this issue, post-processing algorithms, calibration techniques, and a gimbal should be used to minimize noise effects. Fourth, the camera was installed slightly away from the user to effectively capture both the lower-limb motion and objects. However, this configuration can obstruct the user’s perspective. For a user-friendly design, the camera must fit the body more closely. Fifth, this study assumes users are walking on flat terrain with various objects. However, if the terrain surface is too steep or irregular, the SH estimation error can become significant. This limitation can be addressed in future work. For example, by incorporating IMU sensor fusion to improve robustness on steep and uneven surfaces. Finally, the predicted SH must be used to determine the torque of the assisting systems to maximize their efficiency on uneven terrain.

Supplementary Materials

The following supporting information can be downloaded at: https://www.mdpi.com/article/10.3390/technologies13090399/s1, Video S1: FP and SH of the final algorithm for each scene.

Author Contributions

Conceptualization, W.N. and G.L.; methodology, W.N. and G.L.; software, J.B.; validation, C.L., J.B. and J.H.; formal analysis, C.L., W.N. and G.L.; investigation, C.L.; resources, J.B. and J.H.; data curation, C.L., J.B. and J.H.; writing—original draft preparation, C.L., J.B. and J.H.; writing—review and editing, W.N. and G.L.; visualization, J.B. and J.H.; supervision, W.N. and G.L.; project administration, W.N. and G.L.; funding acquisition, W.N. and G.L. All authors have read and agreed to the published version of the manuscript.

Funding

This research was supported by the National Research Foundation of Korea (NRF) Grant funded by the Korea Government [Ministry of Science and ICT (MSIT)] under Grant 2023R1A2C1006655, RS-2025-02214162, and the Chung-Ang University Graduate Research Scholarship in 2024.

Data Availability Statement

The data supporting the conclusions of this article will be made available by the authors upon reasonable request.

Conflicts of Interest

Author Giuk Lee was employed by the company HUROTICS Inc. The remaining authors declare that the research was conducted in the absence of any commercial or financial relationships that could be construed as a potential conflict of interest. Please confirm.

References

  1. Mooney, L.M.; Rouse, E.J.; Herr, H.M. Autonomous exoskeleton reduces metabolic cost of human walking during load carriage. J. Neuroeng. Rehabil. 2014, 11, 80. [Google Scholar] [CrossRef] [PubMed]
  2. Malcolm, P.; Derave, W.; Galle, S.; De Clercq, D. A simple exoskeleton that assists plantarflexion can reduce the metabolic cost of human walking. PLoS ONE 2013, 8, e56137. [Google Scholar] [CrossRef] [PubMed]
  3. Park, J.; Nam, K.; Yun, J.; Moon, J.; Ryu, J.; Park, S.; Yang, S.; Nasirzadeh, A.; Nam, W.; Ramadurai, S.; et al. Effect of hip abduction assistance on metabolic cost and balance during human walking. Sci. Robot. 2023, 8, eade0876. [Google Scholar] [CrossRef] [PubMed]
  4. Al-dabbagh, A.H.; Ronsse, R. A review of terrain detection systems for applications in locomotion assistance. Robot. Auton. Syst. 2020, 133, 103628. [Google Scholar] [CrossRef]
  5. Su, B.-Y.; Wang, J.; Liu, S.-Q.; Sheng, M.; Jiang, J.; Xiang, K. A CNN-based method for intent recognition using inertial measurement units and intelligent lower limb prosthesis. IEEE Trans. Neural Syst. Rehabil. Eng. 2019, 27, 1032–1042. [Google Scholar] [CrossRef] [PubMed]
  6. Guo, R.; Li, W.; He, Y.; Zeng, T.; Li, B.; Song, G.; Qiu, J. Terrain slope parameter recognition for exoskeleton robot in urban multi-terrain environments. Complex Intell. Syst. 2024, 10, 3107–3118. [Google Scholar] [CrossRef]
  7. Zhao, C.; Liu, K.; Zheng, H.; Song, W.; Pei, Z.; Chen, W. Cross-Modality Self-Attention and Fusion-Based Neural Network for Lower Limb Locomotion Mode Recognition. IEEE Trans. Autom. Sci. Eng. 2024, 22, 5411–5424. [Google Scholar] [CrossRef]
  8. Kurbis, A.G.; Laschowski, B.; Mihailidis, A. Stair recognition for robotic exoskeleton control using computer vision and deep learning. In Proceedings of the 2022 International Conference on Rehabilitation Robotics (ICORR), Rotterdam, The Netherlands, 25–29 July 2022; pp. 1–6. [Google Scholar]
  9. Laschowski, B.; McNally, W.; Wong, A.; McPhee, J. Preliminary design of an environment recognition system for controlling robotic lower-limb prostheses and exoskeletons. In Proceedings of the 2019 IEEE 16th International Conference on Rehabilitation Robotics (ICORR), Toronto, ON, Canada, 24–28 June 2019; pp. 868–873. [Google Scholar]
  10. Pham, H.-H.; Le, T.-L.; Vuillerme, N. Real-Time Obstacle Detection System in Indoor Environment for the Visually Impaired Using Microsoft Kinect Sensor. J. Sens. 2016, 2016, 3754918. [Google Scholar] [CrossRef]
  11. Qian, Y.; Wang, Y.; Chen, C.; Xiong, J.; Leng, Y.; Yu, H.; Fu, C. Predictive locomotion mode recognition and accurate gait phase estimation for hip exoskeleton on various terrains. IEEE Robot. Autom. Lett. 2022, 7, 6439–6446. [Google Scholar] [CrossRef]
  12. Lee, S.-W.; Asbeck, A. A deep learning-based approach for foot placement prediction. IEEE Robot. Autom. Lett. 2023, 8, 4959–4966. [Google Scholar] [CrossRef]
  13. Xiong, J.; Chen, C.; Zhang, Y.; Chen, X.; Qian, Y.; Leng, Y.; Fu, C. A probability fusion approach for foot placement prediction in complex terrains. IEEE Trans. Neural Syst. Rehabil. Eng. 2023, 31, 4591–4600. [Google Scholar] [CrossRef] [PubMed]
  14. Li, M.; Zhong, B.; Lobaton, E.; Huang, H. Fusion of human gaze and machine vision for predicting intended locomotion mode. IEEE Trans. Neural Syst. Rehabil. Eng. 2022, 30, 1103–1112. [Google Scholar] [CrossRef] [PubMed]
  15. Ultralytics. Available online: https://github.com/ultralytics/ultralytics (accessed on 26 August 2024).
  16. Devroye, L.; Györfi, L.; Lugosi, G. A Probabilistic Theory of Pattern Recognition; Springer Science & Business Media: New York, NY, USA, 2013; Volume 31. [Google Scholar]
  17. Sandler, M.; Howard, A.; Zhu, M.; Zhmoginov, A.; Chen, L.-C. Mobilenetv2: Inverted residuals and linear bottlenecks. In Proceedings of the IEEE Conference on Computer Vision and Pattern Recognition, Salt Lake City, UT, USA, 18–23 June 2018; pp. 4510–4520. [Google Scholar]
  18. Rublee, E.; Rabaud, V.; Konolige, K.; Bradski, G. ORB: An efficient alternative to SIFT or SURF. In Proceedings of the 2011 International Conference on Computer Vision, Barcelona, Spain, 6–13 November 2011; pp. 2564–2571. [Google Scholar]
  19. Simonyan, K.; Zisserman, A. Very deep convolutional networks for large-scale image recognition. arXiv 2014, arXiv:1409.1556. [Google Scholar]
  20. NVIDIA TensorRT. Available online: https://developer.nvidia.com/tensorrt/ (accessed on 4 March 2024).
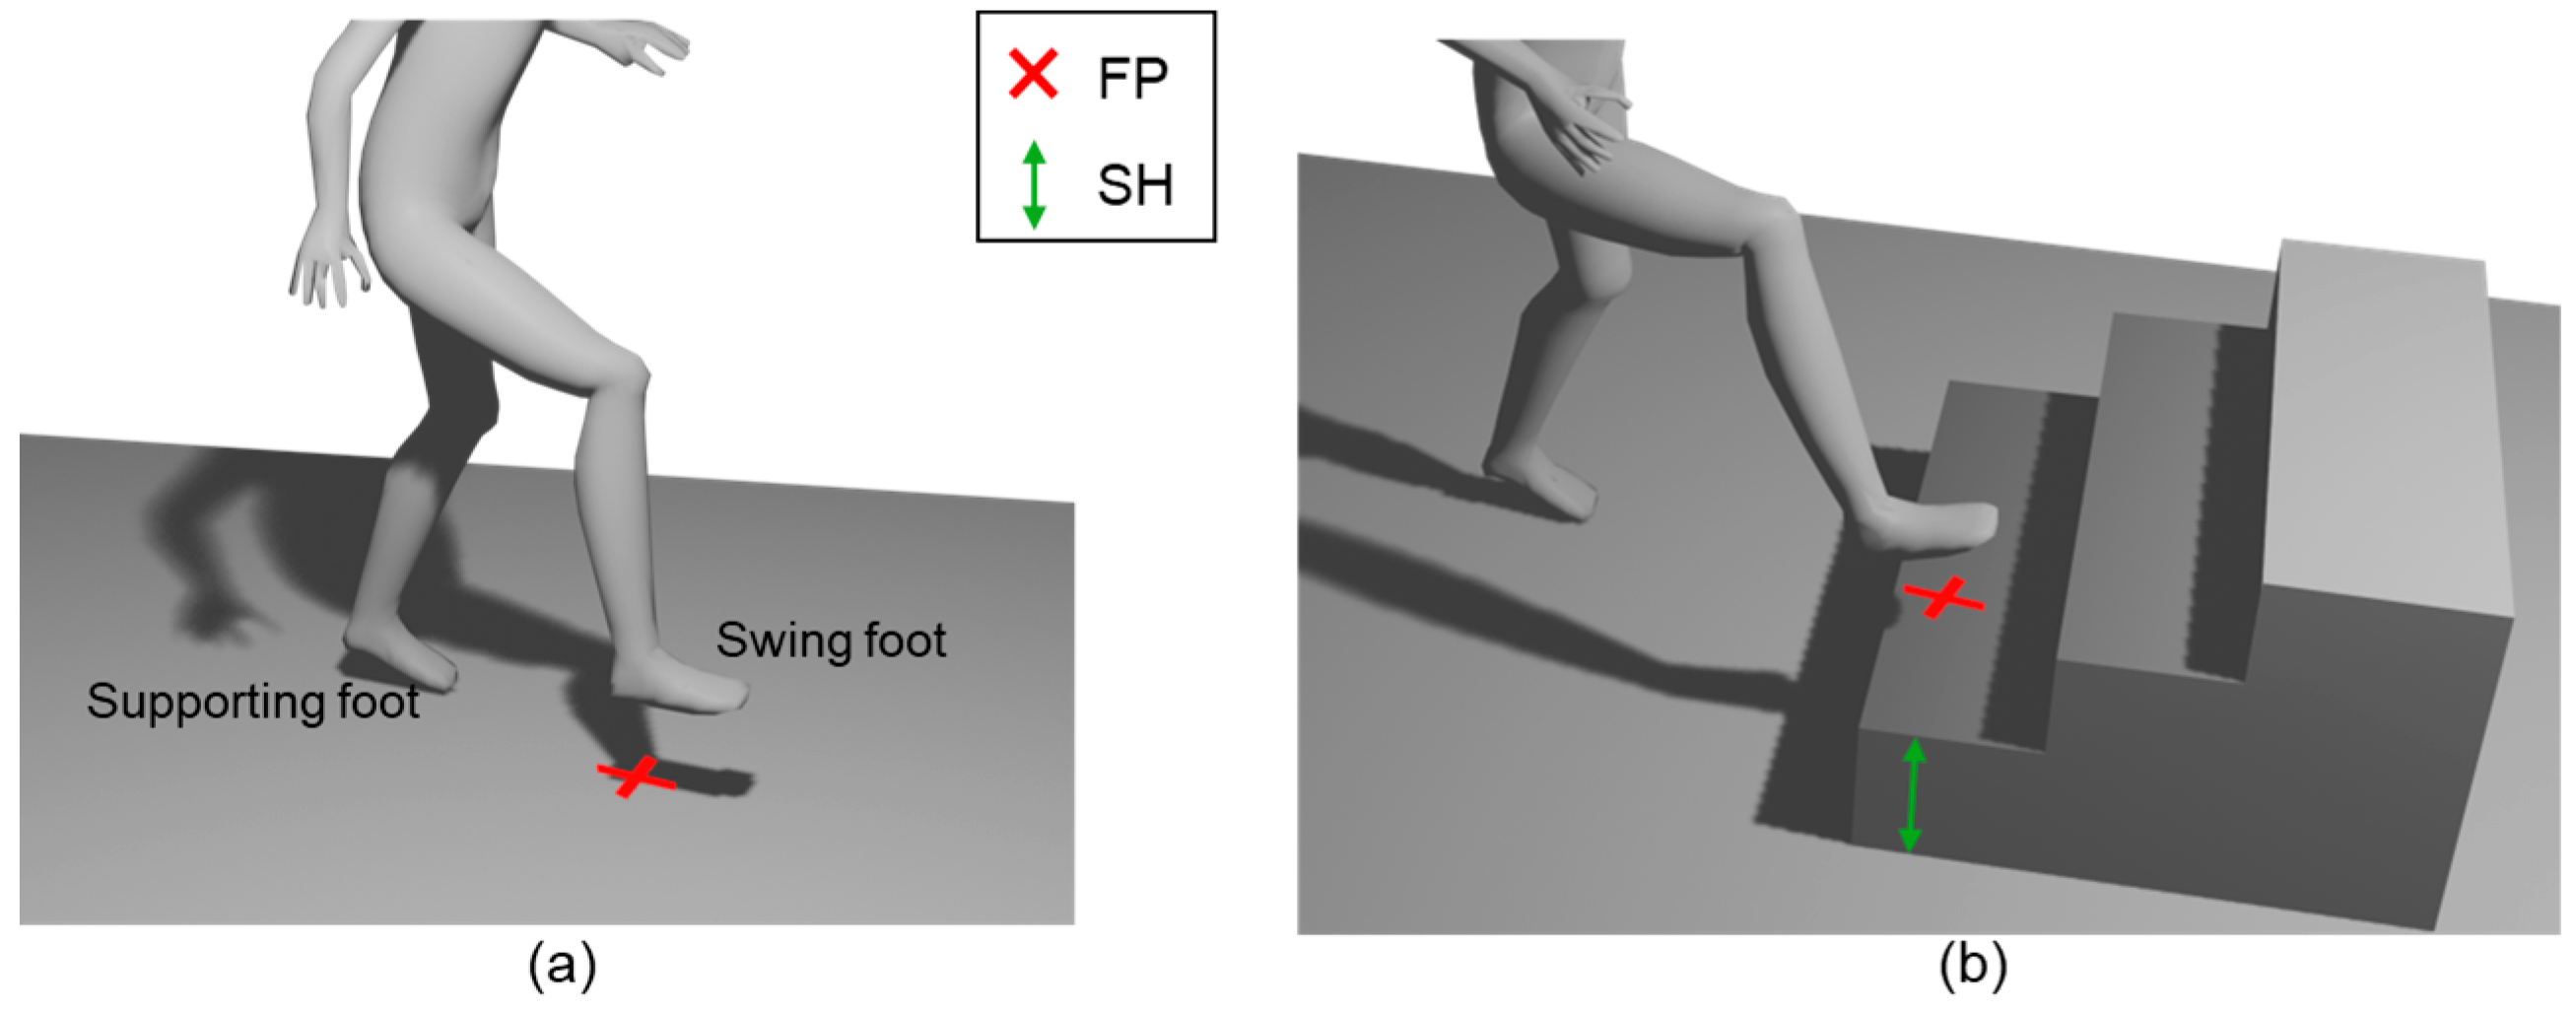
Figure 1. FP and SH definitions: (a) When walking on flat ground, SH is zero; (b) When climbing stairs, SH equals the stair height.
Technologies 13 00399 g001
Figure 2. Flowchart of the SH prediction model; FP and SH represent foot placement position and step height, respectively.
Technologies 13 00399 g002
Figure 3. Pipeline of the FP prediction model.
Technologies 13 00399 g003
Figure 4. Class regions for FP.
Technologies 13 00399 g004
Figure 5. Preference probability distribution.
Technologies 13 00399 g005
Figure 6. Reference frame and SH: (a1a3) Exemplar reference frames captured by the camera; (b1,b2) User’s motion and heights.
Technologies 13 00399 g006
Figure 7. Experimental environment and device setup: (a) Ground with objects; (b) Three ground height levels; (c) Data acquisition and processing devices.
Technologies 13 00399 g007
Figure 8. Examples of image transformation; Number of matched features (a1) without and (a2) with the checkpoint frame; (b1,b2) Stitched images of the reference and current frames; the latter is transformed into reference frame coordinates.
Technologies 13 00399 g008
Figure 9. Effects of the OPP: (a1a3) Scenes used in the experiments; (b1b3) FPOS with and without the OPP for each scene.
Technologies 13 00399 g009
Figure 10. Predicted SH and the corresponding ground truth; SH is positive when the subjects stepped on the object and negative when they descend; (a) Example SH experimental actions for level 0, 1, and 2. (b1b7) Comparison between the predicted SH and the ground truth.
Technologies 13 00399 g010
Table 1. Physical information of the subjects.
SubjectAgeHeight (cm)Weight (kg)
12617062
22717882
32617673
42717568
52418478
62716958
72418371
Table 2. Errors of the preliminary FP predictor.
ModelFP RMSE (cm)p-Value
Mobilenet–v2 (RGB + H)17.700.0136
Mobilenet–v2 (RGB)20.89
VGG16 (RGB + H)16.810.0251
VGG16 (RGB)20.66
Table 3. Average FPOS and FP RMSE.
SceneAverage FPOS (%)Average FP RMSE (cm)
Without OPPWith OPPWithout OPPWith OPP
1 (Puddles)56.3275.5626.1425.56
2 (Rocks)70.1178.1920.1619.32
3 (Puddles + Rocks)52.5778.0125.5523.70
Average59.6777.2523.9522.86
Disclaimer/Publisher’s Note: The statements, opinions and data contained in all publications are solely those of the individual author(s) and contributor(s) and not of MDPI and/or the editor(s). MDPI and/or the editor(s) disclaim responsibility for any injury to people or property resulting from any ideas, methods, instructions or products referred to in the content.