3.2. Performance of the Microturbojet Engine
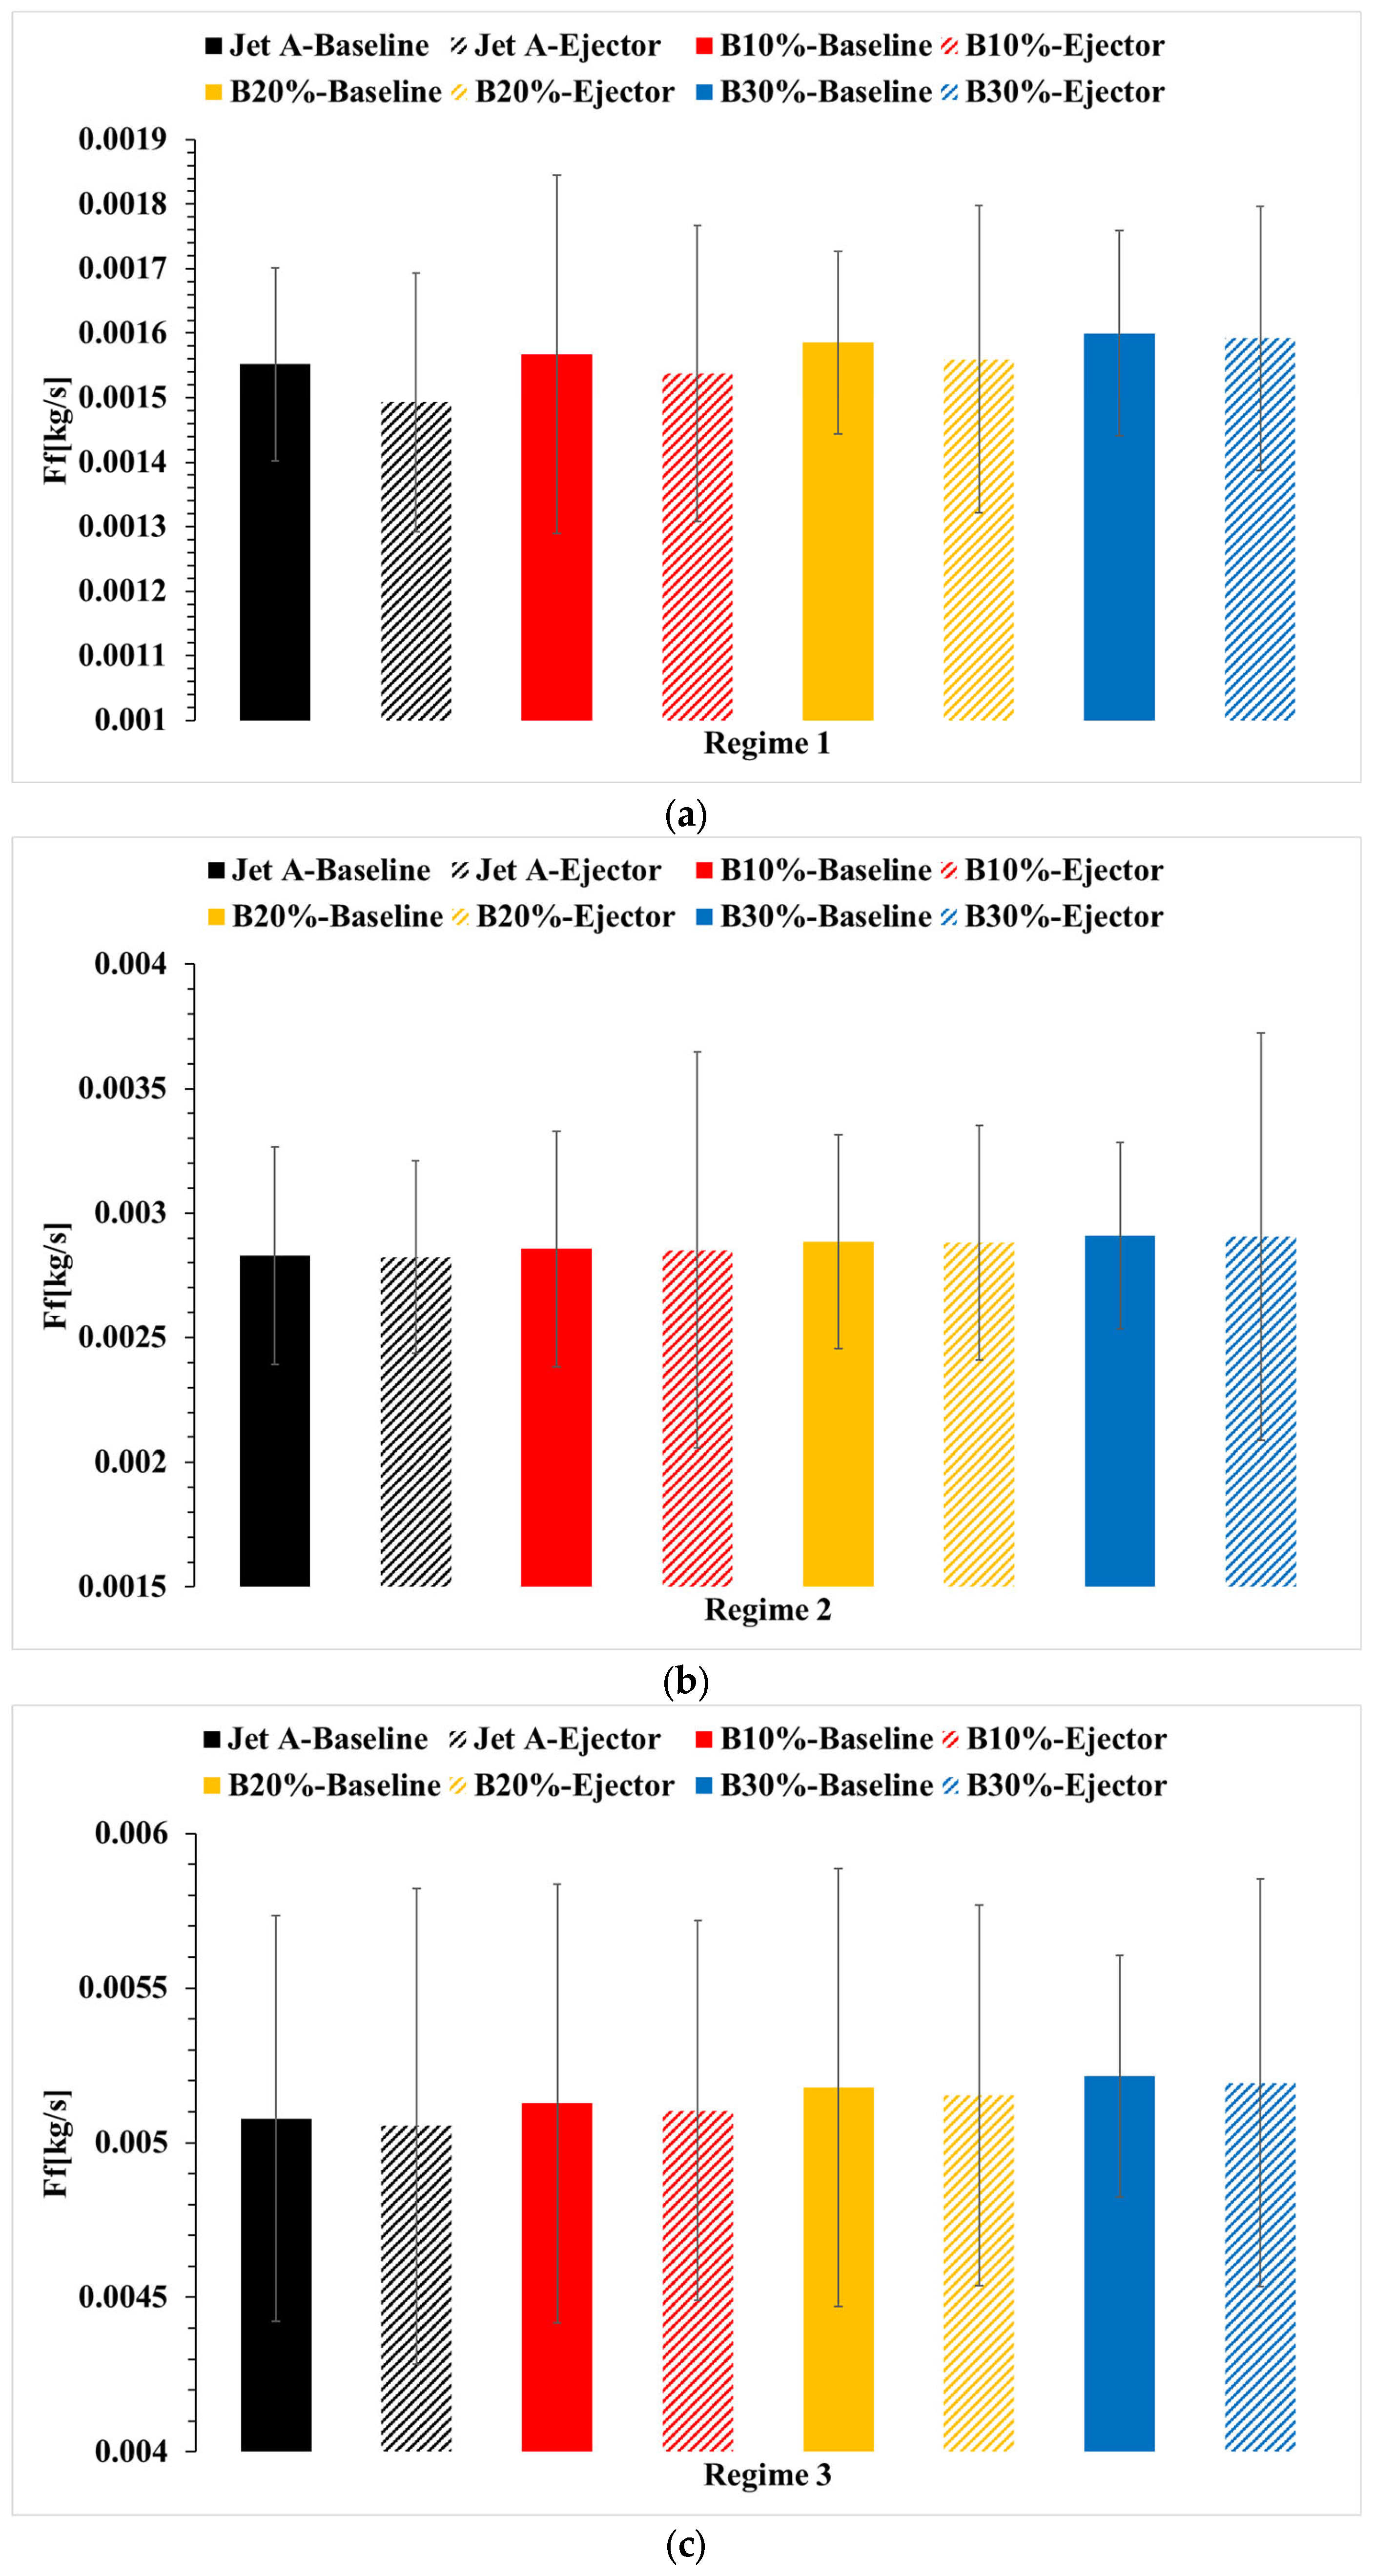
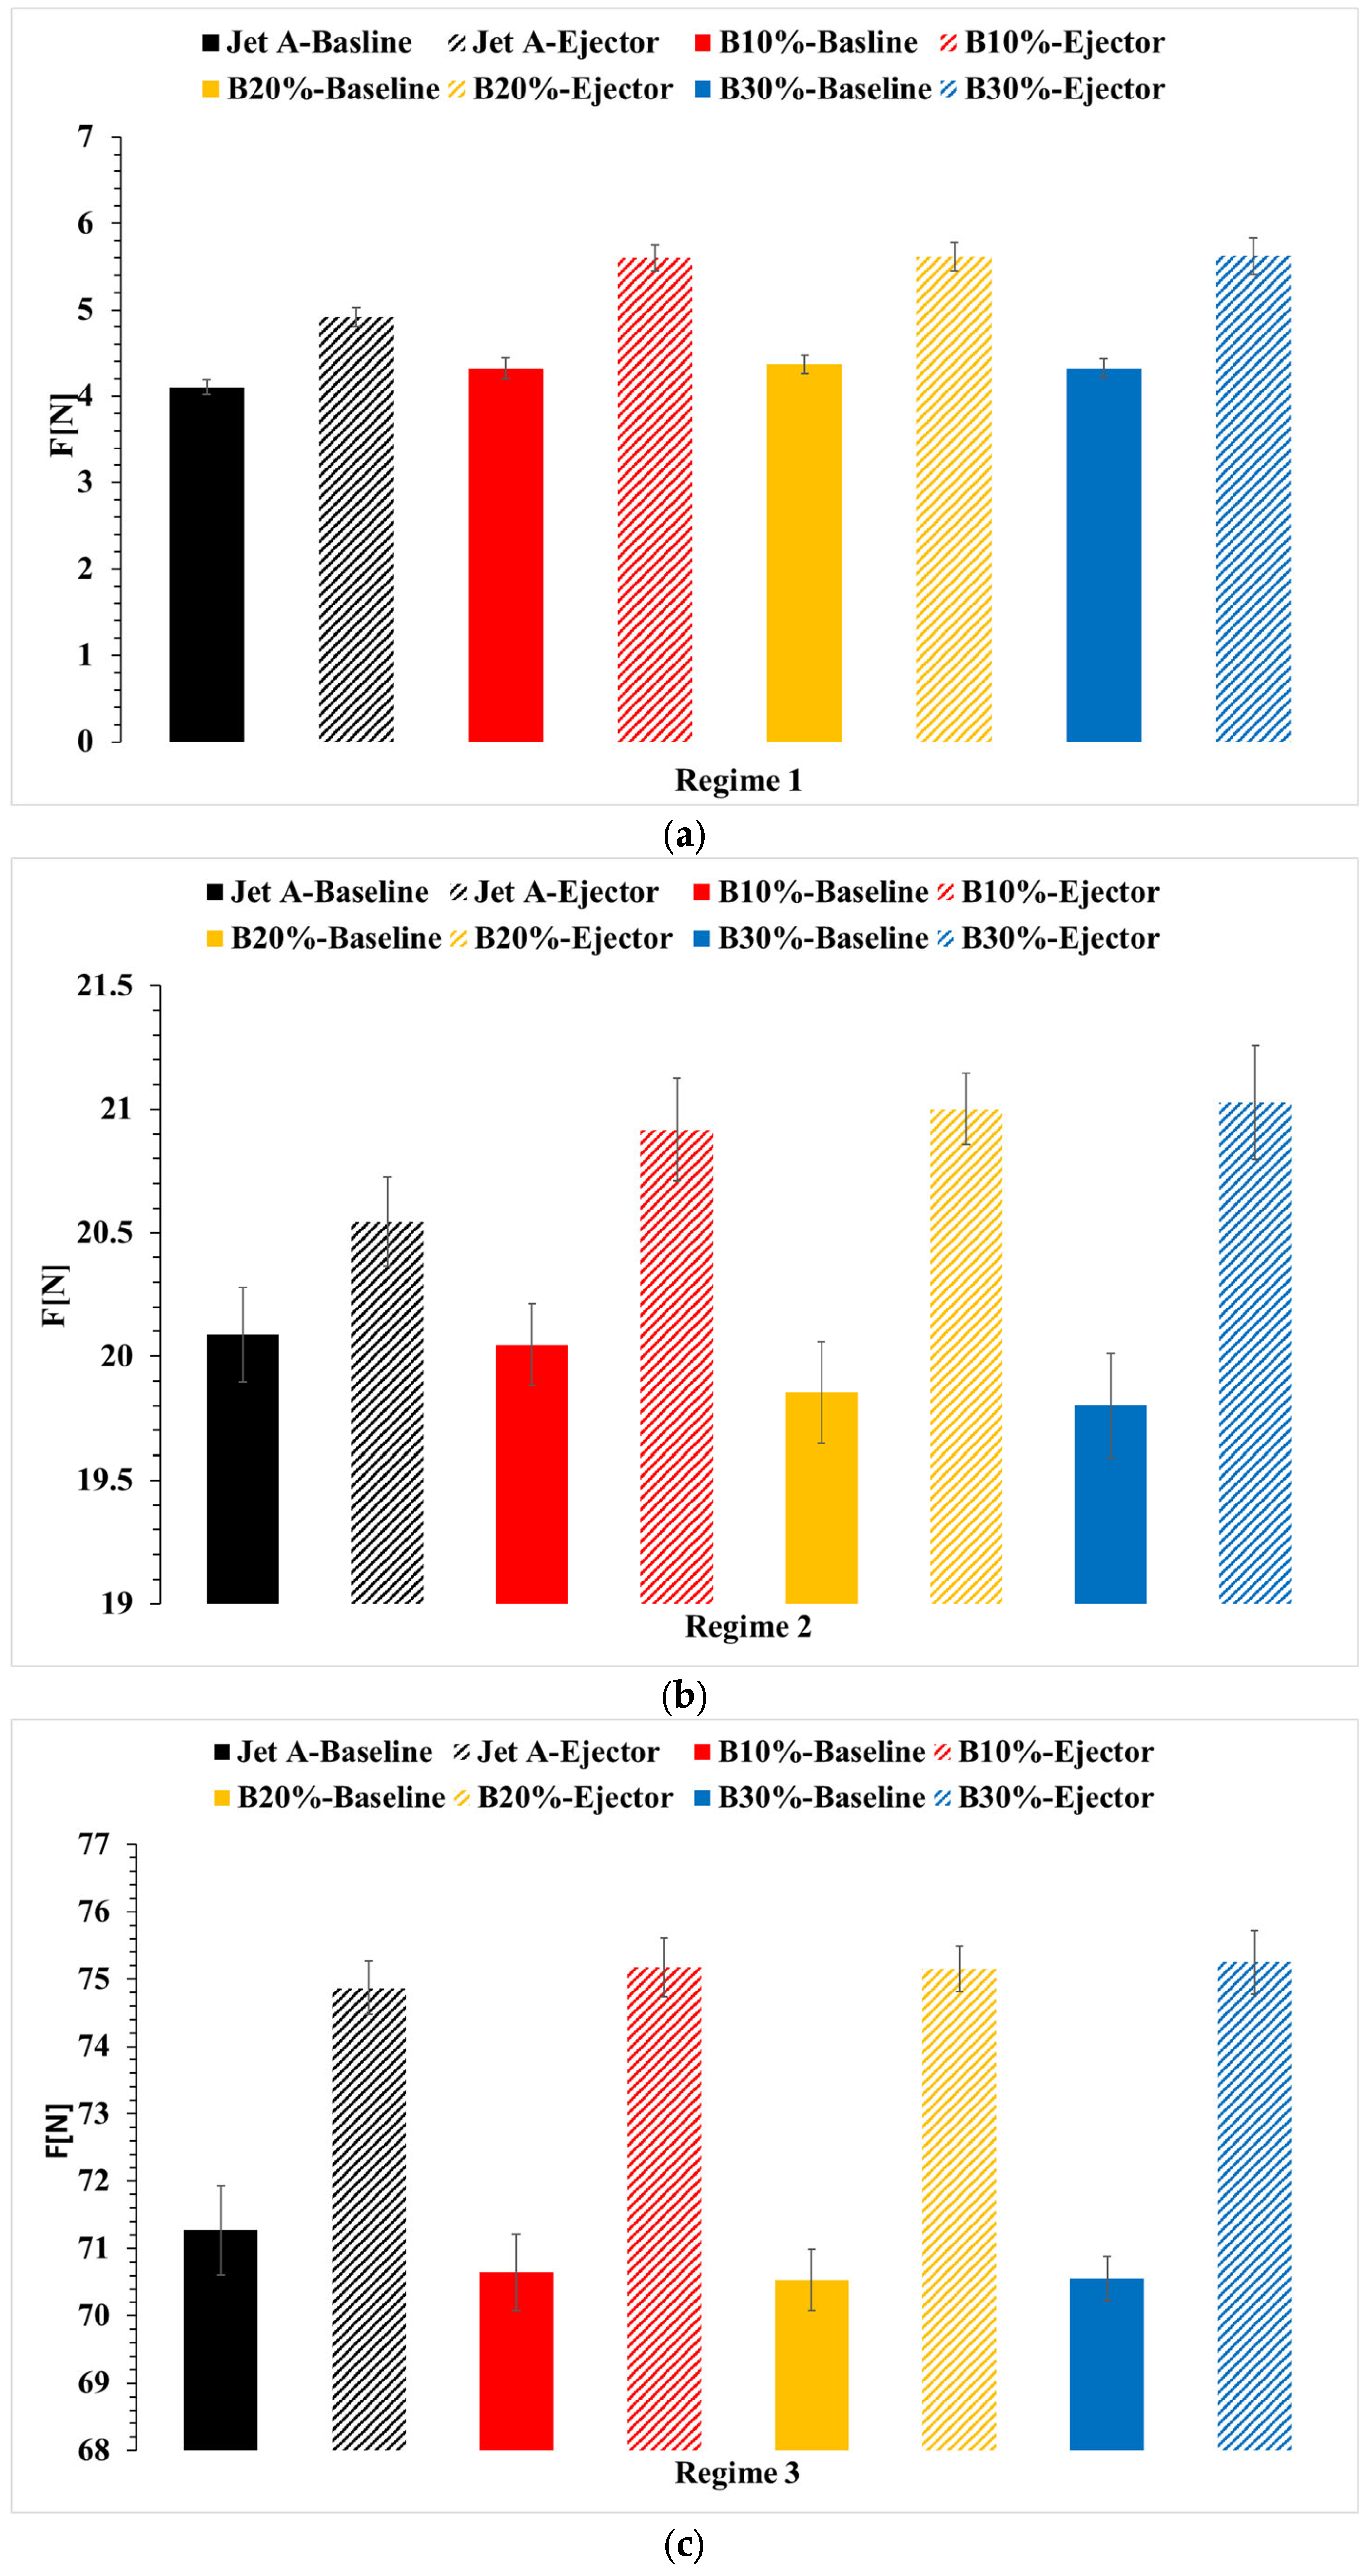
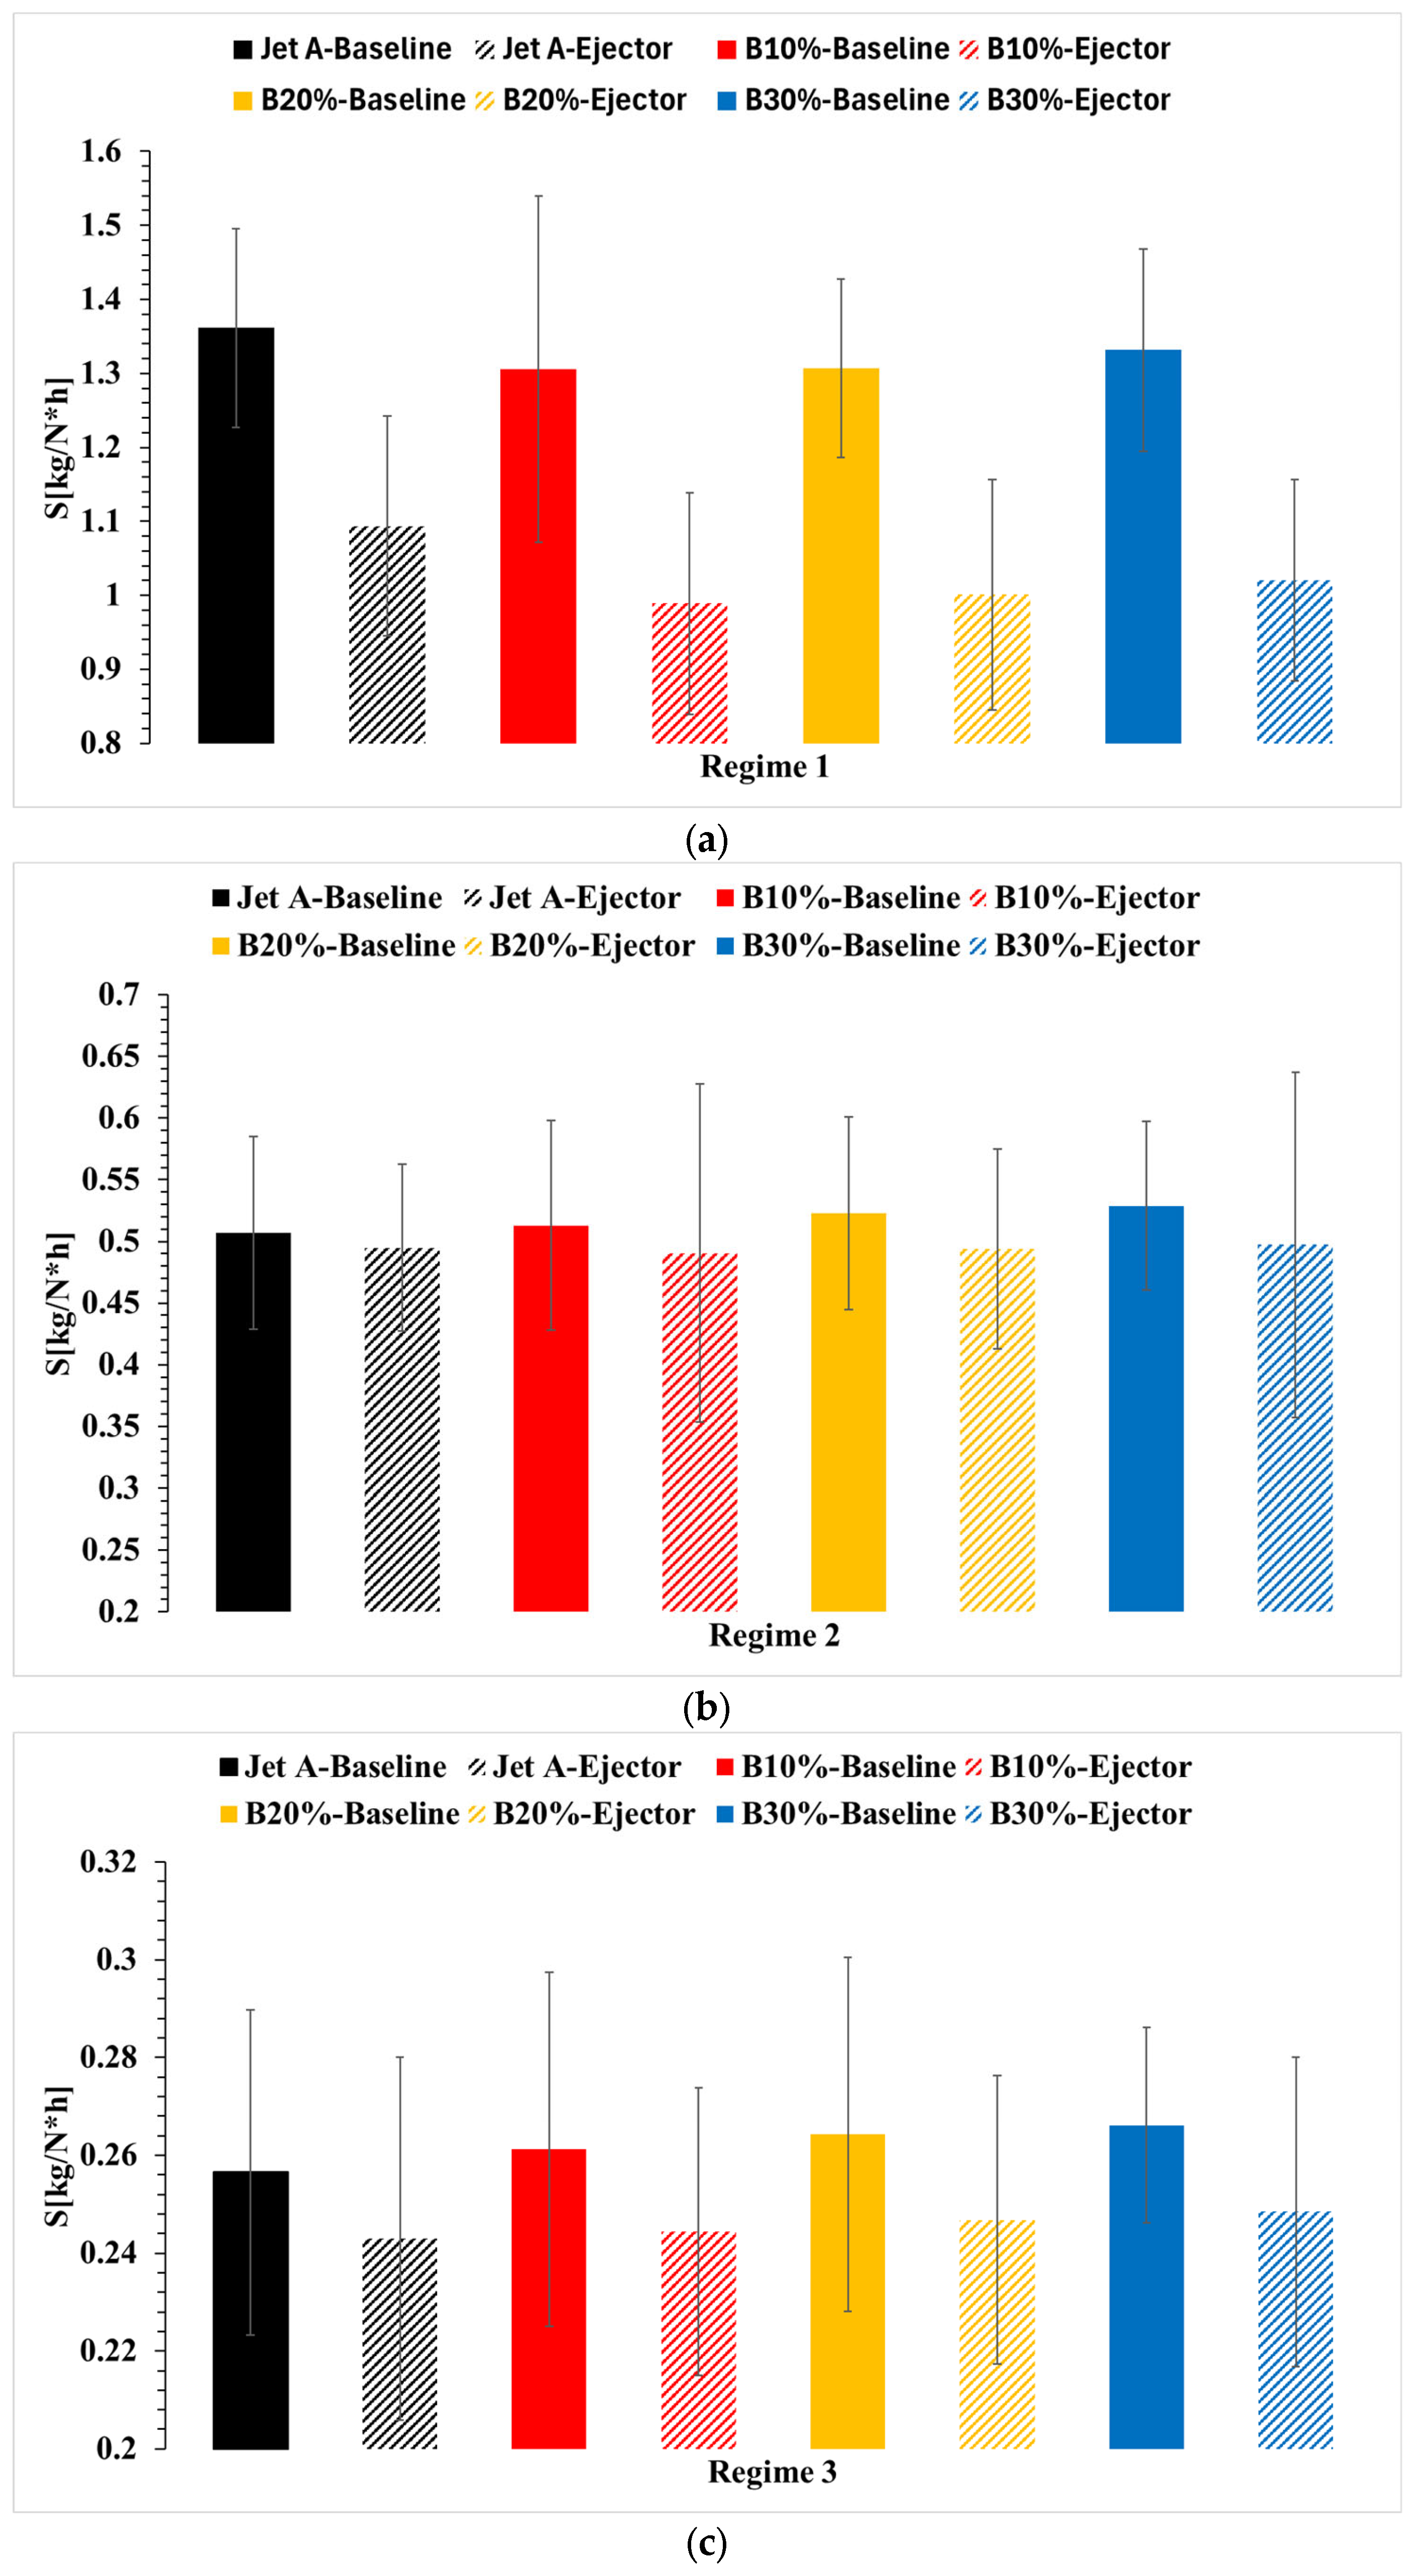
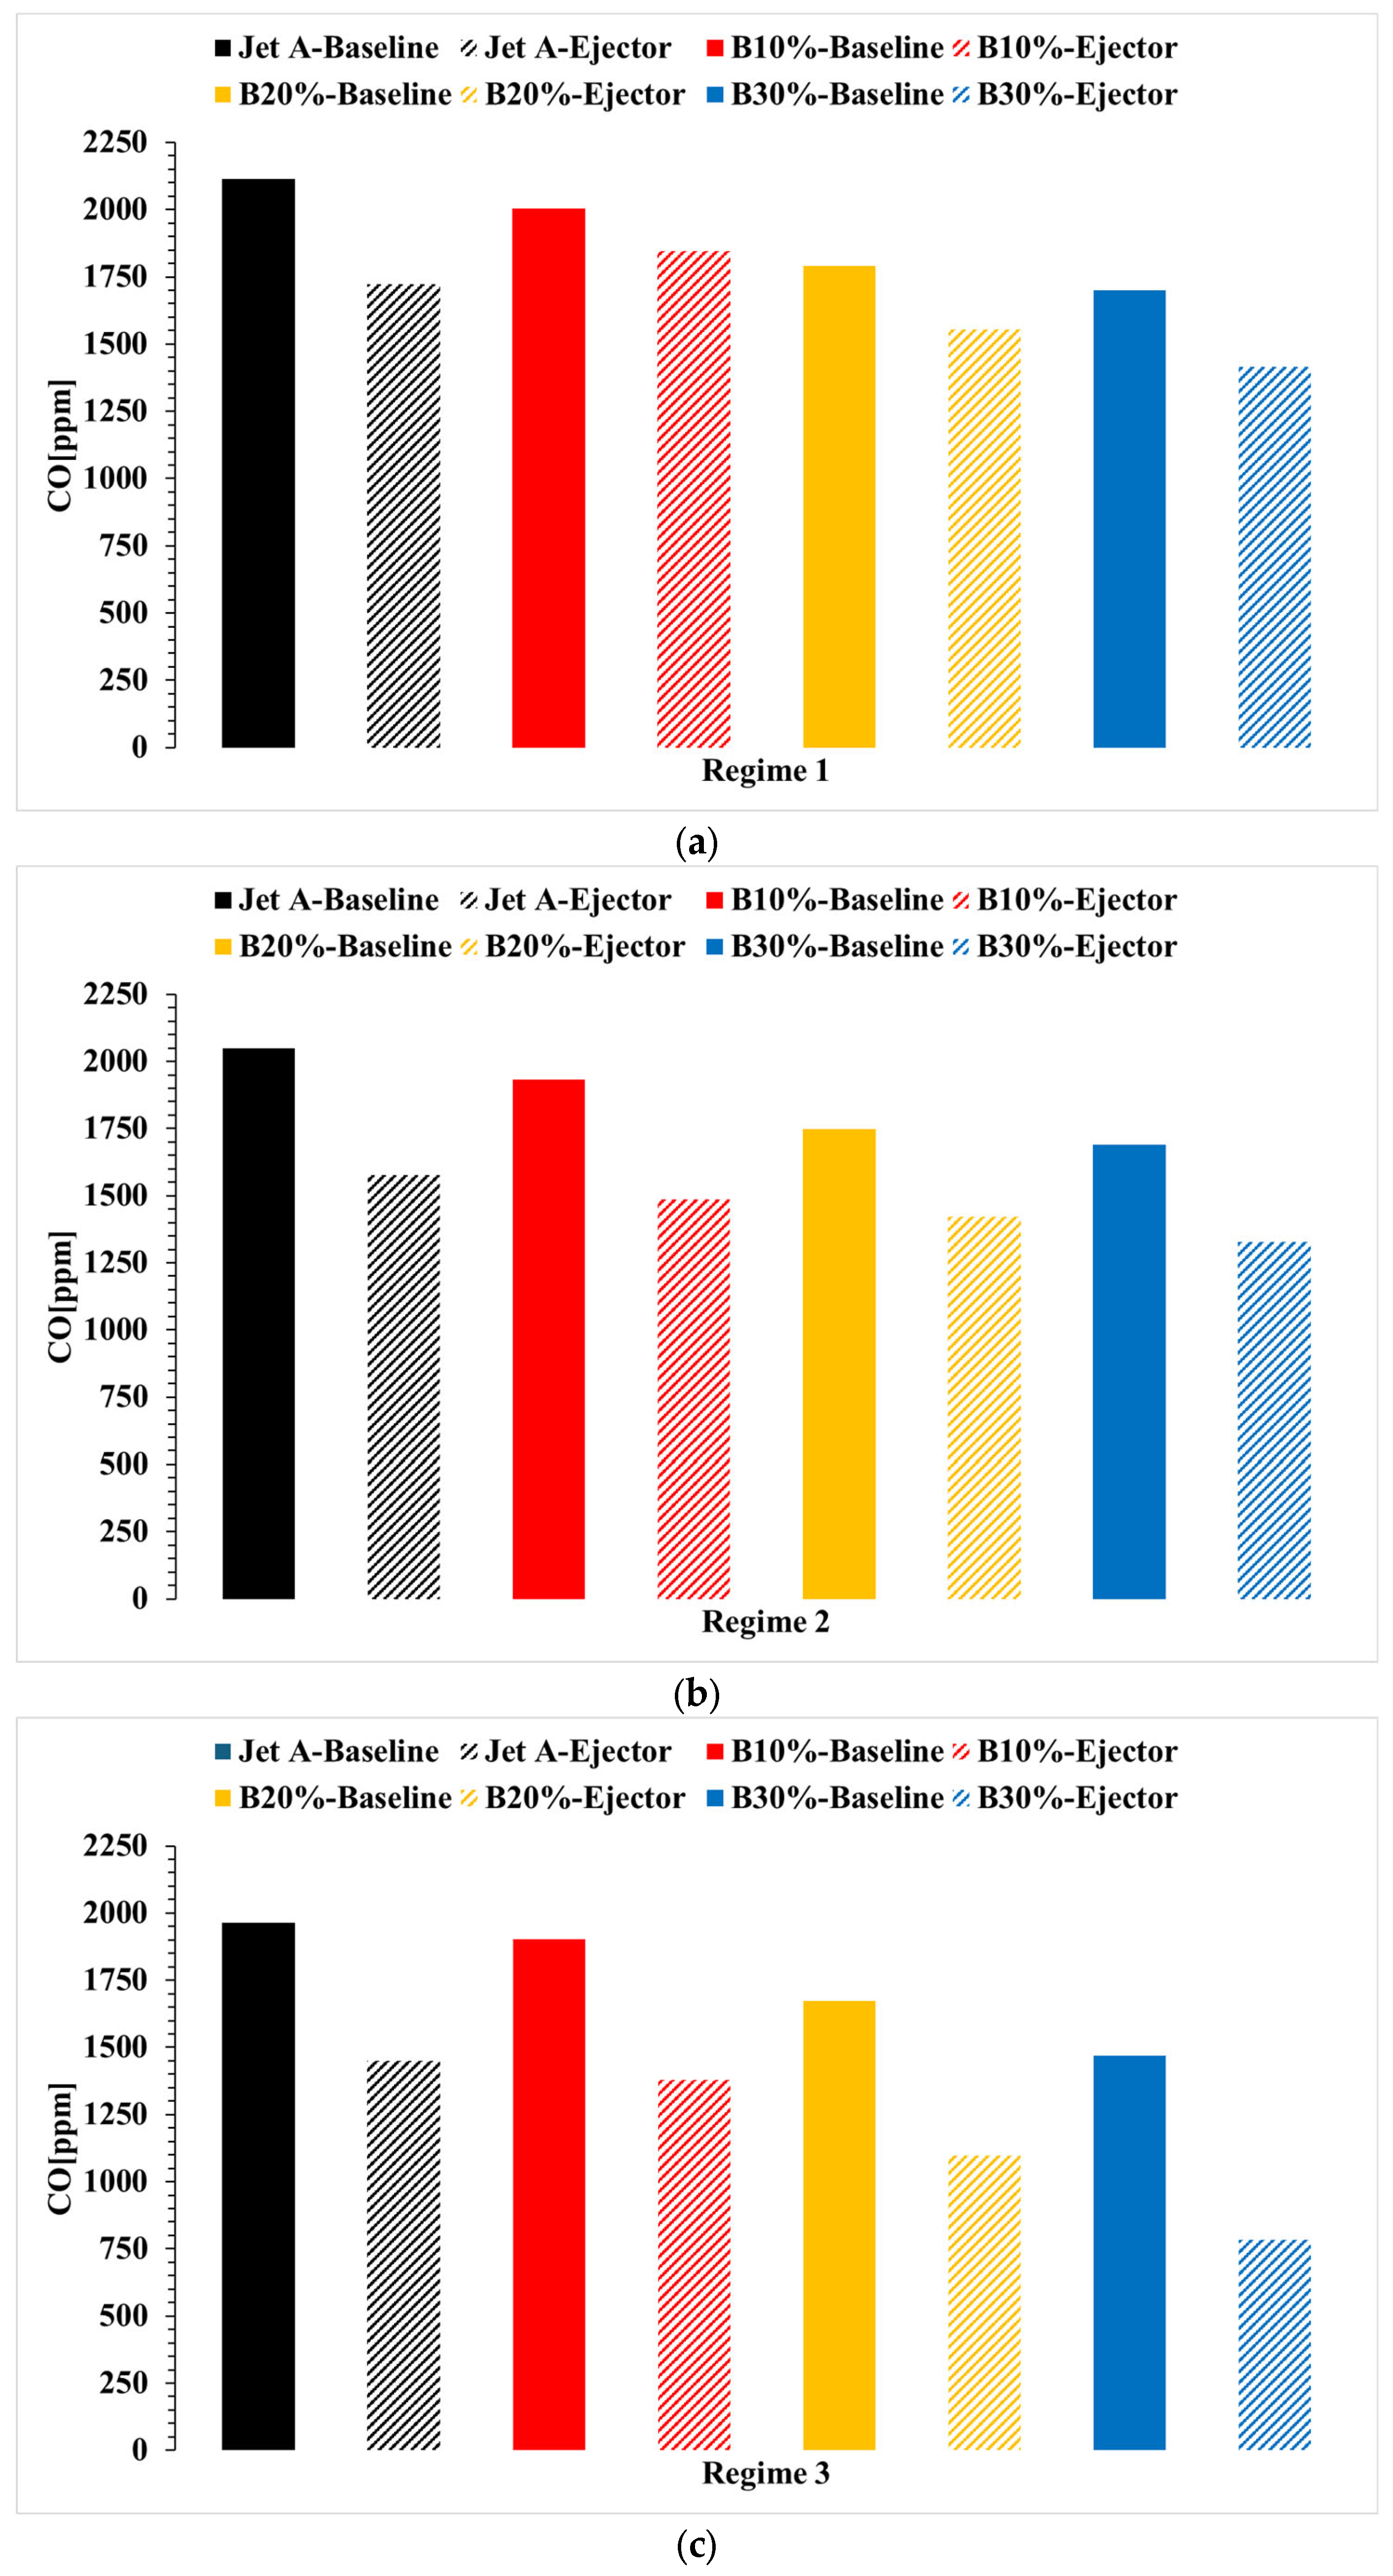
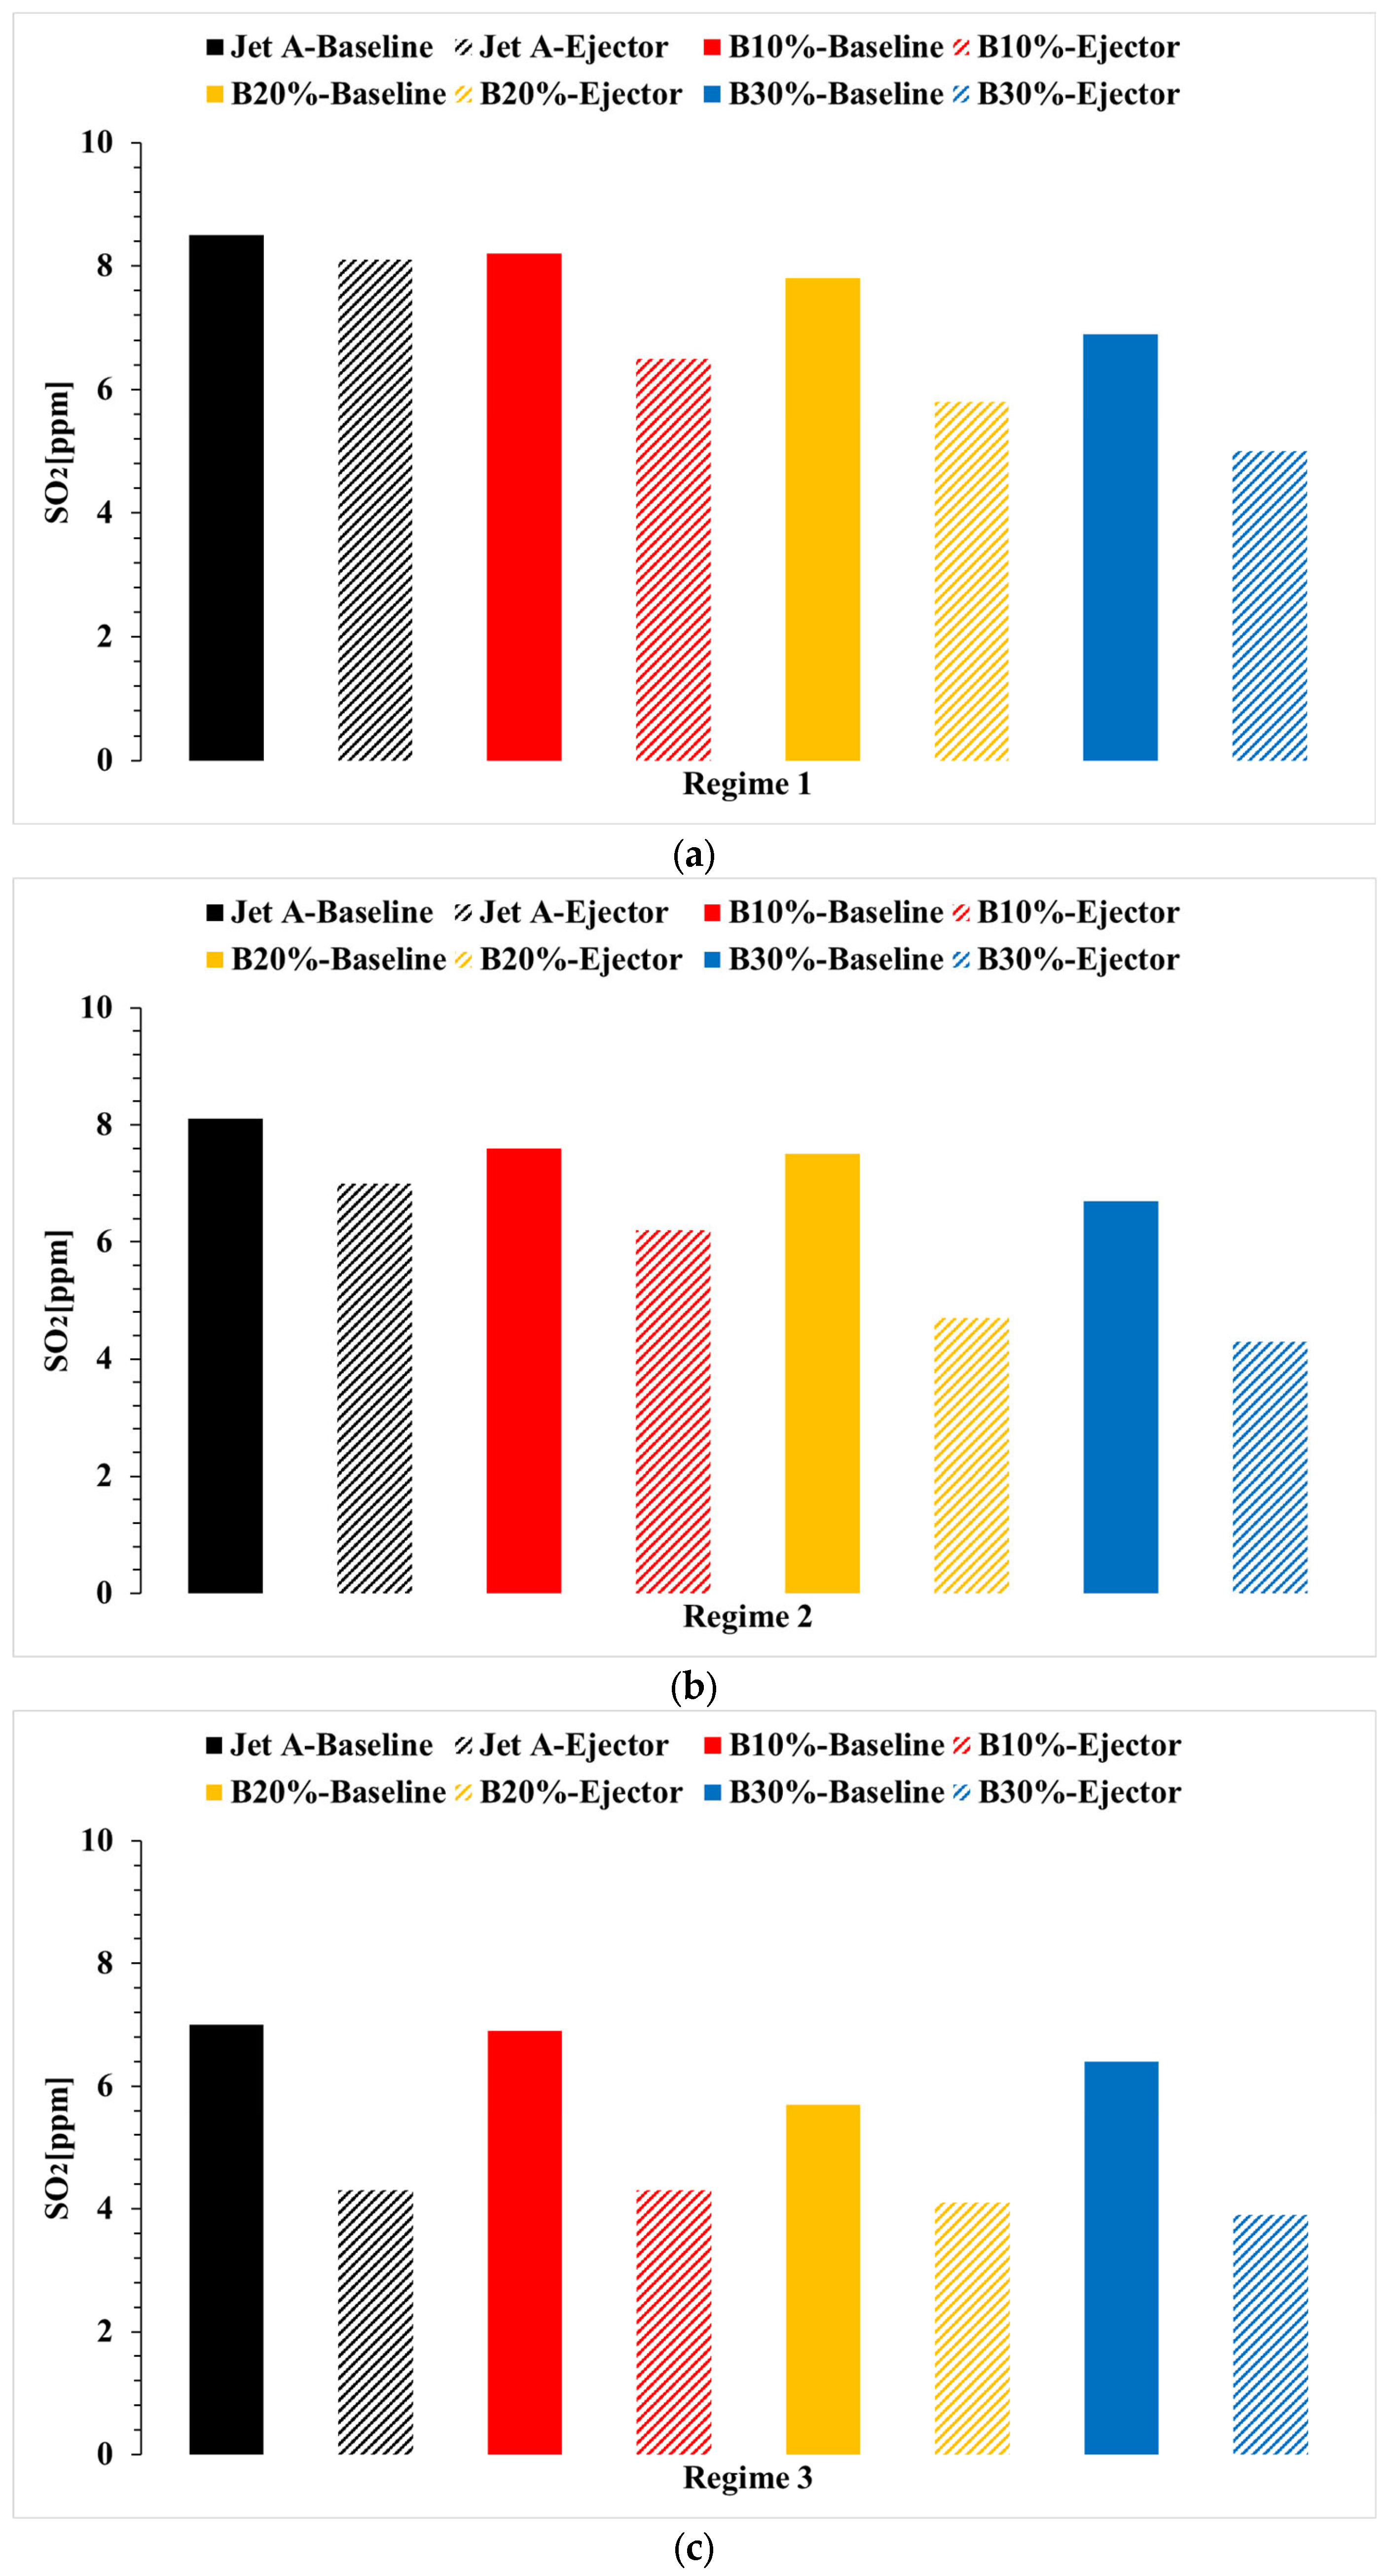
As a result of the tests conducted for the three operating regimes in both configurations (with and without the ejector), using Jet A fuel and blends with 10%, 20%, and 30% biodiesel, the variation in key parameters of interest is presented in the figures below.
The black color represents the values when the microturbojet engine operates on Jet A fuel, red is used for the 10% biodiesel blend, yellow for the 20% biodiesel blend, and blue for the 30% biodiesel blend. For the same conditions, but when the ejector is used, the graphs are the same colors but with a hatched pattern.
Thus, in
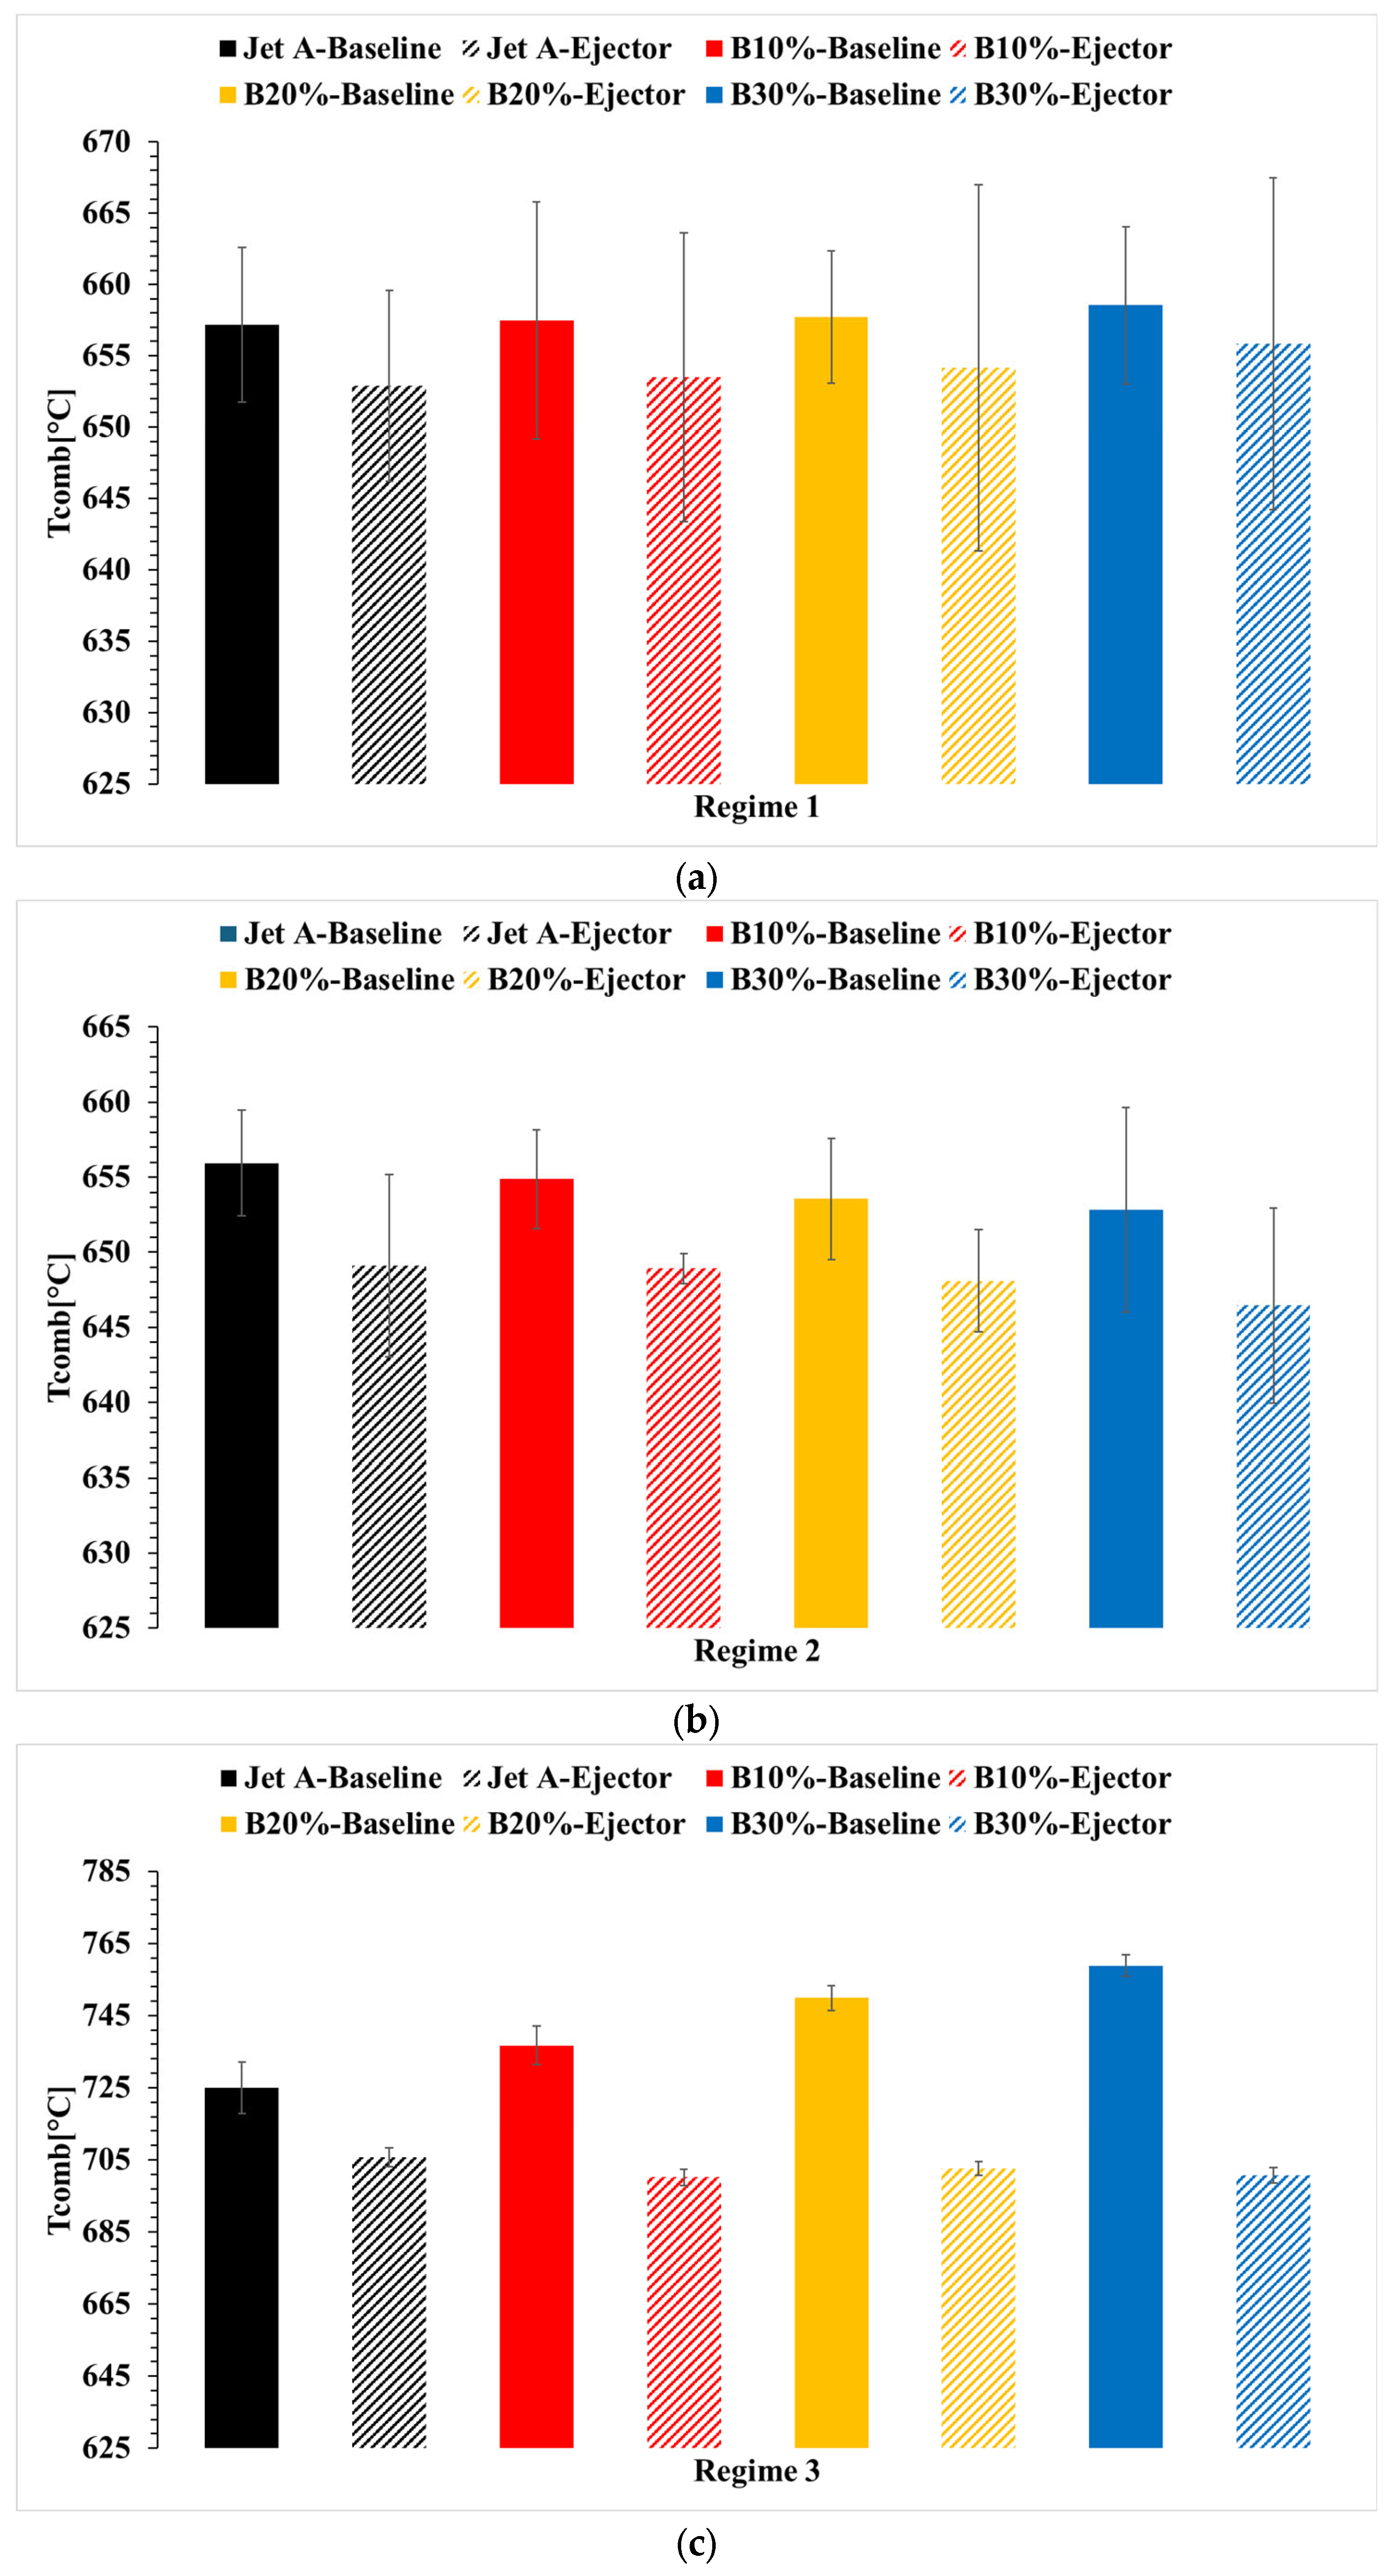
Figure 5, the variation in the combustion gas temperature before the turbine is shown, with and without the ejector for the four fuels used. In
Figure 6, the variation in fuel flow rate (mass flow) is presented. Although the microturbojet engine instrumentation records the flow rate in liters per hour, it was converted into kilograms per second since the density of the blends was measured.
Figure 7 shows the variation in thrust, while
Figure 8 illustrates the variation in specific fuel consumption.
The specific fuel consumption was calculated using the Formula (1):
where F
f is the fuel flow rate expressed in kg/s, and F is the thrust force recorded by the test stand instrumentation.
By using the ejector, the operation of the microturbine engine is altered because the ejector creates a backpressure behind the turbine, which shifts the operating line of the microturbine. As a result, all parameters defining its operation will change when the ejector is present.
To provide a more detailed view of the figures above,
Table 4 below presents the percentage variations compared to the baseline case, when Jet A is used without the ejector.
Analyzing
Figure 5, at first glance, it can be observed that when Jet A fuel is used along with the ejector, there is a noticeable decrease in the combustion gas temperature in front of the turbine.
As is known, Regime 1 is the idle regime and represents a less stable regime compared to the higher regimes. A slight increase in the combustion temperature can be observed as the biodiesel concentration increases. This increase is small, under two degrees Celsius, translating to a 0.05% increase when the biodiesel concentration is 10%, a 0.08% increase when the concentration is 20%, and a 0.21% increase when the concentration is 30%.
When the ejector is used for the same fuels, a significant relative decrease in combustion temperature is observed. Thus, when the ejector is used with Jet A, a decrease of approximately 0.65% is observed. When the ejector is used with 10% biodiesel, the decrease in combustion temperature is 0.56%, with 20% biodiesel, the decrease is 0.46%, and with 30% biodiesel, the temperature in front of the turbine decreases by 0.2%.
Regarding Regime 2, the intermediate regime, it can be observed that when biodiesel is used, a slight decrease in temperature in front of the turbine is noted. Thus, when 10% biodiesel is used, the decrease is 0.16%, when 20% biodiesel is used, the decrease is 0.36% and when 30% biodiesel is used, the decrease is 0.47%. In the case of adding the ejector, a decrease in temperature in front of the turbine is noted. Specifically, when 10% biodiesel and the ejector are used, the temperature drops by 1.07%, when 20% biodiesel and the ejector are used, the decrease is 1.19%, and when 30% biodiesel and the ejector are used, the decrease is 1.44%.
In the case of Regime 3, which is near maximum, it can be observed that when biodiesel is used, there is a slight increase in the temperature in front of the turbine. Specifically, when 10% biodiesel is used, the increase is 1.62%, when 20% biodiesel is used, the increase is 3.43%, and when 30% biodiesel is used, the increase is 4.67%. When the ejector is added, a decrease in temperature in front of the turbine is noted. Specifically, when 10% biodiesel and the ejector are used, the decrease is 3.43%, with 20% biodiesel and the ejector, the decrease is 3.09%, and with 30% biodiesel and the ejector, the decrease is 3.36%.
The error bars in
Figure 5a–c are generally small, indicating low variability and good reproducibility of the combustion temperature measurements. In Regime 1, slightly larger error bars are observed for the B30% blend, especially with the ejector, suggesting minor combustion instability. In Regime 2, error bar differences are minimal, confirming consistent results. In Regime 3, a slight increase in error bar size is noted for higher biodiesel concentrations (B20% and B30%) with the ejector, possibly due to greater combustion fluctuations at higher loads. Overall, the small error bars support the reliability of the results, showing that the observed trends are mainly due to fuel and ejector effects rather than experimental uncertainty.
It can be concluded that the variation in the temperature in front of the turbine does not present significant changes that would endanger the integrity of the microturbine engine.
Regarding the fuel flow, based on
Figure 6 and
Table 3, it can be observed that when biodiesel is used, the fuel consumption (expressed in kg/s) increases, and it increases with the rising concentration of biodiesel. When the ejector is used, the fuel consumption decreases compared to the base case, and when biodiesel blends are used with the ejector, there is an increase in fuel flow, but it is lower than when biodiesel is used without the ejector.
In Regime 1, it can be observed that when Jet A and the ejector are used, fuel consumption decreases by 3.82% compared to the case without the ejector. When 10% biodiesel is used, fuel consumption increases by 1%, with 20% biodiesel, the increase is 2.15%, and with 30% biodiesel, the increase is 3.05%. When the ejector is used with 10% biodiesel, fuel consumption decreases by 0.94% compared to the reference case. When the ejector is used with 20% biodiesel, the increase in fuel consumption is 0.49%, which is smaller than in the case without the ejector. When 30% biodiesel and the ejector are used, the increase in fuel flow is 2.59%, which is also smaller than when the ejector is not used. Thus, it can be concluded that the use of biodiesel blends increases fuel consumption, but the addition of the ejector makes this increase smaller.
In Regime 2, it can be observed that when Jet A and the ejector are used, fuel consumption decreases by 0.14% compared to the case without the ejector. When 10% biodiesel is used, fuel consumption increases by 0.98%, with 20% biodiesel, the increase is 1.98%, and with 30% biodiesel, the increase is 2.87%. When the ejector is used with 10% biodiesel, fuel consumption increases by 0.8% compared to the reference case. When the ejector is used with 20% biodiesel, the increase in fuel consumption is 1.89%, which is smaller than when the ejector was not used. When 30% biodiesel and the ejector are used, the increase in fuel flow is 2.69%, which is smaller than when the ejector is not used. Again, the use of biodiesel blends increases fuel consumption, but the addition of the ejector makes this increase smaller.
In Regime 3, it can be observed that when Jet A and the ejector are used, fuel consumption decreases by 0.49% compared to the case without the ejector. When 10% biodiesel is used, fuel consumption increases by 0.95%, with 20% biodiesel, the increase is 1.96%, and with 30%, biodiesel the increase is 2.71%. When the ejector is used with 10% biodiesel, fuel consumption increases by 0.5% compared to the reference case. When the ejector is used with 20% biodiesel, the increase in fuel consumption is 1.45%, which is smaller than when the ejector was not used. When 30% biodiesel and the ejector are used, the increase in fuel flow is 2.26%, which is smaller than when the ejector is not used. Once again, it is observed that the use of biodiesel blends increases fuel consumption, but the addition of the ejector makes this increase smaller.
The error bars in
Figure 6a–c are generally small across all operating regimes, indicating high measurement precision and stable fuel flow readings. In Regime 1, the B30% blend shows slightly larger variability, particularly with the ejector, which may be linked to minor fluctuations in fuel atomization at low loads. In Regime 2, error bars are consistently minimal for all fuel blends, confirming stable operation and good repeatability. In Regime 3, a modest increase in error bar size is observed for higher biodiesel concentrations, likely due to variations in viscosity and density affecting flow rate. Overall, the limited size of the error bars suggests that the recorded differences are primarily caused by fuel properties and ejector influence rather than measurement uncertainty.
Thus, in all regimes analyzed, the use of biodiesel blends increases fuel consumption, but the presence of the ejector reduces the rate of increase in fuel consumption compared to when biodiesel is used alone without the ejector.
Regarding the propulsive force, based on
Figure 7 and
Table 3, it can be observed that when biodiesel is used, in the case without an ejector, the propulsive force increases and it increases with the rising biodiesel concentration, particularly in the idle regime, which, as mentioned earlier, is a more unstable regime. For the other two regimes, when biodiesel blends are used, the propulsive force decreases. When the ejector is used, the propulsive force increases compared to the base case, and when the ejector and biodiesel blends are used, there is an increase in the propulsive force, even slightly higher than when biodiesel is used without the ejector and even compared to the base case.
Thus, in Regime 1, it can be observed that when Jet A and the ejector are used, the propulsive force increases by 19.74% compared to the case without the ejector. When 10% biodiesel is used, the increase in propulsive force is 5.31%, when 20% biodiesel is used, the increase is 6.41%, and when 30% biodiesel is used, the increase in propulsive force is 5.33%. When the ejector is used with 10% biodiesel, the propulsive force increases by 36.39% compared to the reference case. When the ejector is used with 20% biodiesel, the increase in propulsive force is 36.7%, which is higher than when the ejector is not used, and when 30% biodiesel and the ejector are used, the increase in propulsive force is 36.91%, which is higher than when the ejector is not used. It can thus be concluded that the use of biodiesel blends increases the propulsive force, and the addition of the ejector makes this increase even greater. One explanation could be that biodiesel blends have a higher density compared to Jet A, which increases the propulsive force.
In Regime 2, it can be observed that when Jet A and the ejector are used, the propulsive force increases by 2.28% compared to the case without the ejector. When 10% biodiesel is used, a slight decrease in propulsive force of 0.2% is observed. When 20% biodiesel is used, the decrease in propulsive force is −1.16%, and when 30% biodiesel is used, the decrease in propulsive force is −1.42%. When the ejector is used with 10% biodiesel, the propulsive force increases by 4.13% compared to the reference case. When the ejector is used with 20% biodiesel, the increase in propulsive force is 4.55%, which is higher than when the ejector was not used and when 30% biodiesel and the ejector are used, the increase in propulsive force is 4.68%, which is higher than when the ejector is not used. Thus, it can be concluded that the use of biodiesel blends decreases the propulsive force, but the addition of the ejector results in an increase and it is even higher than the base case. One explanation could be that biodiesel blends have a higher density compared to Jet A, which increases the propulsive force.
In Regime 3, it can be observed that when Jet A and the ejector are used, the propulsive force increases by 5.05% compared to the case without the ejector. When 10% biodiesel is used, a slight decrease in propulsive force of 0.87% is observed. When 20% biodiesel is used, the decrease in propulsive force is −1.04% and when 30% biodiesel is used, the decrease in propulsive force is −0.99%. When the ejector is used with 10% biodiesel, the propulsive force increases by 5.48% compared to the reference case. When the ejector is used with 20% biodiesel, the increase in propulsive force is 5.45%, which is higher than when the ejector was not used and when 30% biodiesel and the ejector are used, the increase in propulsive force is 5.58%, which is higher than when the ejector is not used. It can be concluded that the use of biodiesel blends decreases the propulsive force, but the addition of the ejector results in an increase and it is even higher than the base case. One explanation could be that biodiesel blends have a higher density compared to Jet A, which increases the propulsive force.
The error bars in
Figure 7 are consistently small, reflecting high measurement accuracy and repeatability in thrust data across all regimes. In Regime 1, slightly larger variability is observed for the B30% blend with the ejector, possibly due to minor instability in combustion at lower loads. In Regime 2, error bars remain minimal for all cases, indicating stable engine performance. In Regime 3, a slight increase in error bar size for higher biodiesel concentrations may be linked to variations in combustion temperature and exhaust flow dynamics. Overall, the small magnitude of the error bars confirms that observed thrust differences are primarily attributed to fuel properties and ejector effects rather than measurement uncertainty.
It can be concluded that the use of the ejector is a solution to increase the propulsive force, regardless of the biodiesel blends used.
Further analysis remains to be conducted on specific fuel consumption, which is a parameter that combines both of the quantities analyzed above: fuel consumption and force. From the analysis above, it is clear that fuel consumption increases, but at the same time, there is also an increase in propulsive force. Specific fuel consumption quantifies both of these key parameters.
Regarding specific fuel consumption, based on
Figure 8 and
Table 3, it can be observed that when biodiesel is used, in the case without an ejector, specific fuel consumption decreases. However, the decrease becomes smaller as the biodiesel concentration increases, particularly in the idle regime, which, as mentioned earlier, is a more unstable regime. For the other two regimes, when biodiesel blends are used, specific fuel consumption increases. When the ejector is used, specific fuel consumption decreases compared to the base case. Additionally, when the ejector and biodiesel blends are used, there is also a decrease in specific fuel consumption, but the decrease diminishes as the biodiesel concentration increases.
In Regime 1, it can be observed that when Jet A and the ejector are used, specific fuel consumption decreases by 19.67% compared to the case without the ejector. When 10% biodiesel is used, the decrease in specific fuel consumption is 4.09%. When 20% biodiesel is used, the decrease is 4.01% and when 30% biodiesel is used, the decrease in specific fuel consumption is 2.17%. When the ejector is used with 10% biodiesel, specific fuel consumption decreases by 27.37% compared to the reference case. When the ejector is used with 20% biodiesel, the decrease in specific fuel consumption is 26.49%, which is higher than when the ejector was not used. When 30% biodiesel and the ejector are used, the decrease in specific fuel consumption is 25.07%, which is also higher than when the ejector was not used.
In Regime 2, it can be observed that when Jet A and the ejector are used, specific fuel consumption decreases by 2.37% compared to the case without the ejector. When 10% biodiesel is used, specific fuel consumption increases by 1.18%. When 20% biodiesel is used, specific fuel consumption increases by 3.18%, and when 30% biodiesel is used, specific fuel consumption increases by 4.36%. When the ejector is used with 10% biodiesel, specific fuel consumption decreases by 3.2% compared to the reference case. When the ejector is used with 20% biodiesel, the decrease in specific fuel consumption is 2.54%, and when 30% biodiesel and the ejector are used, the decrease in specific fuel consumption is 1.9%.
In Regime 3, it can be observed that when Jet A and the ejector are used, specific fuel consumption decreases by 5.27% compared to the case without the ejector. When 10% biodiesel is used, specific fuel consumption increases by 1.84%. When 20% biodiesel is used, specific fuel consumption increases by 3.03%, and when 30% biodiesel is used, specific fuel consumption increases by 3.74%. When the ejector is used with 10% biodiesel, specific fuel consumption decreases by 4.72% compared to the reference case. When the ejector is used with 20% biodiesel, the decrease in specific fuel consumption is 3.78%, and when 30% biodiesel and the ejector are used, the decrease in specific fuel consumption is 3.15%.
The error bars in
Figure 8 are generally small, indicating reliable and consistent measurements of specific fuel consumption (SFC) across all operating regimes. The error was calculated based on error propagation according to the specific fuel consumption formula, ensuring that uncertainties from fuel flow rate and thrust measurements were accurately reflected. In Regime 1, slightly larger error margins appear for higher biodiesel concentrations, particularly B30% with the ejector, which may be due to small fluctuations in fuel flow at low loads. In Regime 2, error bars are minimal, confirming stable operating conditions and consistent fuel consumption measurements. In Regime 3, a modest increase in variability is seen for biodiesel blends without the ejector, likely related to minor combustion instabilities at higher loads. Overall, the low magnitude of error bars suggests that the reported SFC differences reflect genuine performance trends rather than experimental uncertainty.
Thus, it can be concluded that the use of biodiesel blends contributes to an increase in specific fuel consumption, while the addition of the ejector results in a decrease. Therefore, specific fuel consumption is lower when biodiesel blends and the ejector are used compared to the base case with Jet A. As the biodiesel concentration increases, the decrease in specific fuel consumption becomes smaller than when Jet A is used with an ejector.
3.4. Acustic Performance
The acoustic characterization of microturbine engines is essential for understanding the impact of fuel variations on noise emissions, particularly when integrating alternative fuels such as biodiesel blends. Biodiesel mixtures exhibit different combustion characteristics compared to conventional Jet A fuel, which can influence ignition dynamics, heat release profiles, and exhaust flow properties, ultimately affecting noise generation.
The testing stand is designed to evaluate the acoustic response of a microturbine engine operating on biodiesel mixture fuels. This setup enables a comprehensive assessment of noise emissions, considering variations in fuel properties, combustion characteristics, and exhaust flow dynamics.
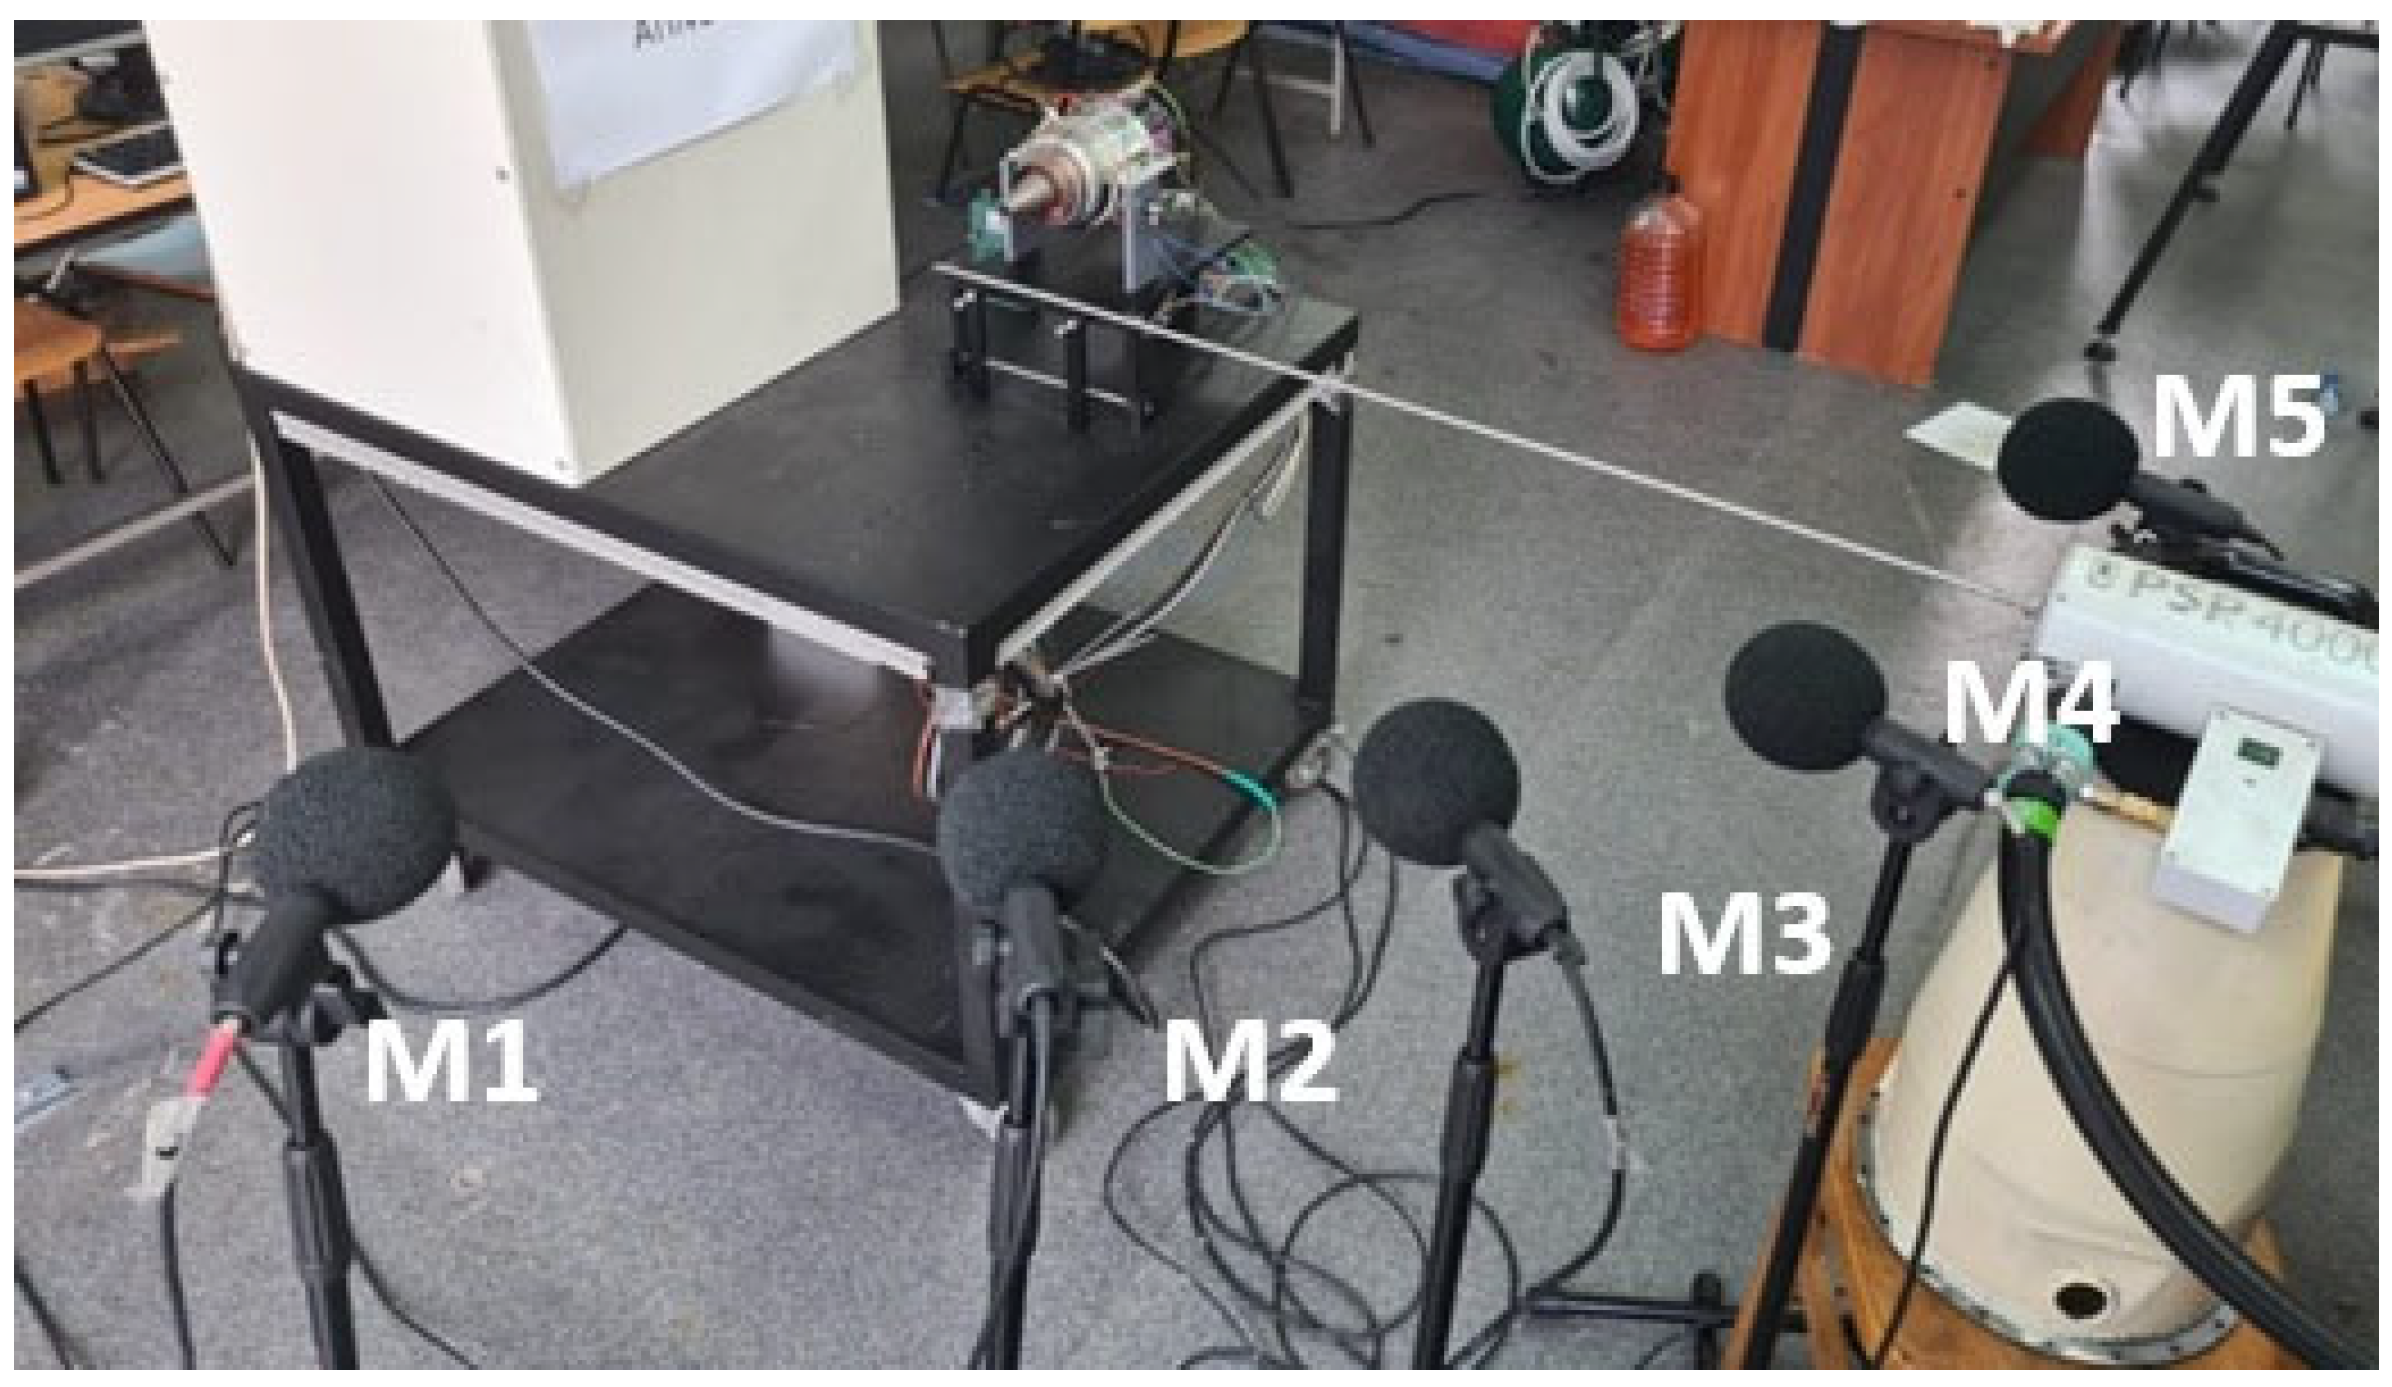
A polar microphone arrangement is implemented to capture sound waves from multiple directions, facilitating the study of noise directivity and its dependence on biodiesel blends.
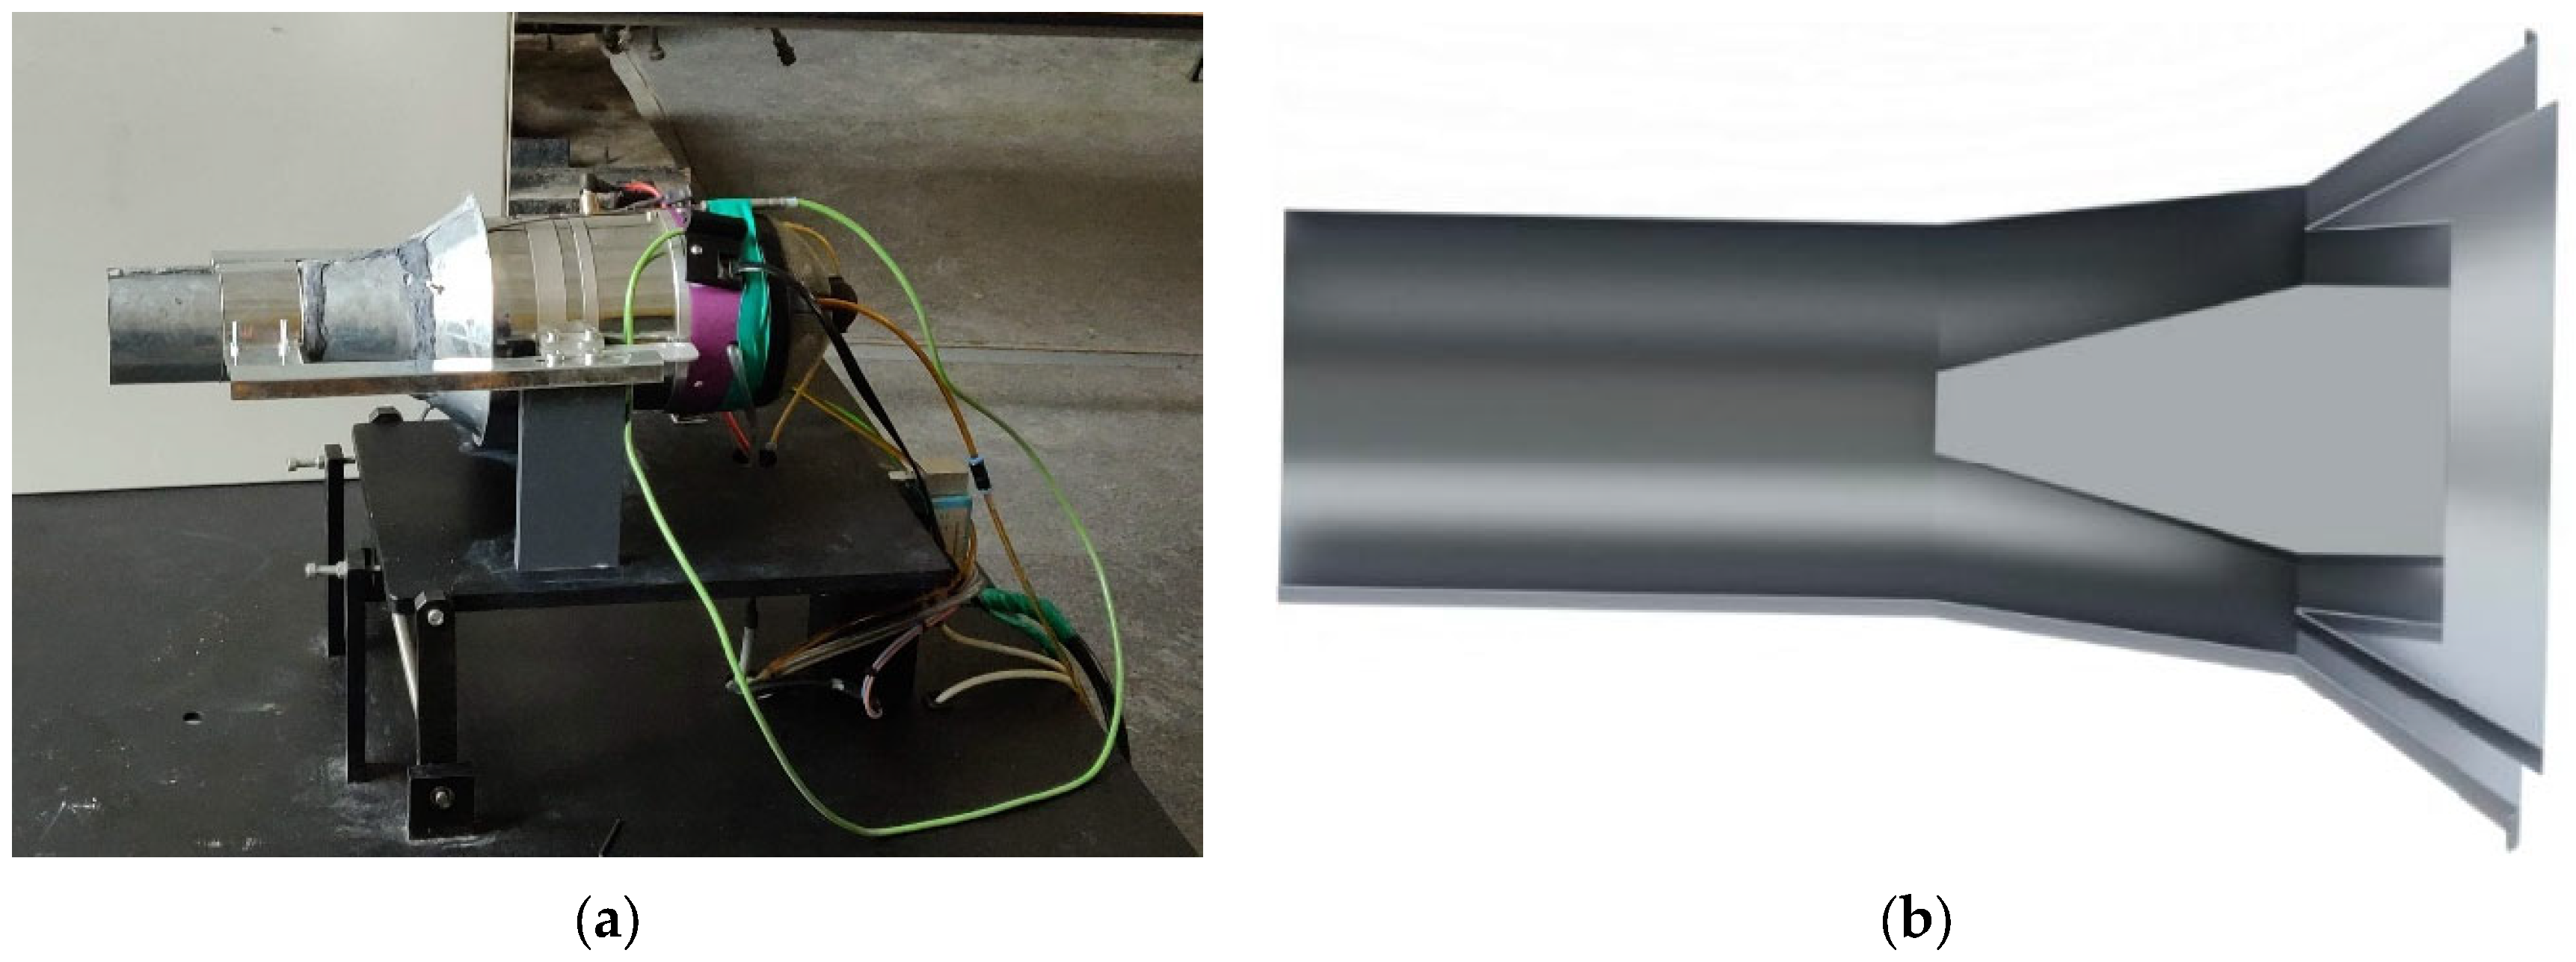
The test engine is mounted on a rigid platform to ensure stability during operation and minimize external vibrations that may interfere with acoustic measurements. A fuel delivery system capable of supplying different biodiesel mixture ratios is incorporated to allow controlled testing of various blends. Five microphones are arranged in a circular (polar) configuration in a quarter of a circle around the engine to record sound propagation from all directions. A polar microphone array is employed to capture noise emissions symmetrically around the microturbine engine, ensuring spatially distributed sound measurements. The microphones are positioned equidistantly around the engine at equal angular intervals. A high-precision recording system with preamplifiers, analog-to-digital converters, and data storage ensures accurate noise measurement. The engine exhaust system includes mechanical modifications for ejector integration to assess its impact on noise attenuation. A control interface allows the operator to adjust engine parameters such as fuel blend ratio, throttle position, and exhaust configurations while monitoring performance metrics.
The microturbine engine is running using different biodiesel mixture ratios (e.g., %.) to assess the impact of fuel properties on noise emissions. Operating conditions such as engine speed, load, and throttle settings are systematically varied to observe acoustic variations under different power outputs.
The DEWEsoft Sirius multichannel system (24-bit ADC resolution, high dynamic range > 160 dB, up to 200 kS/s sampling rate per channel, ultra-low noise and distortion) was used, which integrates high-speed analog-to-digital conversion with a 50 ks/s sampling rate, real-time signal processing, and advanced spectral analysis techniques, allowing for precise noise characterization across different biodiesel mixtures and ejector configurations. The Dewesoft 2024.3 SPL (Sound Pressure Level) software was used for signal post-processing. This software is designed to measure, analyze, and visualize sound pressure levels in accordance with international standards (IEC 61672 Calss 1, IEC 60651/60804 and ANSI S1.4). For this study, we used a 5 G.R.A.S. 46AE free-field microphone designed for precise acoustic measurements in applications where the primary sound source is known, allowing direct incidence positioning. The 46AE meets the IEC 61094 WS2F and IEC 61672 Class 1 standards, ensuring high accuracy and reliability in professional measurement environments.
The microphones simultaneously record noise emissions at each polar location. Sound pressure levels and frequency spectra are measured to determine changes in noise intensity and tonal characteristics. Time-domain signals are analyzed to identify transient noise phenomena such as combustion instability.
Using the polar microphone data, noise directivity maps are generated to visualize how biodiesel combustion influences the spatial distribution of sound, compared with the acoustic response produced by the Jet A fuel and using the nozzle as a reference.
Results from different fuel mixtures are compared to determine whether biodiesel leads to reductions or amplifications in noise emissions relative to conventional Jet A fuel.
A reference acoustic source is used to calibrate each microphone before testing.
Identification of noise variations induced by biodiesel blends was followed, particularly in combustion-related frequencies, and determination of whether biodiesel mixtures contribute to smoother combustion and reduced acoustic emissions was performed. The results are insights into how noise directivity changes with fuel composition, leading in the design of quieter microturbine engines. Assessment was made regarding whether ejector integration further enhances noise reduction when combined with biodiesel fuel usage.
Based on the recordings made with the five microphones, the sound pressure level (SPL) values were recorded, and the SPL values are presented in
Table 5.
Based on the analysis in
Table 4, it can be observed that the presence of the ejector reduces the overall noise level. For a better understanding of the phenomenon caused primarily by the presence of the ejector, the directivity measured by the five microphones for the three operating regimes and the four fuels used is presented below.
Thus,
Figure 11 shows the directivity for Jet A baseline and ejector for the three studied regimes.
In
Figure 12, the directivity of the Jet A + 10% biodiesel baseline and ejector is presented for the three studied regimes.
In
Figure 13, the directivity of the Jet A + 20% biodiesel baseline and ejector nozzle is presented for the three studied regimes.
In
Figure 14, the directivity of the Jet A + 30% biodiesel baseline and ejector is presented for the three studied regimes.
From the polar graphs it is noticeable that the integration of a nozzle ejector in a microturbine engine has significantly influenced the noise emissions by reducing the noise levels for all the microphone positions. This is probably because of modifications to the exhaust flow dynamics, turbulence intensity, and acoustic wave propagation.
A frequency-domain analysis is conducted to assess how fuel blending and nozzle use affect the dominant tonal and overall noise frequencies.
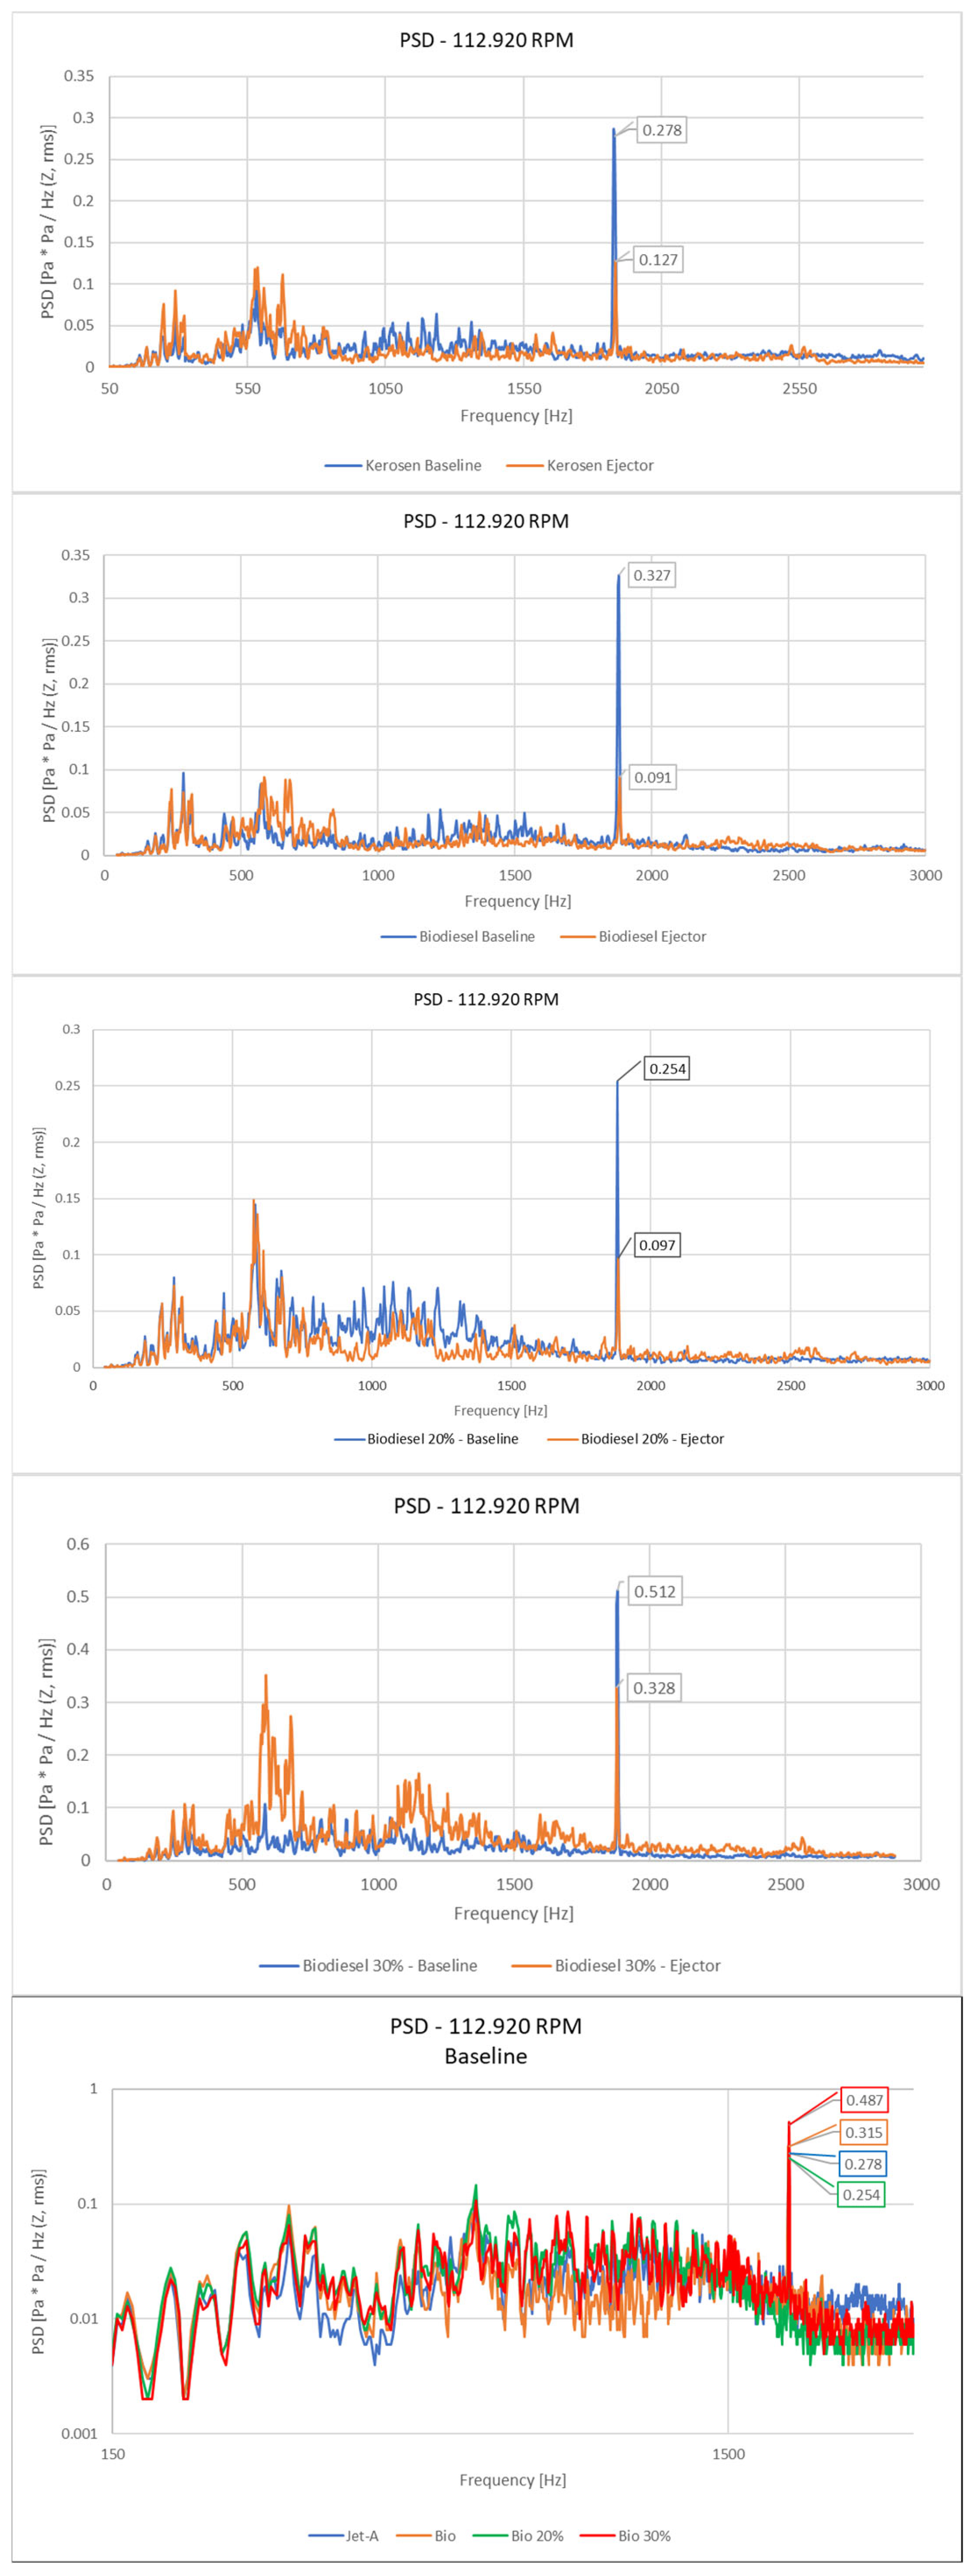
In
Figure 15, a lowered level at the tonal rotational frequency (R3-112.920 RPM) can be observed when the nozzle is used for all three biodiesel combinations (biodiesel, biodiesel 20%, and biodiesel 30%). All the following analyses were performed with the R3 regime, considered the noisiest one. For comparing both configurations, baseline or ejector, a linearly weighted PSD (Power Spectral Density) amplitude spectrum was applied by processing the signal with Hanning windowing, an 8192-frequency resolution, and linear overall averaging with 50% overlap.
Figure 15 illustrates that without using the ejector nozzle, the highest noise levels are observed when utilizing a 30% biodiesel blend, while also Jet A fuel, simple biodiesel, and biodiesel 20% show similar spectral signatures.
Figure 16 illustrates that the highest noise levels are observed when utilizing a 30% biodiesel blend in conjunction with the ejector nozzle configuration, while simple biodiesel and biodiesel 20% show similar spectral signatures.
The exact rotational speed was extracted from the acoustic signal to see how the speed control could be affected by using the ejector nozzle. The goal was to examine how the ejector nozzle influences the engine’s speed control by analyzing its acoustic signature. The ejector nozzle can influence the operating conditions of the microturbine, potentially affecting rotational speed stability due to backpressure changes, as it can increase or decrease pressure in the exhaust, influencing turbine load, changes in mass flow rate, and turbulence, which can impact speed regulation and combustion instabilities and may introduce fluctuations in rotational speed. By extracting the rotational speed from the acoustic signal, we can determine whether the ejector nozzle disrupts or stabilizes speed control mechanisms, helping to optimize engine efficiency and noise reduction strategies.
Figure 17,
Figure 18 and
Figure 19 present the speed variation in Regime 1 [rpm] for biodiesel blends of 10%, 20%, and 30%, respectively. In each case, the results are compared between the baseline configuration (a) and the ejector integration (b), highlighting the influence of biodiesel concentration on engine performance.
Using acoustic signal analysis to determine rotational speed offers several advantages over traditional direct sensor-based measurements (such as optical or magnetic encoders). Acoustic analysis can detect additional information related to engine operation, like combustion instabilities, bearing or blade defects, or aerodynamic disturbances (e.g., turbulence in exhaust flow). On the other hand, encoders, despite the precision of speed measurement, can offer data only on rotational speed without insight into other possible mechanical or combustion issues, which might be induced by using the ejector nozzle. For such a research objective, as is in the present article, we considered that having access to both techniques could offer better insight into the phenomenon.
We have observed from the exact frequency tracking that the speed control is kept in the required limits for all configurations and all regimes, a sign that, on average, the control system is adapting, although in the case of biodiesel 30%, small anomalies appeared in the signal, probably from nonlinear instabilities in combustion due to fuel characteristics and not so much from using the ejector nozzle (such instabilities were observed in both configurations, baseline or ejector). A deeper analysis could be performed in the future on this issue, this being an in-depth study requiring a lot of processing power that is beyond the general scope of this article. We have used speed detection using exact frequency tracking from the spectrum only in lower regimes because of the limitation of expensive processing power, which is necessary for such an analysis. While direct sensor measurements (fixed encoders implemented on the testing stand) provide highly accurate speed readings, acoustic analysis offers a broader and cost-effective method for both speed estimation and anomaly detection in microturbine engines.
To have an overview on the entire spectrum for all three regimes and using all combination of fuels (biodiesel, biodiesel 20%, and biodiesel 30%), without and with using of the ejector nozzle, a waterfall spectrum of sound levels is presented in
Figure 20,
Figure 21 and
Figure 22. From these graphs, it can be observed that overall, by using the ejector nozzle, the sound levels are lower than in the configuration operating without one. Also, it can be observed that the spectral distributions of noise levels are similar for biodiesel and biodiesel 20%, but an increase in noise levels appears when using biodiesel 30% with the ejector nozzle in the R3 regime.
This waterfall spectral representation was employed to identify potential short-term or impulsive combustion instabilities that may arise due to the use of the biodiesel combinations or ejector nozzle and could be detected through this analytical approach.
Also, a deeper analysis was used in order to identify such phenomena: Short-Time Fourier Transform (STFT) kurtosis analysis,
Figure 23,
Figure 24,
Figure 25 and
Figure 26. STFT-kurtosis analysis is a statistical technique used on acoustics signals, particularly for detecting transient, impulsive, and non-stationary noise characteristics in complex systems such as microturbine engines. This method combines time–frequency analysis, STFT, with statistical evaluation via the fourth-order statistical moment, kurtosis (which is derived from the fourth power of deviations from the mean), to identify abrupt changes in the acoustic signal that might indicate combustion instabilities, turbulence effects, or ejector-induced disturbances.
The blocks of signal used for this statistical analysis were 0.1 s in duration, with kurtosis calculated block-wise, applied on STFT (1024 block size, 8192 FFT size, Hanning window, 50% overlapping), considered sufficient for identifying short transient events. For this analysis, we used the acoustic signal of one microphone. Due to the small distance from the microphone’s position to the ejector, it was considered a near field measurement, without significant influence from the exterior acoustic space or the room reverberation (the space was a closed one, but with an open area in the direction of ejection).
There were no significant instabilities observed on the STFT kurtosis spectrum; on the contrary, it appears there was a more stable response from the configuration with the ejector nozzle, at least in the R1 regime for all configurations, although there is a significant difference between all biodiesel configurations and the Jet A one, which has shown a more stable behavior, with kurtosis values around 3. Significant instabilities were observed for all combinations when passing from one regime to another, where nonlinear phenomena appear. A debatable result was observed with the 30% biodiesel blend and ejector, where the STFT kurtosis indicated more stable behavior compared to the other biodiesel mixtures. This contrasts with the previous analysis, which identified this operating regime as being louder. In this context, the 30% biodiesel blend with an ejector was identified as louder, likely due to the complex interactions between the fuel blend and the ejector nozzle, which may have caused increased turbulence or exhaust flow irregularities, not necessarily leading to higher noise emissions. In the STFT kurtosis analysis, the acoustic signal is evaluated from a statistical perspective, focusing on the impulsive nature of the noise rather than just its level. The lower kurtosis or more stable behavior indicates that the noise associated with this regime might be less impulsive or more evenly distributed over time, even though it was perceived as louder in previous assessments. A lower kurtosis suggests that, although the overall sound may be loud, it could be more uniform and without significant short, sharp spikes of noise. Also, the ejector could be introducing a form of flow stabilization that reduces short-term pressure fluctuations, making the noise less impulsive in the statistical analysis, even though it may still have higher overall intensity. Such stabilization was observed for all fuel combinations (Jet A, biodiesel 10%, biodiesel 20% or biodiesel 30%) when the ejector was used, compared with baseline cases.
In depth research should be performed in the future to analyze the instabilities resulting from biodiesel burning.
