Article

Tsukamoto Fuzzy Logic Controller for Motion Control Applications: Assessment of Energy Performance

by
Luis F. Olmedo-García
1,2,
José R. García-Martínez
1,2,*,
Juvenal Rodríguez-Reséndiz
3,
Brenda S. Dublan-Barragán
4,
Edson E. Cruz-Miguel
1,2 and
Omar A. Barra-Vázquez
1,2
1
Laboratorio de Control y Robótica, Facultad de Ingeniería en Electrónica y Comunicaciones, Universidad Veracruzana, Poza Rica 93390, Mexico
2
Análisis de Sistemas y Tecnologías Emergentes, Facultad de Ingeniería en Electrónica y Comunicaciones, Universidad Veracruzana, Poza Rica 93390, Mexico
3
Facultad de Ingeniería, Universidad Autónoma de Querétaro, Querétaro 76010, Mexico
4
Sistemas Inteligentes, Ingeniería Mecatrónica, Universidad Politécnica de Querétaro, Querétaro 76240, Mexico
*
Author to whom correspondence should be addressed.
Technologies 2025, 13(9), 387; https://doi.org/10.3390/technologies13090387
Submission received: 19 July 2025 / Revised: 19 August 2025 / Accepted: 27 August 2025 / Published: 1 September 2025

Abstract

This work presents a control strategy designed to reduce the energy consumption of direct current motors by implementing smooth motion trajectories in a point-to-point control system, utilizing a fuzzy logic controller based on the Tsukamoto inference method. The proposed controller’s energy performance was experimentally compared to that of a conventional PID controller, considering three motion profiles: parabolic, trapezoidal, and S-curve. The results demonstrate that the combination of the fuzzy controller with smooth trajectories effectively reduces energy consumption without compromising motion accuracy. Under no-load conditions, average energy savings of 11.77% for the parabolic profile, 9.27% for the trapezoidal profile, and 3.45% for the S-curve profile were achieved. This improvement remained consistent even when a load was introduced to the system. To validate these findings, the coefficient of variation was calculated, revealing lower dispersion in the fuzzy controller’s results, indicating greater consistency in energy efficiency. Furthermore, Welch’s t-tests were conducted for each profile and load condition, with all p-values falling below the 0.05 significance threshold, confirming the statistical relevance of the observed differences.

Graphical Abstract

1. Introduction

Motion control has undergone significant evolution in recent years, driven by advances in modern control techniques and their integration with artificial intelligence methods. This convergence has enabled the development of more precise, adaptive, and efficient strategies. In particular, its application in mechatronic systems has demonstrated notable improvements both in implementation on embedded platforms, thanks to the increased processing capacity, and in the optimization of energy consumption associated with actuators, especially in systems based on electric motors [1].
Although increasingly advanced motion control techniques have been proposed in recent years, the fundamental objective remains the same: to minimize the path tracking error while simultaneously reducing energy consumption, which depends mainly on the performance of the controller used [2]. In this context, various control strategies have been developed, including classical approaches such as proportional–integral–derivative (PID) controllers and state-space systems, as well as more recent techniques based on neural networks and fuzzy logic [3,4,5]. Fuzzy logic has demonstrated adaptability and the capability to make decisions in environments dominated by uncertainty and vagueness [6]. Early demonstrations include high-speed fuzzy hardware stabilizing an inverted pendulum, highlighting the suitability of fuzzy control for fast and nonlinear dynamics [7]. Although dedicated hardware architectures for fuzzy systems enable real-time performance with low latency and deterministic timing [8], software implementations are still the most widespread due to their flexibility, ease of prototyping, and integration into embedded microcontrollers [9].
In the field of servo systems, the choice of fuzzy inference method directly affects the accuracy, computational efficiency, and interpretability. Tsukamoto inference offers the advantage of producing crisp outputs through monotonic membership functions, which ensure smooth transitions in the control signal and avoid abrupt variations that may stress the actuators [10]. Compared to Mamdani’s method, Tsukamoto’s method does not rely on centroid-based defuzzification, which is computationally demanding; thus, it offers more precise control in dynamic applications [11]. On the other hand, unlike Sugeno’s method, which is highly efficient for real-time implementation due to its linear or constant consequents but often reduces the interpretability of the system, Tsukamoto’s method maintains a balance between transparency and numerical precision [12]. However, the requirement of designing monotonic output membership functions increases the complexity of the rule base compared to Mamdani’s method, and the computational load is higher than that of Sugeno’s method [13]. Experimental studies in energy-related applications, such as heating, ventilation, and air conditioning (HVAC) systems, confirm that the Tsukamoto and Sugeno methods can achieve higher energy savings compared to Mamdani’s method, highlighting Tsukamoto’s method as a suitable compromise between interpretability and control smoothness [14].
The following points highlight the principal contributions of the proposed approach:
  • This work proposes and validates a motion controller based on Tsukamoto fuzzy inference, which aims to reduce energy consumption during trajectory execution without compromising tracking accuracy in a linear platform.
  • The Tsukamoto fuzzy logic controller (TFLC), due to its modular and adaptable nature, facilitates direct implementation in microcontroller-based embedded systems. Thanks to its rule-based structure and well-defined membership functions, the TFLC can be integrated relatively easily into low-power and resource-limited platforms, without requiring advanced computing units or specialized hardware.
  • A statistical validation methodology is proposed to evaluate the energy performance of the TFLC, using metrics such as the coefficient of variation (CV) and Welch’s t-test. This strategy enables the analysis of the consistency and statistical significance of the TFLC’s energy consumption improvements under various motion profiles and load conditions, thereby providing a rigorous framework to support the controller’s effectiveness in embedded and real-time applications.
To generate the controller’s reference trajectory, three motion profiles commonly used in motion control applications were employed: the trapezoidal velocity profile, the parabolic profile, and the S-curve profile. Each of these profiles offers distinct characteristics in terms of smoothness, acceleration, and response time, enabling the evaluation of controller performance under various dynamic conditions.
The paper is organized as follows. Section 2 presents related work, with an emphasis on previous motion control strategies and energy optimization approaches. Section 3 describes the motion profiles used for trajectory generation, introduces the fundamentals of fuzzy systems, and details the design of the proposed controller based on the TFLC. Section 4 presents the experimental results, with a focus on the controller’s energy performance. Section 5 discusses the results, highlighting the practical implications of the proposed controller, as well as its advantages and limitations. Finally, Section 6 presents the general conclusions of the work and suggests possible future research directions.

2. Related Works

Recently, several approaches have been proposed to reduce the energy consumption in motion control systems. These include software-based techniques such as optimizing the motion profile parameters, trajectory planning, and control strategies. Carabin G. and Vidoni R. [15] presented an analytical method to minimize energy consumption in point-to-point motions. They derived expressions for profiles based on polynomial and cycloidal functions to compute and optimize the energy usage. Similarly, Hosseini S. and Hahn I. [16] formulated a nonlinear optimal control problem that minimizes energy consumption by generating trajectories with smooth velocity and acceleration phases. On the experimental side, Montalvo et al. [17] developed a low-cost FPGA-based motion control system for DC motors that compares the energy performance of parabolic and trapezoidal velocity profiles. Their results showed a 17.3% reduction in energy consumption when using the parabolic profile; however, statistical validation was not conducted. Tolochko O. and Rozkariaka P. [18] proposed asymmetric reference trajectories that reduced the dynamic losses in position-controlled drives. Additionally, Nshama et al. [19] addressed the trade-off between energy savings and cycle time by introducing Pareto-optimal corner smoothing in industrial feed drives. Some studies have focused on specific motion profiles. For instance, Assad F. et al. [20] employed particle swarm optimization for S-curve trajectories to reduce the energy consumed, while Halinga M.S. et al. [21] introduced a modified S-curve profile and used a genetic algorithm to balance energy and time in coverage tasks. These works emphasize that motion profiles provide significant energy savings when carefully integrated with the control system. In this regard, various studies have proposed advanced control strategies to minimize losses while maintaining accurate motion. Raisch A. and Sawodny O. [22] proposed an energy-optimal feedforward control strategy for electromechanical drives, derived analytically using Pontryagin’s maximum principle. Their approach accounts for motor torque limits, friction, and system dynamics and generates reference trajectories that minimize the electrical energy consumption. Wang B. et al. [23] introduced a synchronous tracking algorithm using double-loop control for servo systems, demonstrating improved tracking and reduced control effort, which resulted in a decrease in peak current. In industrial contexts, Cicek et al. [24] experimentally validated an asymmetric S-curve trajectory generation strategy using a cascade P/PI controller with feedforward compensation for accurate point-to-point tracking under motion constraints. Fuzzy logic-based controllers have also been used in adaptive controllers for motion control [25]. Lee S.Y. et al. [26] employed a fuzzy inference system for DC motor position control, enabling dynamic switching between S-curve velocity profiles based on load estimation, which led to improved robustness and reduced overshoot. Similarly, García-Martínez et al. [27] applied a PID-type fuzzy controller for trajectory tracking in real-time motion applications. Regarding fuzzy controllers based on the Tsukamoto inference method, there is limited research exploring their application in robotics and control systems. Meliani H. et al. [28] proposed the Fuzzy Tsukamoto Simulated Annealing (FTSA) algorithm for robot path planning in static environments. Khoukhi et al. [29] developed a fuzzy–neuro control strategy for the optimal time–energy trajectory planning of a 3-DoF planar manipulator. The controller computes actuator torques that minimize energy consumption while satisfying actuator dynamics and workspace constraints. Finally, Sunardi et al. [30] implemented a Tsukamoto fuzzy inference system to control the fan speed based on temperature and humidity data in an IoT-based room monitoring setup. They demonstrated the method’s adaptability beyond motion control. Although many studies have explored energy-saving control strategies, motion profiles, and fuzzy logic-based controllers independently, a clear research gap remains; no study has fully integrated smooth trajectories with a Tsukamoto fuzzy controller in a real-time embedded system. Moreover, a common limitation emerges: experimental validation is either lacking or limited to simulations, and very few studies assess energy-related metrics. Such integration, particularly when validated through physical experimentation and statistical metrics, represents a promising direction for the development of energy-efficient motion control systems.

3. Materials and Methods

This section presents background information regarding motion profiles, the design of the TFLC, and the implementation of the motion control system on an embedded platform.

3.1. Motion Profiles

In motion control systems, trajectory planning refers to the generation of a time-dependent function that defines the desired position of a system at each instant [31]. These trajectories are often referred to as motion profiles [32]. According to Kröger T. [33], a motion profile defines not only the position x ( t ) but also the velocity x ˙ ( t ) , acceleration x ¨ ( t ) , and jerk x ( t ) throughout the motion. The choice of motion profile has a significant impact on system behavior, as it determines how smoothly the system transitions between different motion phases. Proper selection can reduce energy consumption, minimize the execution time, and avoid mechanical vibrations or structural excitation [34]. Polynomial profiles define the position, velocity, and acceleration based on constraints at specific time points and the total duration T required to complete the motion [35]. The resulting model is a polynomial function whose degree depends on the number of constraints imposed.
The trapezoidal velocity profile is used in industrial applications due to its simplicity, consisting of three sequential phases of duration T a : constant acceleration, constant velocity, and constant deceleration. Although the velocity is continuous, the profile introduces discontinuities in acceleration at phase transitions [36]. The parabolic velocity profile provides smoother motion compared to the trapezoidal profile due to its continuous acceleration. The position is characterized by a third-degree polynomial function, whereas the velocity is quadratic [17].
To address the presence of abrupt changes in acceleration, the S-curve profile introduces continuous acceleration and limited jerk x ( t ) . Ensuring that jerk remains within predefined limits helps to reduce mechanical stress and improves motion continuity. The s-curve model used in this work is a seven-segment profile, proposed in [27]. Figure 1 shows the motion profiles described for the velocity.

3.2. Tsukamoto Fuzzy Logic Controller Design

Unlike conventional fuzzy controllers [9,37], the proposed TFLC employs two interconnected fuzzy inference systems, one for proportional control and another to tune the derivative gain adaptively. This structure employs monotonic sigmoid membership functions, ensuring a smooth control signal even in the presence of sudden changes in the error. Figure 2 depicts the structure of the controller. The first system takes the position error e ( t ) as the linguistic input variable and outputs the control signal u p ( t ) , analogous to the proportional action of a classical controller. In this case, the position error is obtained from the deviation between the actual position x ( t ) and the reference point x s p ( t ) given by the trajectory generator. The second system takes the derivative of the error e ˙ ( t ) as input and outputs a constant K d , which is used to generate the derivative control action u d ( t ) .
The overall control signal u ( t ) , given by Equation (1), combines both signals and is applied to the test platform.
u ( t ) = u p ( t ) + K d e ˙ ( t )

3.2.1. Fuzzy System I

The universe of discourse for the position error is the interval [ E N , E P ] , where E N is the absolute value of the maximum possible negative error, and E P is the maximum positive error, both determined by the physical length of the platform.
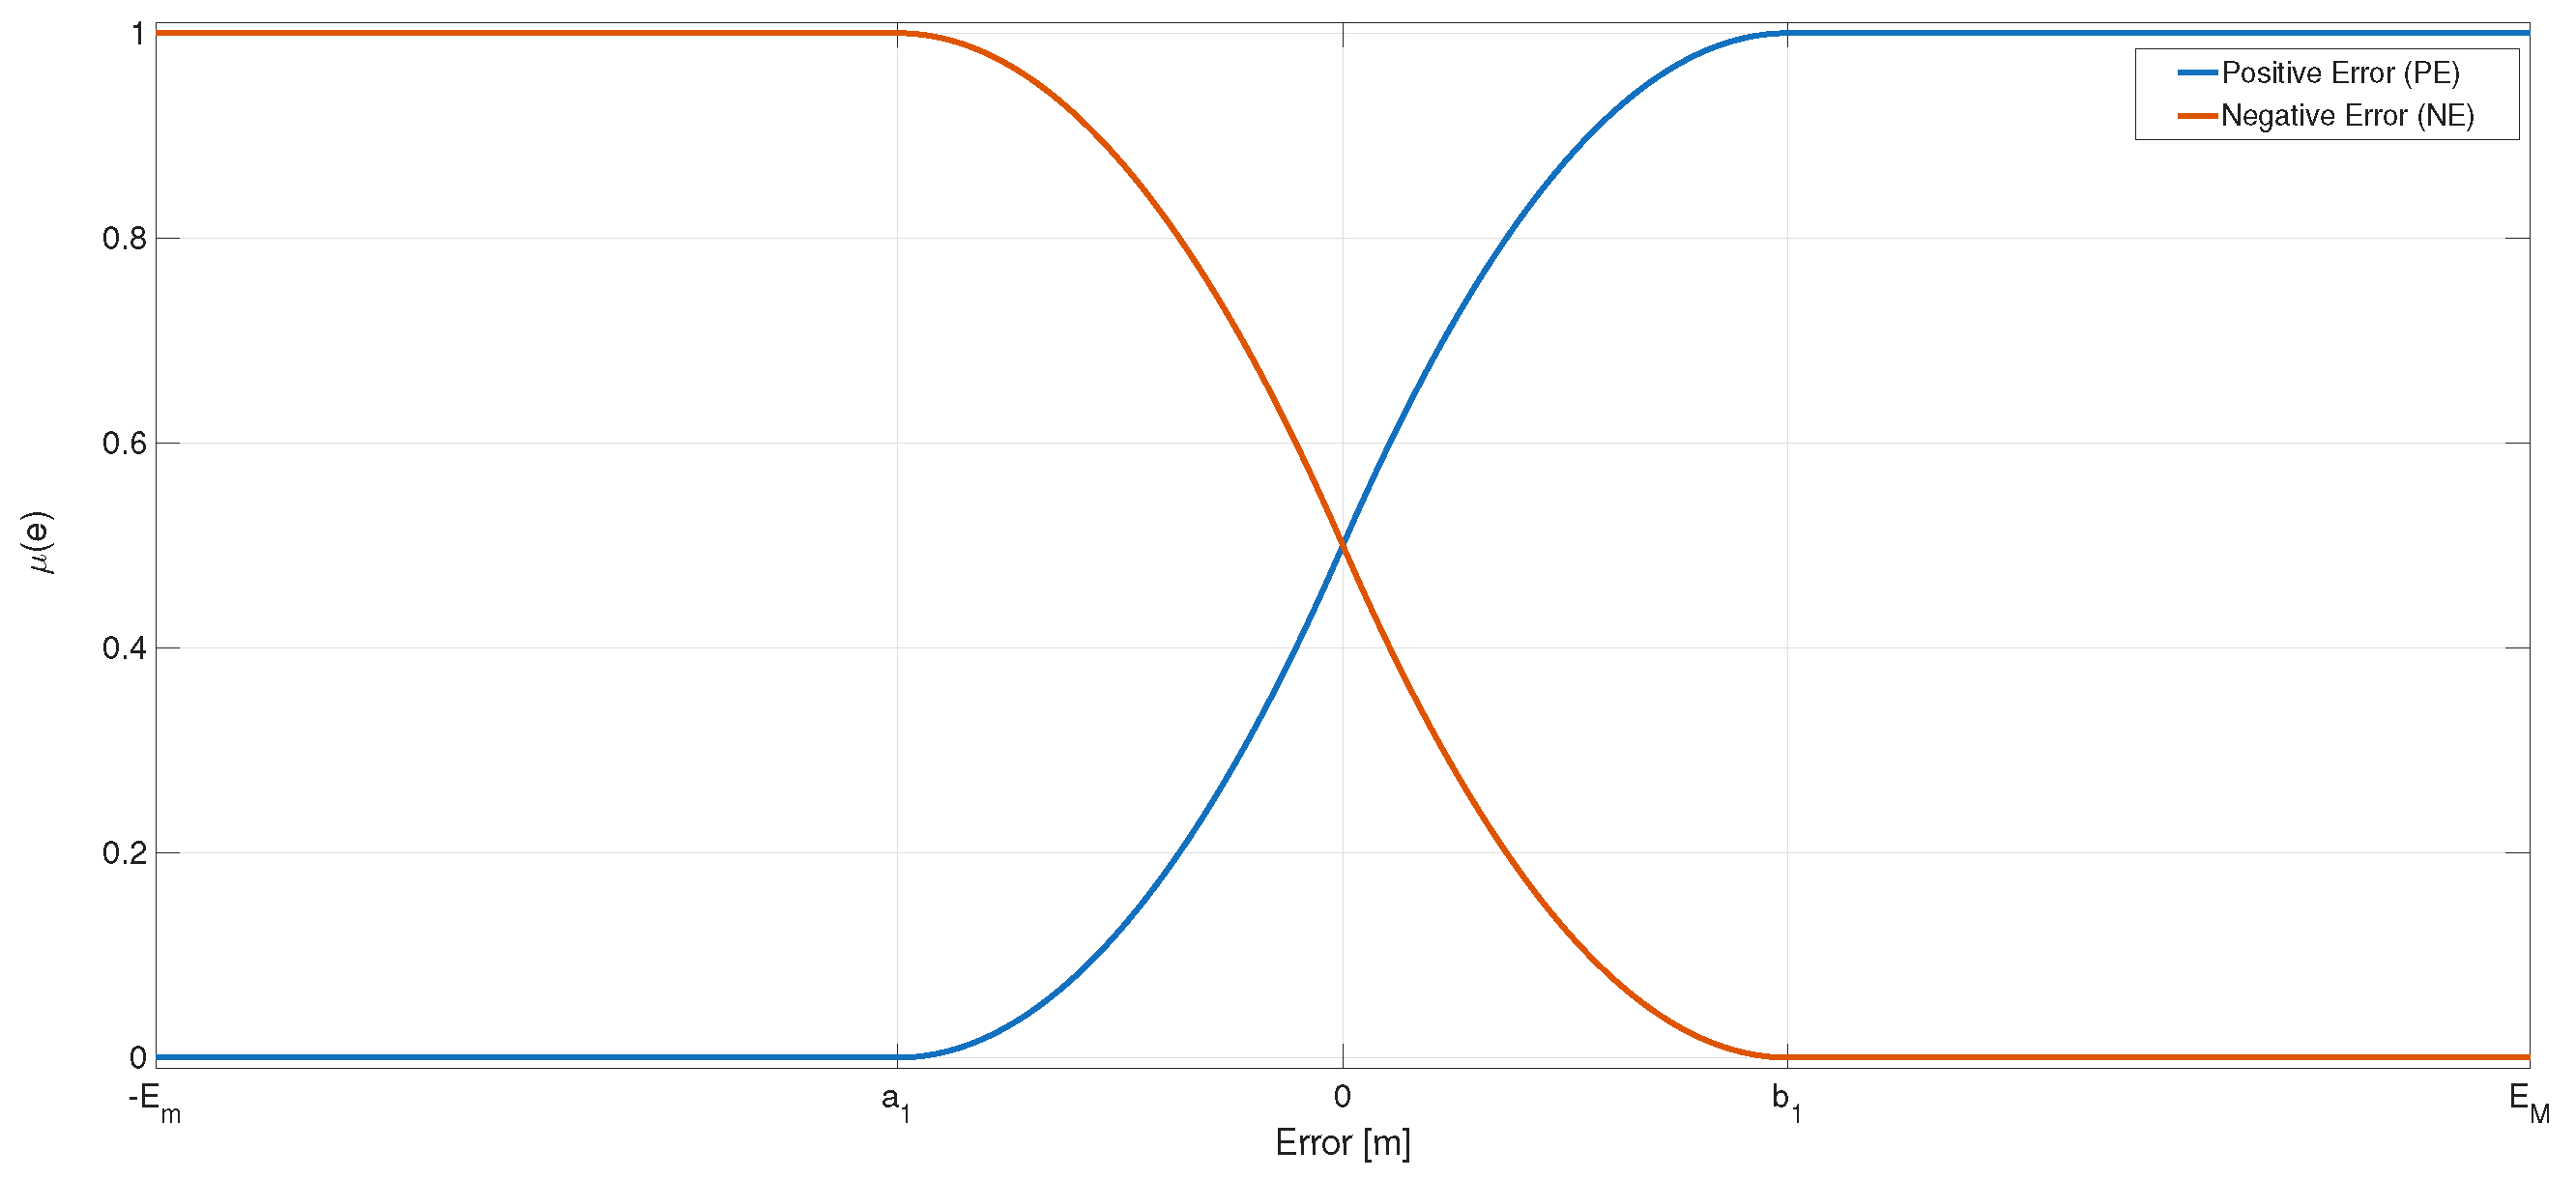
This system uses two linguistic values for the fuzzification stage: positive error (PE) and negative error (NE). The membership functions used are of the sigmoid type, as the Tsukamoto inference method requires monotonic functions [38]. The constants a and b define the points at which the membership functions start to decrease. The choice of these parameters is important, as they influence the behavior of the control signal when the position error is small [39]. The parameters for both membership functions are presented in Table 1.
Figure 3 shows the distribution of the membership functions for the antecedent linguistic variable using the selected parameters.
The linguistic variable for the consequent is the control action u p , with two linguistic values: positive u p (PUP) and negative u p (NUP). The consequent membership functions must also be monotonic. For simplicity, two straight lines, denoted y P and y N , are used. Their domain is the interval [ U P N , U P P ] , where U P m and U P M are the minimum and maximum values that the control signal u p can take, depending on the voltage supplied to the DC motor.
Figure 4 shows the distribution of the membership functions, from which the equations of the lines can be obtained, given two known points on each.
For y P , it is observed that, when x = U P m , y P = 0 , and when x = U P M , y P = 1 . This provides the coordinates ( U P m , 0 ) and ( U P M , 1 ) , which allow the line equation to be calculated using the point-slope form, given in Equation (2):
y P y 1 = y 2 y 1 x 2 x 1 ( x x 1 )
where x 1 = U P m , x 2 = U P M , y 1 = 0 , y 2 = 1 .
Solving for y P , we obtain Equation (3):
y P = 1 U P M U P m ( x U P m )
A similar analysis yields Equation (4):
y N = 1 U P M U P m ( x U P M )
The inference rules for a system with one input and one output take the following form:
IF antecedent , THEN consequent .
For Fuzzy System I, the proposed rules are
IF PE , THEN PUP ;
IF NE , THEN NUP .
The inferred output of each rule is defined as the crisp value induced in the consequent by the degree of membership of the rule’s antecedent. This is illustrated in Figure 5, where, for the first rule, x P is the coordinate on the x-axis at which the membership degree of y P matches that calculated by the membership function assigned to PE. For the second rule, x N is derived from the relationship between the membership degree of NE and y N .
The rule base design is directly linked to the dynamics of the controlled system. The antecedents (NE, PE) reflect the sign of the error, while the consequents (PUP, NUP) define the corrective action in the output. This ensures an intuitive and interpretable control law, where positive errors increase the control action and negative errors reduce it.
Solving Equations (3) and (4) for x yields Equations (5) and (6):
x P = ( U P M U P m ) y P + U P m
x N = ( U P M U P m ) y N + U P M
The weighted average method, shown in Equation (7), is employed for defuzzification due to its simplicity and low computational demands [40]:
u = w 1 x 1 + w 2 x 2 w 1 + w 2
Here, u is the control action u p ; w 1 and w 2 are the membership degrees of the antecedents; and x 1 and x 2 correspond to the coordinates x P and x N derived from the fuzzy rules.
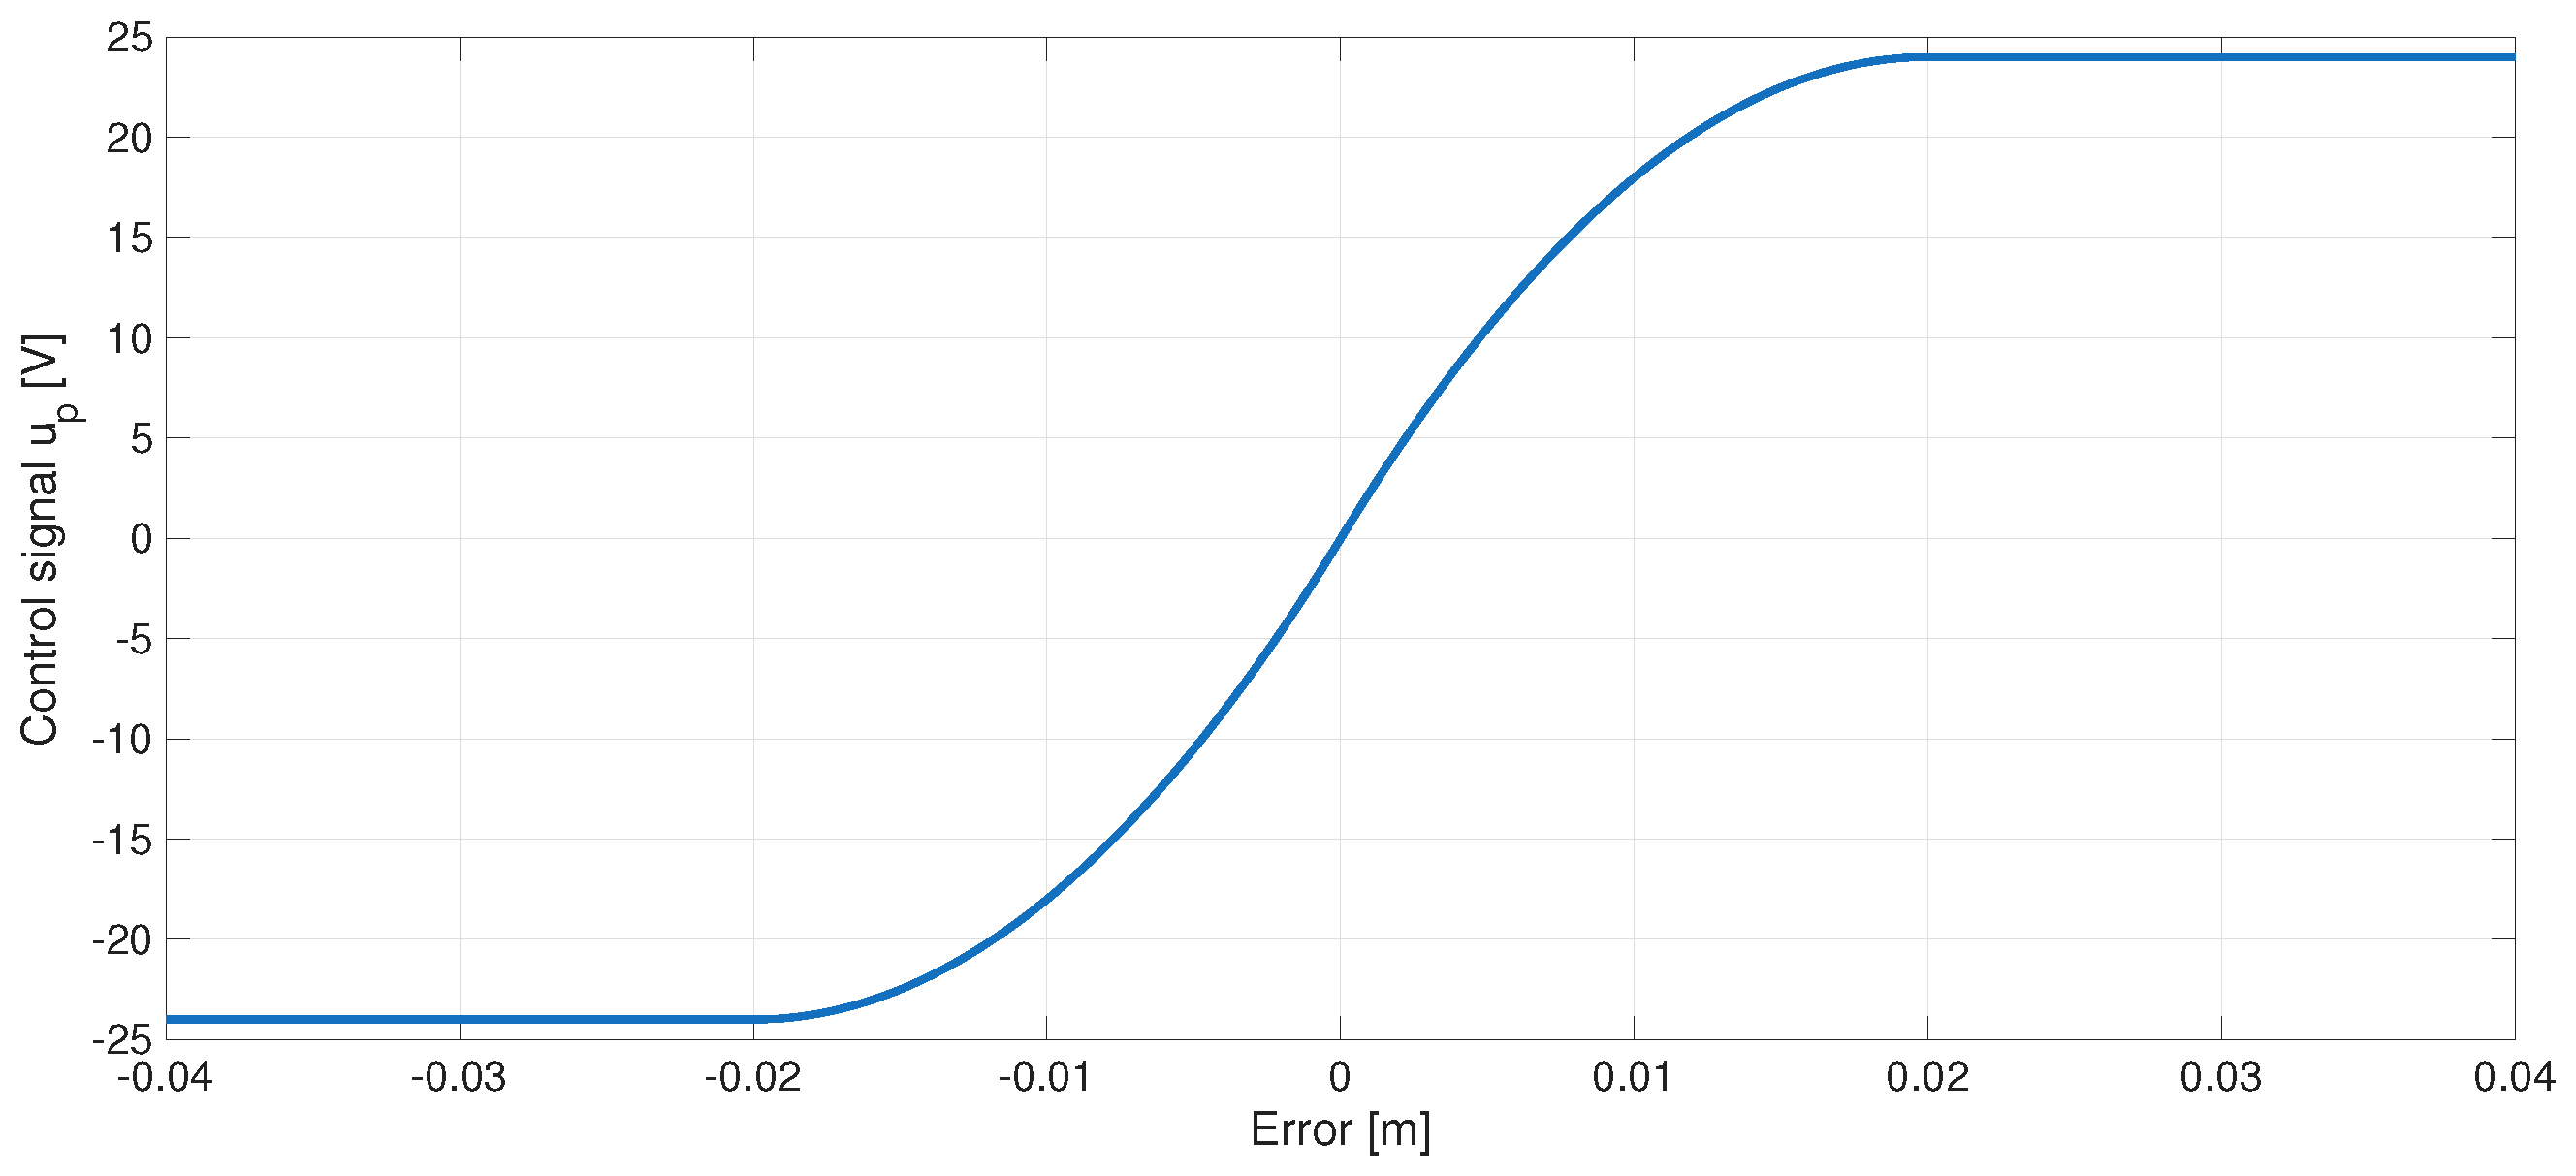
The relationship between the position error (input) and the control action (output) is shown graphically in the control curve in Figure 6.
It can be observed that the control action remains at its maximum when the error exceeds parameter b 1 and at its minimum when the input is below a 1 . Choosing small values for a and b ensures that, even when the error is small, the control signal u p exceeds the minimum voltage required to overcome the motor’s dead zone, thus reducing the steady-state error.

3.2.2. Fuzzy System II

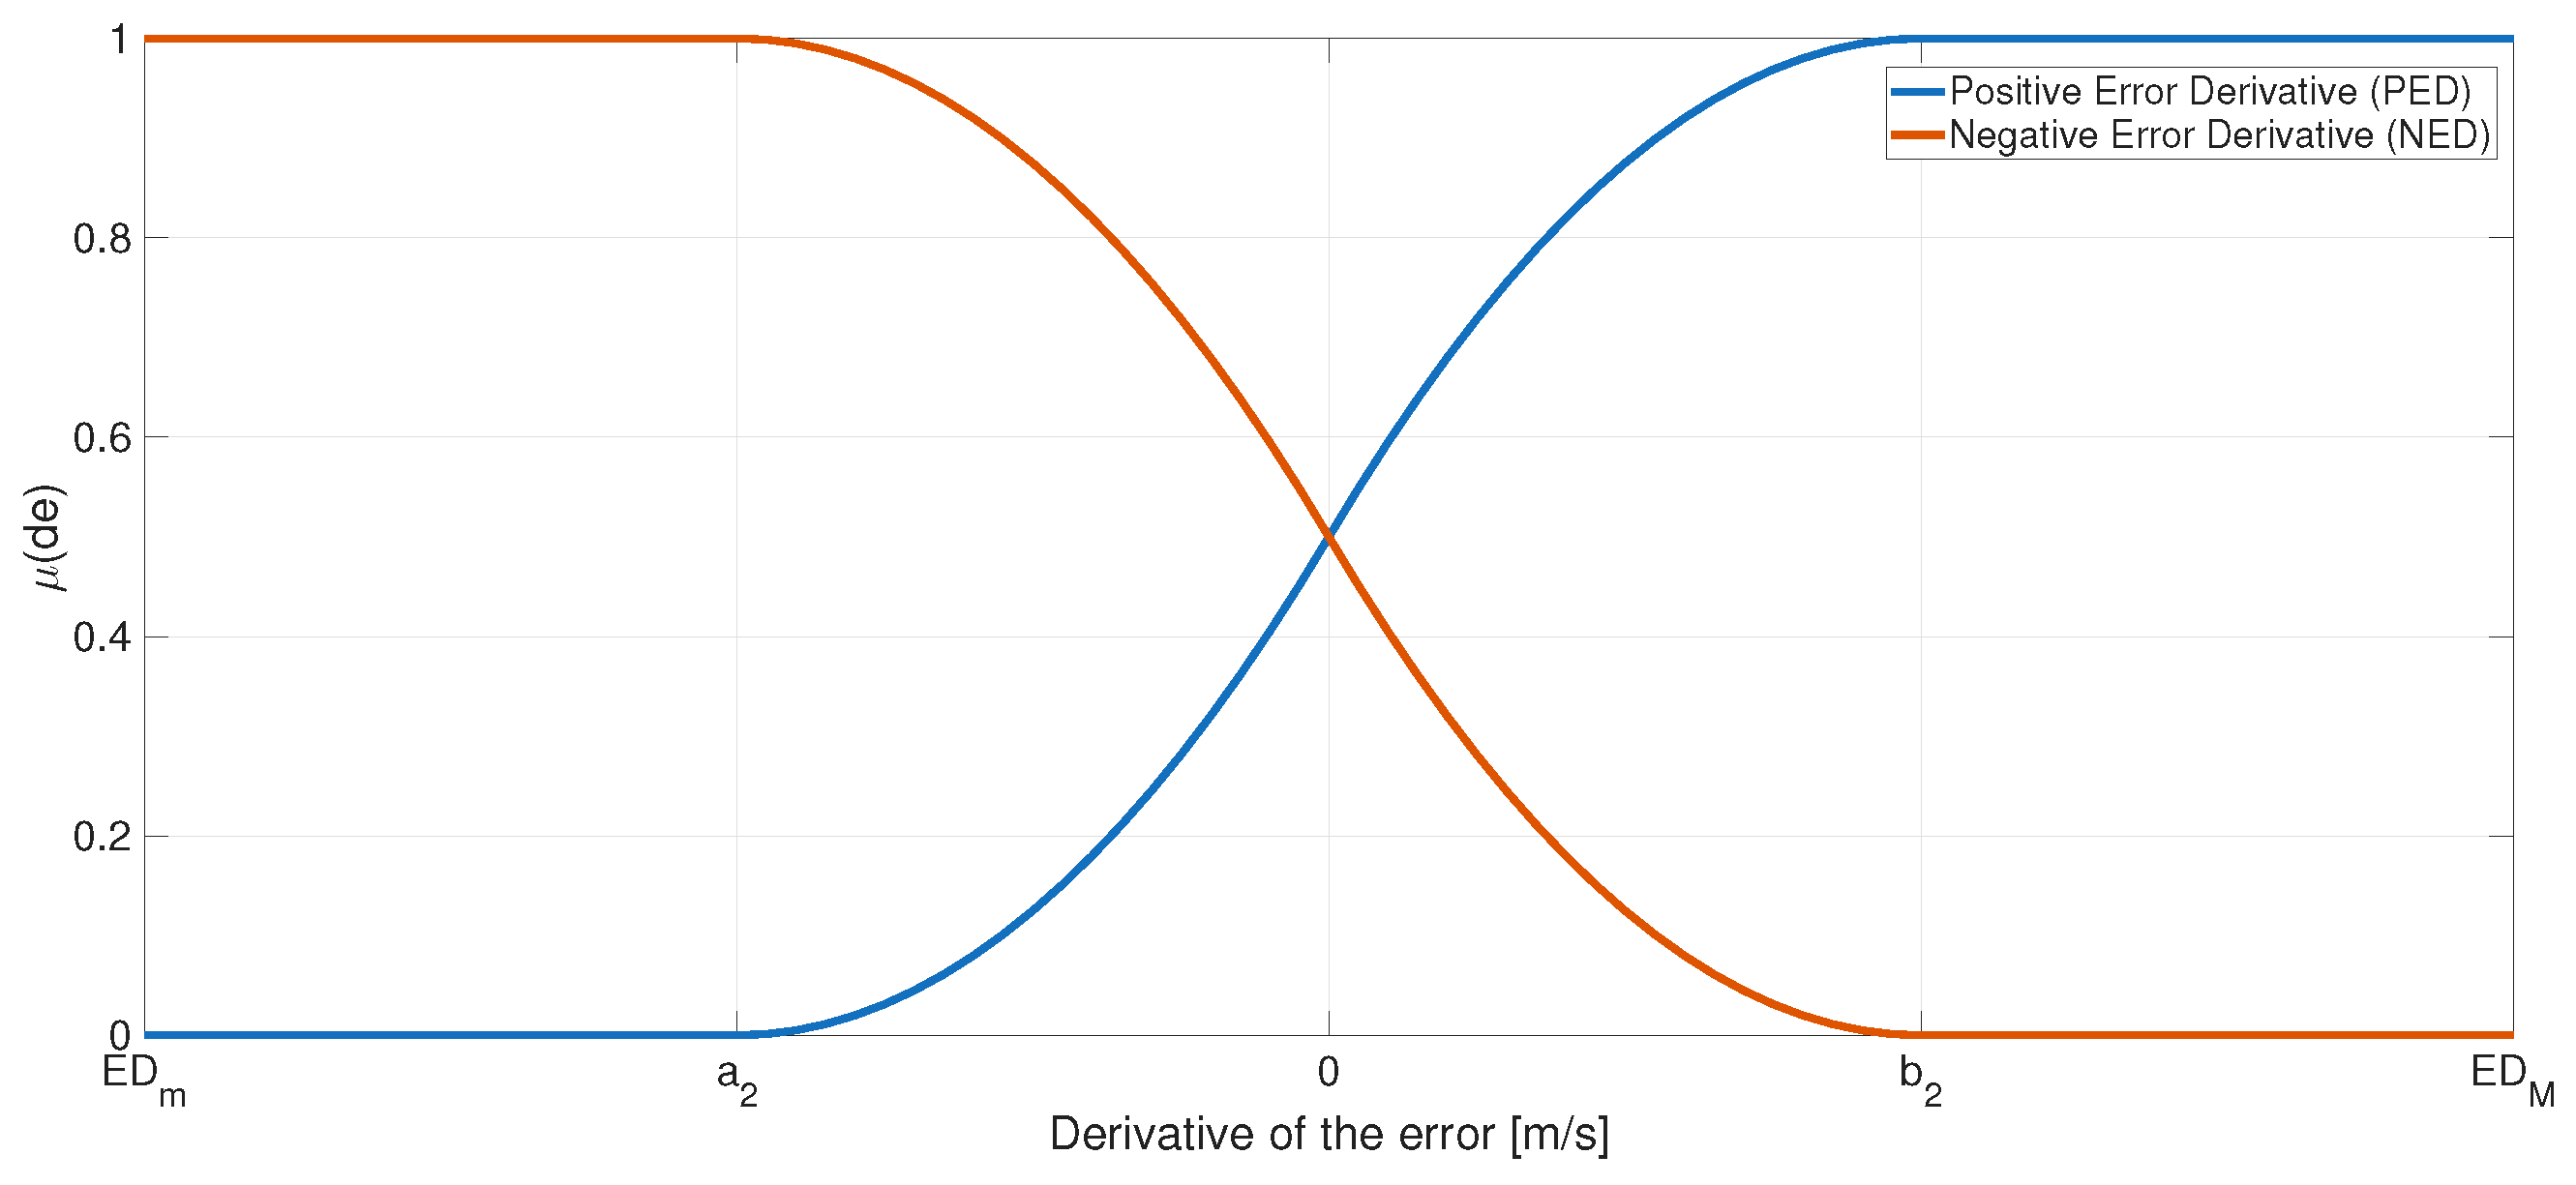
The second fuzzy system is responsible for computing the gain K d of the controller to generate the derivative control action u d , enabling the system to respond in advance to changes in the error signal [41]. The input linguistic variable for this fuzzy system is the derivative of the error. The considered universe of discourse is the interval [ E D m , E D M ] , where E D m and E D M are the minimum and maximum values of the error derivative obtained experimentally. The proposed linguistic values are the positive error derivative (PED) and negative error derivative (NED). Similarly, sigmoid-type membership functions were selected for the antecedent, as shown in Figure 7.
The parameters selected for the membership functions are summarized in Table 2.
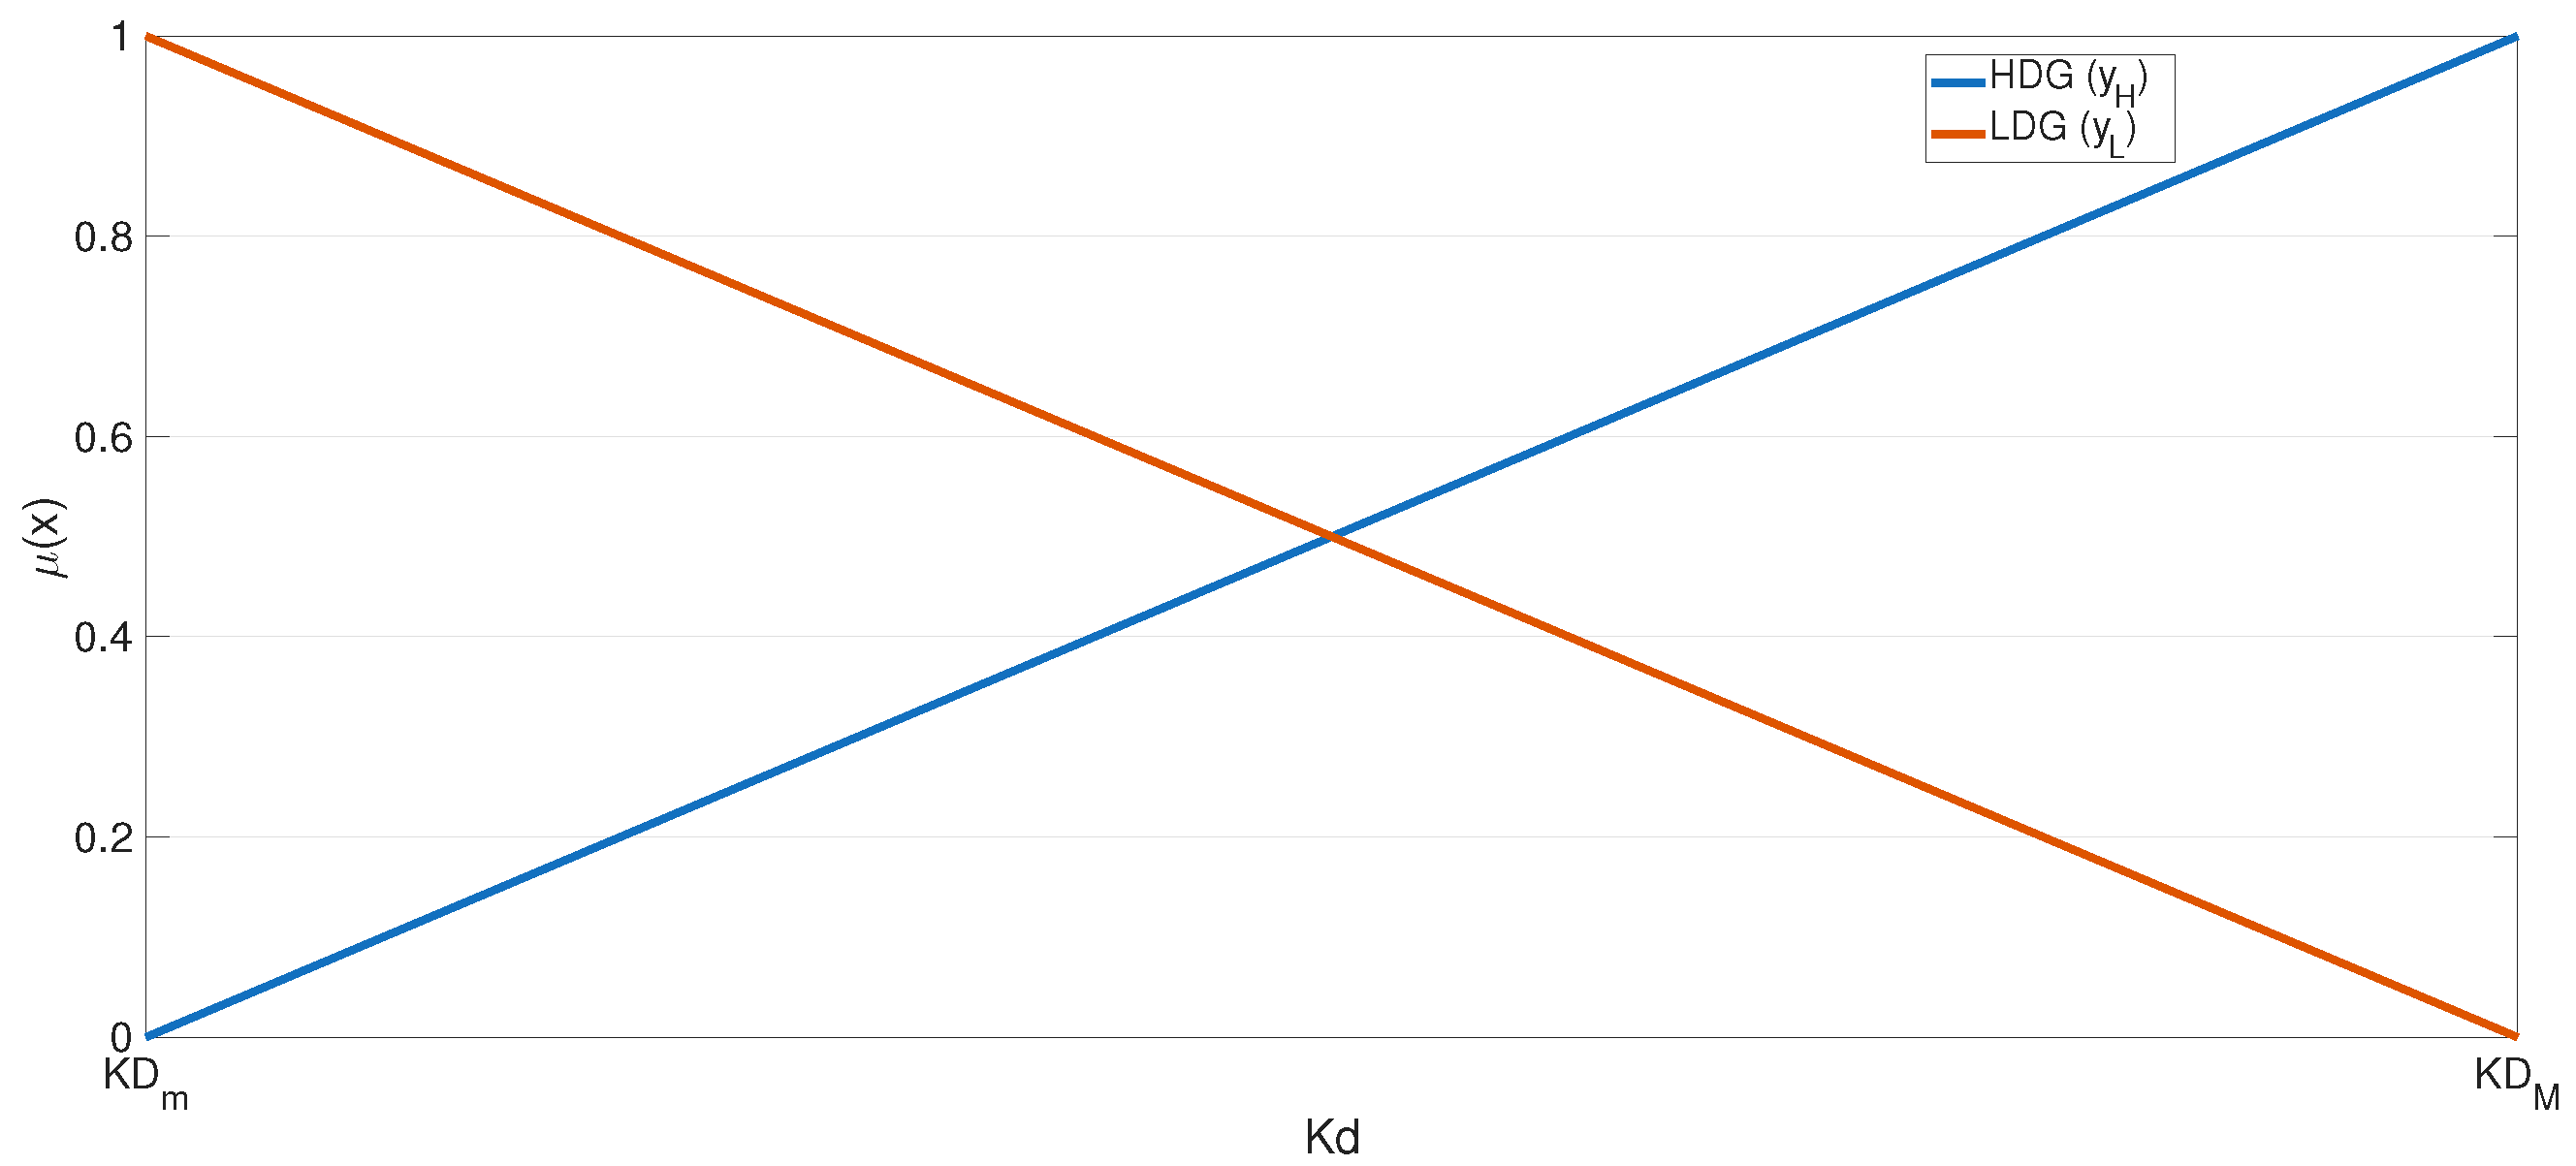
The linguistic variable for the consequent is the derivative gain K d , with two linguistic values: low derivative gain (LDG) and high derivative gain (HDG). The functions are represented by the lines y L and y H , with a domain of [ K D m , K D M ] , representing the proposed minimum and maximum values for K D . These values are based on the derivative gain obtained from tuning the classical controller.
The expressions for y L and y H , given by Equations (8) and (9), are derived using the same procedure described in Fuzzy System I, and they are plotted in Figure 8.
y L = 1 K D M K D m ( x K D M )
y H = 1 K D M K D m ( x K D m )
The proposed inference rules for this fuzzy system are
IF PED , THEN HDG ;
IF NED , THEN LDG .
In this case, the rule base design reflects the role of the derivative action in classical control: the error derivative (ED) provides information about the rate of change in the error; therefore, the rules are designed to anticipate the system’s behavior. A PED indicates that the error is increasing, necessitating a more substantial corrective gain ( K d ), which is represented by the linguistic variable HDG. Conversely, an NED indicates that the error is decreasing, and, therefore, a lower corrective action is needed, represented by LDG. This ensures that the controller dynamically adapts its derivative gain according to the system’s transient behavior. To apply the linguistic rules, we use Equations (10) and (11), obtained by solving for x in Equations (8) and (9).
x L = ( K D M K D m ) y L + K D M
x H = ( K D M K D m ) y H + K D m
In the defuzzification process, Equation (7) is applied. The output u corresponds to the gain K d , and x 1 , x 2 are the coordinates x H and x L . Figure 9 graphically shows the relationship between the error derivative and the gain K d .

3.3. Test Platform Instrumentation

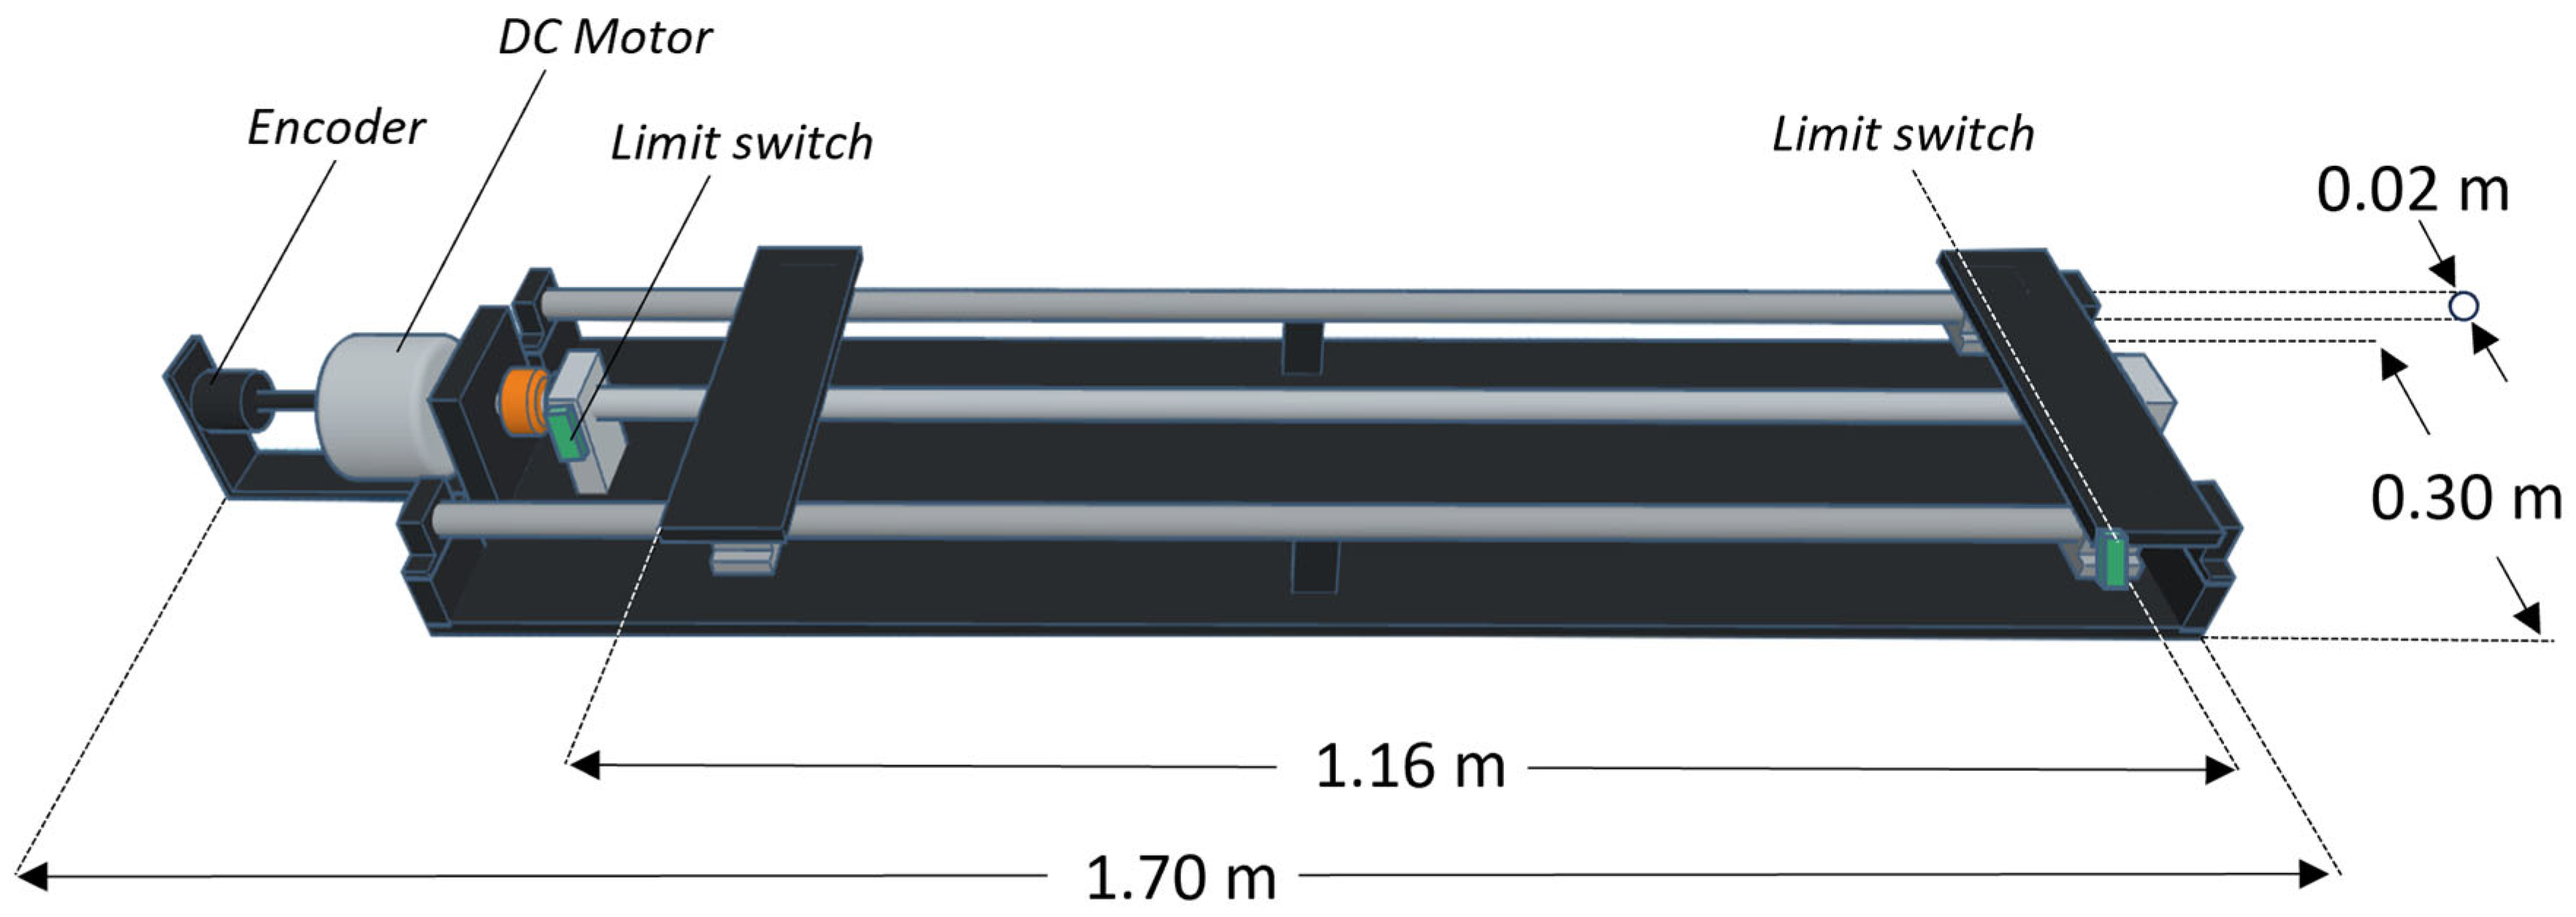
The test platform, shown in Figure 10, consists of a linear guide rail system, with a direct current motor coupled to the axis. The motor includes a built-in incremental encoder with 1024 pulses per revolution (PPR). A car is mounted on the axis and moves according to the motor’s rotation. Additionally, two lateral rails provide support and alignment, ensuring that the bar moves correctly along its axis. Table 3 summarizes the geometric dimensions of the test platform.
In order to delimit the travel of the bar along the rail, two limit switches were installed to define the endpoints of the allowed displacement. The first switch establishes a reference position or origin point for the system, while the second indicates that the bar has reached the maximum valid position within the operating range. To measure the current consumed by the system during motion execution, a module integrating the INA3221 sensor is used. This module includes four independent channels, each capable of measuring a maximum current of 1.638 A. The combination of all channels allows current measurements of up to 6.55 A. This module utilizes the Inter-Integrated Circuit (I2C) communication protocol to transmit its readings to the embedded system, which is the Texas Instruments (TI) TIVA C TM4C123GXL. This low-cost platform includes two high-performance 32-bit TM4C123GH6PM microcontrollers based on the ARM Cortex-M4F architecture. The choice of this embedded system is based on its capabilities for the implementation of the project. It provides advanced motion control functions integrated into the device: the quadrature encoder interface (QEI) module is dedicated to encoder reading, significantly simplifying the configuration process and enabling uninterrupted operation without parallel programming, as required in FPGA-based systems. The dedicated pulse width modulator (PWM) module enables the easy generation of square wave signals, whose duty cycle is used to digitally encode the control signal that regulates the voltage applied to the motor through the power stage.
The I2C module interfaces the current sensor with the microcontroller to receive current measurements, while the universal asynchronous receiver/transmitter (UART) communication module enables connection to a computer through a serial protocol, thereby facilitating data acquisition. This communication capability is invaluable in monitoring and analyzing the results obtained during the control system’s operation. Table 4 summarizes the main features of the embedded system.
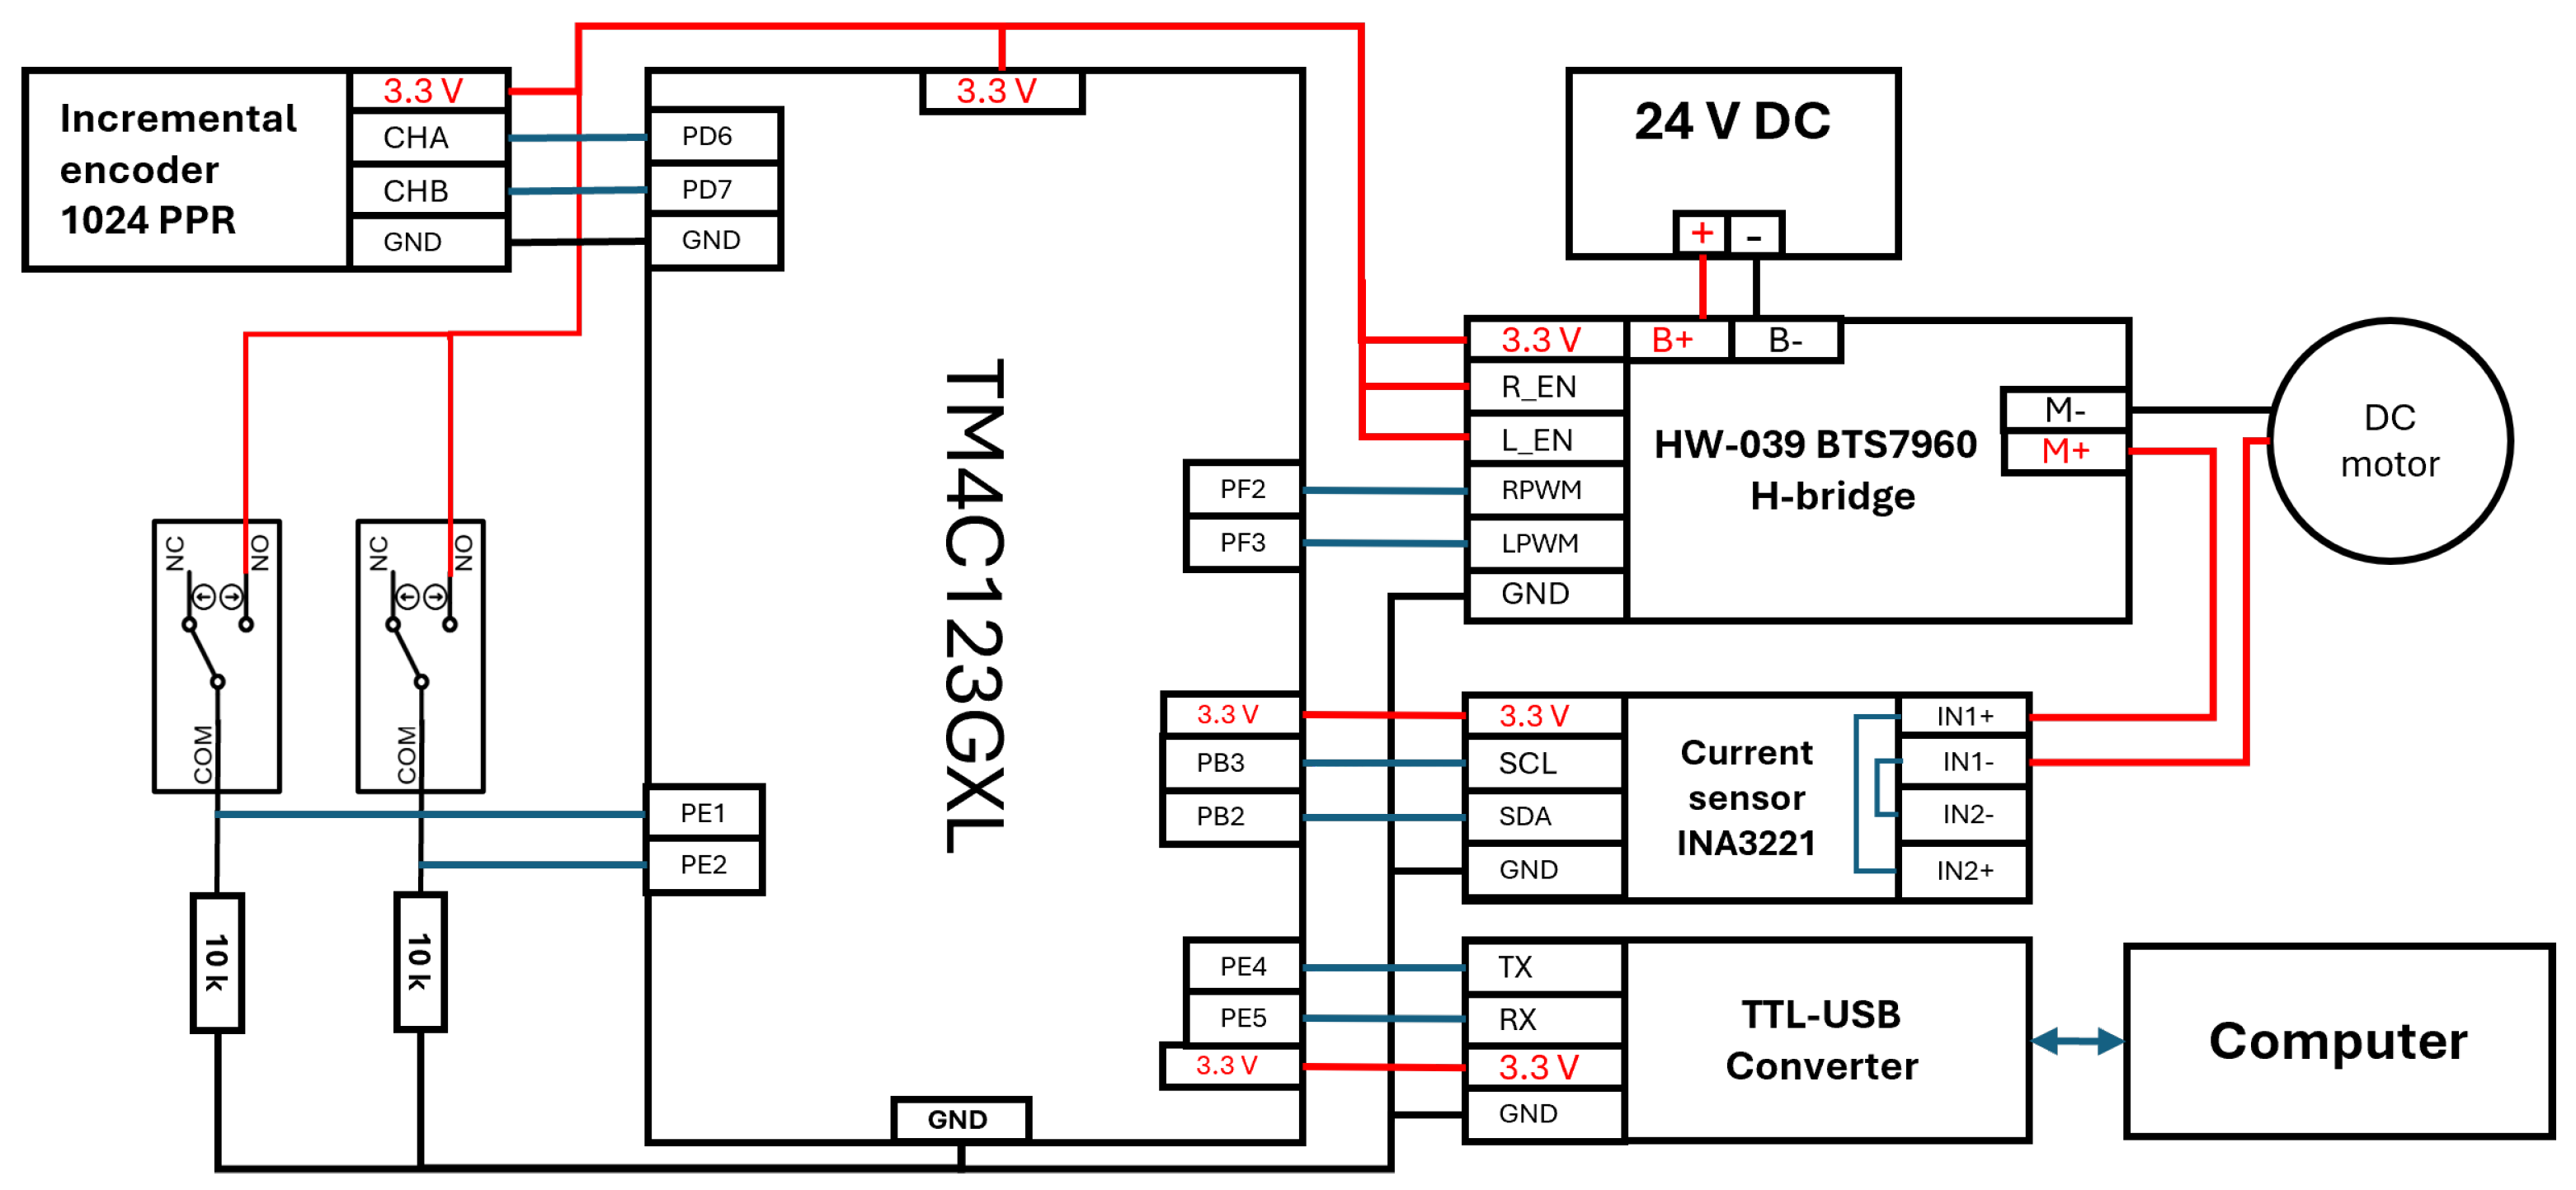
The diagram in Figure 11 shows the connection of the remaining components to the TIVA TM4C123GXL. An HW-039 BTS7960 H-bridge is used as the power interface between the microcontroller and the 24 V motor, allowing the application of PWM signals to control both the speed and direction of rotation. Finally, communication between the computer and the embedded system for data acquisition requires a TTL-to-USB converter; the PL2303HX module was selected due to its low cost and ease of connection.

3.4. Control System Architecture

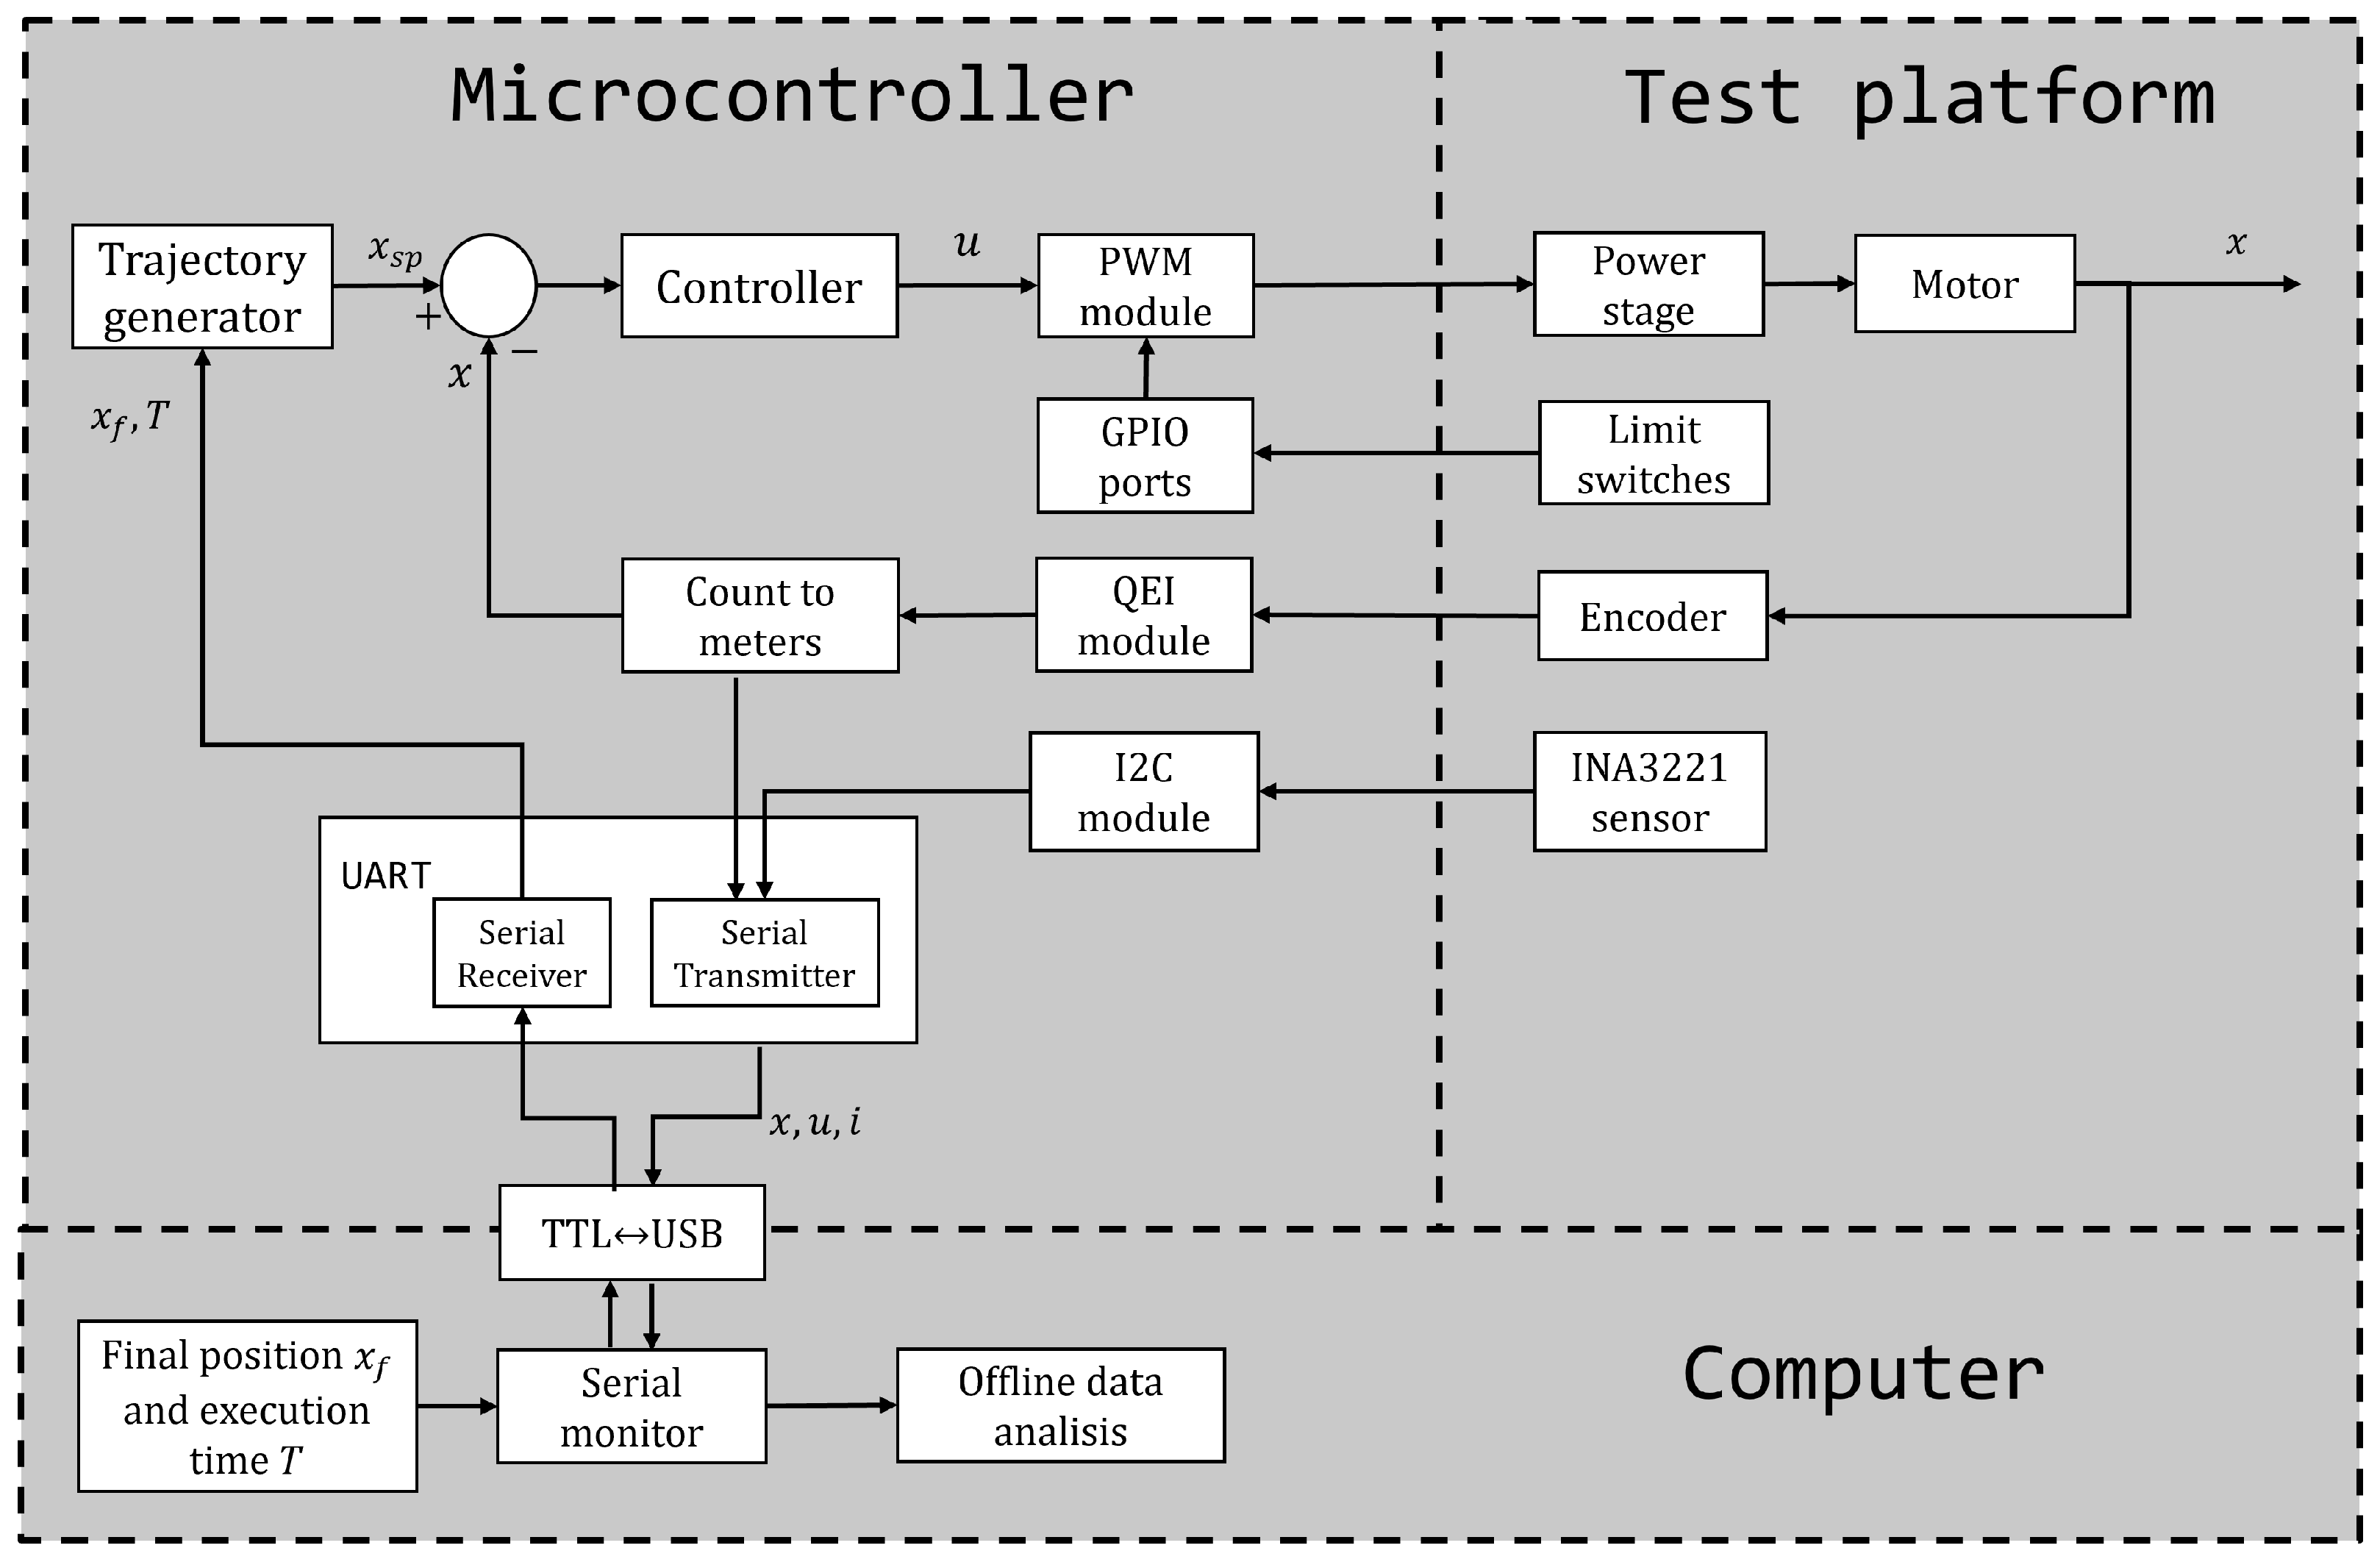
This section describes the overall architecture and operation of the motion control system. As shown in Figure 12, the system is composed of three main blocks: the microcontroller, the computer, and the test platform. The embedded system, based on the TIVA C TM4C123GH6PM microcontroller, is responsible for sensing, trajectory generation, and executing the control algorithm.
The computer communicates with the embedded system via serial connection at a speed of 115,200 baud. During the tests, it sends the desired motion parameters, such as displacement and execution time, and receives information about the cart position, the applied voltage, and the current consumed. This enables monitoring and subsequent data analysis to evaluate the performance of the controllers.

3.5. Embedded System Integration

The embedded system was programmed in C using the Keil μ Vision 5 development environment. This platform enables the direct manipulation of the microcontroller’s registers, providing greater control over its peripheral modules and allowing for adaptation to the project’s specific requirements. Algorithm 1 was used to implement the control system.
The initial configuration and operation of the main control loop were described in detail in a previous study [42]; therefore, only a summary of the relevant settings is provided here. In contrast, the trajectory generator and the fuzzy controller implementation are described in full detail.
Algorithm 1 Embedded System Algorithm.
  1:
Start
  2:
Configuration of registers and peripherals:
    GPIO, QEI, PWM, UART, I2C, and timer
  3:
Definition of constants and variables
  4:
Wait for data from the PC:
     Final position x f
     Total execution time T
  5:
while True do
Main loop (every 2 ms):
  6:
    Data acquisition:
       Read actual position (encoder counts)
       Convert to meters
       Read current (INA3221 via I2C)
  7:
    Trajectory generation:
       Compute current reference position
  8:
    Compute error and error derivative
  9:
    Compute control signal u (PID or fuzzy):
        u value in range [−24, 24] V
10:
    Signal scaling and application:
       Convert u to PWM duty cycle
       Generate PWM signal
11:
    Data transmission to PC:
   Position, current, and control signal
12:
end while

3.5.1. Initial Configuration

  • Operating frequency: 80 MHz;
  • QEI module configured in quadrature mode, resulting in 4096 counts per revolution (CPR);
  • PWM signals generated at 5 kHz with 10-bit resolution;
  • UART communication set to 115,200 baud;
  • General-purpose timer configured with a T s = 2 ms period.

3.5.2. Data Acquisition

Before the main control loop begins, the final position x f in meters and the execution time T are received. Then, in the main loop, the actual position x of the carriage is determined by multiplying the encoder counts by a fixed factor of 1 / 220 , 500 , since it was experimentally established that 220,500 counts correspond to a displacement of 1 m. Subsequently, the current measurement is obtained by reading the value provided by the sensor via the I2C protocol. The sampling time T s for the main loop is 2 ms.

3.5.3. Trajectory Generation

After the sensing task, one point of the reference position is computed online at each iteration k, according to the selected velocity profile. For the parabolic profile, the trajectory is calculated using Equation (12), which assumes a start position of x 0 = 0 and an initial time of t 0 = 0 .
x s p ( t ) = 2 x ˙ m a x T t 2 4 x ˙ m a x 3 T 2 t 3 , 0 < t T
x ˙ m a x = 3 x f T
where x s p is the reference position for the controller at t = k T s , and x ˙ m a x is the maximum velocity.
For the trapezoidal profile, Equation (14) computes x s p over the three intervals that define the motion phase:
x s p ( t ) = x ˙ m a x 2 T a t 2 , 0 t < T a x ˙ m a x ( t T a 2 ) , T a t < 2 T a x f x ˙ m a x 2 T a ( T t ) 2 , 2 T a t < T
where T a = T / 3 , and x ˙ m a x is obtained using Equation (13).
The S-curve velocity profile is computed using Equations (15)–(17), which result from the discretization of the continuous-time integral through the bilinear transformation method. The integration step size T s matches the sampling period of the main control loop.
x ¨ [ k ] = x ¨ [ k 1 ] + T s 2 ( x [ k ] x [ k 1 ] )
x ˙ [ k ] = x ˙ [ k 1 ] + T s 2 ( x ¨ [ k ] x ¨ [ k 1 ] )
x s p [ k ] = x s p [ k 1 ] + T s 2 ( x ˙ [ k ] x ˙ [ k 1 ] )
Here, x [ k ] , x ¨ [ k ] , x ˙ [ k ] , and x s p [ k ] represent the current jerk, acceleration, velocity, and position, respectively.

3.5.4. Control Signal Computation

The position error e [ k ] is computed as the deviation between the actual position x and the reference point x s p provided by the trajectory generator.
The error derivative e ˙ [ k ] is calculated using the backward Euler method, as defined in Equation (18):
e ˙ [ k ] = 1 T s ( e [ k ] e [ k 1 ] )
Both the error and its derivative are inputs to Fuzzy Systems I and II, described in Section 3.2. In the first stage, the fuzzification process is carried out, which consists of evaluating the error and its derivative in their corresponding membership functions to obtain the degrees of membership, as shown in Equations (19)–(22). The sigmoid function and arguments are shown in Algorithm 2.
Algorithm 2 Sigmoid membership function.
  1:
function sigmoid(x, a, b)
  2:
       m a + b 2
  3:
      if  x a  then
  4:
            return 0
  5:
      else if  a < x m  then
  6:
            return  2 · x a b a 2
  7:
      else if  m < x < b  then
  8:
            return  1 2 · x b b a 2
  9:
      else
10:
            return 1
11:
      end if
12:
end function
μ P E = s i g m o i d ( e [ k ] ,   a 1 ,   b 1 )
μ N E = 1 μ P E
μ P E D = s i g m o i d ( e ˙ [ k ] ,   a 2 ,   b 2 )
μ N E D = 1 μ P E D
Once the degrees of membership have been computed, the inference process applies the fuzzy rules to produce intermediate crisp outputs based on the controller’s structure. These values are calculated using Equations (23)–(26), considering U P m = 24 , U P M = 24 , K D m = 0 , and K D M = 0.5 .
x P = 48 μ P E 24
x N = 48 μ N E + 24
x D M = 0.5 μ P E D
x D m = 0.5 μ N E D + 0.5
The crisp outputs obtained from the inference stage are then combined using the weighted average method described in Equation (7) to compute u P and K d . Finally, the overall control signal u [ k ] is calculated by combining the outputs of both fuzzy systems, as defined in Equation (27).
u [ k ] = u P [ k ] + K d · e ˙ [ k ]

3.5.5. Data Transmission to PC

The current position x, control signal u, and measured current i are transmitted to a PC for visualization, storage, and subsequent offline analysis. Python 3.11 is used to evaluate the controller’s performance, compute the energy consumed during motion, and statistically validate the results obtained from multiple experimental tests.

4. Results

This section presents the results obtained from applying both the PID and TFLC controllers to the position control of the cart mounted on the test platform. Based on the collected data, an energy consumption comparison is conducted for point-to-point motions executed using three different velocity profiles: parabolic, trapezoidal, and S-curve. In a second round of testing, a 9 kg load is added to the cart in order to analyze the system’s response to external disturbances. The design of the PID controller used can be found in [42].
In all experiments, the cart moves a distance of x f = 0.8 m within a time period T = 4 s . Table 5 summarizes the calculated parameters that ensure that the trajectory generated by each motion profile meets these conditions.
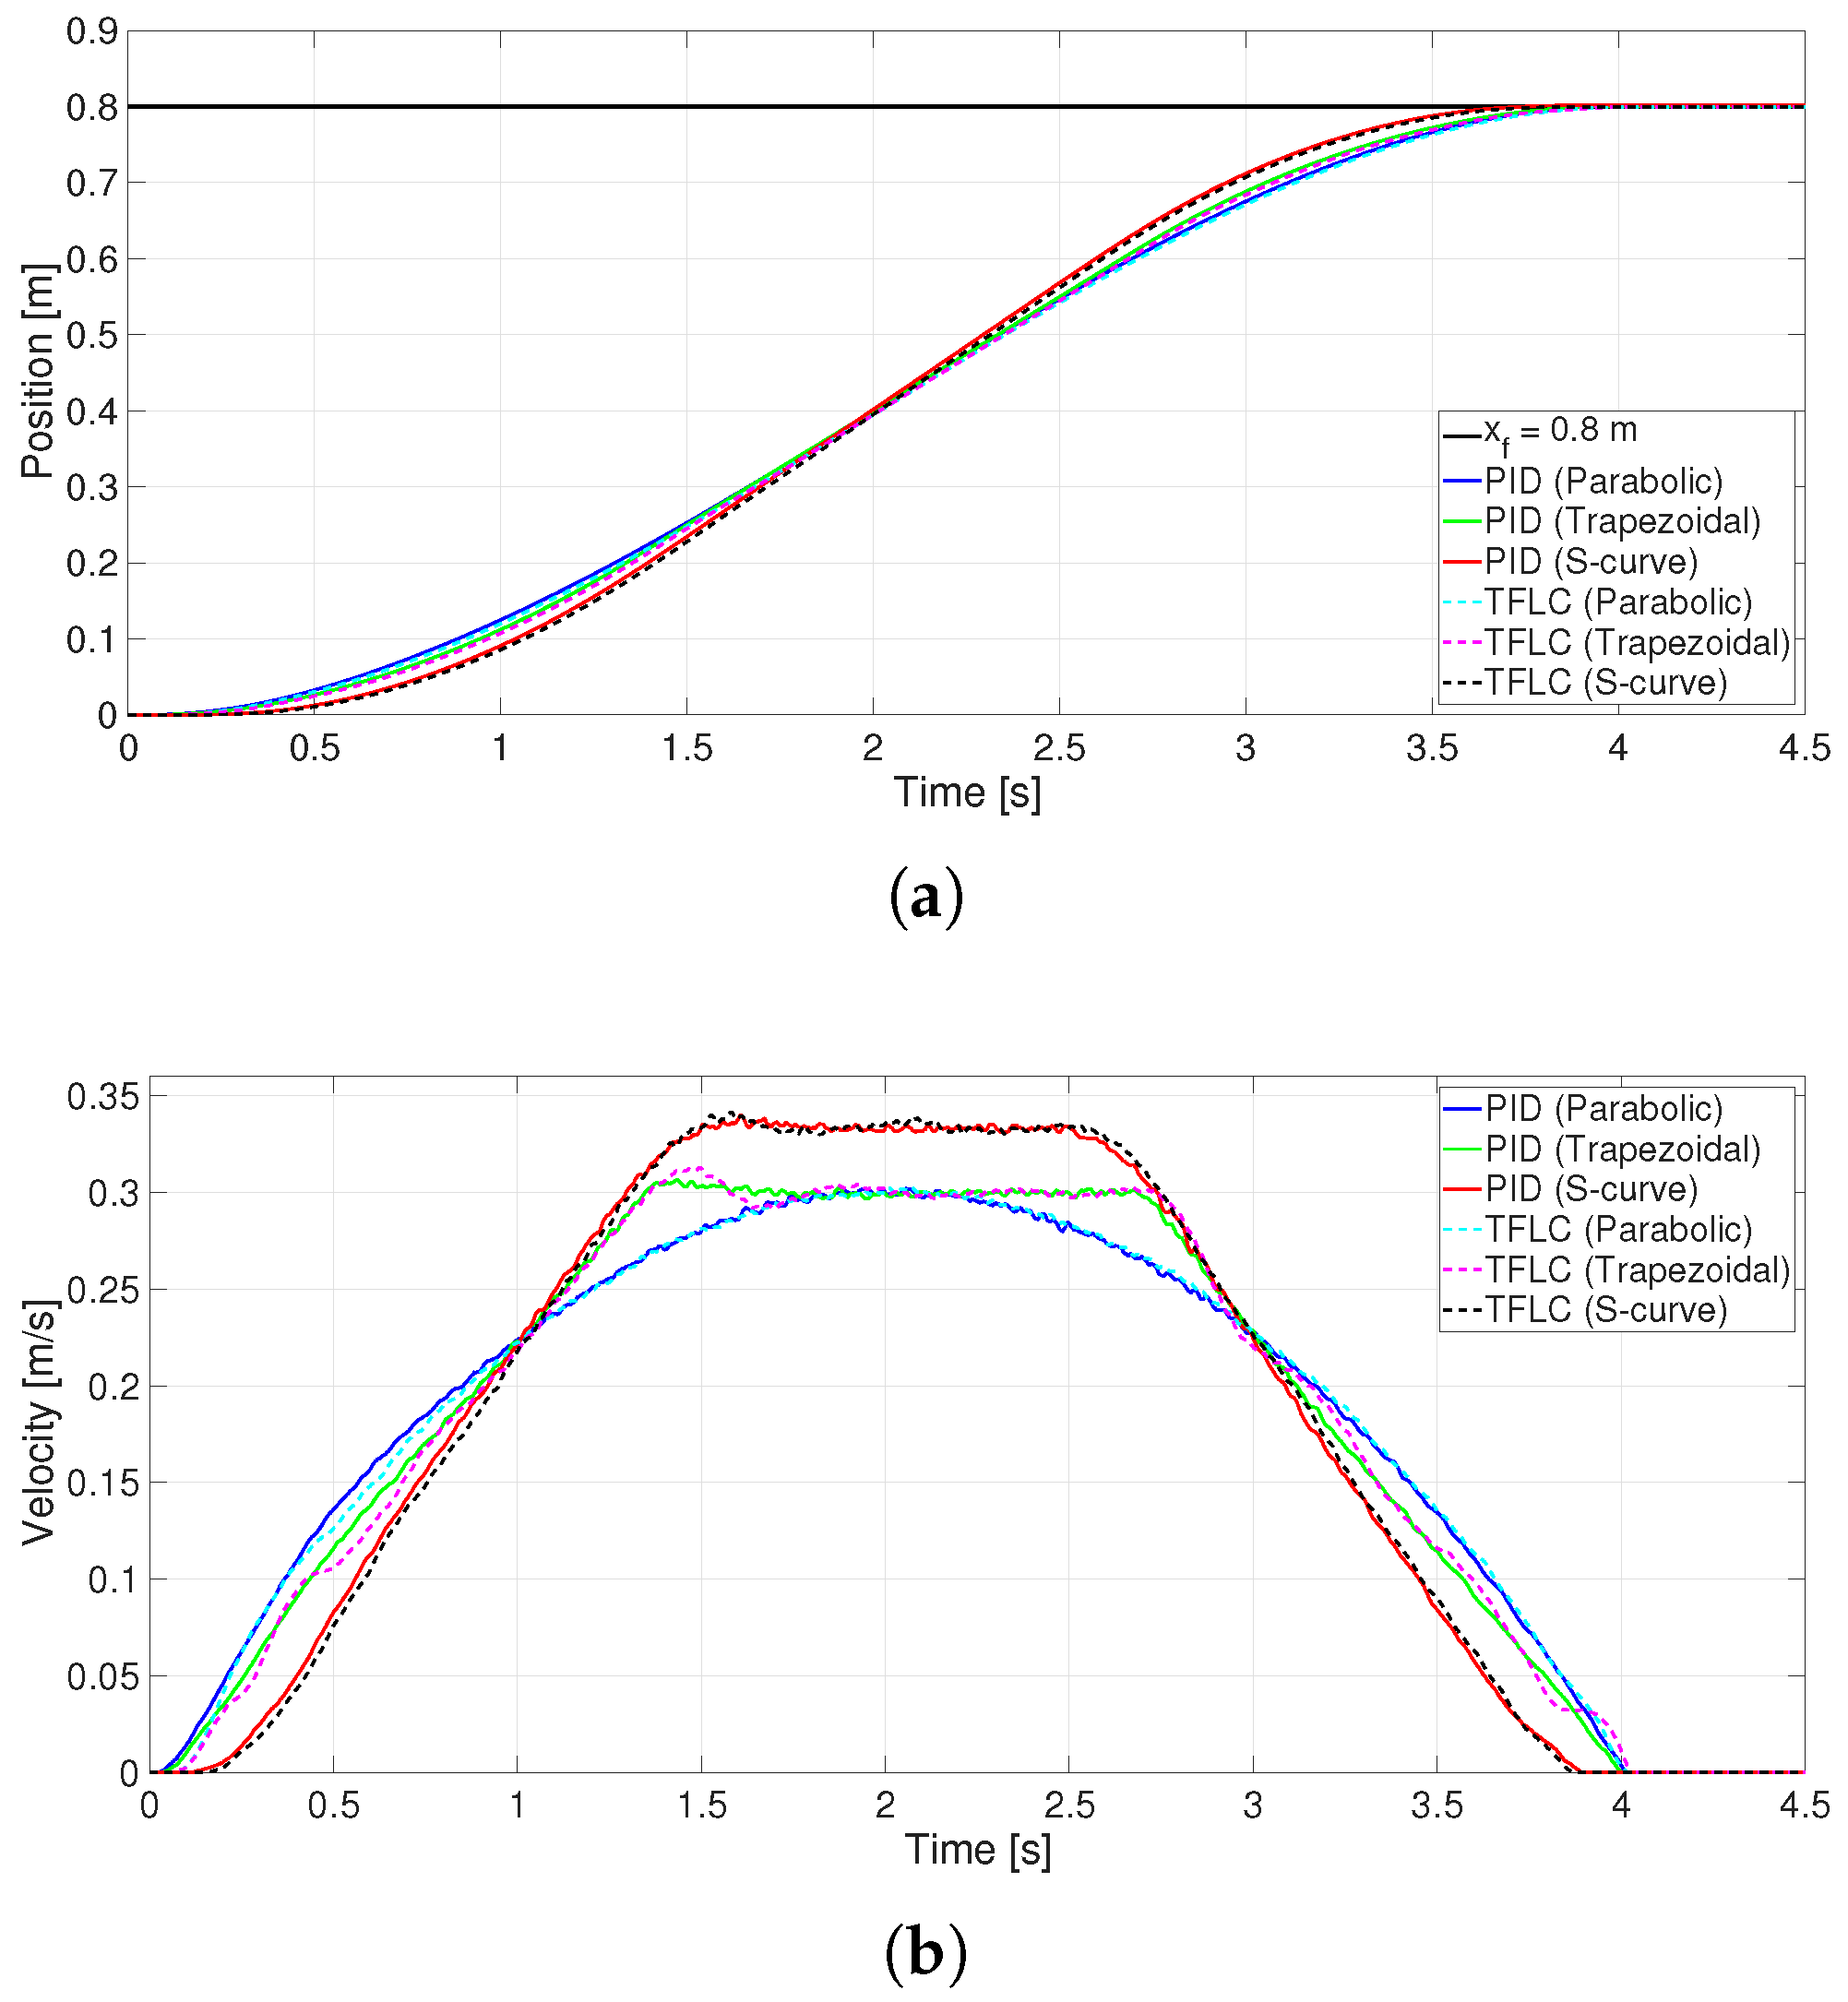
Figure 13a shows the experimentally obtained position x of the cart for both controllers, following the trajectory generated by each motion profile. It can be observed that the final position reached by the cart corresponds to the final position x f .
The velocity x ˙ was estimated by numerically differentiating the position signal x using the backward Euler method. To attenuate the high-frequency noise introduced by the differentiation process, a low-pass finite impulse response (FIR) filter was applied. Figure 13b presents the resulting velocity profiles for each motion, where the shape of each curve aligns with the characteristics of the corresponding velocity profile.
The relative tracking error ϵ ( % ) is calculated using Equation (28), where x represents the actual position and x s p is the reference position. Figure 14a shows the relative tracking error for the no-load condition, while Figure 14b presents the results for the loaded case.
ϵ % [ k ] = 100 x [ k ] x s p [ k ] x s p [ k ]
This demonstrates the robustness of both controllers, as the tracking error remains minimal during motion execution, even with an added load on the system. Table 6 compares the average values of the following metrics: the maximum tracking error (MTE) expressed in meters, the steady-state error (SSE), and its corresponding percentage value ϵ ( % ) . The MTE data indicate better trajectory tracking performance by the PID controller, as the TFLC exhibits maximum tracking errors of up to 0.0069 m. However, the steady-state error for both controllers is less than 0.002 m, which corresponds to a relative error below 0.225%.
Figure 15 and Figure 16 display the voltage and current plots obtained from the control signal u and sensor measurements, respectively. In the case of the tests using the trapezoidal profile, voltage and current spikes are observed at t = T a due to the acceleration discontinuities inherent to the definition of this profile.
Table 7 summarizes the average values of the maximum voltage, current, and power obtained. In all cases, it can be observed that both the peak current and voltage are lower for each velocity profile, regardless of whether the conditions are loaded or unloaded.
The current i ( t ) and the voltage derived from the control signal u ( t ) are used to compute the instantaneous power P ( t ) . Integrating P ( t ) from t = 0 to t = T yields the energy E ( t ) , as expressed in Equation (30). The total energy consumed corresponds to the value of E ( t ) at the end of the motion, i.e., at t = T .
P ( t ) = 0 T i ( t ) · u ( t ) d t
E ( t ) = 0 T P ( t ) d t
The numerical integration method used corresponds to the trapezoidal rule, whose discrete-time form is shown in Equation (31):
E [ k ] = E [ k 1 ] + T s 2 ( P [ k ] + P [ k 1 ] )
Figure 17 shows the instantaneous power plots, while Figure 18 compares the energy consumption across the different profiles. The plots clearly show that, under both conditions, the energy consumption is consistently lower when using the TFLC.
This is reflected in Table 8, which presents the average values of the total energy consumption. In the no-load case, a reduction of 11.77% is observed for the parabolic profile, 9.27% for the trapezoidal profile, and 3.45% for the S-curve profile. This trend persists in the loaded case, with reductions of 3.63%, 7.68%, and 2.35%, respectively.

Result Validation

To determine whether the differences observed between the PID and TFLC controllers are statistically significant, a set of validation tests was conducted. These analyses focused on comparing the variability and consistency of the energy consumption across different motion profiles, under both load and no-load conditions. The coefficient of variation (CV) was used as a measure of dispersion, and a two-sample Welch’s t-test was applied to the sets of total energy consumption measurements for both the PID and TFLC controllers. This version of the tests accounts for unequal variances between groups, as stated in [43]. The null hypothesis assumed equal means between groups, while the alternative hypothesis posited a significant difference. The significance level was set at α = 0.05 . The results are summarized in Table 9.

5. Discussion

The proposed fuzzy controller demonstrated clear advantages over the conventional PID controller. The TFLC responded consistently to load variations, as reflected in the lower coefficient of variation in energy consumption across all test cases. This makes it suitable for variable operating conditions and systems with uncertain dynamics. Additionally, due to its use of monotonic sigmoidal membership functions, the TFLC generated smooth and continuous control signals, even in the presence of abrupt changes in the derivative of the error, whereas the PID controller typically reacts more aggressively under such conditions. This aggressive response often leads to sudden spikes in the current and unnecessary mechanical stress, resulting in increased energy consumption.
This was confirmed by the results across all three trajectory profiles, where both the peak voltage and current were lower under both load and no-load conditions when using the TFLC. The statistical analysis, based on t-tests, yielded p-values below 0.05, suggesting that the type of controller has a significant effect on energy-related behavior and further supporting the consistency and reliability of the TFLC. These findings are particularly relevant considering that only a few studies in the literature include statistical comparisons.
Carabin G. and Vidoni R. [15] proposed an analytical method to minimize energy consumption in a mechatronic system performing point-to-point motions using motion primitives. They analyzed a variety of velocity profiles, including trapezoidal, cycloidal, double-S, and polynomial (third to seventh order), and derived closed-form expressions for the consumed energy. By optimizing parameters such as the acceleration/deceleration time and trajectory coefficients, they demonstrated that both the time duration and trajectory shape significantly affect energy use. Likewise, Raisch A. and Sawodny O. [22] achieved comparable improvements in electromechanical drives by generating energy-optimal trajectories. Their method relied on modeling the system dynamics, including friction and drive losses, and solving an optimal control problem. In contrast to these model-based approaches, our fuzzy controller provides comparable energy reductions using an inference system with adaptive behavior under varying loads, without requiring detailed dynamic modeling or offline optimization.
Furthermore, Montalvo et al. [17] experimentally evaluated trapezoidal and parabolic profiles using a classical PD controller implemented on an FPGA-based system. Their results showed a 17.3% reduction in energy consumption with the parabolic trajectory, confirming the advantages of smoother profiles even under traditional control strategies. However, their study did not include statistical validation or adaptive control, highlighting the added value of our approach, which integrates intelligent control with consistency across multiple trials.

6. Conclusions

This work presented the design and implementation of a motion controller based on the Tsukamoto fuzzy inference model, with the aim of reducing the energy consumption in DC motor control systems. Its performance was compared against that of a conventional PID controller using three different motion profiles. The results confirmed that combining smooth trajectory generation with intelligent control strategies enables energy savings without compromising motion accuracy.
Experimental tests demonstrated that the fuzzy controller consistently reduced the energy consumption across all profiles. Under no-load conditions, reductions of 11.77%, 9.27%, and 3.45% were achieved for the parabolic, trapezoidal, and S-curve profiles, respectively. When a 9 kg load was introduced, energy savings were still observed: 3.63%, 7.68%, and 2.35% for the same profiles. In terms of trajectory tracking, the PID controller achieved slightly lower steady-state errors—as low as 0.014%—yet the fuzzy controller also maintained errors below 0.25% in all cases, making it a suitable option for energy-sensitive applications.
Statistical validation was carried out using Welch’s t-test to confirm the significance of the observed differences, with all p-values falling below the 0.05 threshold. Additionally, the TFLC exhibited lower coefficients of variation in every test, indicating more consistent energy behavior. These findings support the use of software-based strategies as a cost-effective and scalable solution to reduce energy consumption in industrial and embedded applications, particularly in robotics and mechatronic systems. Future work may involve integrating metaheuristic optimization for the trajectories or TFLC parameters and testing under more complex operational scenarios.

Author Contributions

Conceptualization, L.F.O.-G., J.R.G.-M. and J.R.-R.; methodology, L.F.O.-G. and J.R.G.-M.; software, L.F.O.-G.; validation, L.F.O.-G., J.R.G.-M. and E.E.C.-M.; formal analysis, B.S.D.-B. and O.A.B.-V.; investigation, L.F.O.-G. and J.R.G.-M.; resources, J.R.G.-M., J.R.-R., E.E.C.-M., B.S.D.-B. and O.A.B.-V.; data curation, J.R.G.-M., J.R.-R. and E.E.C.-M.; writing—original draft preparation, L.F.O.-G. and J.R.G.-M.; writing—review and editing, J.R.-R., E.E.C.-M. and B.S.D.-B.; visualization, L.F.O.-G.; supervision, J.R.G.-M.; project administration, J.R.G.-M.; funding acquisition, J.R.G.-M., J.R.-R., E.E.C.-M., B.S.D.-B. and O.A.B.-V. All authors have read and agreed to the published version of the manuscript.

Funding

“Secretaría de Ciencia, Humanidades, Tecnología e Innovación” (SECIHTI) for the scholarship support with CVU: 1271936.

Data Availability Statement

Regarding the Data Availability Statement, we confirm that no new data were created or analyzed in this study. Therefore, data sharing is not applicable to this article.

Acknowledgments

The principal author thanks the “Facultad de Ingeniería en Electrónica y Comunicaciones, Universidad Veracruzana, Región: Poza Rica—Tuxpan” for its support of this research. Grammarly was used to check the grammar in this manuscript.

Conflicts of Interest

The authors declare no conflicts of interest.

Abbreviations

The following abbreviations are used in this manuscript:
TFLCTsukamoto Fuzzy Logic Controller
PIDProportional–Integral–Derivative
QEIQuadrature Encoder Interface
PWMPulse Width Modulation
UARTUniversal Asynchronous Receiver–Transmitter
I2CInter-Integrated Circuit
CVCoefficient of Variation
FIRFinite Impulse Response
SSESteady-State Error
MTEMaximum Tracking Error
PPRPulses Per Revolution
CPRCounts Per Revolution
TsSampling Time
PE/NEPositive/Negative Error
PED/NEDPositive/Negative Error Derivative
PUP/NUPPositive/Negative Control Action
HDG/LDGHigh/Low Derivative Gain
HVACHeating, Ventilation, and Air Conditioning

References

  1. De Laet, R.; Van Oosterwyck, N.; Cuyt, A.; Derammelaere, S. Global optimum motion profiles for enhanced energy efficiency in industrial positioning applications. Mechatronics 2025, 109, 103352. [Google Scholar] [CrossRef]
  2. Van Oosterwyck, N.; Vanbecelaere, F.; Knaepkens, F.; Monte, M.; Stockman, K.; Cuyt, A.; Derammelaere, S. Energy optimal point-to-point motion profile optimization. Mech. Based Des. Struct. Mach. 2024, 52, 239–256. [Google Scholar] [CrossRef]
  3. Huang, S.N.; Tan, K.K.; Lee, T.H. Adaptive motion control using neural network approximations. Automatica 2002, 38, 227–233. [Google Scholar] [CrossRef]
  4. Kyslan, K.; Smoleň, P.; Šlapák, V.; Ďurovský, F. A Nonlinear Controller for Point-to-Point Position Control. Energies 2023, 16, 6339. [Google Scholar] [CrossRef]
  5. Mehrabi, M. Design of a Fuzzy-Based Controller for Real-Time Control of CNC Machines. In Proceedings of the 2023 3rd International Conference on Electrical, Computer, Communications and Mechatronics Engineering (ICECCME), Tenerife, Spain, 19–21 July 2023; pp. 1–5. [Google Scholar]
  6. Gentili, P.L. The conformational contribution to molecular complexity and its implications for information processing in living beings and chemical artificial intelligence. Biomimetics 2024, 9, 121. [Google Scholar] [CrossRef] [PubMed]
  7. Yamakawa, T. Stabilization of an inverted pendulum by a high-speed fuzzy logic controller hardware system. Fuzzy Sets Syst. 1989, 32, 161–180. [Google Scholar] [CrossRef]
  8. Kandel, A.; Langholz, G. Fuzzy Hardware: Architectures and Applications; Springer Science & Business Media: Berlin/Heidelberg, Germany, 2012. [Google Scholar]
  9. Niembro-Ceceña, J.A.; Gómez-Loenzo, R.A.; Rodríguez-Reséndiz, J. SoftCtrlDC-M: Embedded control software for brushed direct current motors. SoftwareX 2024, 25, 101643. [Google Scholar] [CrossRef]
  10. Urrea, C.; Saa, D. Design, Simulation, Implementation, and Comparison of Advanced Control Strategies Applied to a 6-DoF Planar Robot. Symmetry 2023, 15, 1070. [Google Scholar] [CrossRef]
  11. Tang, H.H.; Ahmad, N.S. Fuzzy Logic Approach for Controlling Uncertain and Nonlinear Systems: A Comprehensive Review of Applications and Advances. Syst. Sci. Control Eng. 2024, 12, 2394429. [Google Scholar] [CrossRef]
  12. Montes Rivera, M.; Olvera-Gonzalez, E.; Escalante-Garcia, N. UPAFuzzySystems: A Python Library for Control and Simulation with Fuzzy Inference Systems. Machines 2023, 11, 572. [Google Scholar] [CrossRef]
  13. Pop, M.-D.; Pescaru, D.; Micea, M.V. Mamdani vs. Takagi–Sugeno Fuzzy Inference Systems in the Calibration of Continuous-Time Car-Following Models. Sensors 2023, 23, 8791. [Google Scholar] [CrossRef]
  14. Michailidis, P.; Michailidis, I.; Vamvakas, D.; Kosmatopoulos, E. Model-Free HVAC Control in Buildings: A Review. Energies 2023, 16, 7124. [Google Scholar] [CrossRef]
  15. Carabin, G.; Vidoni, R. Energy-saving optimization method for point-to-point trajectories planned via standard primitives in 1-DoF mechatronic systems. Int. J. Adv. Manuf. Technol. 2021, 116, 331–344. [Google Scholar] [CrossRef]
  16. Hosseini, S.; Hahn, I. Nonlinear optimization of energy consumption in trajectory planning of a single-axis electrical drive. In Proceedings of the 2019 IEEE 28th International Symposium on Industrial Electronics (ISIE), Vancouver, BC, Canada, 12–14 June 2019; pp. 599–604. [Google Scholar]
  17. Montalvo, V.; Estévez-Bén, A.A.; Rodríguez-Reséndiz, J.; Macias-Bobadilla, G.; Mendiola-Santibáñez, J.D.; Camarillo-Gómez, K.A. FPGA-based architecture for sensing power consumption on parabolic and trapezoidal motion profiles. Electronics 2020, 9, 1301. [Google Scholar] [CrossRef]
  18. Tolochko, O.; Rozkariaka, P. Asymmetric reference trajectories for energy efficiency position electric drives. In Proceedings of the 2018 X International Conference on Electrical Power Drive Systems (ICEPDS), Moscow, Russia, 3–6 October 2018; pp. 1–7. [Google Scholar]
  19. Nshama, E.W.; Msukwa, M.R.; Uchiyama, N. A trade-off between energy saving and cycle time reduction by Pareto optimal corner smoothing in industrial feed drive systems. IEEE Access 2021, 9, 23579–23594. [Google Scholar] [CrossRef]
  20. Assad, F.; Rushforth, E.; Ahmad, M.; Ahmad, B.; Harrison, R. An approach of optimising s-curve trajectory for a better energy consumption. In Proceedings of the 2018 IEEE 14th International Conference on Automation Science and Engineering (CASE), Munich, Germany, 20–24 August 2018; pp. 98–103. [Google Scholar]
  21. Halinga, M.S.; Nyobuya, H.J.; Uchiyama, N. Generation of time and energy optimal coverage motion for industrial machines using a modified S-curve trajectory. In Proceedings of the 2023 IEEE/SICE International Symposium on System Integration (SII), Atlanta, GA, USA, 17–20 January 2023; pp. 1–6. [Google Scholar]
  22. Raisch, A.; Sawodny, O. Consumption minimization for electromechanical drives by energy-optimal feedforward control. In Proceedings of the 2019 IEEE International Conference on Systems, Man and Cybernetics (SMC), Bari, Italy, 6–9 October 2019; pp. 1557–1562. [Google Scholar]
  23. Wang, B.; Gou, M.; Yang, Z.; Qiu, S. A Synchronous Tracking Algorithm for Positioning Servo System with Double-loop Control. IEEE Trans. Ind. Appl. 2024, 61, 279–288. [Google Scholar] [CrossRef]
  24. Cicek, E.; Türker, T.; Akbati, O.; Sancak, K.V. Asymmetric S-curve generation and tracking under motion constraints: An experimental validation. In Proceedings of the 2022 Advances in Science and Engineering Technology International Conferences (ASET), Dubai, United Arab Emirates, 21–24 February 2022; pp. 1–6. [Google Scholar]
  25. Nguyen, A.T.; Nguyen, N.H.; Trinh, M.L. Fuzzy PD control for a quadrotor with experimental results. Results Control Optim. 2025, 19, 100568. [Google Scholar] [CrossRef]
  26. Lee, S.Y.; Kang, C.S.; Hyun, C.H.; Park, M. S-curve profile switching method using fuzzy system for position control of DC motor under uncertain load. In Proceedings of the 2012 12th International Conference on Control, Automation and Systems, Jeju Island, Republic of Korea, 17–21 October 2012; pp. 91–95. [Google Scholar]
  27. García-Martínez, J.R.; Cruz-Miguel, E.E.; Carrillo-Serrano, R.V.; Mendoza-Mondragón, F.; Toledano-Ayala, M.; Rodríguez-Reséndiz, J. A PID-type fuzzy logic controller-based approach for motion control applications. Sensors 2020, 20, 5323. [Google Scholar] [CrossRef]
  28. Meliani, H.; Ohamouddou, S.; El Afia, H.; Boulaich, M.H.; El Afia, A. Robot path planning using fuzzy Tsukamoto simulated annealing. In Proceedings of the 2024 Mediterranean Smart Cities Conference (MSCC), Tangier, Morocco, 2–4 May 2024; pp. 1–4. [Google Scholar]
  29. Khoukhi, A.; Baron, L.; Balazinski, M.; Demirli, K. Fuzzy-neuro optimal time-energy control of a three degrees of freedom planar manipulator. In Proceedings of the NAFIPS 2006 Annual Meeting of the North American Fuzzy Information Processing Society, Montreal, QC, Canada, 3–6 June 2006; pp. 247–252. [Google Scholar]
  30. Sunardi; Yudhana, A.; Furizal. Tsukamoto fuzzy inference system on Internet of Things-based for room temperature and humidity control. IEEE Access 2023, 11, 6209–6227. [Google Scholar] [CrossRef]
  31. Biagiotti, L.; Melchiorri, C. Trajectory Planning for Automatic Machines and Robots; Springer Science & Business Media: Berlin/Heidelberg, Germany, 2008. [Google Scholar]
  32. Gurocak, H. Industrial Motion Control: Motor Selection, Drives, Controller Tuning, Applications; John Wiley & Sons: Hoboken, NJ, USA, 2015. [Google Scholar]
  33. Kröger, T. On-Line Trajectory Generation in Robotic Systems: Basic Concepts for Instantaneous Reactions to Unforeseen (Sensor) Events; Springer Tracts in Advanced Robotics; Springer: Berlin/Heidelberg, Germany, 2010. [Google Scholar]
  34. Gasparetto, A.; Boscariol, P.; Lanzutti, A.; Vidoni, R. Path planning and trajectory planning algorithms: A general overview. In Motion and Operation Planning of Robotic Systems; Springer: Berlin/Heidelberg, Germany, 2015; pp. 3–27. [Google Scholar]
  35. Crowder, R. Electric Drives and Electromechanical Systems: Applications and Control, 2nd ed.; Elsevier Science: Amsterdam, The Netherlands, 2019. [Google Scholar]
  36. Martínez, J.R.G.; Reséndiz, J.R.; Prado, M.Á.M.; Miguel, E.E.C. Assessment of jerk performance s-curve and trapezoidal velocity profiles. In Proceedings of the 2017 XIII International Engineering Congress (CONIIN), Santiago de Queretáro, Mexico, 15–19 May 2017; pp. 1–7. [Google Scholar]
  37. Ramos-Fernández, J.C.; López-Morales, V.; Márquez-Vera, M.A.; Pérez, J.M.X.; Suarez-Cansino, J. Neuro-fuzzy modelling and stable PD controller for angular position in steering systems. Int. J. Automot. Technol. 2021, 22, 1495–1503. [Google Scholar] [CrossRef]
  38. Baturone, I.; Barriga, A.; Jimenez-Fernandez, C.; Lopez, D.R.; Sanchez-Solano, S. Microelectronic Design of Fuzzy Logic-Based Systems; International Series on Computational Intelligence; CRC Press: Boca Raton, FL, USA, 2018. [Google Scholar]
  39. Siddique, N. Intelligent Control: A Hybrid Approach Based on Fuzzy Logic, Neural Networks and Genetic Algorithms; Studies in Computational Intelligence; Springer: Berlin/Heidelberg, Germany, 2013. [Google Scholar]
  40. Ross, T.J. Fuzzy Logic with Engineering Applications, 4th ed.; Wiley: Hoboken, NJ, USA, 2016. [Google Scholar]
  41. Khan, A.A.; Rapal, N. Fuzzy PID controller: Design, tuning and comparison with conventional PID controller. In Proceedings of the 2006 IEEE International Conference on Engineering of Intelligent Systems, Islamabad, Pakistan, 22–23 April 2006; pp. 1–6. [Google Scholar] [CrossRef]
  42. Olmedo-García, L.F.; García-Martínez, J.R.; Cruz-Miguel, E.E.; Barra-Vázquez, O.A.; González-Lee, M.; Martínez-Sánchez, T. Real-time embedded system-based approach for sensing power consumption on motion profiles. Electronics 2023, 12, 3853. [Google Scholar] [CrossRef]
  43. Kishore, K.; Jaswal, V. Statistics corner: Comparing two unpaired groups. J. Postgrad. Med. Educ. Res. 2022, 56, 145–148. [Google Scholar] [CrossRef]
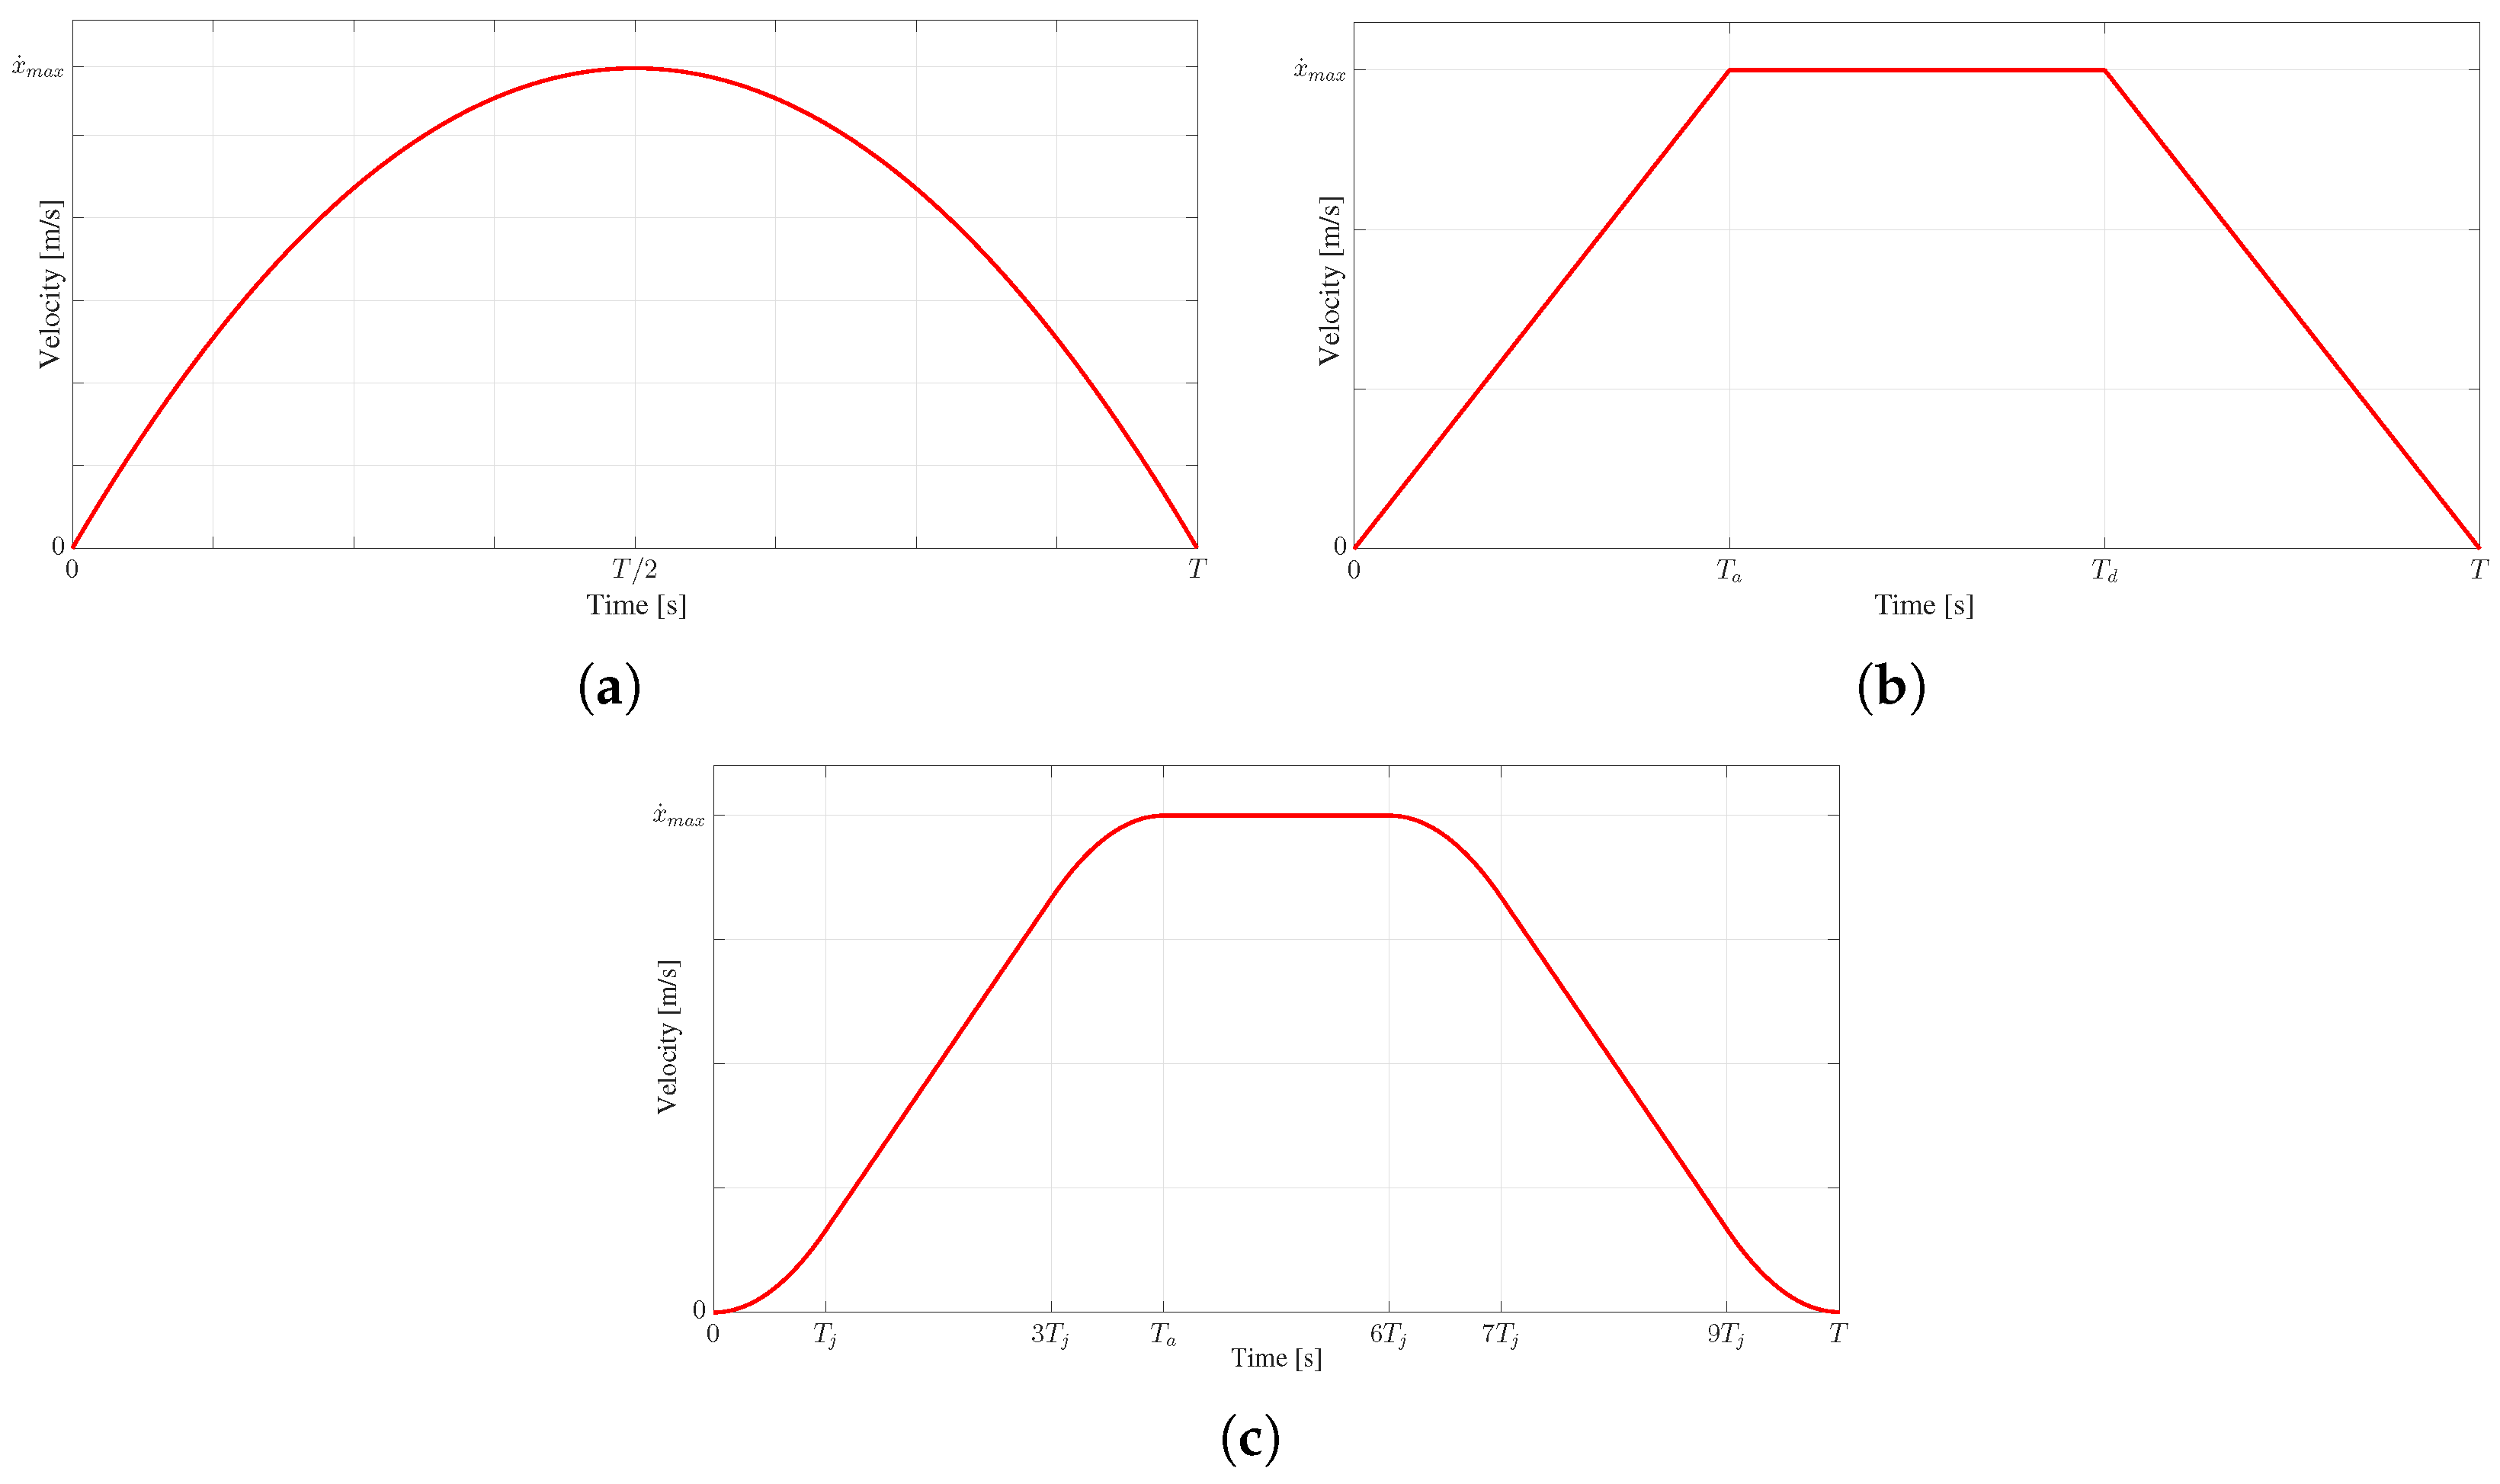
Figure 1. Polynomial velocity profiles: (a) parabolic, (b) trapezoidal, and (c) S-curve.
Technologies 13 00387 g001
Figure 2. Structure of the TFLC: Fuzzy System I computes the proportional action u p ( t ) ; Fuzzy System II computes the derivative gain K d . The ∗ operator indicates a numerical multiplication.
Technologies 13 00387 g002
Figure 3. Membership function distribution for position error.
Technologies 13 00387 g003
Figure 4. Membership functions for the proportional control action.
Technologies 13 00387 g004
Figure 5. Tsukamoto fuzzy model.
Technologies 13 00387 g005
Figure 6. Control surface for Fuzzy System I.
Technologies 13 00387 g006
Figure 7. Distribution of the membership functions for the derivative of the position error.
Technologies 13 00387 g007
Figure 8. Membership functions for the derivative gain.
Technologies 13 00387 g008
Figure 9. Relationship between the error derivative and the gain K d .
Technologies 13 00387 g009
Figure 10. A 3D model of the test platform.
Technologies 13 00387 g010
Figure 11. Connection diagram of the components.
Technologies 13 00387 g011
Figure 12. General block diagram of the control system.
Technologies 13 00387 g012
Figure 13. Position and velocity responses for the three motion profiles under no-load conditions. (a) Position. (b) Velocity.
Technologies 13 00387 g013
Figure 14. Relative tracking error under different conditions: (a) without load, (b) with load.
Technologies 13 00387 g014
Figure 15. Control signal for each profile and controller: (a) without load, (b) with load.
Technologies 13 00387 g015
Figure 16. Measured current for each profile and controller: (a) without load, (b) with load.
Technologies 13 00387 g016
Figure 17. Instantaneous power consumption for each profile and controller: (a) without load, (b) with load.
Technologies 13 00387 g017
Figure 18. Energy consumption for each profile and controller: (a) without load, (b) with load.
Technologies 13 00387 g018
Table 1. Membership function parameters for position error.
Membership Function a 1 [m] b 1 [m]
Positive Error (P)0.02−0.02
Negative Error (N)−0.020.02
Table 2. Membership function parameters for the derivative of the error.
Membership Function a 2 [m/s] b 2 m/s
Positive Error Derivative (PED)0.00015−0.00015
Negative Error Derivative (NED)−0.000150.00015
Table 3. Geometrical parameters of the linear plant.
Geometrical ParameterDimensions
Total length of the plant [m] 1.7
Plant width [m] 0.30
Carriage shaft [m] 0.020
Rail linear guides [m] 1.16
Round shaft linear guides [m] 0.020
Coupling shaft flexible [m] 0.020
Bearing balls [m] 0.020  ×  0.42  ×  0.012
Table 4. Main features of the TM4C123GH6PM microcontroller.
FeatureDescription
CoreARM Cortex-M4F
Performance80-MHz operation
UART8 modules
I2CFour I2C modules with four transmission speeds, including high-speed mode
General-Purpose Timer (GPTM)6–16-/32-bit GPTM blocks and
six 32/64-bit wide GPTM blocks
General-Purpose Input/Output (GPIO)6 physical GPIO blocks
PWM2 PWM modules, each with four PWM generator blocks and a control block, up to 16 PWM outputs
QEI2 QEI modules
Table 5. Parameters used for the implementation of the motion profiles.
ParameterParabolicTrapezoidalS-Curve
Final position ( x f ) [m]0.80.80.8
Total time for displacement (T) [s]444
Acceleration time ( T a ) [s]1.3331.6
Maximum velocity ( x ˙ max ) [ m s ]0.30.30.333
Maximum acceleration ( x ¨ max ) [ m s 2 ]0.30.2250.277
Table 6. Average error metrics for each profile and controller.
ProfileControllerMTE [m]SSE [m] ϵ ( % )
Without Load
ParabolicPID0.002450.000800.100
TFLC0.005410.000810.102
TrapezoidalPID0.002210.000510.064
TFLC0.006600.000890.112
S-curvePID0.001930.000100.013
TFLC0.006640.001800.226
With Load
ParabolicPID0.009600.000880.111
TFLC0.005980.000870.109
TrapezoidalPID0.002290.000380.048
TFLC0.006950.000900.113
S-curvePID0.002060.000110.014
TFLC0.006940.001760.220
Table 7. Maximum current, voltage, and power for each profile and controller (average values).
ProfileControllerMax Current [A]Max Voltage [V]Max Power [W]
Without Load
ParabolicPID2.619212.432928.8797
TFLC2.499611.429825.2190
TrapezoidalPID2.623413.594635.5874
TFLC2.473812.883431.8029
S-curvePID2.694213.730136.8111
TFLC2.656813.580235.8669
With Load
ParabolicPID2.603812.642529.8020
TFLC2.553211.850527.3064
TrapezoidalPID2.684413.995937.5539
TFLC2.596413.437834.7456
S-curvePID2.694014.143837.7888
TFLC2.688214.074237.7467
Table 8. Average energy consumption [J] for each controller and profile.
ControllerParabolicTrapezoidalS-Curve
Without Load
PID74.429370.741670.5947
TFLC65.6661 ↓64.1794 ↓68.1557 ↓
With Load
PID72.618971.253268.1431
TFLC69.9805 ↓65.7775 ↓66.5385 ↓
Table 9. Comparison of the energy coefficients of variation (CVs) and p-values between PID and TFLC for each motion profile.
ConditionProfileCVPID (%)CVTFLC (%)p-Value
No loadParabolic2.711.860.00010
Trapezoidal3.490.820.00332
S-curve1.760.480.01003
With loadParabolic2.111.840.01903
Trapezoidal3.002.980.00297
S-curve1.641.210.03373
Disclaimer/Publisher’s Note: The statements, opinions and data contained in all publications are solely those of the individual author(s) and contributor(s) and not of MDPI and/or the editor(s). MDPI and/or the editor(s) disclaim responsibility for any injury to people or property resulting from any ideas, methods, instructions or products referred to in the content.