Article

Enhanced Performance and Reduced Emissions in Aviation Microturboengines Using Biodiesel Blends and Ejector Integration

by
Constantin Leventiu
1,
Grigore Cican
1,2,*,
Laurentiu-Lucian Cristea
2,
Sibel Osman
3,
Alina Bogoi
1,2,
Daniel-Eugeniu Crunteanu
1 and
Andrei Vlad Cojocea
1
1
Faculty of Aerospace Engineering, Polytechnic University of Bucharest, 1-7 Polizu Street, 011061 Bucharest, Romania
2
National Research and Development Institute for Gas Turbines COMOTI, 220D Iuliu Maniu, 061126 Bucharest, Romania
3
Faculty of Applied Science and Engineering, Ovidius University of Constanta, 124 Mamaia Blvd., 900527 Constanta, Romania
*
Author to whom correspondence should be addressed.
Technologies 2025, 13(9), 388; https://doi.org/10.3390/technologies13090388
Submission received: 15 July 2025 / Revised: 8 August 2025 / Accepted: 22 August 2025 / Published: 1 September 2025
(This article belongs to the Special Issue Aviation Science and Technology Applications)

Abstract

This study examines the impact of using eco-friendly biodiesel blends with Jet A fuel in aviation microturbine engines, both with and without an ejector. Three biodiesel concentrations (10%, 20%, and 30%) were evaluated under three different operating conditions. Key performance indicators, including combustion temperature, fuel consumption, propulsive force, specific fuel consumption, and emissions, were analyzed. Results indicate that fuel consumption increases with higher biodiesel content, reaching a peak rise of 3.05% at idle for a 30% biodiesel blend. However, the ejector helps offset this increase, reducing fuel consumption by 3.82% for Jet A. A similar trend is observed for specific fuel consumption (SFC), which decreases by up to 19.67% when using Jet A with the ejector at idle. The addition of an ejector significantly enhances propulsive force, achieving improvements of up to 36.91% for a 30% biodiesel blend at idle. At higher operating regimes, biodiesel alone slightly reduces thrust, but the ejector effectively compensates for these losses. Emission analysis reveals that using biodiesel leads to a cleaner combustion process, significantly reducing CO and SO2 emissions. The ejector further enhances this effect by improving airflow and combustion efficiency. Additionally, noise measurements conducted using five microphones demonstrate that the ejector contributes to noise reduction. Overall, this study concludes that integrating an ejector with sustainable biodiesel blends not only enhances engine performance but also significantly reduces the environmental footprint of aviation microturbine engines.

1. Introduction

As the aviation industry faces increasing pressure to minimize its environmental impact [1], the development and integration of alternative fuels [2] and advanced engine technologies have become central areas of research [3]. In the pursuit of reducing the environmental footprint of aviation, Sustainable Aviation Fuels (SAFs) have emerged as a key solution, offering lower lifecycle greenhouse gas emissions compared to conventional jet fuels. Among the various SAF options, such as synthetic paraffinic kerosenes (SPKs), alcohol-to-jet fuels (ATJs), and hydroprocessed esters and fatty acids (HEFAs), biodiesel-based blends derived from renewable feedstocks have attracted increasing attention due to their relative ease of production and compatibility with existing turbine engines. In this context, the use of biodiesel in aviation microturbine engines offers a promising avenue for experimental analysis and performance optimization [4,5].
Among these alternatives, biodiesel blends have attracted significant attention due to their potential to reduce greenhouse gas emissions and enhance fuel sustainability [6]. Concurrently, advancements in engine design, such as ejector integration [7], have demonstrated promising results in improving microturbine performance by enhancing airflow distribution and thermal efficiency. There are several studies analyzing the use of biodiesel and biodiesel blends in aviation turbofan engines, demonstrating their potential [8].
While substantial research has been conducted on emissions reduction and fuel efficiency, the challenge of noise pollution remains a critical yet often underexplored aspect of aviation sustainability.
Aircraft engine noise, particularly in urban areas and regions surrounding airports, presents significant environmental and public health concerns. Microturbines, which are commonly employed in small-scale aviation applications such as unmanned aerial vehicles and auxiliary power units, are known to generate high-frequency noise that contributes to the overall acoustic footprint of aviation [9]. Noise emissions in these engines are influenced by several factors, including the combustion process, fuel properties, and exhaust flow dynamics.
The distinct physical and chemical properties of biodiesel blends can alter combustion behavior [10], potentially impacting noise generation. Similarly, ejector integration—by modifying exhaust flow characteristics and pressure distributions—offers a potential means of reducing noise emissions.
The blending of biodiesel fuels can significantly influence the emissions of microturbine engines through various mechanisms associated with combustion characteristics, fuel properties, and exhaust flow dynamics [11].
From a combustion perspective, biodiesel blends generally exhibit a higher cetane number compared to conventional Jet A fuel, affecting the efficiency of combustion [12]. The reduction in ignition lag contributes to decreased pressure fluctuations [13], thereby affecting the combustion noise.
Additionally, biodiesel combustion is typically characterized by a more gradual heat release compared to petroleum-based fuels [14]. A smoother heat release profile minimizes fluctuations in pressure waves, which are a primary source of noise emissions. Furthermore, due to their inherent oxygen content, biodiesel blends tend to combust at slightly lower flame temperatures [15], potentially reducing turbulence within the combustion chamber and mitigating noise associated with high-intensity burning.
Regarding fuel properties, biodiesel exhibits higher viscosity than Jet A fuel [16], leading to larger droplet sizes during the atomization process. This variation in fuel spray characteristics affects air–fuel mixing, subsequently influencing combustion dynamics and noise generation. Inefficient atomization in small jet engines may result in incomplete combustion [17,18], inducing pressure oscillations that contribute to combustion noise. However, by optimizing the blending ratio, atomization can be improved, thereby reducing instability-driven noise emissions. Biodiesel blending also exerts a considerable impact on exhaust flow behavior and associated turbulence. The oxygen content in biodiesel alters the composition of exhaust gases [19] influencing post-combustion chemical reactions and modifying turbulence levels in the exhaust stream, which in turn affect noise emissions. Variations in combustion dynamics due to biodiesel use can lead to changes in exhaust jet velocity and structure—both of which are key factors in noise generation. Different biodiesel blend ratios may produce distinct turbulence intensities and shear layer interactions, thereby affecting the overall acoustic emissions of the microturbine engine.
In cases where an ejector is integrated into the microturbine system [20,21] variations in exhaust gas properties resulting from biodiesel blending may influence the entrainment of secondary air, subsequently altering pressure recovery and the overall noise reduction efficiency of the ejector [22]. Furthermore, certain biodiesel blends may generate lower-frequency combustion noise, which could interact uniquely with ejector-induced flow patterns, potentially enhancing noise attenuation effects.
Overall, the interplay between biodiesel combustion characteristics, fuel atomization properties, and exhaust flow dynamics plays a crucial role in determining microturbine noise emissions. A comprehensive understanding of these interactions is essential for optimizing biodiesel blends to achieve both performance efficiency and acoustic benefits in aviation microturbine applications.
This study aims to provide a comprehensive evaluation of the impact of biodiesel blends and ejector integration on the performance, emissions, and noise characteristics of aviation microturbines. By analyzing combustion dynamics, aerodynamic interactions, and acoustic emissions, this research explores the feasibility of integrating alternative fuels and aerodynamic modifications to achieve quieter microturbine operation. Through a combination of experimental testing and computational modeling, the study seeks to generate valuable insights into the mechanisms of noise generation and mitigation, thereby contributing to the development of more environmentally sustainable and acoustically optimized aviation technologies.
The aim of this paper is to analyze the use of the combination between biodiesel blends with Jet A used in aviation microturbine engines and an ejector. It is well-known that the use of biofuels results in lower performance compared to when only Jet A is used. By attaching an ejector, the performance losses caused by the use of biofuel should be at least compensated for or improved by the presence of the ejector. This paper tests blends of 10%, 20% and 30% biodiesel with Jet A. The first set of tests is conducted with the baseline engine at three operating regimes, while the second set of data is collected under the same conditions as the first but with an ejector attached to the engine. The variation in key parameters such as fuel consumption, thrust, combustion chamber temperature, specific fuel consumption, and noise recorded with five microphones placed radially around the engine is monitored. Additionally, for all experiments, emissions of CO and SO2 are recorded using a gas analyzer.

2. Materials and Methods

The fuel blends consisting of Jet A + 10% biodiesel (B10%), Jet A + 20% biodiesel (B20%) and Jet A + 30% biodiesel (B30%) were prepared for testing in a microturbine engine. Prior to testing, these blends were analyzed in terms of their physicochemical properties.
The fatty acid methyl ester (FAME) profile of the biodiesel was determined using a Clarus 500 GC chromatography system equipped with a flame ionization detector (FID) and a highly polar SGE BPX70 capillary column. The column’s stationary phase was polysiloxane, and the hydrogen flow rate was 20 mL min−1.

2.1. Analysis of the Blends

This experiment utilized Jet A and biodiesel, both obtained from a local supplier. Blends were prepared volumetrically at 298 K in a temperature-controlled room. Blend names reflect their composition; for instance, B10% denotes a blend of 90% Jet A and 10% biodiesel.
Components densities and viscosity were measured at atmospheric pressure using an Anton Paar SVM 3000 Stabinger viscometer, equipped with a Peltier temperature control. The SVM 3000 measures density using an oscillating U-tube. The liquid’s density is determined by the vibration frequency of the filled U-tube. Dynamic viscosity is measured using a rotating outer cylinder and a stationary inner cylinder. The torque required to rotate the outer cylinder at a constant speed is used to calculate dynamic viscosity. From these results, kinematic viscosity is automatically calculated by dividing dynamic viscosity by density. Prior to measurement, the SVM 3000 was recalibrated, cleaned, and air-dried. Density and viscosity were measured with precisions of ±0.0005 g cm−3 and ±0.35%, respectively. A Peltier thermostat maintained temperature with an accuracy of 0.02 K. Measurements were taken across a temperature range of 288.15–313.15 K.

2.2. Tests with the Micro Turbojet Engine

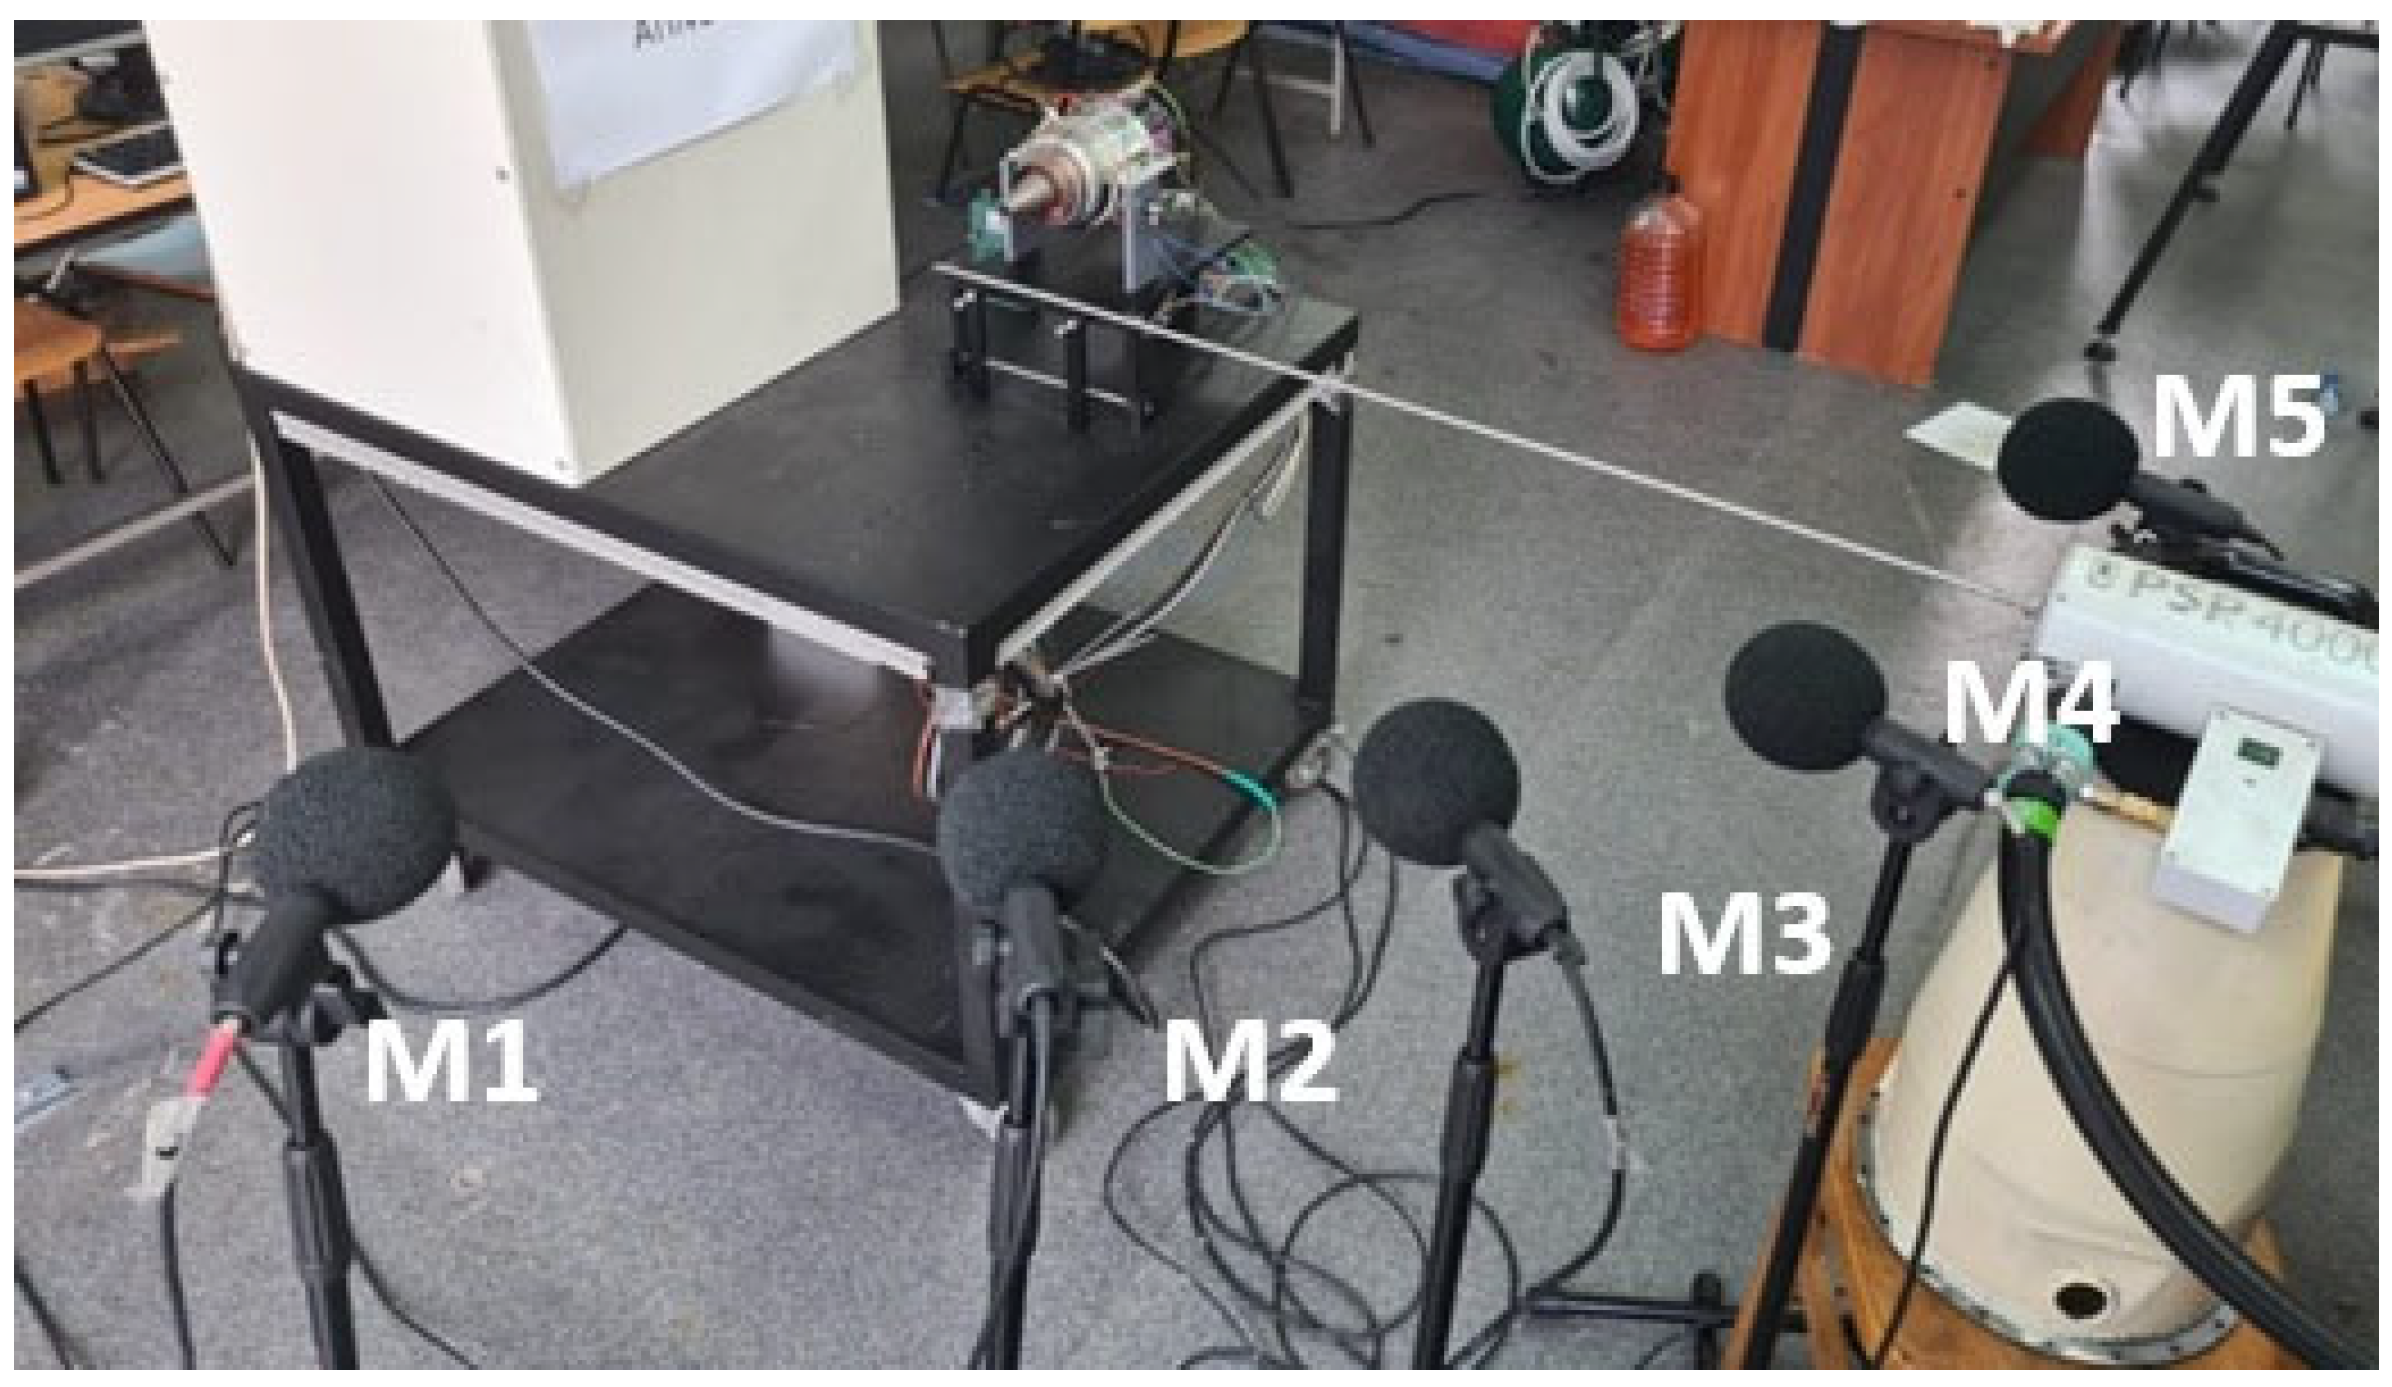
The experiments were conducted using a Jet Cat P80 microturbojet engine, as shown in Figure 1. A detailed description of the microturbojet engine can be found in [23].
This microturbojet engine is equipped with instrumentation capable of measuring the engine speed, air flow rate, fuel flow rate, thrust, pressure in the combustion chamber, temperature before the turbine, and temperature after the compressor. The acquisition rate is 1 signal per second. The tests were conducted at three different regimes: idle, intermediate, and near maximum speed. Due to the low signal acquisition rate, the tests were carried out for approximately two minutes, with signal averaging performed over this period. The parameters of interest for our study are the temperature before the turbine, fuel flow rate, and thrust.
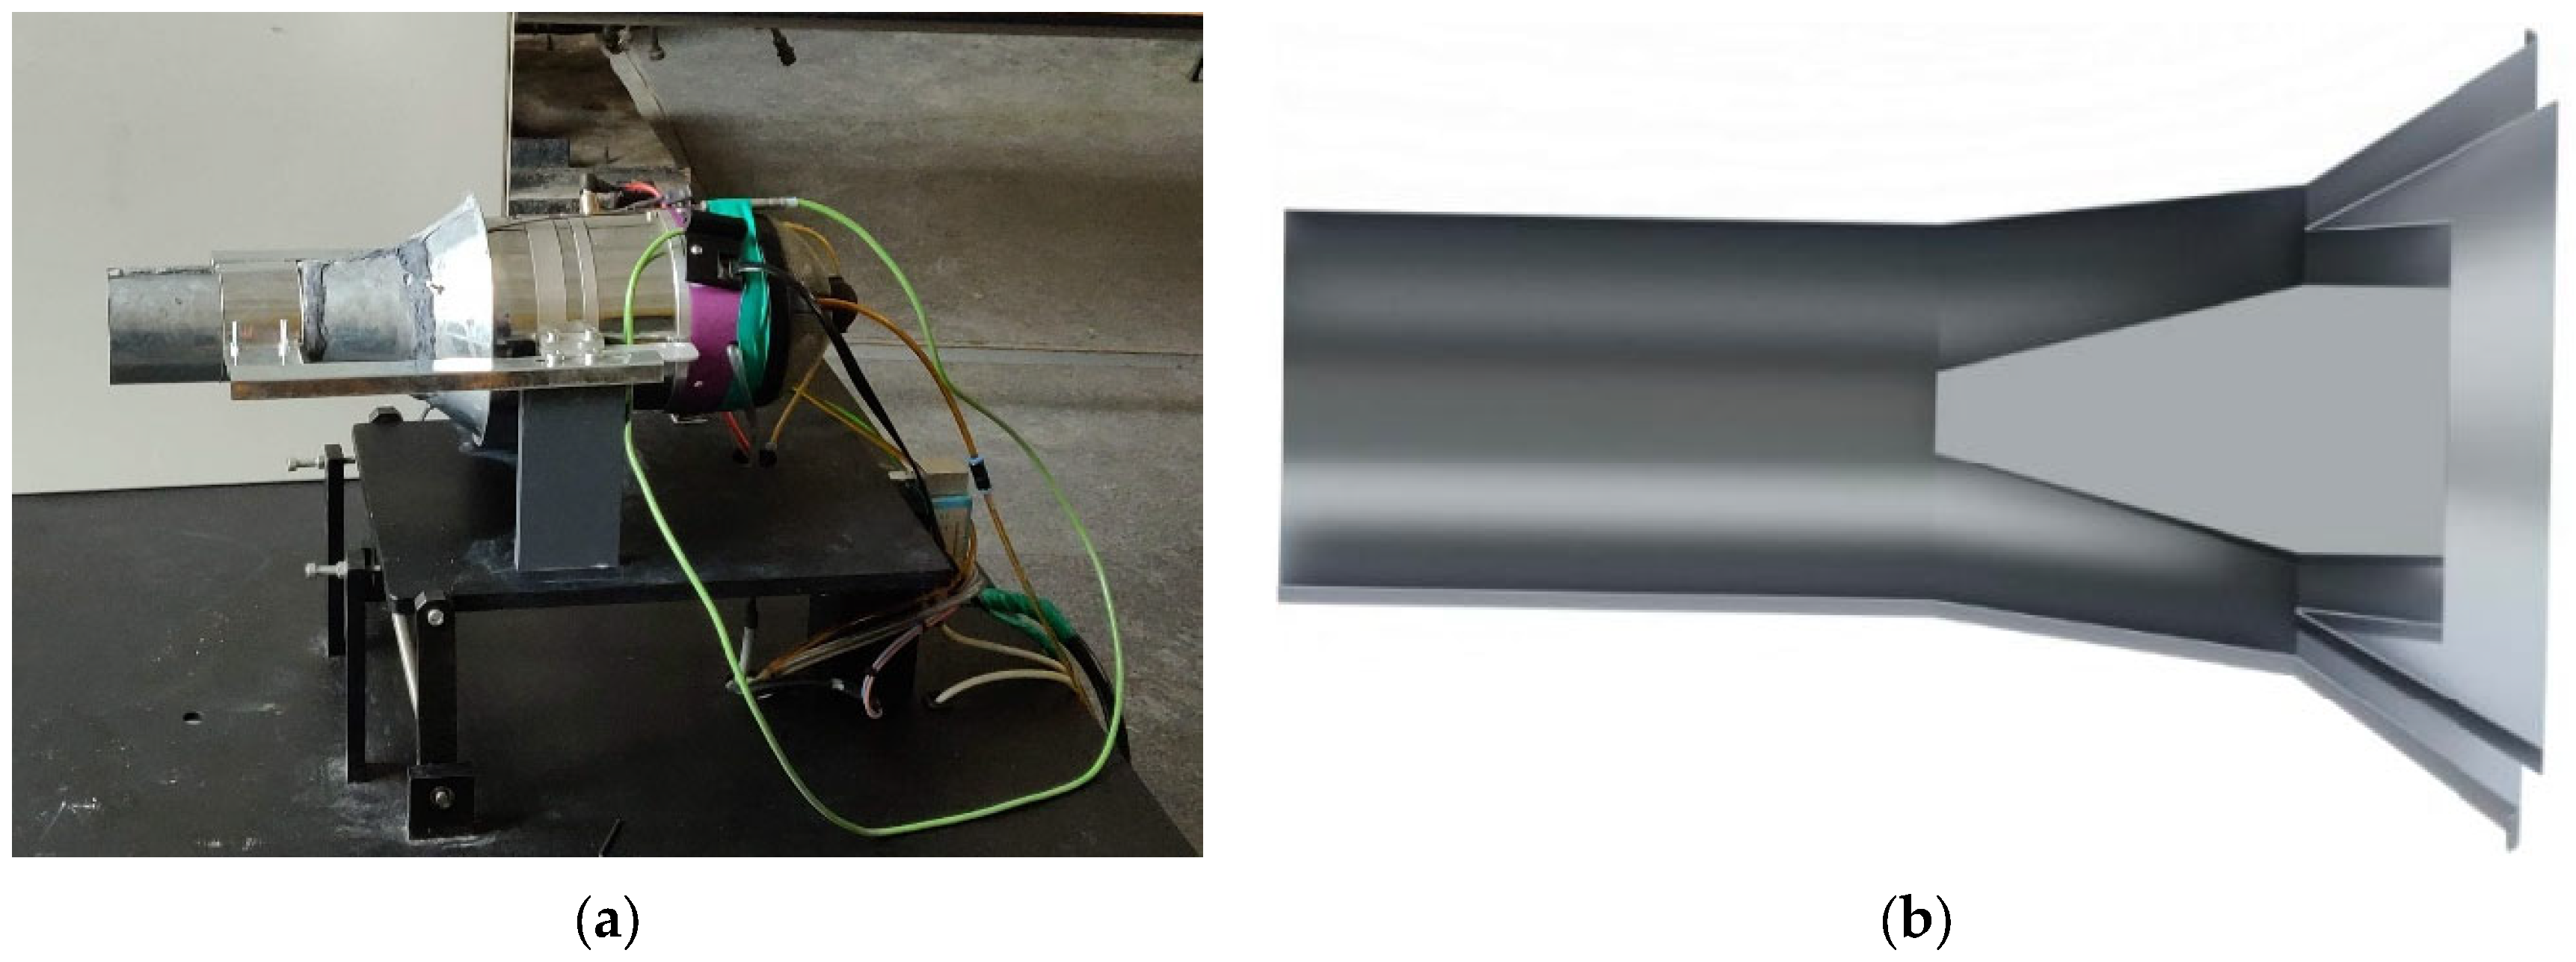
Regarding the use of the ejector, it has been utilized in source [5], which provides a detailed description of its design and its impact on the engine’s performance, including the acoustic aspects.
Figure 2 shows an image of the engine with the ejector.
Regarding the measurement of emissions, the most important and relevant concentrations that could be measured were CO and SO2. These were measured using a NOVAlus gas analyzer. The NOVAplus gas analyzer is produced by MRU Instruments, a company specializing in equipment for combustion gas analysis and industrial emissions measurements. MRU Instruments is based in Germany and provides solutions for combustion monitoring, energy efficiency, and pollution control. The measurement probe was placed in the gas jet, as shown in Figure 1, and measurements for all the studied cases were taken at the same point to allow a comparison between them.
For measurements, a multi-channel acquisition system with a sampling rate of 50,000 S/s per channel was used. As shown in Figure 1, five microphones were positioned radially 1 m away from the engine exhaust. The raw signals were processed using software, applying a linear amplitude function, RMS, linear weighting, windowing, and linear overall averaging with 50% overlap. A FFT analysis was performed to visualize the spectral properties of the signals, and band-stop filtering was applied close to the spectral components related to the shaft speed and its harmonics.

3. Results and Discussion

3.1. Results of the Physicochemical Properties of the Fuels Used

The FAME profile is presented in Table 1
The FAME composition of biodiesel, detailed in Table 1, varies based on the feedstock. Given that C18:1 is the predominant component in the biodiesel composition, it can be inferred that the raw material used was rapeseed oil. The primary objective for biodiesel produced from different raw materials is to ensure that its physical–chemical properties conform to the specifications outlined in the ASTM D6751 standard.
The physical properties of Jet A (Table 2) and biodiesel (Table 3) were determined using standardized ASTM D1655 [24] and ASTM D6751 [25], respectively.
The Jet A and biodiesel used met the quality requirements of ASTM D1655 and ASTM D6751, respectively.
The influence of temperature on the density of the blends was examined within the temperature range of 288.15 to 313.15 K (Figure 3). Blend density increased with biodiesel percentage at all temperatures tested, while it decreased with increasing temperature for all samples. As shown in Figure 3, the density values obtained for all blends at 288.15 K fall within the ASTM D1655 standard for Jet A fuel (0.775–0.840 g·cm−3).
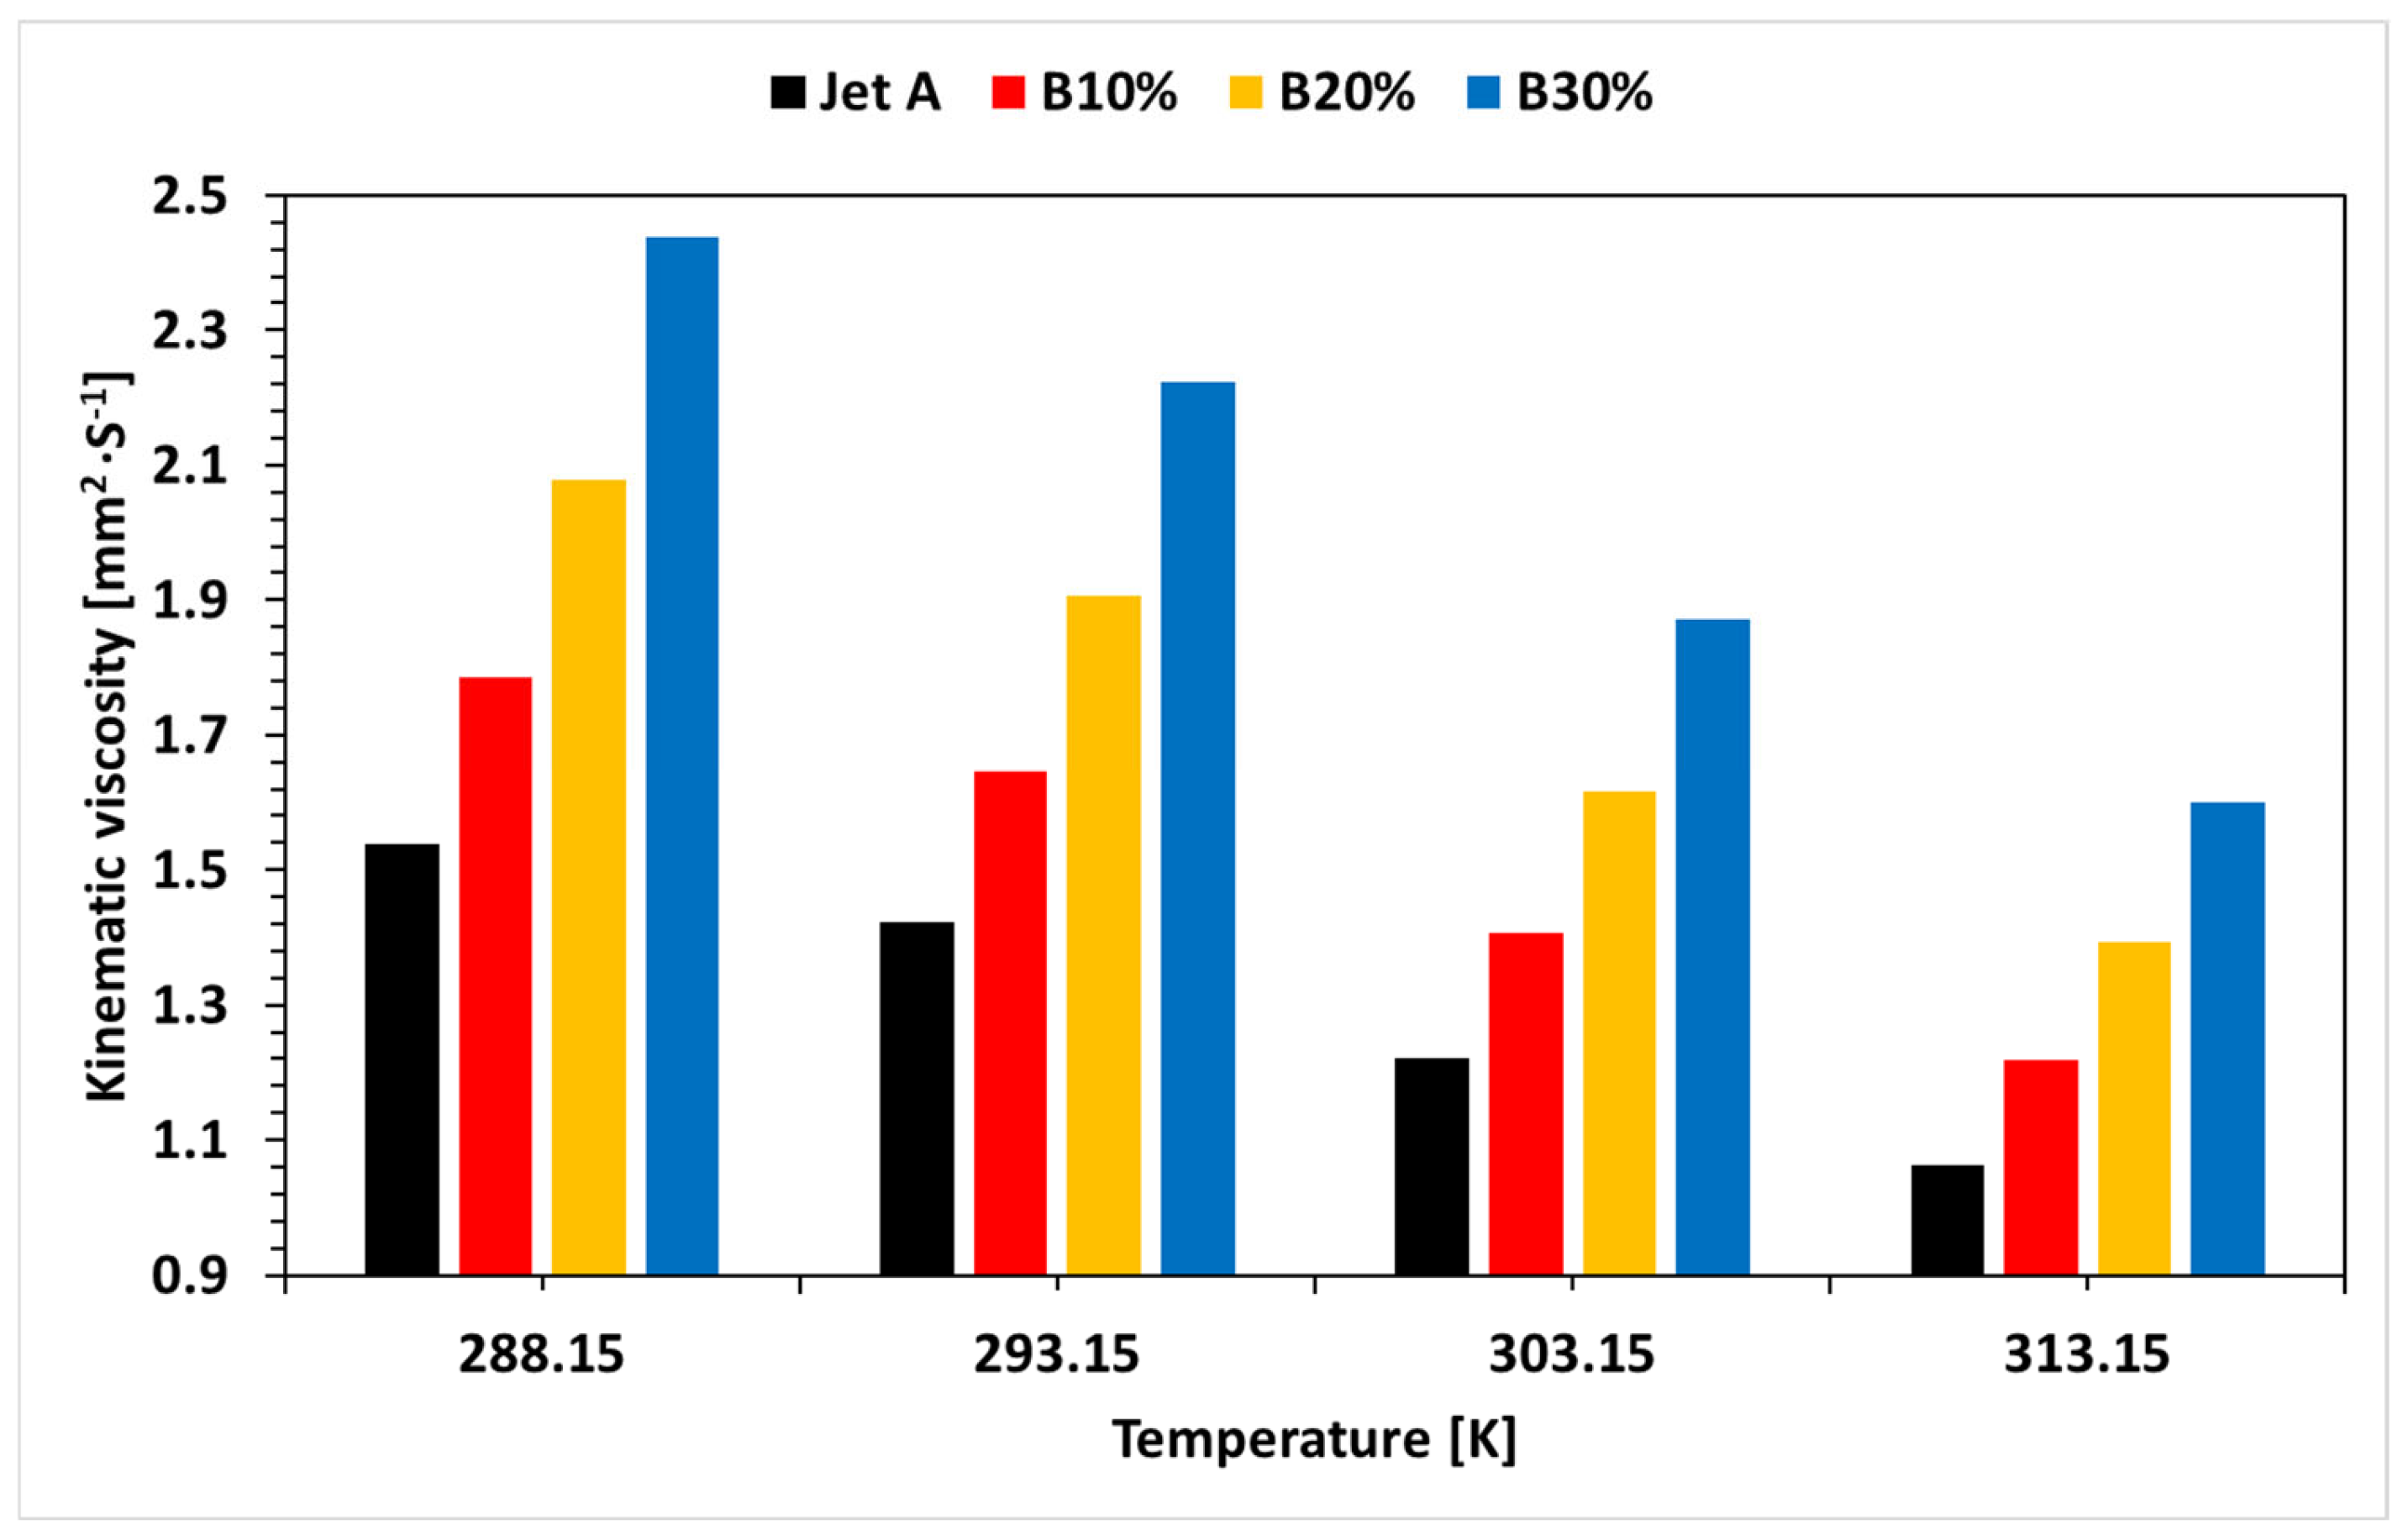
Figure 4 presents the kinematic viscosity of B10%, B20%, and B30% across a temperature range of 288.15 to 313.15 K.
As the biodiesel content increased, the kinematic viscosity also increased. Conversely, a clear decrease in viscosity with increasing temperature was observed, a trend consistent with kinetic molecular theory [32].
The use of biodiesel presents notable environmental advantages, primarily concerning the reduction in pollutants. From a performance and safety standpoint, it is a positive outcome that the density of these blends conforms to the ASTM D1655 standard for Jet A fuel. Furthermore, a critical safety benefit of biodiesel is its significantly higher flash point compared to that of conventional Jet A (164 °C vs. 34.8 °C), which is an important consideration for handling and storage.

3.2. Performance of the Microturbojet Engine

As a result of the tests conducted for the three operating regimes in both configurations (with and without the ejector), using Jet A fuel and blends with 10%, 20%, and 30% biodiesel, the variation in key parameters of interest is presented in the figures below.
The black color represents the values when the microturbojet engine operates on Jet A fuel, red is used for the 10% biodiesel blend, yellow for the 20% biodiesel blend, and blue for the 30% biodiesel blend. For the same conditions, but when the ejector is used, the graphs are the same colors but with a hatched pattern.
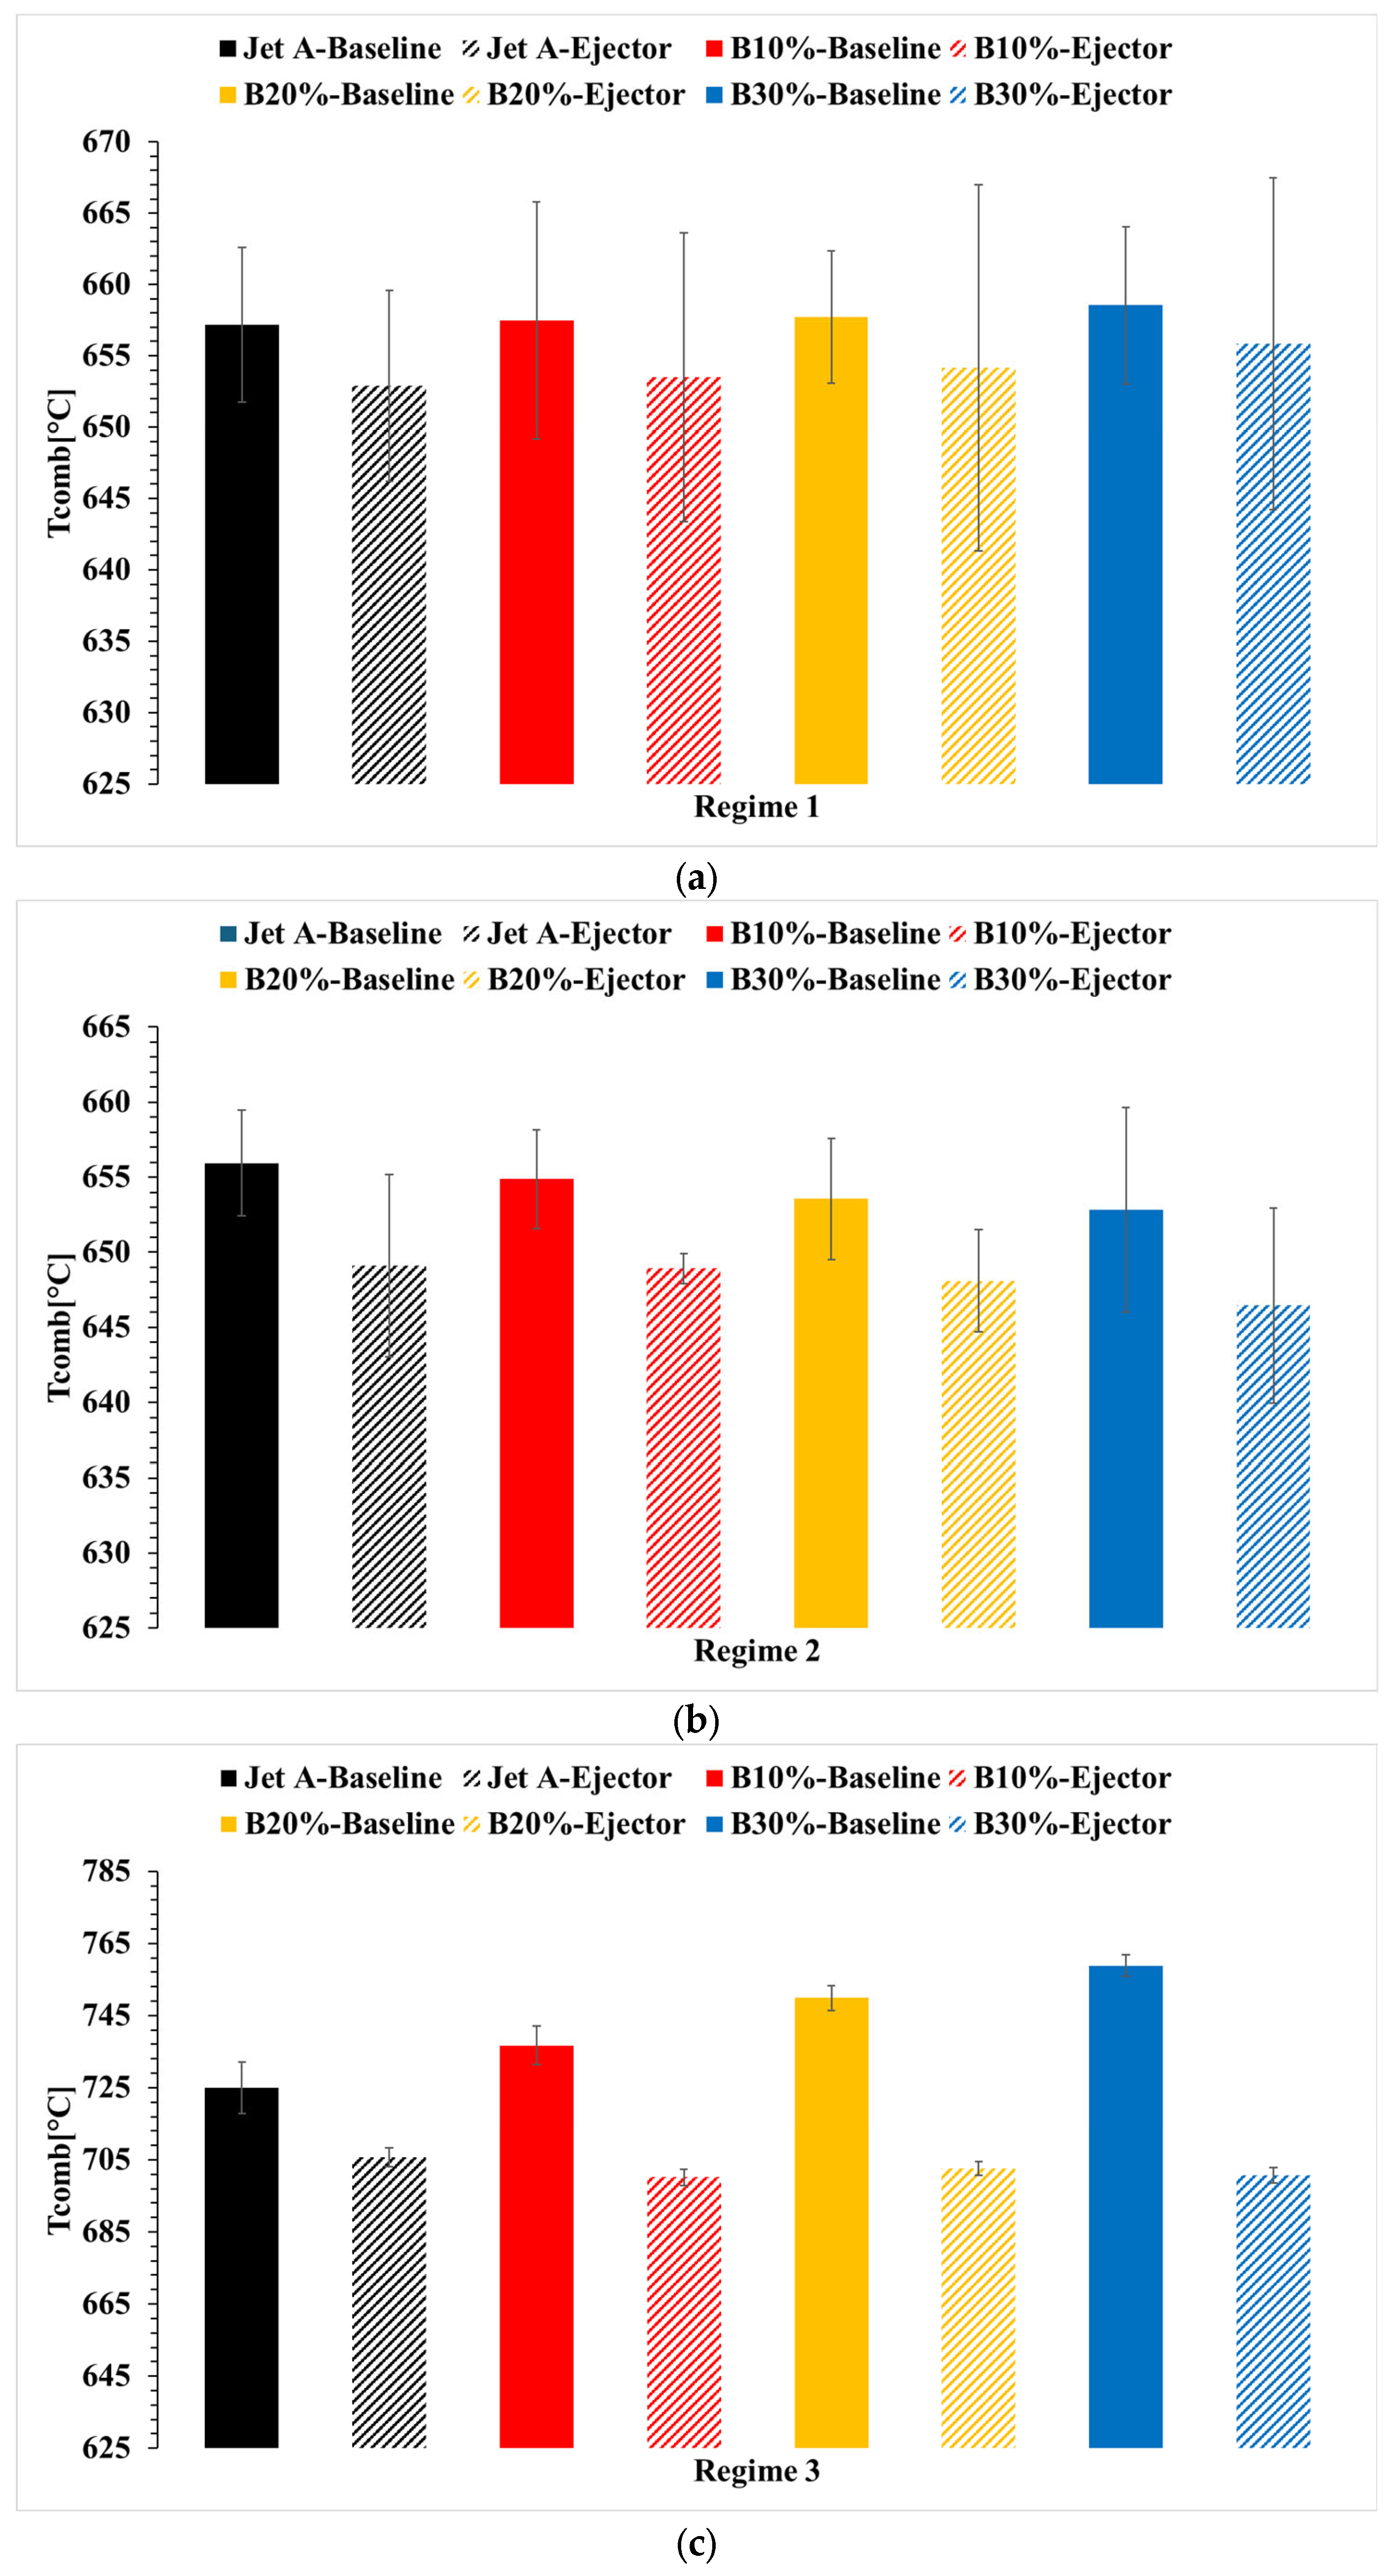
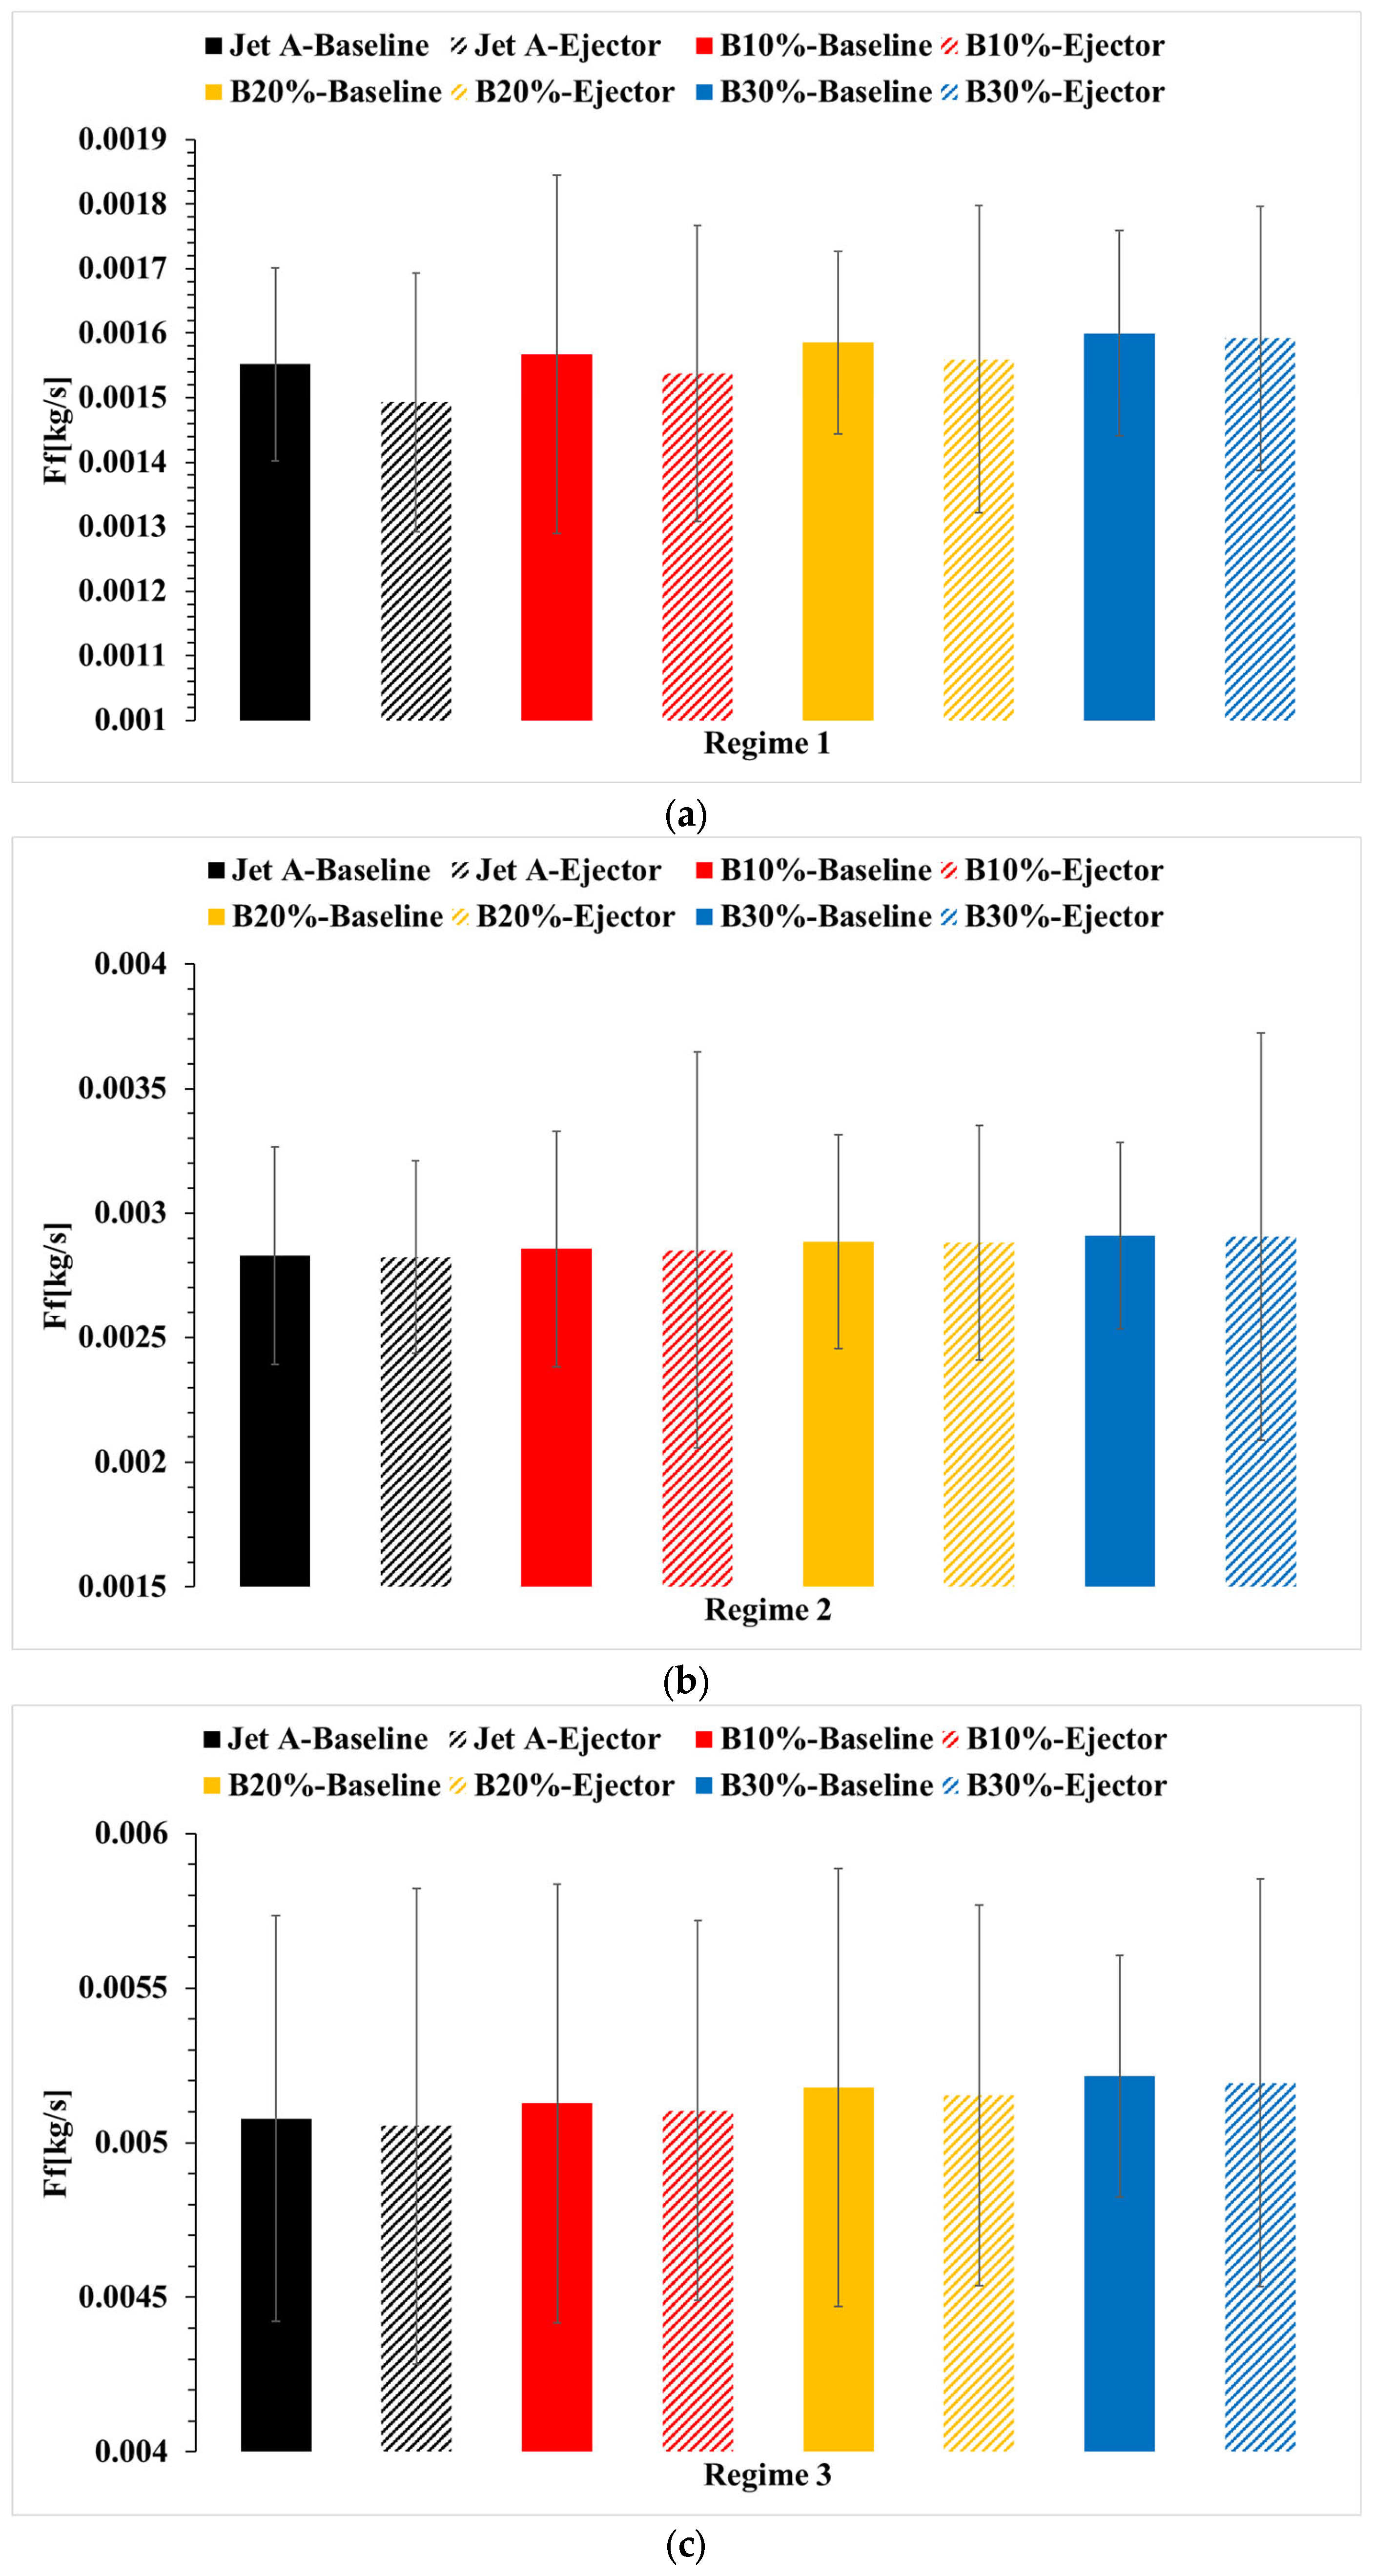
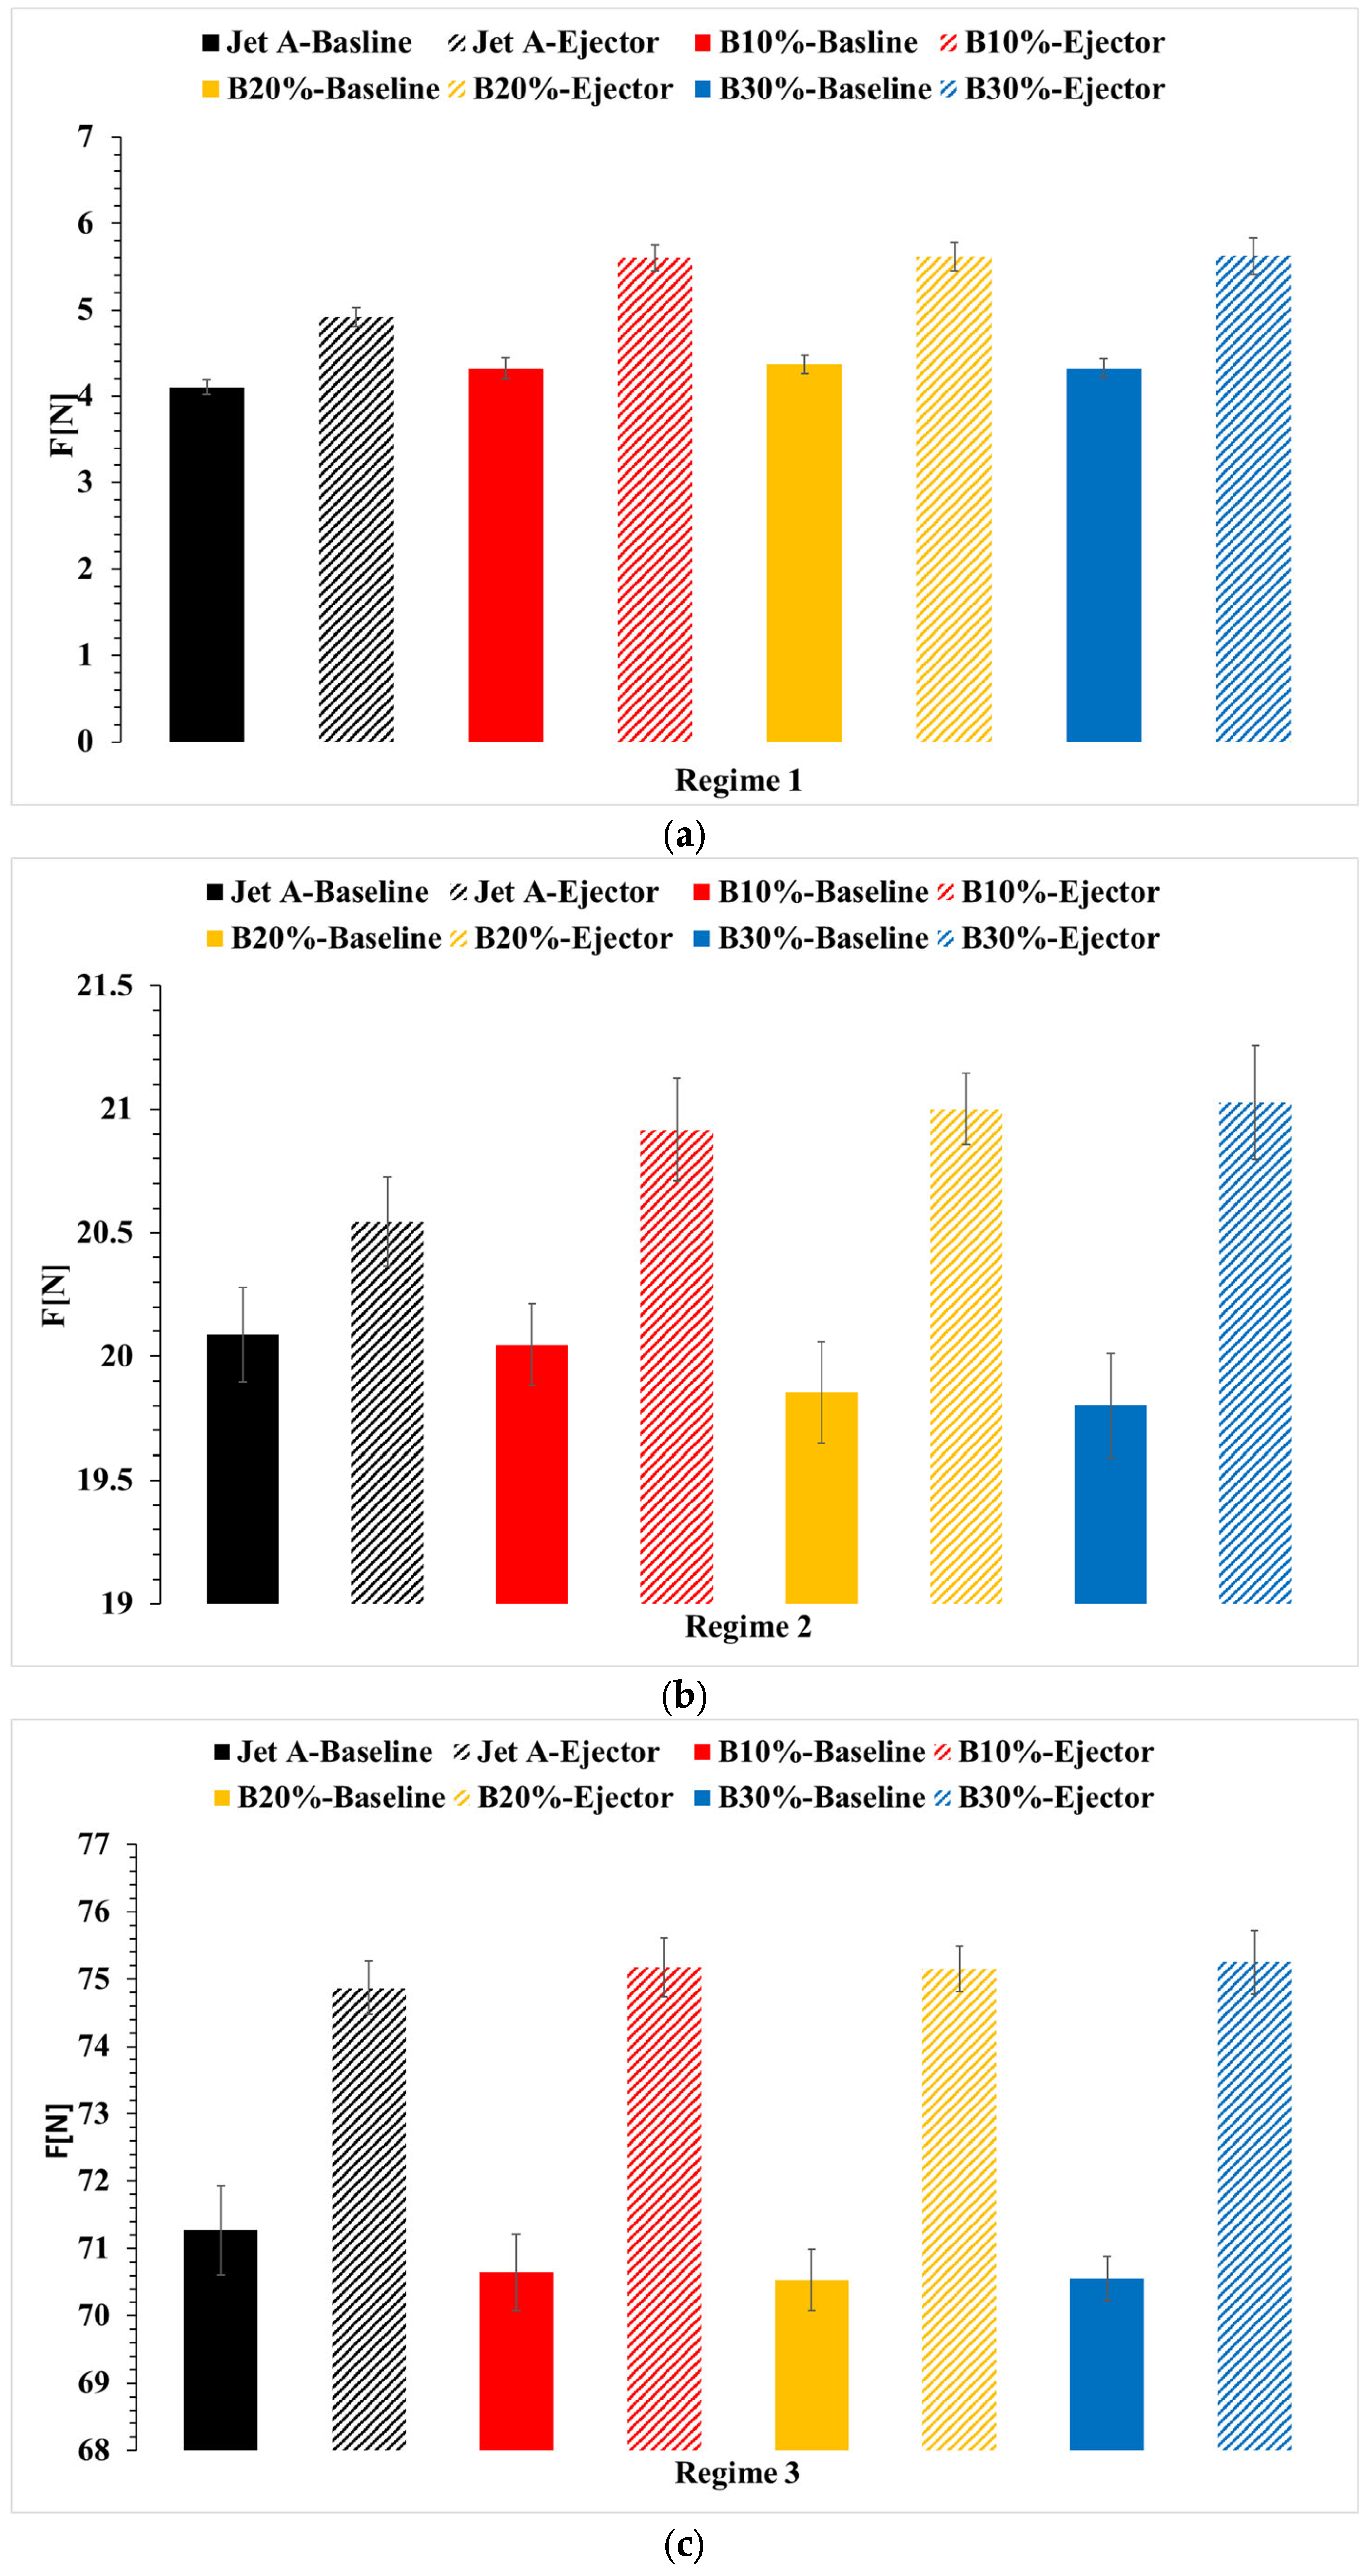
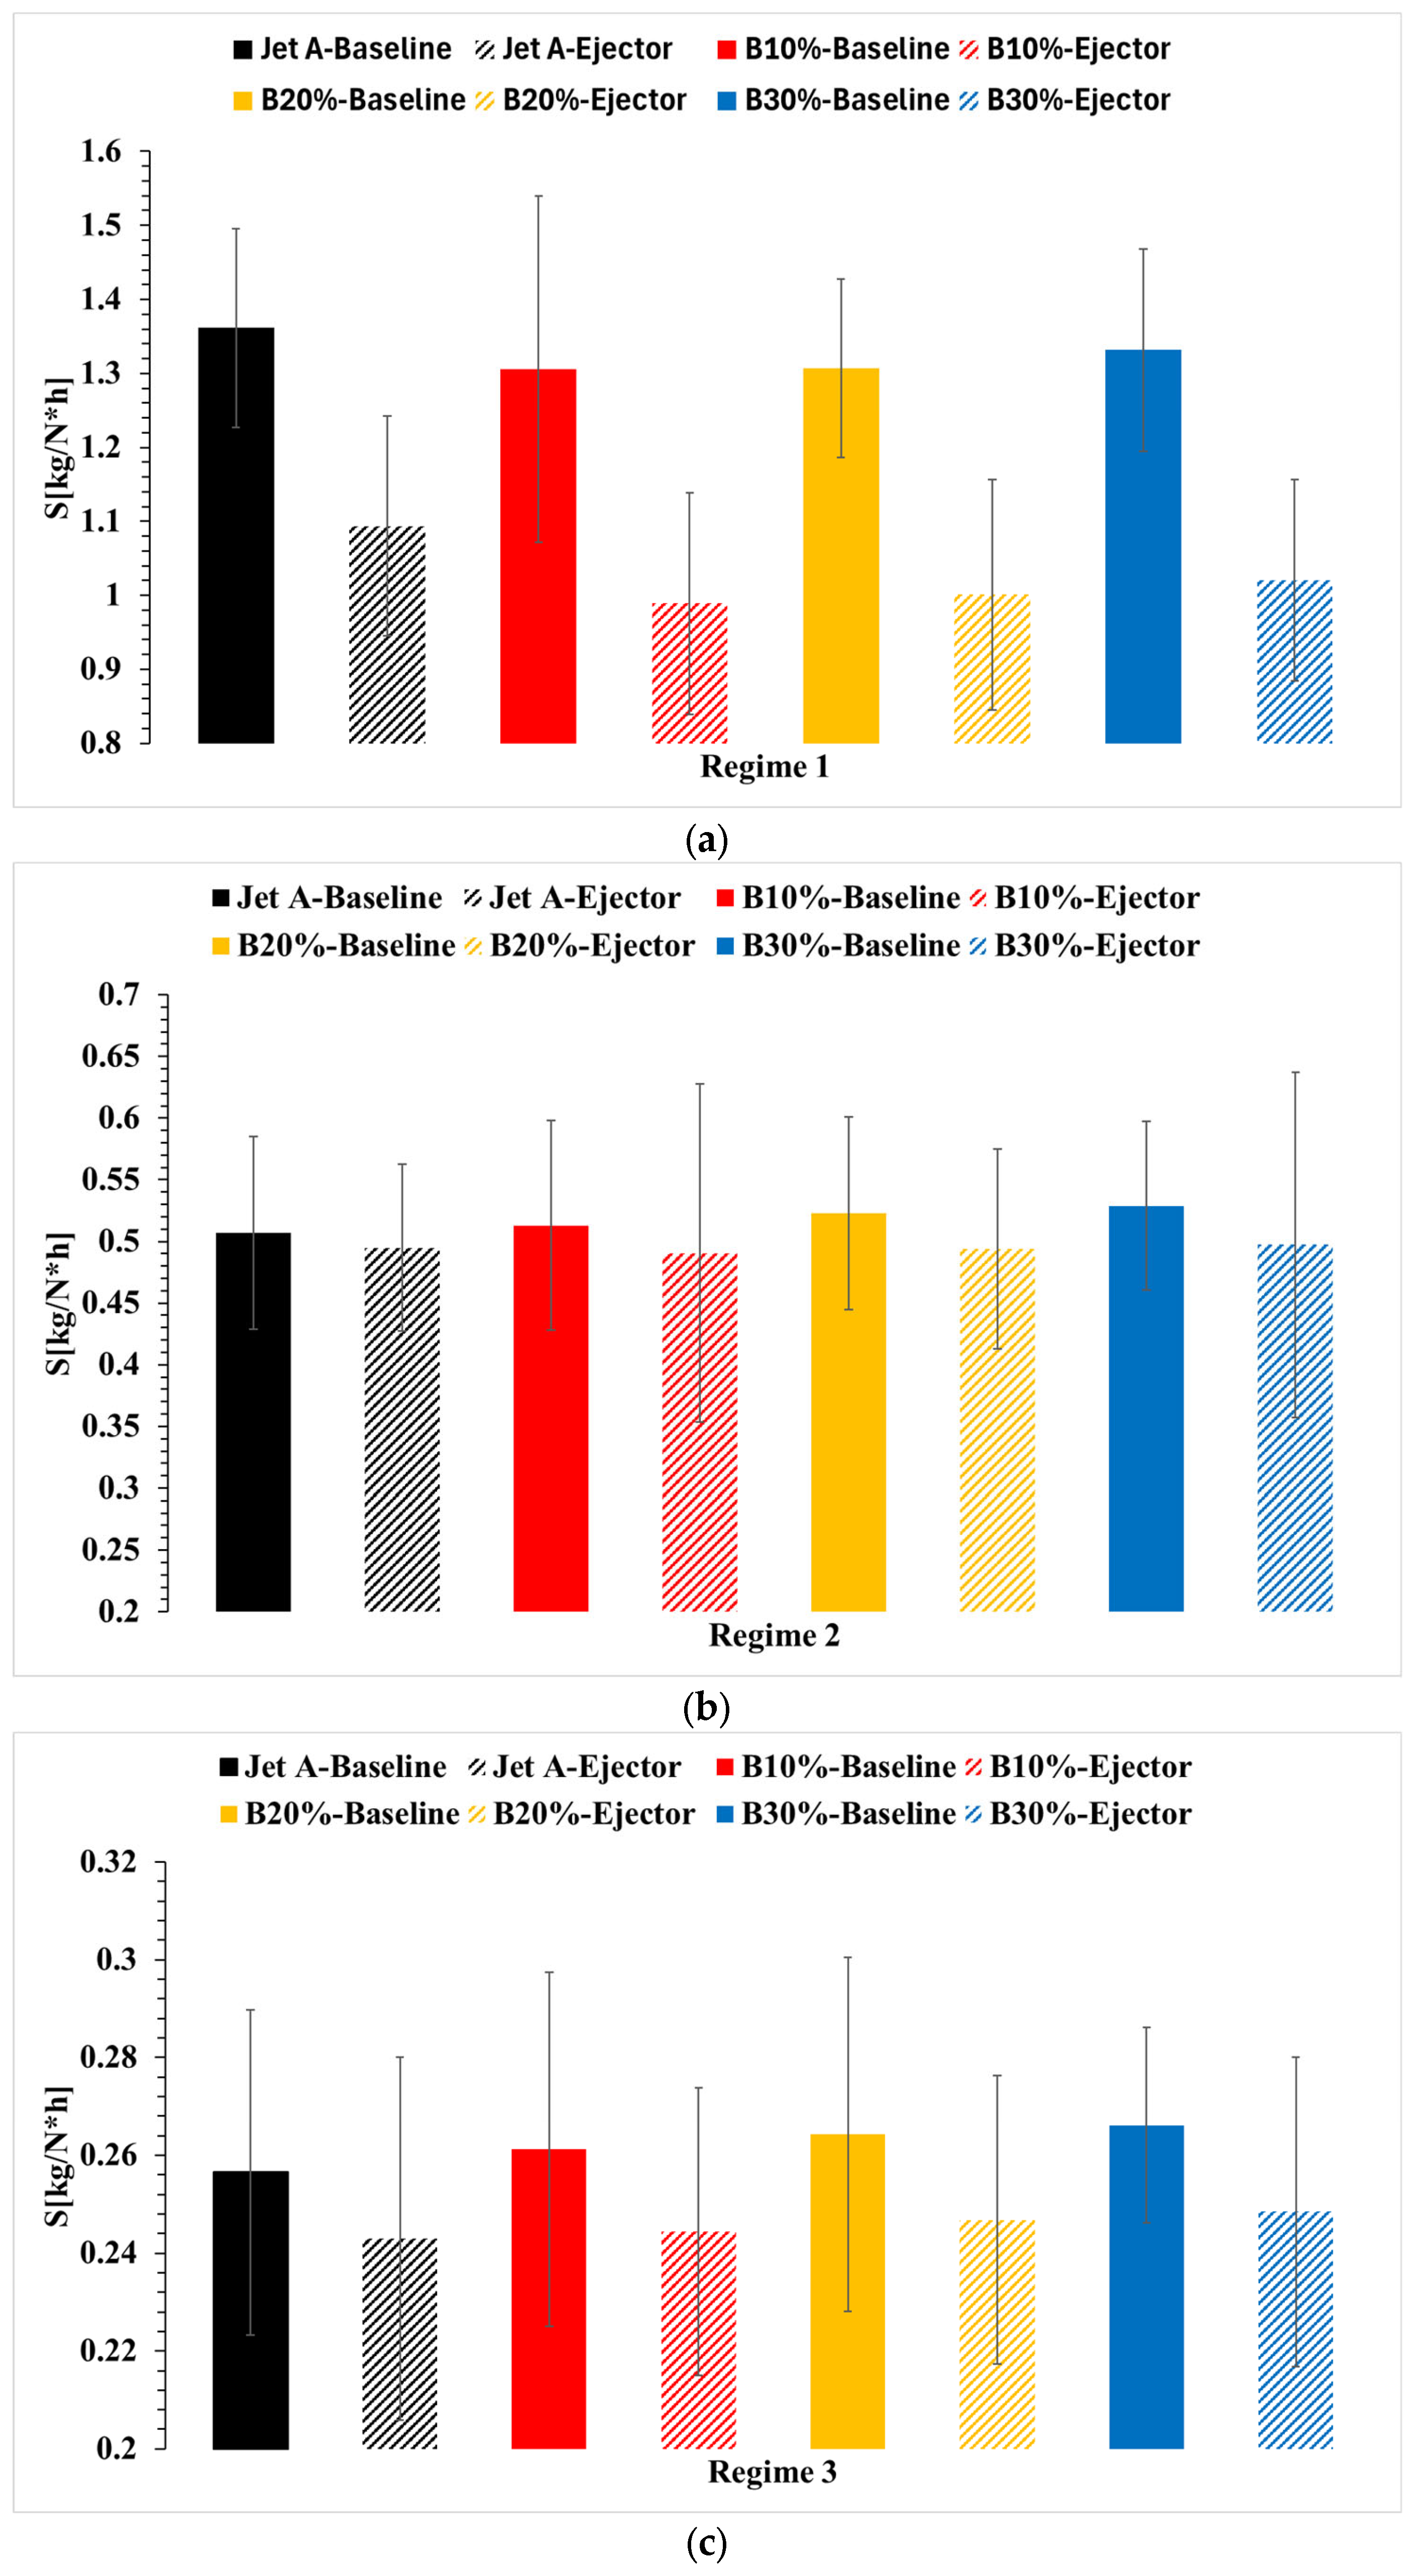
Thus, in Figure 5, the variation in the combustion gas temperature before the turbine is shown, with and without the ejector for the four fuels used. In Figure 6, the variation in fuel flow rate (mass flow) is presented. Although the microturbojet engine instrumentation records the flow rate in liters per hour, it was converted into kilograms per second since the density of the blends was measured. Figure 7 shows the variation in thrust, while Figure 8 illustrates the variation in specific fuel consumption.
The specific fuel consumption was calculated using the Formula (1):
S = 3600 F f F k g N h
where Ff is the fuel flow rate expressed in kg/s, and F is the thrust force recorded by the test stand instrumentation.
By using the ejector, the operation of the microturbine engine is altered because the ejector creates a backpressure behind the turbine, which shifts the operating line of the microturbine. As a result, all parameters defining its operation will change when the ejector is present.
To provide a more detailed view of the figures above, Table 4 below presents the percentage variations compared to the baseline case, when Jet A is used without the ejector.
Analyzing Figure 5, at first glance, it can be observed that when Jet A fuel is used along with the ejector, there is a noticeable decrease in the combustion gas temperature in front of the turbine.
  • Temperature Analysis in Front of the Turbine
As is known, Regime 1 is the idle regime and represents a less stable regime compared to the higher regimes. A slight increase in the combustion temperature can be observed as the biodiesel concentration increases. This increase is small, under two degrees Celsius, translating to a 0.05% increase when the biodiesel concentration is 10%, a 0.08% increase when the concentration is 20%, and a 0.21% increase when the concentration is 30%.
When the ejector is used for the same fuels, a significant relative decrease in combustion temperature is observed. Thus, when the ejector is used with Jet A, a decrease of approximately 0.65% is observed. When the ejector is used with 10% biodiesel, the decrease in combustion temperature is 0.56%, with 20% biodiesel, the decrease is 0.46%, and with 30% biodiesel, the temperature in front of the turbine decreases by 0.2%.
Regarding Regime 2, the intermediate regime, it can be observed that when biodiesel is used, a slight decrease in temperature in front of the turbine is noted. Thus, when 10% biodiesel is used, the decrease is 0.16%, when 20% biodiesel is used, the decrease is 0.36% and when 30% biodiesel is used, the decrease is 0.47%. In the case of adding the ejector, a decrease in temperature in front of the turbine is noted. Specifically, when 10% biodiesel and the ejector are used, the temperature drops by 1.07%, when 20% biodiesel and the ejector are used, the decrease is 1.19%, and when 30% biodiesel and the ejector are used, the decrease is 1.44%.
In the case of Regime 3, which is near maximum, it can be observed that when biodiesel is used, there is a slight increase in the temperature in front of the turbine. Specifically, when 10% biodiesel is used, the increase is 1.62%, when 20% biodiesel is used, the increase is 3.43%, and when 30% biodiesel is used, the increase is 4.67%. When the ejector is added, a decrease in temperature in front of the turbine is noted. Specifically, when 10% biodiesel and the ejector are used, the decrease is 3.43%, with 20% biodiesel and the ejector, the decrease is 3.09%, and with 30% biodiesel and the ejector, the decrease is 3.36%.
The error bars in Figure 5a–c are generally small, indicating low variability and good reproducibility of the combustion temperature measurements. In Regime 1, slightly larger error bars are observed for the B30% blend, especially with the ejector, suggesting minor combustion instability. In Regime 2, error bar differences are minimal, confirming consistent results. In Regime 3, a slight increase in error bar size is noted for higher biodiesel concentrations (B20% and B30%) with the ejector, possibly due to greater combustion fluctuations at higher loads. Overall, the small error bars support the reliability of the results, showing that the observed trends are mainly due to fuel and ejector effects rather than experimental uncertainty.
It can be concluded that the variation in the temperature in front of the turbine does not present significant changes that would endanger the integrity of the microturbine engine.
  • Fuel Flow Analysis
Regarding the fuel flow, based on Figure 6 and Table 3, it can be observed that when biodiesel is used, the fuel consumption (expressed in kg/s) increases, and it increases with the rising concentration of biodiesel. When the ejector is used, the fuel consumption decreases compared to the base case, and when biodiesel blends are used with the ejector, there is an increase in fuel flow, but it is lower than when biodiesel is used without the ejector.
In Regime 1, it can be observed that when Jet A and the ejector are used, fuel consumption decreases by 3.82% compared to the case without the ejector. When 10% biodiesel is used, fuel consumption increases by 1%, with 20% biodiesel, the increase is 2.15%, and with 30% biodiesel, the increase is 3.05%. When the ejector is used with 10% biodiesel, fuel consumption decreases by 0.94% compared to the reference case. When the ejector is used with 20% biodiesel, the increase in fuel consumption is 0.49%, which is smaller than in the case without the ejector. When 30% biodiesel and the ejector are used, the increase in fuel flow is 2.59%, which is also smaller than when the ejector is not used. Thus, it can be concluded that the use of biodiesel blends increases fuel consumption, but the addition of the ejector makes this increase smaller.
In Regime 2, it can be observed that when Jet A and the ejector are used, fuel consumption decreases by 0.14% compared to the case without the ejector. When 10% biodiesel is used, fuel consumption increases by 0.98%, with 20% biodiesel, the increase is 1.98%, and with 30% biodiesel, the increase is 2.87%. When the ejector is used with 10% biodiesel, fuel consumption increases by 0.8% compared to the reference case. When the ejector is used with 20% biodiesel, the increase in fuel consumption is 1.89%, which is smaller than when the ejector was not used. When 30% biodiesel and the ejector are used, the increase in fuel flow is 2.69%, which is smaller than when the ejector is not used. Again, the use of biodiesel blends increases fuel consumption, but the addition of the ejector makes this increase smaller.
In Regime 3, it can be observed that when Jet A and the ejector are used, fuel consumption decreases by 0.49% compared to the case without the ejector. When 10% biodiesel is used, fuel consumption increases by 0.95%, with 20% biodiesel, the increase is 1.96%, and with 30%, biodiesel the increase is 2.71%. When the ejector is used with 10% biodiesel, fuel consumption increases by 0.5% compared to the reference case. When the ejector is used with 20% biodiesel, the increase in fuel consumption is 1.45%, which is smaller than when the ejector was not used. When 30% biodiesel and the ejector are used, the increase in fuel flow is 2.26%, which is smaller than when the ejector is not used. Once again, it is observed that the use of biodiesel blends increases fuel consumption, but the addition of the ejector makes this increase smaller.
The error bars in Figure 6a–c are generally small across all operating regimes, indicating high measurement precision and stable fuel flow readings. In Regime 1, the B30% blend shows slightly larger variability, particularly with the ejector, which may be linked to minor fluctuations in fuel atomization at low loads. In Regime 2, error bars are consistently minimal for all fuel blends, confirming stable operation and good repeatability. In Regime 3, a modest increase in error bar size is observed for higher biodiesel concentrations, likely due to variations in viscosity and density affecting flow rate. Overall, the limited size of the error bars suggests that the recorded differences are primarily caused by fuel properties and ejector influence rather than measurement uncertainty.
Thus, in all regimes analyzed, the use of biodiesel blends increases fuel consumption, but the presence of the ejector reduces the rate of increase in fuel consumption compared to when biodiesel is used alone without the ejector.
  • Propulsive Force Analysis
Regarding the propulsive force, based on Figure 7 and Table 3, it can be observed that when biodiesel is used, in the case without an ejector, the propulsive force increases and it increases with the rising biodiesel concentration, particularly in the idle regime, which, as mentioned earlier, is a more unstable regime. For the other two regimes, when biodiesel blends are used, the propulsive force decreases. When the ejector is used, the propulsive force increases compared to the base case, and when the ejector and biodiesel blends are used, there is an increase in the propulsive force, even slightly higher than when biodiesel is used without the ejector and even compared to the base case.
Thus, in Regime 1, it can be observed that when Jet A and the ejector are used, the propulsive force increases by 19.74% compared to the case without the ejector. When 10% biodiesel is used, the increase in propulsive force is 5.31%, when 20% biodiesel is used, the increase is 6.41%, and when 30% biodiesel is used, the increase in propulsive force is 5.33%. When the ejector is used with 10% biodiesel, the propulsive force increases by 36.39% compared to the reference case. When the ejector is used with 20% biodiesel, the increase in propulsive force is 36.7%, which is higher than when the ejector is not used, and when 30% biodiesel and the ejector are used, the increase in propulsive force is 36.91%, which is higher than when the ejector is not used. It can thus be concluded that the use of biodiesel blends increases the propulsive force, and the addition of the ejector makes this increase even greater. One explanation could be that biodiesel blends have a higher density compared to Jet A, which increases the propulsive force.
In Regime 2, it can be observed that when Jet A and the ejector are used, the propulsive force increases by 2.28% compared to the case without the ejector. When 10% biodiesel is used, a slight decrease in propulsive force of 0.2% is observed. When 20% biodiesel is used, the decrease in propulsive force is −1.16%, and when 30% biodiesel is used, the decrease in propulsive force is −1.42%. When the ejector is used with 10% biodiesel, the propulsive force increases by 4.13% compared to the reference case. When the ejector is used with 20% biodiesel, the increase in propulsive force is 4.55%, which is higher than when the ejector was not used and when 30% biodiesel and the ejector are used, the increase in propulsive force is 4.68%, which is higher than when the ejector is not used. Thus, it can be concluded that the use of biodiesel blends decreases the propulsive force, but the addition of the ejector results in an increase and it is even higher than the base case. One explanation could be that biodiesel blends have a higher density compared to Jet A, which increases the propulsive force.
In Regime 3, it can be observed that when Jet A and the ejector are used, the propulsive force increases by 5.05% compared to the case without the ejector. When 10% biodiesel is used, a slight decrease in propulsive force of 0.87% is observed. When 20% biodiesel is used, the decrease in propulsive force is −1.04% and when 30% biodiesel is used, the decrease in propulsive force is −0.99%. When the ejector is used with 10% biodiesel, the propulsive force increases by 5.48% compared to the reference case. When the ejector is used with 20% biodiesel, the increase in propulsive force is 5.45%, which is higher than when the ejector was not used and when 30% biodiesel and the ejector are used, the increase in propulsive force is 5.58%, which is higher than when the ejector is not used. It can be concluded that the use of biodiesel blends decreases the propulsive force, but the addition of the ejector results in an increase and it is even higher than the base case. One explanation could be that biodiesel blends have a higher density compared to Jet A, which increases the propulsive force.
The error bars in Figure 7 are consistently small, reflecting high measurement accuracy and repeatability in thrust data across all regimes. In Regime 1, slightly larger variability is observed for the B30% blend with the ejector, possibly due to minor instability in combustion at lower loads. In Regime 2, error bars remain minimal for all cases, indicating stable engine performance. In Regime 3, a slight increase in error bar size for higher biodiesel concentrations may be linked to variations in combustion temperature and exhaust flow dynamics. Overall, the small magnitude of the error bars confirms that observed thrust differences are primarily attributed to fuel properties and ejector effects rather than measurement uncertainty.
It can be concluded that the use of the ejector is a solution to increase the propulsive force, regardless of the biodiesel blends used.
Further analysis remains to be conducted on specific fuel consumption, which is a parameter that combines both of the quantities analyzed above: fuel consumption and force. From the analysis above, it is clear that fuel consumption increases, but at the same time, there is also an increase in propulsive force. Specific fuel consumption quantifies both of these key parameters.
  • Specific Fuel Consumption Analysis
Regarding specific fuel consumption, based on Figure 8 and Table 3, it can be observed that when biodiesel is used, in the case without an ejector, specific fuel consumption decreases. However, the decrease becomes smaller as the biodiesel concentration increases, particularly in the idle regime, which, as mentioned earlier, is a more unstable regime. For the other two regimes, when biodiesel blends are used, specific fuel consumption increases. When the ejector is used, specific fuel consumption decreases compared to the base case. Additionally, when the ejector and biodiesel blends are used, there is also a decrease in specific fuel consumption, but the decrease diminishes as the biodiesel concentration increases.
In Regime 1, it can be observed that when Jet A and the ejector are used, specific fuel consumption decreases by 19.67% compared to the case without the ejector. When 10% biodiesel is used, the decrease in specific fuel consumption is 4.09%. When 20% biodiesel is used, the decrease is 4.01% and when 30% biodiesel is used, the decrease in specific fuel consumption is 2.17%. When the ejector is used with 10% biodiesel, specific fuel consumption decreases by 27.37% compared to the reference case. When the ejector is used with 20% biodiesel, the decrease in specific fuel consumption is 26.49%, which is higher than when the ejector was not used. When 30% biodiesel and the ejector are used, the decrease in specific fuel consumption is 25.07%, which is also higher than when the ejector was not used.
In Regime 2, it can be observed that when Jet A and the ejector are used, specific fuel consumption decreases by 2.37% compared to the case without the ejector. When 10% biodiesel is used, specific fuel consumption increases by 1.18%. When 20% biodiesel is used, specific fuel consumption increases by 3.18%, and when 30% biodiesel is used, specific fuel consumption increases by 4.36%. When the ejector is used with 10% biodiesel, specific fuel consumption decreases by 3.2% compared to the reference case. When the ejector is used with 20% biodiesel, the decrease in specific fuel consumption is 2.54%, and when 30% biodiesel and the ejector are used, the decrease in specific fuel consumption is 1.9%.
In Regime 3, it can be observed that when Jet A and the ejector are used, specific fuel consumption decreases by 5.27% compared to the case without the ejector. When 10% biodiesel is used, specific fuel consumption increases by 1.84%. When 20% biodiesel is used, specific fuel consumption increases by 3.03%, and when 30% biodiesel is used, specific fuel consumption increases by 3.74%. When the ejector is used with 10% biodiesel, specific fuel consumption decreases by 4.72% compared to the reference case. When the ejector is used with 20% biodiesel, the decrease in specific fuel consumption is 3.78%, and when 30% biodiesel and the ejector are used, the decrease in specific fuel consumption is 3.15%.
The error bars in Figure 8 are generally small, indicating reliable and consistent measurements of specific fuel consumption (SFC) across all operating regimes. The error was calculated based on error propagation according to the specific fuel consumption formula, ensuring that uncertainties from fuel flow rate and thrust measurements were accurately reflected. In Regime 1, slightly larger error margins appear for higher biodiesel concentrations, particularly B30% with the ejector, which may be due to small fluctuations in fuel flow at low loads. In Regime 2, error bars are minimal, confirming stable operating conditions and consistent fuel consumption measurements. In Regime 3, a modest increase in variability is seen for biodiesel blends without the ejector, likely related to minor combustion instabilities at higher loads. Overall, the low magnitude of error bars suggests that the reported SFC differences reflect genuine performance trends rather than experimental uncertainty.
Thus, it can be concluded that the use of biodiesel blends contributes to an increase in specific fuel consumption, while the addition of the ejector results in a decrease. Therefore, specific fuel consumption is lower when biodiesel blends and the ejector are used compared to the base case with Jet A. As the biodiesel concentration increases, the decrease in specific fuel consumption becomes smaller than when Jet A is used with an ejector.

3.3. Emissions of the Microturbojet Engine

Regarding emissions, the concentrations of CO and SO2 were analyzed for the regimes and configurations mentioned above.
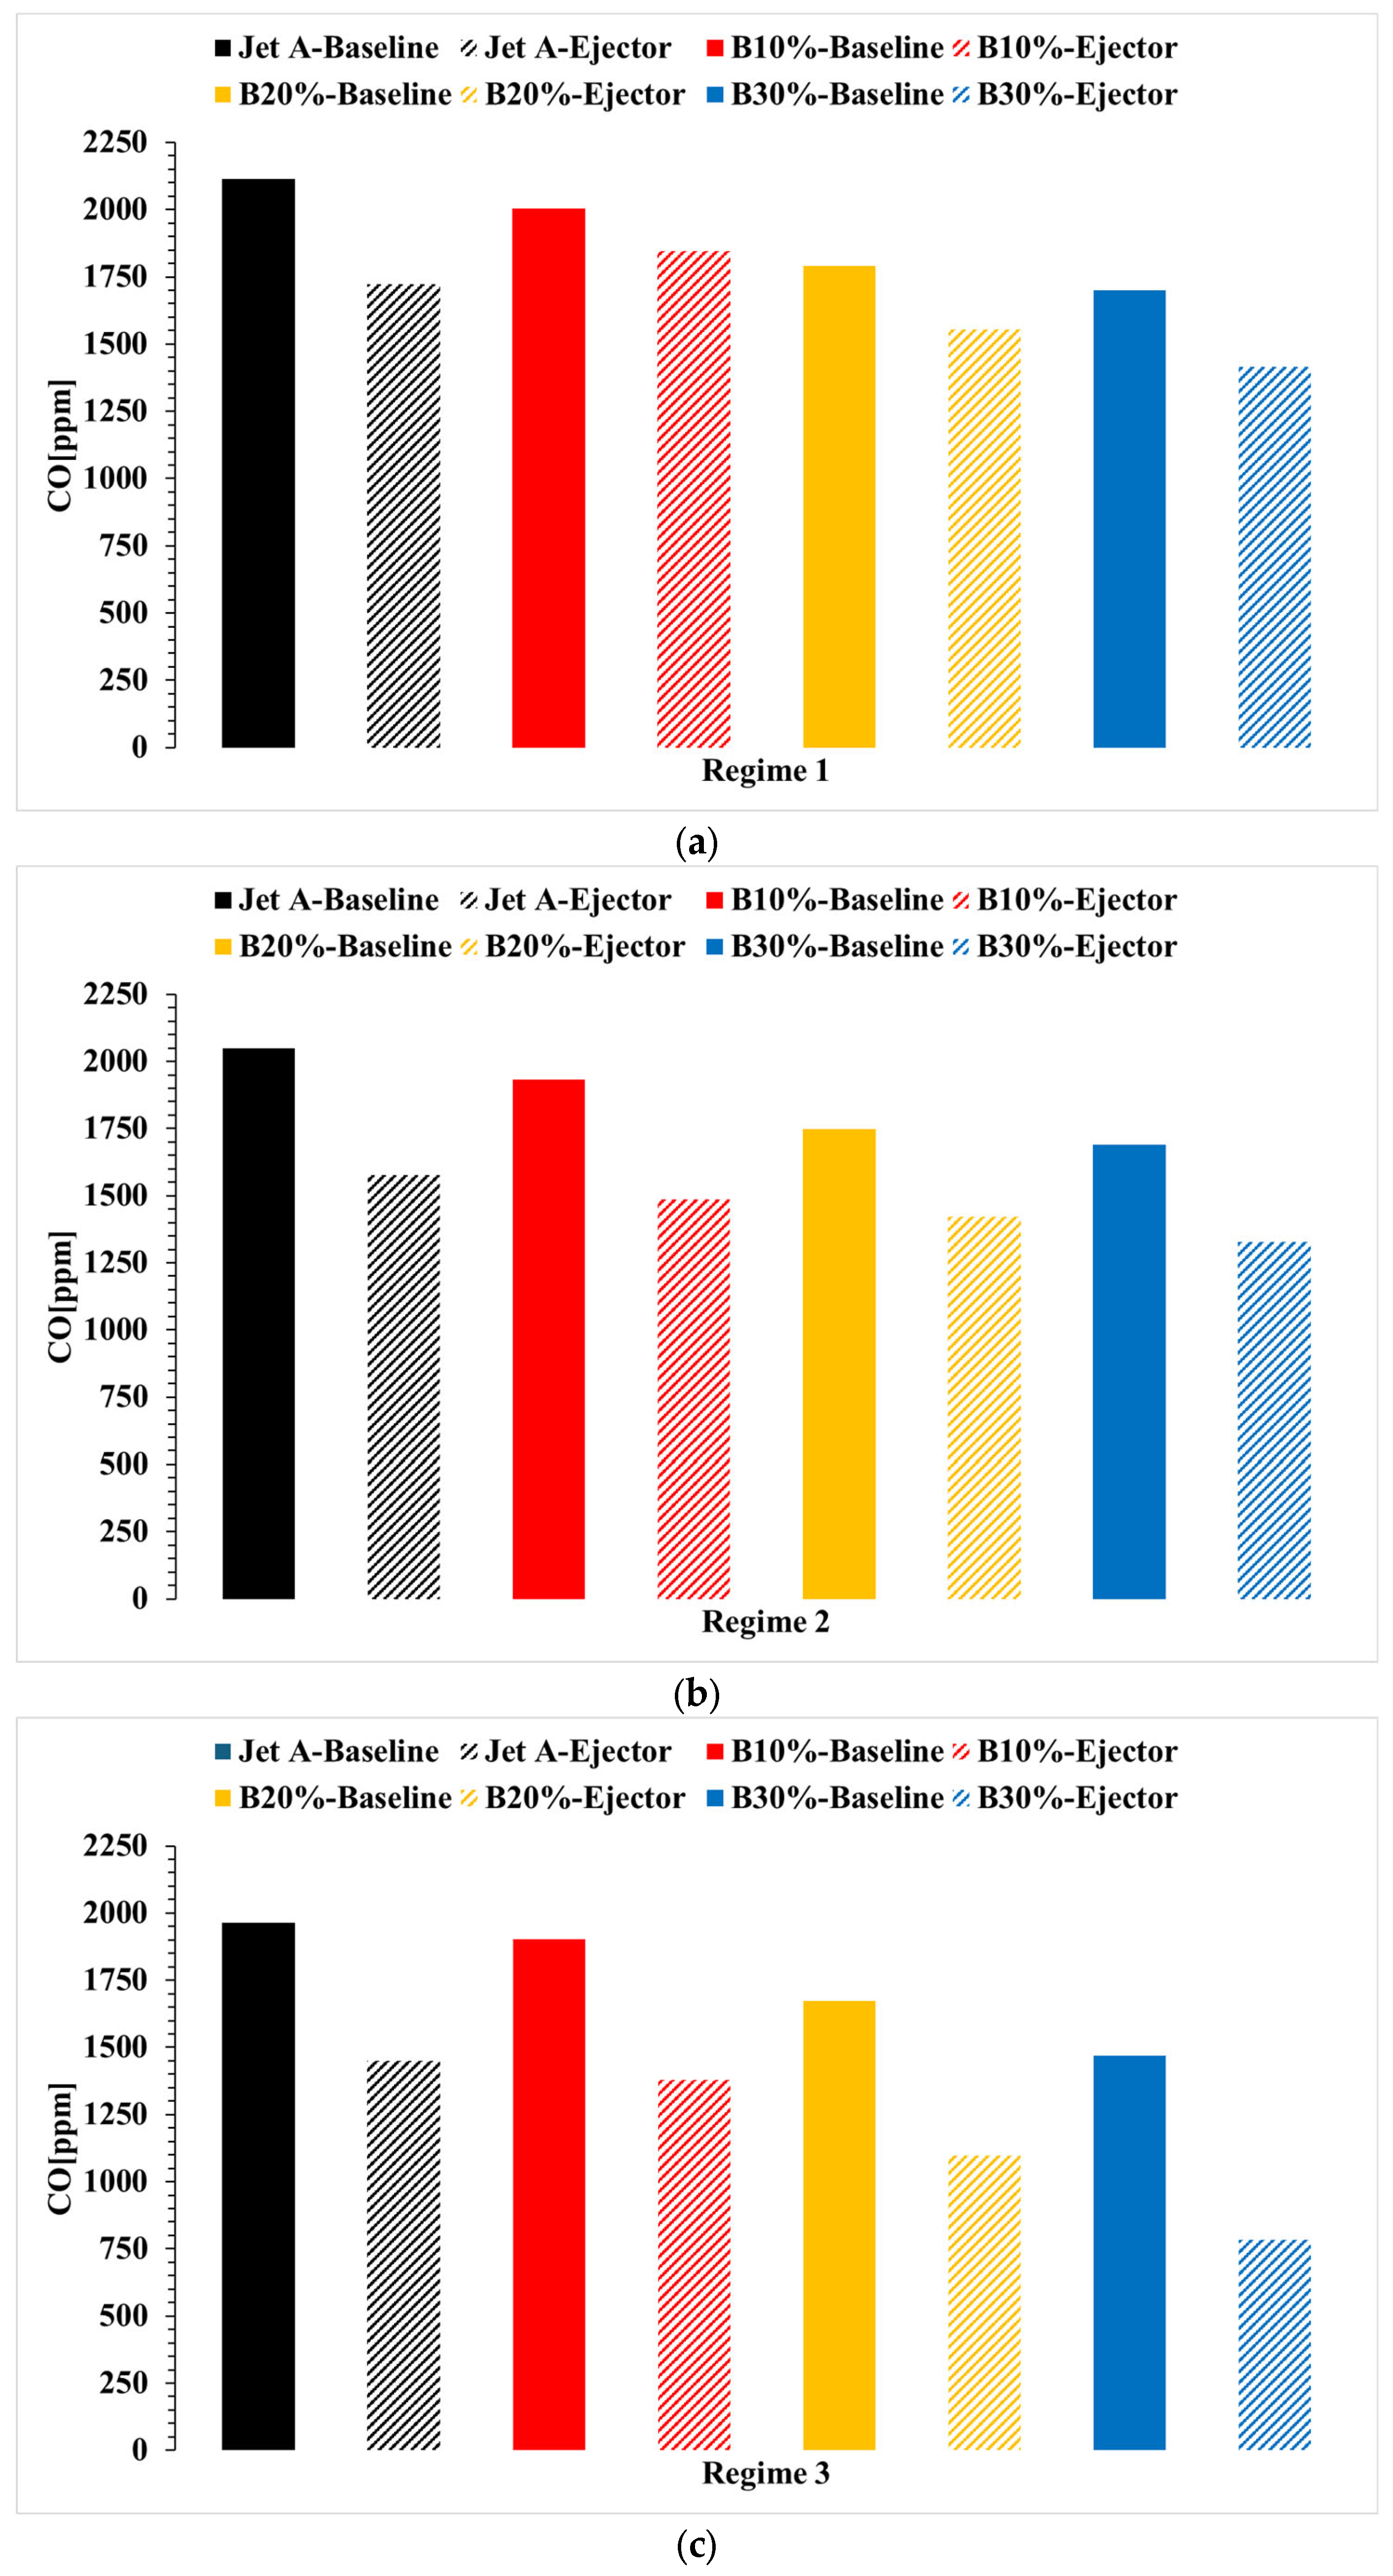
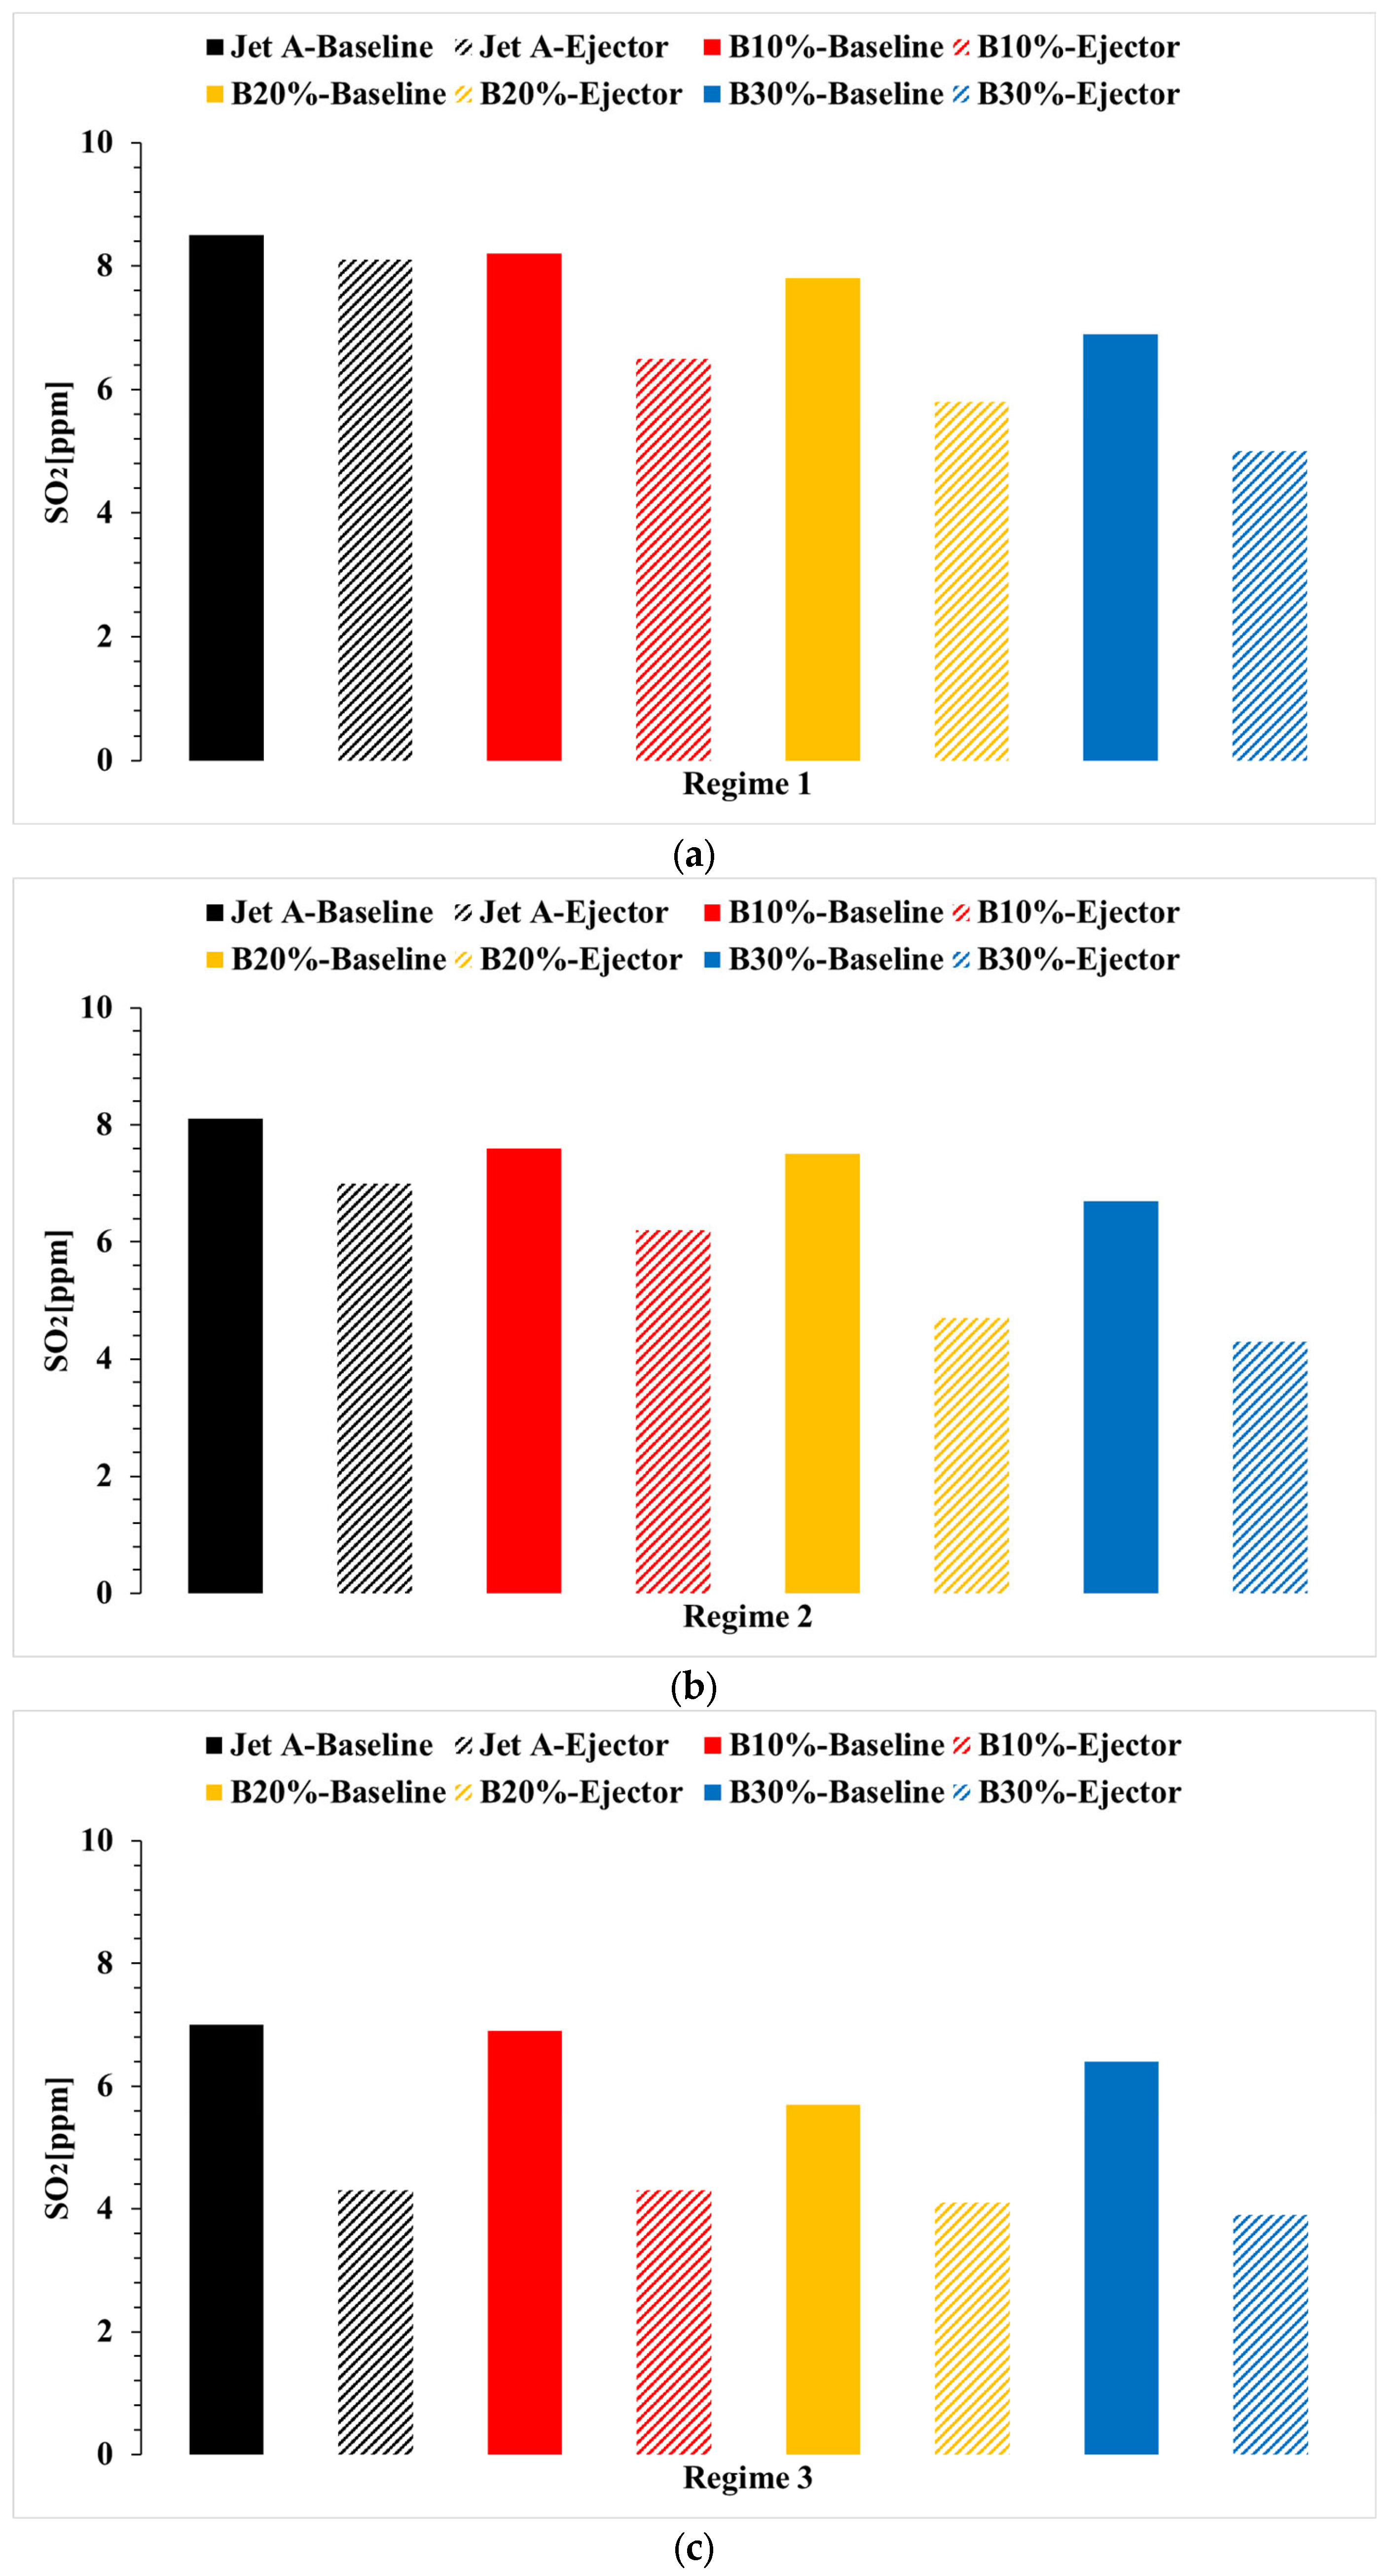
Figure 9 presents the variation in CO concentration, and Figure 10 presents the variation in SO2 for the three regimes studied.
It can be observed from Figure 9 that across all three regimes, the CO concentration decreases with the increase in the biodiesel blend concentration. Furthermore, the addition of the ejector, which increases the amount of air in the exhaust jet, results in even lower concentrations. Therefore, the use of biofuels in combination with the ejector contributes to a reduction in CO concentrations.
As expected, it can be observed that the SO2 concentration (Figure 10) decreases with the increase in the biodiesel blend concentration, as biofuels are known to contain no sulfur in their composition. It is evident that across all three regimes, the SO2 concentration decreases as the biodiesel concentration increases, with a more significant reduction when the ejector is used due to the increased airflow.
Consequently, the use of biofuel blends in combination with the ejector is a solution that not only reduces specific fuel consumption but also lowers the concentrations of CO and SO2.

3.4. Acustic Performance

The acoustic characterization of microturbine engines is essential for understanding the impact of fuel variations on noise emissions, particularly when integrating alternative fuels such as biodiesel blends. Biodiesel mixtures exhibit different combustion characteristics compared to conventional Jet A fuel, which can influence ignition dynamics, heat release profiles, and exhaust flow properties, ultimately affecting noise generation.
The testing stand is designed to evaluate the acoustic response of a microturbine engine operating on biodiesel mixture fuels. This setup enables a comprehensive assessment of noise emissions, considering variations in fuel properties, combustion characteristics, and exhaust flow dynamics.
A polar microphone arrangement is implemented to capture sound waves from multiple directions, facilitating the study of noise directivity and its dependence on biodiesel blends.
The test engine is mounted on a rigid platform to ensure stability during operation and minimize external vibrations that may interfere with acoustic measurements. A fuel delivery system capable of supplying different biodiesel mixture ratios is incorporated to allow controlled testing of various blends. Five microphones are arranged in a circular (polar) configuration in a quarter of a circle around the engine to record sound propagation from all directions. A polar microphone array is employed to capture noise emissions symmetrically around the microturbine engine, ensuring spatially distributed sound measurements. The microphones are positioned equidistantly around the engine at equal angular intervals. A high-precision recording system with preamplifiers, analog-to-digital converters, and data storage ensures accurate noise measurement. The engine exhaust system includes mechanical modifications for ejector integration to assess its impact on noise attenuation. A control interface allows the operator to adjust engine parameters such as fuel blend ratio, throttle position, and exhaust configurations while monitoring performance metrics.
The microturbine engine is running using different biodiesel mixture ratios (e.g., %.) to assess the impact of fuel properties on noise emissions. Operating conditions such as engine speed, load, and throttle settings are systematically varied to observe acoustic variations under different power outputs.
The DEWEsoft Sirius multichannel system (24-bit ADC resolution, high dynamic range > 160 dB, up to 200 kS/s sampling rate per channel, ultra-low noise and distortion) was used, which integrates high-speed analog-to-digital conversion with a 50 ks/s sampling rate, real-time signal processing, and advanced spectral analysis techniques, allowing for precise noise characterization across different biodiesel mixtures and ejector configurations. The Dewesoft 2024.3 SPL (Sound Pressure Level) software was used for signal post-processing. This software is designed to measure, analyze, and visualize sound pressure levels in accordance with international standards (IEC 61672 Calss 1, IEC 60651/60804 and ANSI S1.4). For this study, we used a 5 G.R.A.S. 46AE free-field microphone designed for precise acoustic measurements in applications where the primary sound source is known, allowing direct incidence positioning. The 46AE meets the IEC 61094 WS2F and IEC 61672 Class 1 standards, ensuring high accuracy and reliability in professional measurement environments.
The microphones simultaneously record noise emissions at each polar location. Sound pressure levels and frequency spectra are measured to determine changes in noise intensity and tonal characteristics. Time-domain signals are analyzed to identify transient noise phenomena such as combustion instability.
Using the polar microphone data, noise directivity maps are generated to visualize how biodiesel combustion influences the spatial distribution of sound, compared with the acoustic response produced by the Jet A fuel and using the nozzle as a reference.
Results from different fuel mixtures are compared to determine whether biodiesel leads to reductions or amplifications in noise emissions relative to conventional Jet A fuel.
A reference acoustic source is used to calibrate each microphone before testing.
Identification of noise variations induced by biodiesel blends was followed, particularly in combustion-related frequencies, and determination of whether biodiesel mixtures contribute to smoother combustion and reduced acoustic emissions was performed. The results are insights into how noise directivity changes with fuel composition, leading in the design of quieter microturbine engines. Assessment was made regarding whether ejector integration further enhances noise reduction when combined with biodiesel fuel usage.
Based on the recordings made with the five microphones, the sound pressure level (SPL) values were recorded, and the SPL values are presented in Table 5.
Based on the analysis in Table 4, it can be observed that the presence of the ejector reduces the overall noise level. For a better understanding of the phenomenon caused primarily by the presence of the ejector, the directivity measured by the five microphones for the three operating regimes and the four fuels used is presented below.
Thus, Figure 11 shows the directivity for Jet A baseline and ejector for the three studied regimes.
In Figure 12, the directivity of the Jet A + 10% biodiesel baseline and ejector is presented for the three studied regimes.
In Figure 13, the directivity of the Jet A + 20% biodiesel baseline and ejector nozzle is presented for the three studied regimes.
In Figure 14, the directivity of the Jet A + 30% biodiesel baseline and ejector is presented for the three studied regimes.
From the polar graphs it is noticeable that the integration of a nozzle ejector in a microturbine engine has significantly influenced the noise emissions by reducing the noise levels for all the microphone positions. This is probably because of modifications to the exhaust flow dynamics, turbulence intensity, and acoustic wave propagation.
A frequency-domain analysis is conducted to assess how fuel blending and nozzle use affect the dominant tonal and overall noise frequencies.
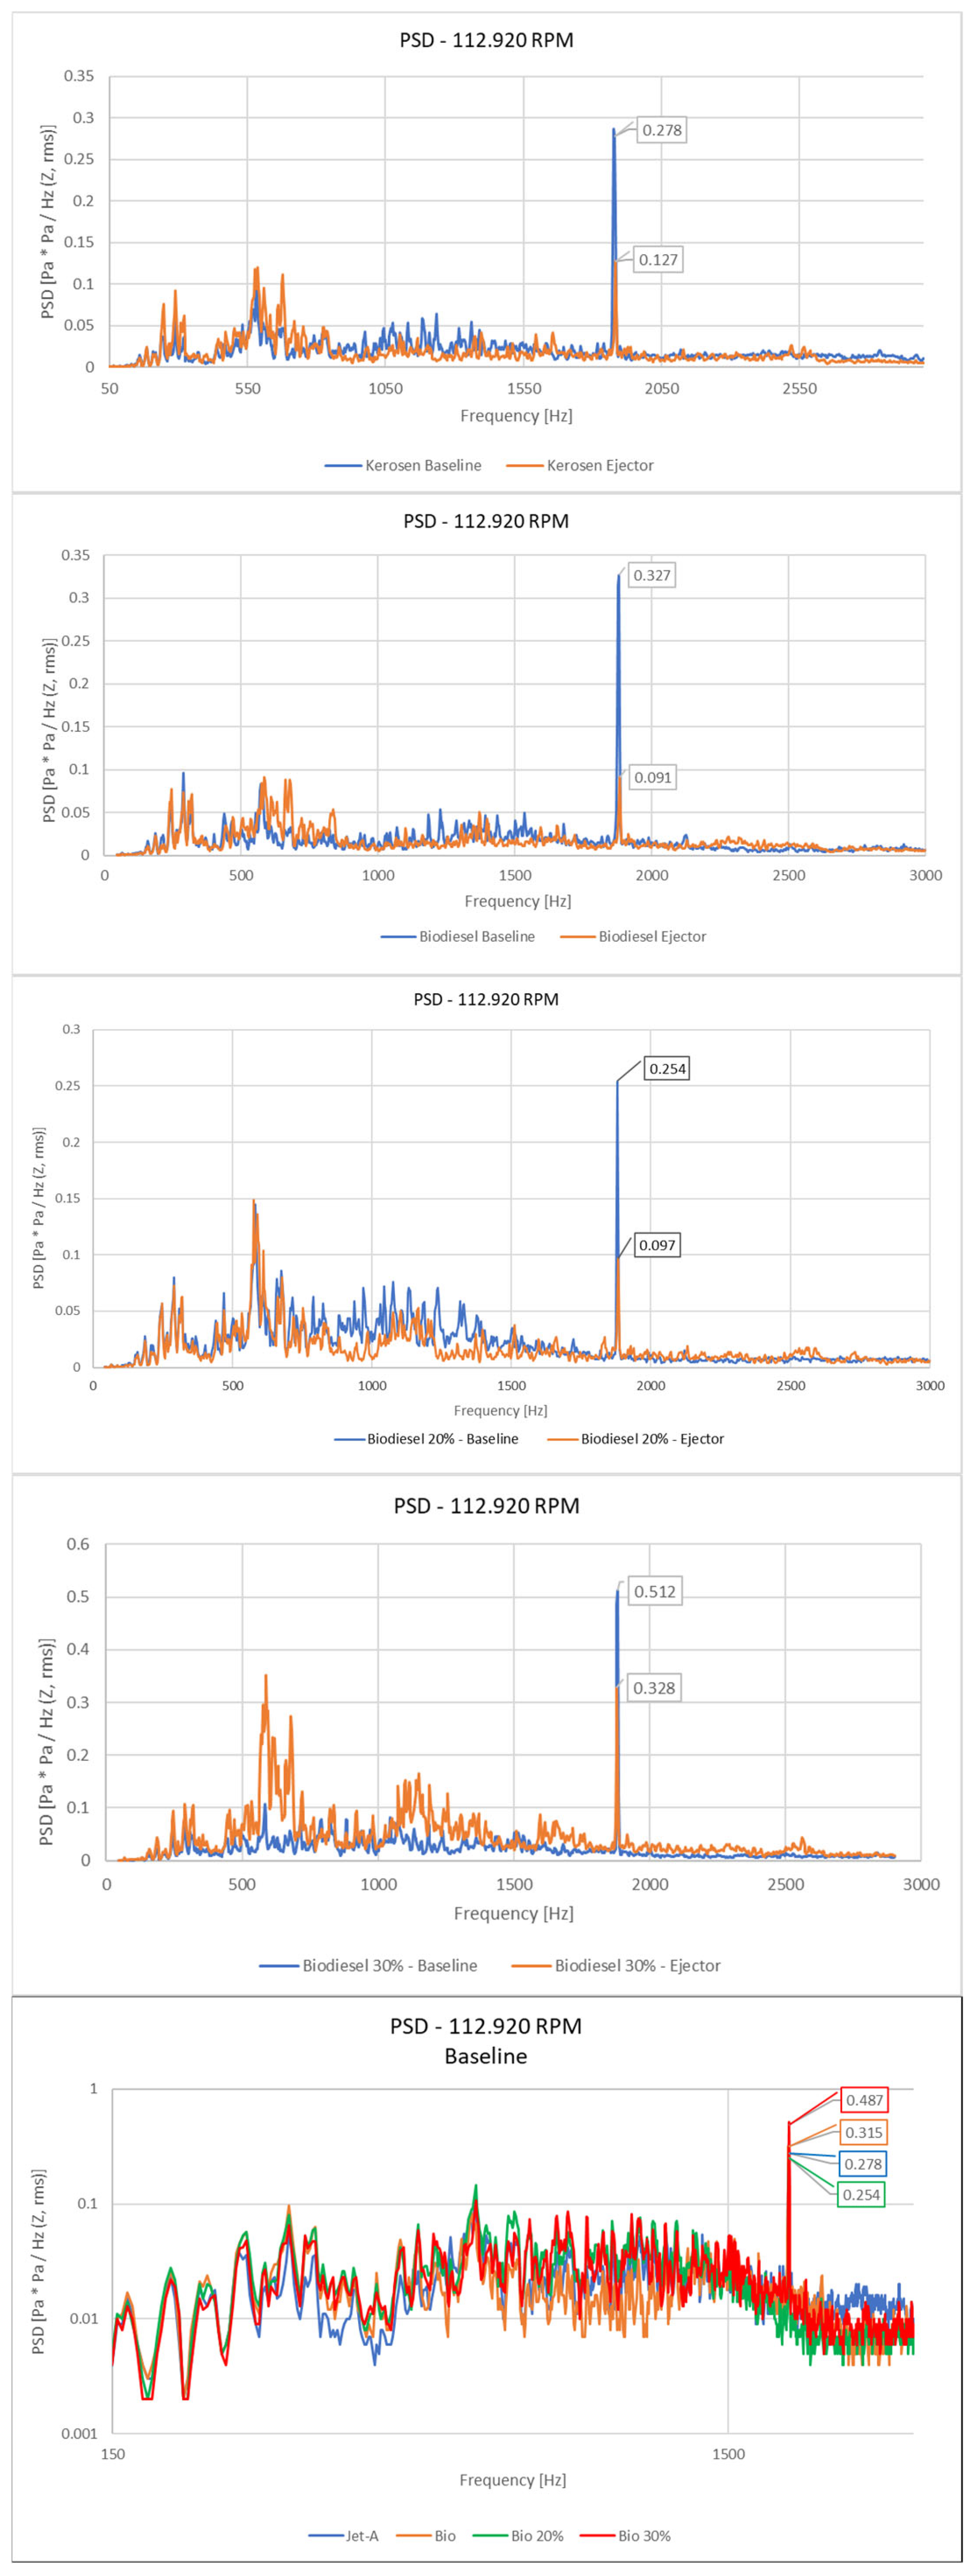
In Figure 15, a lowered level at the tonal rotational frequency (R3-112.920 RPM) can be observed when the nozzle is used for all three biodiesel combinations (biodiesel, biodiesel 20%, and biodiesel 30%). All the following analyses were performed with the R3 regime, considered the noisiest one. For comparing both configurations, baseline or ejector, a linearly weighted PSD (Power Spectral Density) amplitude spectrum was applied by processing the signal with Hanning windowing, an 8192-frequency resolution, and linear overall averaging with 50% overlap.
Figure 15 illustrates that without using the ejector nozzle, the highest noise levels are observed when utilizing a 30% biodiesel blend, while also Jet A fuel, simple biodiesel, and biodiesel 20% show similar spectral signatures.
Figure 16 illustrates that the highest noise levels are observed when utilizing a 30% biodiesel blend in conjunction with the ejector nozzle configuration, while simple biodiesel and biodiesel 20% show similar spectral signatures.
The exact rotational speed was extracted from the acoustic signal to see how the speed control could be affected by using the ejector nozzle. The goal was to examine how the ejector nozzle influences the engine’s speed control by analyzing its acoustic signature. The ejector nozzle can influence the operating conditions of the microturbine, potentially affecting rotational speed stability due to backpressure changes, as it can increase or decrease pressure in the exhaust, influencing turbine load, changes in mass flow rate, and turbulence, which can impact speed regulation and combustion instabilities and may introduce fluctuations in rotational speed. By extracting the rotational speed from the acoustic signal, we can determine whether the ejector nozzle disrupts or stabilizes speed control mechanisms, helping to optimize engine efficiency and noise reduction strategies. Figure 17, Figure 18 and Figure 19 present the speed variation in Regime 1 [rpm] for biodiesel blends of 10%, 20%, and 30%, respectively. In each case, the results are compared between the baseline configuration (a) and the ejector integration (b), highlighting the influence of biodiesel concentration on engine performance.
Using acoustic signal analysis to determine rotational speed offers several advantages over traditional direct sensor-based measurements (such as optical or magnetic encoders). Acoustic analysis can detect additional information related to engine operation, like combustion instabilities, bearing or blade defects, or aerodynamic disturbances (e.g., turbulence in exhaust flow). On the other hand, encoders, despite the precision of speed measurement, can offer data only on rotational speed without insight into other possible mechanical or combustion issues, which might be induced by using the ejector nozzle. For such a research objective, as is in the present article, we considered that having access to both techniques could offer better insight into the phenomenon.
We have observed from the exact frequency tracking that the speed control is kept in the required limits for all configurations and all regimes, a sign that, on average, the control system is adapting, although in the case of biodiesel 30%, small anomalies appeared in the signal, probably from nonlinear instabilities in combustion due to fuel characteristics and not so much from using the ejector nozzle (such instabilities were observed in both configurations, baseline or ejector). A deeper analysis could be performed in the future on this issue, this being an in-depth study requiring a lot of processing power that is beyond the general scope of this article. We have used speed detection using exact frequency tracking from the spectrum only in lower regimes because of the limitation of expensive processing power, which is necessary for such an analysis. While direct sensor measurements (fixed encoders implemented on the testing stand) provide highly accurate speed readings, acoustic analysis offers a broader and cost-effective method for both speed estimation and anomaly detection in microturbine engines.
To have an overview on the entire spectrum for all three regimes and using all combination of fuels (biodiesel, biodiesel 20%, and biodiesel 30%), without and with using of the ejector nozzle, a waterfall spectrum of sound levels is presented in Figure 20, Figure 21 and Figure 22. From these graphs, it can be observed that overall, by using the ejector nozzle, the sound levels are lower than in the configuration operating without one. Also, it can be observed that the spectral distributions of noise levels are similar for biodiesel and biodiesel 20%, but an increase in noise levels appears when using biodiesel 30% with the ejector nozzle in the R3 regime.
This waterfall spectral representation was employed to identify potential short-term or impulsive combustion instabilities that may arise due to the use of the biodiesel combinations or ejector nozzle and could be detected through this analytical approach.
Also, a deeper analysis was used in order to identify such phenomena: Short-Time Fourier Transform (STFT) kurtosis analysis, Figure 23, Figure 24, Figure 25 and Figure 26. STFT-kurtosis analysis is a statistical technique used on acoustics signals, particularly for detecting transient, impulsive, and non-stationary noise characteristics in complex systems such as microturbine engines. This method combines time–frequency analysis, STFT, with statistical evaluation via the fourth-order statistical moment, kurtosis (which is derived from the fourth power of deviations from the mean), to identify abrupt changes in the acoustic signal that might indicate combustion instabilities, turbulence effects, or ejector-induced disturbances.
The blocks of signal used for this statistical analysis were 0.1 s in duration, with kurtosis calculated block-wise, applied on STFT (1024 block size, 8192 FFT size, Hanning window, 50% overlapping), considered sufficient for identifying short transient events. For this analysis, we used the acoustic signal of one microphone. Due to the small distance from the microphone’s position to the ejector, it was considered a near field measurement, without significant influence from the exterior acoustic space or the room reverberation (the space was a closed one, but with an open area in the direction of ejection).
There were no significant instabilities observed on the STFT kurtosis spectrum; on the contrary, it appears there was a more stable response from the configuration with the ejector nozzle, at least in the R1 regime for all configurations, although there is a significant difference between all biodiesel configurations and the Jet A one, which has shown a more stable behavior, with kurtosis values around 3. Significant instabilities were observed for all combinations when passing from one regime to another, where nonlinear phenomena appear. A debatable result was observed with the 30% biodiesel blend and ejector, where the STFT kurtosis indicated more stable behavior compared to the other biodiesel mixtures. This contrasts with the previous analysis, which identified this operating regime as being louder. In this context, the 30% biodiesel blend with an ejector was identified as louder, likely due to the complex interactions between the fuel blend and the ejector nozzle, which may have caused increased turbulence or exhaust flow irregularities, not necessarily leading to higher noise emissions. In the STFT kurtosis analysis, the acoustic signal is evaluated from a statistical perspective, focusing on the impulsive nature of the noise rather than just its level. The lower kurtosis or more stable behavior indicates that the noise associated with this regime might be less impulsive or more evenly distributed over time, even though it was perceived as louder in previous assessments. A lower kurtosis suggests that, although the overall sound may be loud, it could be more uniform and without significant short, sharp spikes of noise. Also, the ejector could be introducing a form of flow stabilization that reduces short-term pressure fluctuations, making the noise less impulsive in the statistical analysis, even though it may still have higher overall intensity. Such stabilization was observed for all fuel combinations (Jet A, biodiesel 10%, biodiesel 20% or biodiesel 30%) when the ejector was used, compared with baseline cases.
In depth research should be performed in the future to analyze the instabilities resulting from biodiesel burning.
4. Conclusions

This study evaluated the performance and environmental impact of using biodiesel blends (10%, 20%, and 30%) in a Jet Cat P80 microturbine engine, both with and without an integrated ejector, under three operating regimes. The key findings are as follows:
  • Increasing the biodiesel concentration led to a moderate rise in fuel consumption and a slight decrease in thrust, especially at higher loads.
  • The use of an ejector significantly improved propulsive performance across all regimes, compensating for thrust losses and reducing specific fuel consumption, particularly at idle.
  • Emissions of CO and SO2 were substantially reduced when biodiesel blends were used, with further improvements observed when the ejector was implemented.
  • The ejector also contributed to a measurable reduction in acoustic noise, enhancing environmental compatibility.
These results highlight the potential of combining biodiesel blends with ejector technology as an effective solution to improve microturbine engine sustainability without compromising performance.
Although the results presented in this study provide valuable insights into the integration of biodiesel blends and ejector-based optimization for aviation microturbine engines, several limitations should be acknowledged. The experimental campaign was conducted on a single engine model, which may limit the generalizability of the findings to other engine configurations. Additionally, the biodiesel concentrations were limited to 10%, 20%, and 30% to avoid significant reductions in combustion performance, which could compromise the representativeness of operational regimes. Future studies may consider the use of alternative sustainable fuels, as well as different ejector configurations, to further enhance engine performance, emissions, and noise reduction. An important research direction is the integration of such an ejector-equipped microturbine engine into a UAV platform, enabling in-flight performance evaluation and validation of the ground-based experimental results. Addressing these aspects will strengthen the conclusions and broaden the applicability of the proposed solution to a wider range of propulsion systems.

Author Contributions

Conceptualization, G.C. and L.-L.C.; methodology, C.L.; software, L.-L.C. and A.B.; formal analysis, D.-E.C.; investigation, A.V.C.; writing—original draft preparation, G.C., L.-L.C., S.O., A.V.C. and D.-E.C.; writing—review and editing, G.C., L.-L.C., S.O., A.V.C. and D.-E.C.; visualization, S.O.; supervision, G.C.; project administration, G.C. and C.L. All authors have read and agreed to the published version of the manuscript.

Funding

This work was supported by a grant from the National Program for Research of the National Association of Technical Universities—GNAC ARUT 2023, grant no. 72/11.10.2023.

Institutional Review Board Statement

Not applicable.

Informed Consent Statement

Not applicable.

Data Availability Statement

Data are contained within the article.

Conflicts of Interest

The authors declare no conflicts of interest.

References

  1. Thepchalerm, T.; Pinsuwan, S. CEO voices on sustainable aviation: An analysis of environmental communication in the airline industry. Green Technol. Sustain. 2025, 3, 100194. [Google Scholar] [CrossRef]
  2. Amhamed, A.I.; Al Assaf, A.H.; Le Page, L.M.; Alrebei, O.F. Alternative sustainable aviation fuel and energy (SAFE)—A Review with selected simulation cases of study. Energy Rep. 2024, 11, 3317–3344. [Google Scholar] [CrossRef]
  3. Available online: https://biomassmagazine.com/articles/virgin-atlantic-to-fuel-transatlantic-flight-with-100-saf-20229 (accessed on 1 March 2025).
  4. Xu, Y.; Zhang, Y.; Deng, X.; Lee, S.-Y.; Wang, K.; Li, L. Bibliometric analysis and literature review on sustainable aviation fuel (SAF): Economic and management perspective. Transp. Policy 2025, 162, 296–312. [Google Scholar] [CrossRef]
  5. Aksoy, H.; Domene, M.G.; Loganathan, P.; Blakey, S.; Zea, E.; Vinuesa, R.; Otero, E. Case study on SAF emissions from air travel considering emissions modeling impact. Transp. Res. Interdiscip. Perspect. 2025, 29, 101341. [Google Scholar] [CrossRef]
  6. Mirea, R.; Cican, G. Lab Scale Investigation of Gaseous Emissions, Performance and Stability of an Aviation Turbo-Engine While Running on Biodiesel Based Sustainable Aviation Fuel. Inventions 2024, 9, 16. [Google Scholar] [CrossRef]
  7. Cican, G.; Frigioescu, T.-F.; Crunteanu, D.-E.; Cristea, L. Micro Turbojet Engine Nozzle Ejector Impact on the Acoustic Emission, Thrust Force and Fuel Consumption Analysis. Aerospace 2023, 10, 162. [Google Scholar] [CrossRef]
  8. Caranton, A.R.G.; Silva, V.; Galindo, M.; Pava, J.; López, M.; Cerón, A.; Mayorga, M.A. Enhancing performance and emission characteristics of palm based biodiesel blends with aeronautical Additives: A comprehensive analysis in a J69 aviation engine. Energy Convers. Manag. 2024, 313, 118600. [Google Scholar] [CrossRef]
  9. Dombrovschi, M.; Deaconu, M.; Cristea, L.; Frigioescu, T.F.; Cican, G.; Badea, G.-P.; Totu, A.-G. Acoustic Analysis of a Hybrid Propulsion System for Drone Applications. Acoustics 2024, 6, 698–712. [Google Scholar] [CrossRef]
  10. Enagi, I.I.; Al-Attab, K.A.; Alauddin, Z.A.Z. Combustion Stability Analysis of Liquid Biofuels using Acoustic Signals. J. Adv. Res. Fluid Mech. Therm. Sci. 2020, 76, 145–155. [Google Scholar] [CrossRef]
  11. Iturbe-Hernández, A.; Guzmán, J.; Vicente, W.; Salinas-Vazquez, M. Microturbine characteristics and emissions using biofuel blends. Biofuels 2020, 13, 497–505. [Google Scholar] [CrossRef]
  12. Rye, L.; Wilson, C. The influence of alternative fuel composition on gas turbine ignition performance. Fuel 2012, 96, 277–283. [Google Scholar] [CrossRef]
  13. Martin, J.; Burton, J.; Luecke, J.; McCormick, R. Impacts of Biofuel Blending on MCCI Ignition Delay with Review of Methods for Defining Cycle-by-Cycle Ignition Points from Noisy Cylinder Pressure Data, National Renewable Energy Laboratory; SAE International: Warrendale, PA, USA, 2021. Available online: https://www.nrel.gov/docs/fy21osti/78762.pdf (accessed on 21 August 2025).
  14. Łagowski, P.; Wcisło, G.; Kurczyński, D. Comparison of the Combustion Process Parameters in a Diesel Engine Powered by Second-Generation Biodiesel Compared to the First-Generation Biodiesel. Energies 2022, 15, 6835. [Google Scholar] [CrossRef]
  15. Jha, S.K.; Fernando, S.; To, S.F. Flame temperature analysis of biodiesel blends and components. Fuel 2008, 87, 1982–1988. [Google Scholar] [CrossRef]
  16. Song, Z.; Li, Z.; Liu, Z. Comparison of Emission Properties of Sustainable Aviation Fuels and Conventional Aviation Fuels: A Review. Appl. Sci. 2024, 14, 5484. [Google Scholar] [CrossRef]
  17. Levy, Y.; Lipkin, S.; Nadvany, V.; Sherbaum, V. Fuel Atomization in Small Jet Engines. In Proceedings of the Power for Land, Sea, and Air, Amsterdam, The Netherlands, 3–6 June 2002; pp. 759–763. [Google Scholar]
  18. Ibrahim, M.N.; Ali, A.H.H.; Ookawara, S. Experimental Study on Performance and Emissions of Turbojet Engine Fueled by Alternative Biodiesel. In Proceedings of the 23rd International Conference On: Environmental Protection is a Must, Alexandria, Egypt, 11–13 May 2013; pp. 11–13. [Google Scholar]
  19. Ali, A.H.H.; Ibrahim, M.N. Performance and environmental impact of a turbojet engine fueled by blends of biodiesels. Int. J. Environ. Sci. Technol. 2016, 14, 1253–1266. [Google Scholar] [CrossRef]
  20. Lord, W.; Jones, C.; Stern, A.; Head, V.; Krejsa, E. Mixer-ejector nozzle for jet noise suppression. In Proceedings of the 26th Joint Propulsion Conference, Orlando, FL, USA, 16–18 July 1990. [Google Scholar]
  21. Bridges, J.E.; Zaman, K.Q.; Heberling, B. Basics of Mixer-Ejectors for Quiet Propulsion. In Proceedings of the AIAA Aviation 2020 Forum, Online, 15–19 June 2020. [Google Scholar]
  22. Schmidt, R.; Hupfer, A. Design and numerical simulation of ejector nozzles for very small. CEAS Aeronaut. J. 2021, 12, 923–940. [Google Scholar] [CrossRef]
  23. Cican, G. Experimental Transient Process Analysis of Micro-Turbojet Aviation Engines: Comparing the Effects of Diesel and Kerosene Fuels at Different Ambient Temperatures. Energies 2024, 17, 1366. [Google Scholar] [CrossRef]
  24. ASTM D1655-22a; Standard Specification for Aviation Turbine Fuels. ASTM—American Society for Testing and Materials: West Conshohocken, PA, USA, 2022.
  25. ASTM D6751-23; Standard Specification for Biodiesel Fuel Blend Stock (B100) for Middle Distillate Fuels. ASTM—American Society for Testing and Materials: West Conshohocken, PA, USA, 2023.
  26. ASTM D7042; Standard Test Method for Dynamic Viscosity and Density of Liquids by Stabinger Viscometer (and the Calculation of Kinematic Viscosity. ASTM—American Society for Testing and Materials: West Conshohocken, PA, USA, 2021.
  27. ASTM D2622-21; Sulfur in Petroleum Products by Wavelength Dispersive X-Ray Fluorescence Spectrometry. ASTM—American Society for Testing and Materials: West Conshohocken, PA, USA, 2021.
  28. ASTM D3338/D3338M-20a; Standard Test Method for Estimation of Net Heat of Combustion of Aviation Fuels. ASTM—American Society for Testing and Materials: West Conshohocken, PA, USA, 2020.
  29. ASTM D92-05a; Standard Test Method for Flash and Fire Points by Cleveland Open Cup Tester. ASTM—American Society for Testing and Materials: West Conshohocken, PA, USA, 2009.
  30. ASTM D5453-19a; Standard Test Method for Determination of Total Sulfur in Light Hydrocarbons, Spark Ignition Engine Fuel, Diesel Engine Fuel, and Engine Oil by Ultraviolet Fluorescence. ASTM—American Society for Testing and Materials: West Conshohocken, PA, USA, 2019.
  31. ASTM D93-20; Standard Test Methods for Flash Point by Pensky-Martens Closed Cup Tester. ASTM—American Society for Testing and Materials: West Conshohocken, PA, USA, 2020.
  32. Brown, T.L.; LeMay, H.E.; Bursten, B.E.; Brunauer, L.S. Chemistry: The Central Science; Pearson: London, UK, 2014. [Google Scholar]
Figure 1. Test bench. Microphone’s locations M1–M5.
Technologies 13 00388 g001
Figure 2. The ejector. (a) Installed on the microturbojet engine; (b) cross-section through the ejector.
Technologies 13 00388 g002
Figure 3. Density as a function of temperature for all blends.
Technologies 13 00388 g003
Figure 4. Kinematic viscosity as a function of temperature for all blends.
Technologies 13 00388 g004
Figure 5. Gas temperature in front of the turbine. (a) Idle regime, (b) intermediate regime, and (c) maximum regime.
Technologies 13 00388 g005
Figure 6. Variation in fuel flow rate. (a) Idle regime, (b) intermediate regime, and (c) maximum regime.
Technologies 13 00388 g006
Figure 7. Variation in thrust force. (a) Idle regime, (b) intermediate regime, and (c) maximum regime.
Technologies 13 00388 g007
Figure 8. Variation in specific fuel consumption. (a) Idle regime, (b) intermediate regime, and (c) maximum regime.
Technologies 13 00388 g008
Figure 9. Variation in CO concentration. (a) Idle regime, (b) intermediate regime, and (c) maximum regime.
Technologies 13 00388 g009
Figure 10. Variation in SO2 concentration. (a) Idle regime, (b) intermediate regime, and (c) maximum regime.
Technologies 13 00388 g010
Figure 11. Directivity of Jet A baseline and ejector. (a) Regime 1, (b) Regime 2, and (c) Regime 3.
Technologies 13 00388 g011
Figure 12. Directivity of Jet A + 10% biodiesel baseline and ejector. (a) Regime 1, (b) Regime 2, and (c) Regime 3.
Technologies 13 00388 g012
Figure 13. Directivity of Jet A + 20% biodiesel baseline and ejector. (a) Regime 1, (b) Regime 2, and (c) Regime 3.
Technologies 13 00388 g013
Figure 14. Directivity of Jet A + 30% biodiesel baseline and ejector. (a) Regime 1, (b) Regime 2, and (c) Regime 3.
Technologies 13 00388 g014
Figure 15. PSD spectrum—biodiesel mixture—baseline.
Technologies 13 00388 g015
Figure 16. PSD spectrum—biodiesel mixture—ejector.
Technologies 13 00388 g016
Figure 17. Speed variation Regime 1 [rpm]—biodiesel 10%: baseline (a) and ejector (b).
Technologies 13 00388 g017
Figure 18. Speed variation Regime 1 [rpm]—biodiesel 20%: baseline (a) and ejector (b).
Technologies 13 00388 g018
Figure 19. Speed variation Regime 1 [rpm]—biodiesel 30%: baseline (a) and ejector (b).
Technologies 13 00388 g019
Figure 20. Waterfall spectrum Regime 1 + Regime 2 + Regime 3 [dB, RMS]—biodiesel 10%: baseline (a) and ejector (b).
Technologies 13 00388 g020
Figure 21. Waterfall spectrum Regime 1 + Regime 2 + Regime 3 [dB, RMS]—biodiesel 20%: baseline (a) and ejector (b).
Technologies 13 00388 g021
Figure 22. Waterfall spectrum Regime 1 + Regime 2 + Regime 3 [dB, RMS]—biodiesel 30%: baseline (a) and ejector (b).
Technologies 13 00388 g022
Figure 23. STFT kurtosis—Jet A baseline (a) and ejector (b).
Technologies 13 00388 g023
Figure 24. STFT kurtosis—biodiesel 10% baseline (a) and ejector (b)).
Technologies 13 00388 g024
Figure 25. STFT kurtosis—biodiesel 20% baseline (a) and ejector (b).
Technologies 13 00388 g025
Figure 26. STFT kurtosis—biodiesel 30% baseline (a) and ejector (b).
Technologies 13 00388 g026
Table 1. FAME Composition of Biodiesel Analyzed by Gas Chromatography.
Fatty Acid Methyl Ester (FAME)% (w/w)
C10:0 Methyl decanoate0.04
C12:0 Methyl dodecanoate0.05
C14:0 Methyl tetradecanoate0.78
C16:0 Methyl hexadecanoate3.85
C18:0 Methyl octadecanoate1.80
C20:0 Methyl eicosanoate0.49
C22:0 Methyl docosanoate1.20
C16:1 Methyl hexadec-9-enoate0.15
C18:1 Methyl (Z)-octadec-9-enoate58.65
C20:1 Methyl cis-11-eicosenoate0.51
C22:1 Methyl (Z)-13-docosenoate0.18
C18:2 Methyl (Z,Z)-octadeca-9,12-dienoate21.13
C18:3 Methyl (Z,Z,Z)-octadeca-9,12,15-trienoate11.17
Table 2. Physico-chemical properties of Jet A.
PropertiesUnitsMethodLimits ASTM D1655Jet A
Min.Max.
Density at 288.15 Kg·cm−3ASTM D7042 [26] 0.7750.8400.7888
Sulfur, total% (m/m)ASTM D2622-21 [27]-0.300.0004
Lower heating valueMJ·kg−1ASTM D3338 [28]42.8-43.34
Flash point°CASTM D92 [29]38-34.8
Table 3. Physico-chemical properties of biodiesel.
Properties Unit Method Limits ASTM D6751Biodiesel
Min.Max.
Density at 288.15 Kg·cm−3ASTM D7042 [26]0.8600.9000.8835
Kinematic viscosity at 313.15 Kmm2·s−1ASTM D7042 [26]3.55.04.4337
Sulfur contentmg·kg−1ASTM D5453 [30]-10.03
Flash point°CASTM D93 [31]101-164
Table 4. Percentage variations for the performances recorded by the microturbine engine.
FuelNozzle TypeRegimeTcomb [%]Ff [%]F [%]S [%]
Jet AejectorR1−0.65−3.8219.74−19.67
R2−1.04−0.142.28−2.37
R3−2.66−0.495.05−5.27
10% BiodieselbaselineR10.0515.31−4.09
R2−0.160.98−0.21.18
R31.620.95−0.871.84
ejectorR1−0.56−0.9436.39−27.37
R2−1.070.84.13−3.2
R3−3.430.55.48−4.72
20% BiodieselbaselineR10.082.156.41−4.01
R2−0.361.98−1.163.18
R33.431.96−1.043.03
ejectorR1−0.460.4936.7−26.49
R2−1.191.894.55−2.54
R3−3.091.455.45−3.78
30% BiodieselbaselineR10.213.055.33−2.17
R2−0.472.87−1.424.36
R34.672.71−0.993.74
ejectorR1−0.22.5936.91−25.07
R2−1.442.694.68−1.9
R3−3.362.265.58−3.15
Table 5. SPL values for the five microphones in all studied cases.
FuelNozzle TypeRegimeM1 [dBA]M2 [dBA]M3 [dBA]M4 [dBA]M5 [dBA]
Jet AbaselineR192.594.494.894.291.2
R2103.9105.9106.7106.8104.4
R3115.0117.4119.5120.8118.7
ejectorR192.593.494.192.789.6
R2104.0105.0106.1105.6102.9
R3113.2115.4118.1118.9116.6
10% BiodieselbaselineR192.594.695.394.191.5
R2104.1106.1107.0106.8104.6
R3114.8117.4119.6120.8118.5
ejectorR194.993.594.193.089.9
R2106.0104.5105.7105.4102.4
R3113.5115.2117.8118.8116.7
20% BiodieselbaselineR192.994.795.294.391.4
R2104.2105.8107.0106.8104.3
R3114.7117.0119.5120.8118.5
ejectorR193.694.595.193.891.0
R2103.5104.7105.6105.1102.5
R3113.2115.4117.9119.0116.9
30% BiodieselbaselineR192.996.595.294.291.3
R2104.3107.1106.9106.8104.1
R3114.8116.9119.5120.8118.5
ejectorR193.693.794.293.189.5
R2103.9104.7105.8105.3102.0
R3113.3114.9117.6118.6116.7
Disclaimer/Publisher’s Note: The statements, opinions and data contained in all publications are solely those of the individual author(s) and contributor(s) and not of MDPI and/or the editor(s). MDPI and/or the editor(s) disclaim responsibility for any injury to people or property resulting from any ideas, methods, instructions or products referred to in the content.