Article

Photocatalytic Degradation of Toxic Dyes on Cu and Al Co-Doped ZnO Nanostructured Films: A Comparative Study

by
Nadezhda D. Yakushova
1,
Ivan A. Gubich
2,
Andrey A. Karmanov
1,*,
Alexey S. Komolov
3,
Aleksandra V. Koroleva
4,
Ghenadii Korotcenkov
5 and
Igor A. Pronin
1
1
Department of Nano- and Microelectronics, Penza State University, 440026 Penza, Russia
2
ISL “Advanced Nanomaterials, Coatings and Electronic Devices”, Penza State University, 440026 Penza, Russia
3
Department of Physics, St. Petersburg State University, 199034 St. Petersburg, Russia
4
Research Park, St. Petersburg State University, 199034 St. Petersburg, Russia
5
Department of Physics and Engineering, Moldova State University, 2009 Chisinau, Moldova
*
Author to whom correspondence should be addressed.
Technologies 2025, 13(7), 277; https://doi.org/10.3390/technologies13070277
Submission received: 20 May 2025 / Revised: 23 June 2025 / Accepted: 29 June 2025 / Published: 1 July 2025
(This article belongs to the Section Environmental Technology)

Abstract

The article suggests a simple one-step sol–gel method for synthesizing nanostructured zinc oxide films co-doped with copper and aluminum. It shows the possibility of forming hierarchical ZnO:Al:Cu nanostructures combining branches of different sizes and ranks and quasi-spherical fractal aggregates. It demonstrates the use of the synthesized samples as highly efficient photocatalysts providing the decomposition of toxic dyes (methyl orange) under the action of both ultraviolet radiation and visible light. It establishes the contribution of the average crystallite size, the proportion of zinc atoms in the crystalline phase, their nanostructure, as well as X-ray amorphous phases of copper and aluminum to the efficiency of the photocatalysis process.

Graphical Abstract

1. Introduction

One of the most important problems of nanostructured engineering is the controlled synthesis of metal oxide materials with a given surface morphology and crystal structure, which are optimal for a specific practical application [1,2,3]. Zinc oxide, which is a wide-band gap n-type semiconductor with a band gap of ≈3.30 eV, has long established itself as a promising material for the manufacture of gas sensors [4], supercapacitors [5], ultraviolet radiation detectors [6], and photocatalysts [7]. Unmodified ZnO has a fairly high photocatalytic activity, but exhibits it only under the influence of ultraviolet radiation [8], which has given rise to numerous studies aimed at creating photocatalysts based on it, active under the Influence of visible light [9,10].
There are various methods and approaches to expand the spectral region in which zinc oxide is photocatalytically active, among which the most developed are (1) doping with metal/non-metal atoms, aimed at reducing the band gap of the material; (2) combining with another semiconductor, including the creation of heterojunctions that implement the Z-scheme [11] and S-scheme [12] and ensure efficient separation of charge carriers; (3) creating nanocomposites, including with polymers [13] and carbon [14], in which the second phase suppresses the recombination of photogenerated charge carriers.
A wide range of metals are considered as zinc oxide dopants, amongIch noble metals such as silver [15] and gold [16], transition metals including copper [17], and iron [18] as well as aluminum [19] have proven their effectiveness. A large number of studies are devoted to doping ZnO with only aluminum or only copper, including a thorough study of the effect of modifier concentration on the nanostructure of the material, its optical, adsorption and photocatalytic properties [20,21]. The efficiency of the photocatalysis process in the decomposition reactions of toxic dyes (such as methyl orange, methylene blue, etc.) [22], as well as other organic pollutants of the aquatic environment, including pharmaceuticals [23] has been studied. Co-doping of zinc oxide with copper and aluminum is a powerful tool for creating highly efficient photocatalytic materials, but the works in this area are unsystematic and few in number, which is primarily due to the large range of choice of modifier concentrations, as well as the difficulty of establishing the contribution of a specific dopant to the properties of a photocatalytic material [24]. For example, in work [25], ZnO nanocomposites co-doped with Cu and Al were obtained by wet chemistry. A study of the photocatalytic decomposition of a toxic dye (methylene blue) showed that the photodegradation efficiency and the photocatalysis rate constant are 88% and 0.0237 min−1, respectively. The correlation between the structure and optical properties of zinc oxide co-doped with copper and aluminum synthesized by the sol–gel method is shown; a decrease in the band gap of the material to 3.20 eV is established [26]. In [27], the effect of copper concentration on the structure and optoelectronic properties of ZnO:Al:Cu samples obtained using the sol–gel technology is studied. A non-monotonic dependence of the band gap on the dopant concentration is demonstrated. However, most studies are limited to a small set of samples or a change in the concentration of only one dopant.
The aim of this work is to study the correlation between the composition, crystal structure, and surface morphology of nanostructured ZnO:Al:Cu films (with a total concentration of co-dopants of 6 at.%), as well as their photocatalytic properties in the decomposition reaction of methyl orange under the influence of ultraviolet and visible irradiation.

2. Materials and Methods

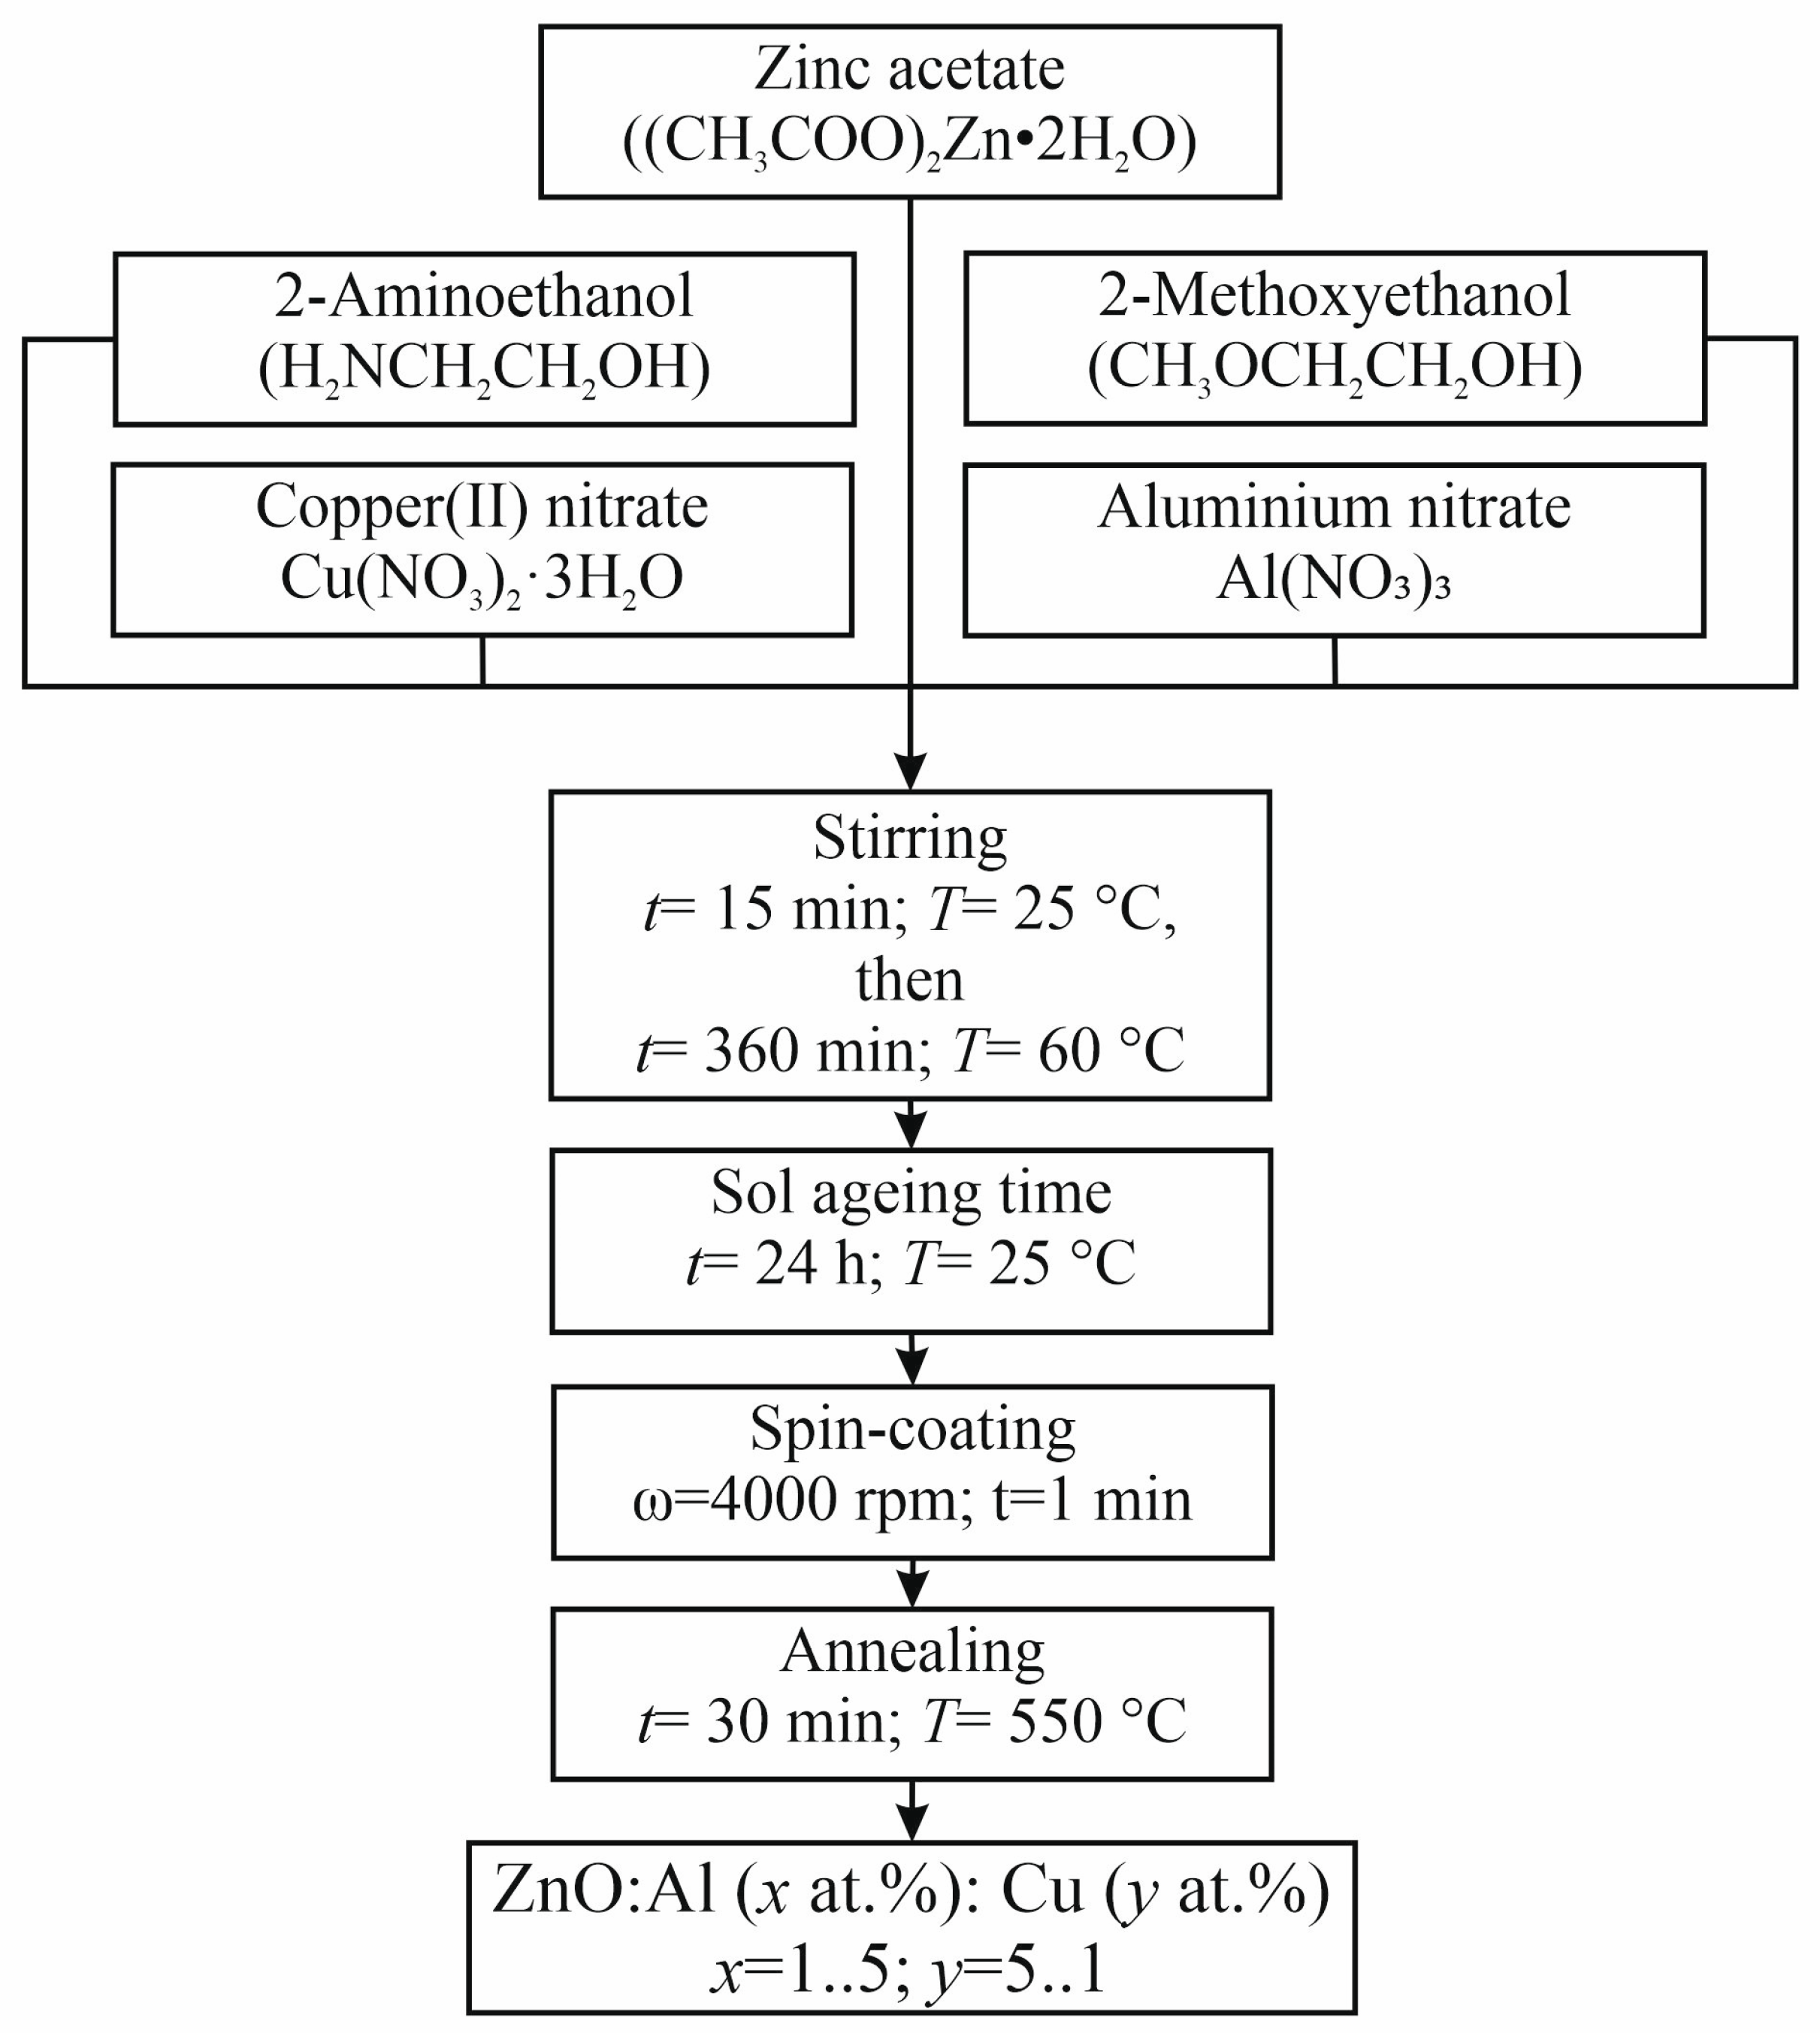
2.1. Sol–Gel Synthesis of Nanostructured ZnO:Al:Cu Films

Nanostructured films based on zinc oxide co-doped with copper and aluminum were obtained using a simple one-step sol–gel synthesis method adapted to solve problems of nanostructured engineering [28]. The following reagents were used as precursors for the synthesis of film-forming sols: zinc acetate dihydrate (CH3COO)2Zn2·H2O (reagent grade, Khimkraft, Kaliningrad, Russia), 2-methoxyethanol CH3OCH2CH2OH (reagent grade, Acros Organics, Geel, Belgium), 2-aminoethanol HOCH2CH2NH2 (analytical grade, Emsure, Darmstadt, Germany), aluminum nitrate Al(NO3)3 (analytical grade, Spektr-Khim, Moscow, Russia), and copper nitrate trihydrate Cu(NO3)2·3H2O (analytical grade, Acros Organics, Geel, Belgium). To obtain the film-forming sol, 10 g of (CH3COO)2Zn2 H2O, 20 mL of CH3OCH2CH2OH and 3.2 mL of HOCH2CH2NH2, as well as Al(NO3)3 and Cu(NO3)2·3H2O, whose masses were selected so that their total concentration is 6 at.%, were mixed in a round-bottomed flask and stirred for 15 min at room temperature (RT). The total concentration of co-dopants was selected in such a way that, on the one hand, it is not too high so that it provides co-dopant incorporation into the zinc oxide crystal lattice without separating as separate metallic phases. On the other hand, the co-dopant concentration ensures a significant change in the properties of the material. The solution was stirred for 360 min at a temperature of 60 °C using a magnetic stirrer (PE-6110, Ekros-Analitika, Saint Petersburg, Russia) until the zinc, copper, and aluminum salts were completely dissolved. After this, the film-forming sol was aged for 24 h at room temperature. Then, the film-forming sol with a volume of 50 μL was applied onto different types of substrates (oxidized single-crystal silicon, glass) by centrifugation for 1 min at 4000 rpm/min. The thermal annealing of sol–gel-derived ZnO:Al:Cu samples was conducted at 550 °C under air conditions for 30 min. A generalized scheme for the synthesis of nanostructured ZnO:Al:Cu films is shown in Figure 1. A series of 6 samples of the following composition were obtained: 1—ZnO:Al(1 at.%):Cu(5 at.%); 2—ZnO:Al(2 at.%):Cu(4 at.%); 3—ZnO:Al(3 at.%):Cu(3 at.%); 4—ZnO:Al(4 at.%):Cu(2 at.%); 5—ZnO:Al(5 at.%):Cu(1 at.%); 6—unmodified ZnO.

2.2. Approach to Investigation of the Sample Surface Using SEM and of the Sample Crystal Structure Using XRD

The surface structure of the samples formed on the surface of the n-Si:P(111) silicon substrates was studied using the scanning electron microscope (SEM) VEGA 3 SBH (TESCAN, Brno, Czech Republic) with the reflection electron detector. The energy-dispersive X-ray spectroscopy (EDX) study of the samples was performed using the Oxford Instruments X-Max 80 (Oxford Instruments, Oxford, UK). The X-ray diffraction (XRD) measurements were carried out using the D8 Discover apparatus (Bruker, Billerica, MA, USA) equipped with the Cu Kα, 0.15406 nm wavelength X-ray excitation source. The samples were subjected to the measurements in the theta/2 theta geometry. The measurements were carried out in the angle range from 15° to 95°, the angular resolution was 0.05°, and the scanning step was 1° per minute.

2.3. Approach to Investigation of the Sample Composition Uisng FTIR

The qualitative composition of nanostructured ZnO:Al:Cu films formed on the surface of silicon substrates with an oxide layer was studied using infrared Fourier spectroscopy (FTIR) on an FTIR spectrometer FSM1201 (Infraspek, Saint Petersburg, Russia). The measurements were carried out using a PZO10 mirror reflection attachment (Infraspek, Saint Petersburg, Russia); the spectral resolution was 2 cm−1.

2.4. Approach to Investigation of the Sample Atomic Composition Using XPS

The chemical composition of the surface of the synthesized samples was analyzed by X-ray photoelectron spectroscopy (XPS). The XPS spectra were measured under ultra-high-vacuum (UHV) conditions using the Escalab 250Xi X-ray photoelectron spectrometer (Thermo Fisher Scientific Inc., Waltham, MA, USA). The Al Ka (1486.6 eV) excitation source was used. The element core level spectra were recorded in the 20 eV constant pass energy mode, using the XPS spot size of 650 µm. The base pressure was kept below 10−7 Pa and the Ar partial pressure was kept below 10−5 Pa upon usage of the electron–ion charge compensation system. The energy scale of the spectrometer was calibrated using a sputter-cleaned Au surface as a reference so that the binding energy the Au4f7/2 peak was set to 84 eV. The library of the reference XPS spectra and the atomic registration sensitivity factors were provided by the instrument manufacturer and were used for the analysis.
Since the surface charging for the studied samples cannot be excluded during the XPS study, and the calibration by the C1s peak is, in turn, unreliable, the present work uses a method based on the use of the work function of the sample (ΦSA) [29]. According to this method, the corrected position of the BE C1s binding energy was determined as BE = 289.58 − ΦSA. The calculated shift was applied to all core levels. The ΦSA value for the ZnO samples synthesized by the sol–gel method was 4.7 eV and was obtained based on the literature data [30].

2.5. Approach to Investigation of the Photocatalytic Properties of Samples Under the Influence of Ultraviolet and Visible Radiation

The photocatalytic activity of the synthesized samples was examined in the decomposition reactions of aqueous solutions of toxic dye (methyl orange) with an initial concentration of C0 = 40 μmol/L. The choice of methyl orange as the analyzed organic pollutant is due, first, to its known toxicity at high concentrations in the aquatic environment. Second, it is a classic model pollutant, which allows comparison of the results of photocatalytic activity of various wide-band gap semiconductor oxides (TiO2, ZnO, SnO2, etc.). The choice of concentration of methyl orange is determined by two main considerations. First, at a given concentration in an aquatic environment, methyl orange exhibits a certain degree of toxicity. Second, at 40 μmol/L its aqueous solution has a non-zero value of light transmittance coefficient in the spectral range of 300–600 nm, which allows us to estimate the rate constant of photocatalytic decomposition quite accurately. The ZnO:Al:Cu samples formed on the surface of glass substrates SP-7102 (Dyatkovo, Minilab, Russia) measuring 26 × 76 mm2 were studied both under the action of hard UV radiation and under the action of visible radiation. In the first case, a linear ultraviolet lamp (Camelion, Shenzhen, China, radiation peak 185 nm and 254 nm, power 10 W) was used as a radiation source. During the experiment, the samples were placed in a 300 mL reactor with the dye, so that the distance from the UV lamp to the liquid surface was 8 cm, and the distance from the liquid surface to the sample surface was 1 cm. In the second case, when conducting experiments on photocatalytic decomposition of methyl orange under the influence of visible light, a 100 W incandescent lamp was used as a radiation source, the volume of the solution was reduced to 40 μL. In all cases during the experiment, the reaction mixture was constantly stirred with a magnetic stirrer at a speed of 150 rpm and a test portion was taken from the solution every 10 min to determine the concentration of methyl orange spectrophotometrically at a wavelength of 465 nm, corresponding to the absorption maximum. In order to compensate for the effects associated with possible adsorption of the dye on the surface of the samples as well as their degradation in the dark, the samples were placed in an aqueous solution of methyl orange and kept in the dark for 30 min before exposure to radiation. The transmittance coefficient of the solutions of methyl orange were examined using the SF-56 spectrophotometer (LOMO, Saint Petersburg, Russia). To calculate the solution concentration based on the results of transmittance measurements, the well-known Bouguer–Lambert–Beer law was used. To account for the decomposition of the dye under the action of UV radiation not associated with photocatalysis as well as the possible evaporation of the solution under the action of thermal radiation from an incandescent lamp, a control experiment was conducted without adding ZnO:Al:Cu to the reaction mixture. Those results were taken into account when calculating the kinetic curves.

3. Results and Discussion

3.1. Results of the Sample Crystal Structure

The X-ray diffraction patterns of nanostructured zinc oxide films co-doped with copper and aluminum are shown in Figure 2. At all the considered concentrations of co-dopants, the samples demonstrate a series of distinct peaks typical of ZnO with a wurtzite-type crystal structure, which correspond to the crystallographic planes (100), (002), (101), (102), (110), (103) [31] (JCDPS card No. 36–1451). No traces of other phases are detected according to the X-ray diffraction data. Using the Scherrer equation to be applied to broadening of XRD reflections, we estimated the average size of coherent scattering regions (d) equal to 27.4 nm for unmodified ZnO and the non-monotonic nature of the dependence of d on the concentration of co-dopants (Table 1). When assessing the average crystallite size, peaks (100), (002), and (101) were used, for each of which the value of “di” was estimated (where i = 1, 2, 3 corresponds to the peak number). After that, this value was averaged over all three peaks in order to minimize the instrumental error. An increase in the concentration of aluminum from 1 to 5 at.% in all cases except the ZnO:Al(4 at.%):Cu(2 at.%) sample leads to a significant decrease in the average size of coherent scattering regions from 17.4 nm to 7.1 nm, and the ZnO:Al(3 at.%):Cu(3 at.%) and ZnO:Al(5 at.%):Cu(1 at.%) samples become close to X-ray amorphous. This together with the fact that other phases except wurtzite are not detected suggests that copper and aluminum atoms are incorporated into the zinc oxide crystal lattice and effectively suppress the growth of crystallites. Another confirmation of the incorporation of Cu and Al atoms into the ZnO crystal lattice is the observed non-monotonic shift of the diffraction peak (002), which is demonstrated in Figure 2b. The magnitude of this shift is maximum for Samples 2 and 4 and small for the remaining Samples 1, 3 and 5, which is explained by both the small total concentration of co-doping agents equal to 6 at.% and by the difference in their atomic radii.
For the ZnO:Al(4 at.%):Cu(2 at.%) sample, the characteristic value is d ≈ 13.3 nm, which is two times smaller than that of unmodified ZnO and comparable to the average size of coherent scattering regions of ZnO:Al(2 at.%):Cu(4 at.%). The observed phenomenon, based only on the X-ray diffraction patterns, does not have a reliable justification, but is apparently associated with the presence in the samples of not only aluminum, but also copper, which is embedded in the ZnO crystal lattice and contributes to its crystal structure (especially considering that the atomic radius of Cu is 0.128 nm and is smaller than that of Zn, for which it is 0.138 nm, and for Al, in turn, the atomic radius is the largest and is 0.143 nm).

3.2. Results of the Sample Surface Morphoiogy According to SEM Investigation

SEM images of nanostructured zinc oxide films co-doped with copper and aluminum as well as unmodified ZnO are shown in Figure 3. Analysis of the obtained data shows that changing the concentration of Al and Cu in the samples leads to a significant rearrangement of their nanostructure.
The unmodified sample (Figure 3f) as well as ZnO:Al(1 at.%):Cu(5 at.%) (Figure 3a) and ZnO:Al(3 at.%):Cu(3 at.%) (Figure 3c) samples are characterized by a hierarchical structure formed by branches of different sizes. Individual branches, as was established earlier, are formed from quasi-spherical aggregates of fractal nature which in turn consist of individual crystallites [32]. This type of hierarchical structure of the material corresponds to the transition from a film-forming sol to a gel and is typical for the precursors used and the parameters of the application method (spin-coating) [33].
Co-doping of zinc oxide with 1 at.% aluminum and 5 at.% copper results in a noticeable decrease in the average branch diameter to 0.7 μm compared to ≈1 μm characteristic of pure ZnO. In the case of the ZnO:Al(3 at.%):Cu(3 at.%) sample, an additional level of branch hierarchy with an average size of 0.4 μm appears, which is adjacent to larger branches with a diameter of ≈1.5 μm. For the ZnO:Al(2 at.%):Cu(4 at.%) and ZnO:Al(5 at.%):Cu(1 at.%) samples, the hierarchical branched structure does not complete its formation (inserts to Figure 3b,e); instead of branches of different sizes and ranks, their precursors (quasi-spherical aggregates with a fractal structure) remain, causing the presence of pores in the material. Such a rearrangement of the nanostructure of ZnO:Al:Cu films unambiguously correlates with their crystal structure. In particular, the significantly smaller average size of coherent scattering regions ≈ 7.1 nm, characteristic of the ZnO:Al(5 at.%):Cu(1 at.%) sample in comparison with d ≈ 16.2 nm, corresponding to the ZnO:Al(2 at.%):Cu(4 at.%) sample, leads to a significant difference in the average size of quasi-spherical aggregates forming the surface of the samples (0.54 μm for Sample 2 and 0.38 μm for Sample 5, respectively). Modification of ZnO with 4 at.% Al and 2 at.% Cu provides the formation of a new type of material nanostructure combining hierarchical branches of different sizes and fractal aggregates (insert to Figure 3d). According to the analysis of SEM images, the average diameter of the branches is 0.8 μm, while the average size of quasi-spherical nanoparticles is ≈90 nm, but there are also aggregates of smaller size, down to 40 nm and less.

3.3. Results of the Sample Composition According to FTIR Measurements

Figure 4 shows the FTIR spectra of nanostructured ZnO:Al:Cu films with different concentrations of co-dopants. The qualitative composition of the studied samples can be judged by the presence of absorption bands with maxima at 514, 690, 734, and 890 cm−1. The weak absorption peak at 514 cm−1 corresponds to deformation vibrations of Zn-O in the crystal lattice, and the incorporation of copper into it can be judged by the presence of a vibrational mode at 690 cm−1. The vibrations of the Al-O bonds are not reliably identified in the FTIR spectra, since they overlap with the Zn-O peak, which is confirmed by other studies [34]. However, for the ZnO:Al(2 at.%):Cu(4 at.%) and ZnO:Al(4 at.%):Cu(2 at.%) samples, the vibrational mode at 514 cm−1 becomes significantly wider and more intense, which, in all likelihood, may indicate at the formation of the Al2O3 phase, X-ray amorphous due to the size of its constituent particles.
Based on the analysis of FTIR spectra, it is impossible to make an unambiguous judgment about the formation of the X-ray amorphous phase of copper oxide, since the absorption peak at 690 cm−1 has low intensity and does not allow distinguishing between the vibrations of the Cu-O bond, characteristic of copper in the ZnO crystal lattice, and the bonds characteristic of copper (I) and (II) oxides [35]. The presence of a significant carbon content in the film structure can be judged based on the observation of absorption peaks at 734 and 890 cm−1, characterizing the deformation vibrations of C-O-H and the stretching vibrations of C-C, respectively. Since the nanostructured films are formed on substrates made of oxidized single-crystal silicon n-Si:P(111), the spectra also exhibit features at 610 and 820 cm−1. The developed hierarchical surface of the samples causes active adsorption of atmospheric carbon dioxide and water vapor on them, which corresponds to the appearance of a peak at 2360 cm−1 and a wide band of 3100–3600 cm−1 in the spectra. The generalized results of the FTIR spectra analysis are presented in Table 2.

3.4. Results of the Sample Atomic Composition According to XPS Investigation

Survey XPS spectra of the studied nanostructured ZnO:Al:Cu films with different concentrations of co-dopants are shown in Figure 5. Analysis of the experimental data shows that the most intense are the peaks of the core levels Zn2p (doublet Zn2p1/2 and Zn2p3/2), as well as O1s and Cu2p (doublet Cu2p1/2 and Cu2p3/2). Low-intensity peaks characteristic of photoemission from zinc levels Zn2s, Zn3s, Zn3p, Zn3d, and Auger electrons OKLL and ZnLMM(a,b,c,d) are detected. The spectra also show the core level of carbon C1s, which can be associated with both carbon included in the material during synthesis and as a consequence of the adsorption of carbon-containing compounds. A detailed interpretation of the survey spectra corresponds to works [36,37]. The atomic composition of the samples without taking into account the contribution from silicon is presented in Table 3. For the ZnO:Al(2 at.%):Cu(4 at.%) and ZnO:Al(4 at.%):Cu(2 at.%) samples, the peaks corresponding to the Si2p and Si2s core levels (Curves 2 and 4 in Figure 5) are unambiguously identified, as well as the peak with a binding energy of ≈117 eV, which most likely belongs to the Al2s core level [38]. Silicon, revealed in the survey XPS spectra, corresponds to the oxide layer of the n-Si:P(111) substrate on which the ZnO:Al:Cu films are formed, and its observation can be associated either with macroscopic defects of the films or more likely with their nanostructure. In the first case (for the ZnO:Al(2 at.%):Cu(4 at.%) sample), as was noted earlier, the presence of various pores is characteristic, through which the photoelectrons of the core levels Si2p and Si2s can escape. In the second case (for the ZnO:Al(4 at.%):Cu(2 at.%) sample), the film has a hierarchical structure formed by the unification of branches and quasi-spherical aggregates, which allows us to assume the presence of areas, the thickness of which (taking into account the etching of the surface with argon ions during the cleaning process) does not interfere with the registration of photoelectrons of the oxide layer of the Si substrate. Since aluminum is identified by XPS spectra only for Samples 2 and 4 and it is not present in Samples 1, 3 and 5, it can be assumed that Al is contained mainly in the film volume; its content on the surface is under the limit of sensitivity of the XPS method. This assumption is indirectly confirmed by the data on the surface morphology of the samples, which in the case of Samples 1, 3 and 5 do not contain pores which could provide the exit of electrons from the core levels of Al from the film volume.
An analysis of the binding energies shows that for all the samples studied, the Zn2p peak (Figure 6a) corresponds to Zn atoms in the 2+ oxidation state, which may correspond to the Zn2+ cation in the wurtzite crystal lattice. However, an unambiguous relationship between the concentration of co-doping agents and the binding energy of the Zn2p3/2 peak (BEZn2p3/2) is not observed (Table 3). Relative to BEZn2p3/2 of unmodified zinc oxide, a chemical shift is observed both to the high-energy (Samples 2, 4, and 5) and low-energy (Samples 1 and 3) regions. Just as in the case of the analysis of experimental XRD data, we assume that the non-monotonicity of this shift is due to the difference in the atomic radii of copper and aluminum, which, being embedded in the crystal lattice and essentially being point defects, change the local electron environment of zinc atoms. Another reason responsible for this shift is the difference in the oxidation state of zinc, aluminum, and copper (2+ vs. 3+ vs. 1+), which can also cause the observed phenomenon when incorporated into the ZnO crystal lattice. Deconvolution of the C1s core level for all samples except unmodified ZnO indicates the presence of carbon in the films with a binding energy of 284.88 eV (Figure 6b) in the sp2-hybrid state C(I), which corresponds to thermally decomposed residues of the precursors of the film-forming sol. Etching the surface of ZnO:Al:Cu films made it possible to almost completely remove all surface contaminants from the films, and only unmodified zinc oxide (Curve 6 in Figure 6b) contains carbon in a carbonate-like form C(II), corresponding to chemisorbed CO2.
The peaks of the Cu2p core levels (the Cu2p1/2 and Cu2p3/2 doublet) have a weak intensity (at the limit of the method sensitivity) and are expressed more strongly the higher the copper concentration in the sample (Figure 7). Their binding energy for the ZnO:Al(1 at.%):Cu(5 at.%) sample is 931.96 eV and 951.84 eV, respectively, which corresponds to copper ions with the oxidation state Cu+ built into the crystal lattice in place of the Zn2+ cations. The presence of copper in the samples with an oxidation state of 1+ instead of the expected 2+ is most likely associated with the process of its reduction, which may be caused by reactions with carbon (the concentration of which in the samples exceeds 12 at.%), as well as by redistribution of the main charge carriers (electrons) in the sample, since their concentration increases significantly due to doping with aluminum. A shift of up to 0.9 eV to the high-energy region is observed with a decrease in the copper content in the sample and an increase in the aluminum concentration, which is apparently a consequence of the incorporation of both co-dopants into the wurtzite-type crystal lattice. It can be argued that Cu2+ cations are absent in the samples, since it is known from the literature that they are characterized by a significantly higher binding energy of ≈933.5 eV [39].
Deconvolution of the O1s core level peak depending on the concentration of co-dopants in the sample allows distinguishing up to four forms of oxygen (Figure 8), two of which (O(Z) and O(I)) correspond to lattice oxygen O(lat), one O(II) is attributed to all types of adsorbed oxygen, including those from hydroxyl groups, and another form O(III) corresponds to the oxygen of the oxide layer of the silicon substrate.
Oxygen in the form of O(I) with a binding energy of ≈530.0 eV is present in the XPS spectra of all samples and is characteristic of O2- anions in the ZnO crystal lattice. This form of oxygen is dominant in unmodified zinc oxide (Table 3) and is the smallest for the ZnO:Al(2 at.%):Cu(4 at.%) and ZnO:Al(4 at.%):Cu(2 at.%) samples. Lattice oxygen in the studied samples is also represented by the O(Z) form with a binding energy of ≈528.7 eV, which can be attributed to O2− anions surrounded by Cu+ and Zn2+ cations [40]. This O(lat) form is characteristic only of Samples 1–3 and is not identified at low copper concentrations (<2 at.%). Since, as already noted, peaks of core levels of Si were detected for a number of samples, the O(III) form of oxygen with a binding energy of ≈533.0 eV, corresponding to silicon dioxide, can be distinguished for them. In turn, the O(II) form of oxygen with a binding energy of ≈532.0 eV corresponds to adsorbed oxygen in all varieties and makes an overwhelming contribution for the ZnO:Al(4 at.%):Cu(2 at.%) sample.
Assuming the stoichiometry of zinc oxide, the concentration of lattice Zn can be estimated using the equality Zn(lat) = O(lat), as well as the ratio between lattice zinc and its total atomic content in the samples, i.e., the value of Zn(lat)/Zn (Table 1). Analysis of the presented data shows that the maximum proportion of lattice zinc is in the sample 0.912 ZnO:Al(2 at.%):Cu(4 at.%), and the minimum 0.463 is in the sample co-doped with 4 at.% aluminum and 2 at.% copper, while the value of Zn(lat)/Zn = 0.619 is characteristic of unmodified zinc oxide. The difference of this value from one clearly indicates that a significant portion of Zn does not occupy regular sites in the crystal lattice and may, for example, belong to zinc hydroxide, which did not completely transform into zinc oxide at the annealing temperature used (550 °C). This fact correlates with the results of earlier studies, including confirmation for samples obtained by photocuring [41].
Based on the results of estimating the fraction of lattice oxygen and adsorbed oxygen and without taking into account the oxygen of the oxide layer of the silicon substrate, it is possible to estimate the value of Z n O l a t + O a d s , which characterizes the fraction of zinc not bound to oxygen atoms. For the samples of ZnO:Al(1 at.%):Cu(5 at.%), ZnO:Al(3 at.%):Cu(3 at.%), and unmodified ZnO, this value is a constant of ≈1.3, while for the sample of ZnO:Al(5 at.%):Cu(1 at.%) it is close to one, and for the samples of ZnO:Al(2 at.%):Cu(4 at.%) and ZnO:Al(4 at.%):Cu(2 at.%) << 1. A joint analysis of the Zn(lat)/Zn and Z n O l a t + O a d s values suggests that Samples 2 and 4 contain a certain proportion of X-ray amorphous phases of copper and/or aluminum oxides, with the most probable phase for the ZnO:Al(2 at.%):Cu(4 at.%) sample being the existence of the Cu2O phase (taking into account the Cu2p bond energy—Figure 7).

3.5. Results of the Sample Composition According to EDX Measurements

Figure 9 shows the EDX spectrum of a section of the nanostructured ZnO:Al(4 at.%):Cu(2 at.%) film containing a quasi-spherical fractal aggregate. Analysis of the spectrum shows that the aggregate is formed predominantly from Zn, O, and C atoms, as well as Al and Cu, and their concentration is in good agreement with the XPS data. The difference in the composition of the aggregate and the calculated elemental composition of the film suggests that the quasi-spherical particles contain copper and aluminum that are not included in the crystal lattice and are released as a separate X-ray amorphous phase, which confirms the previously made conclusions.

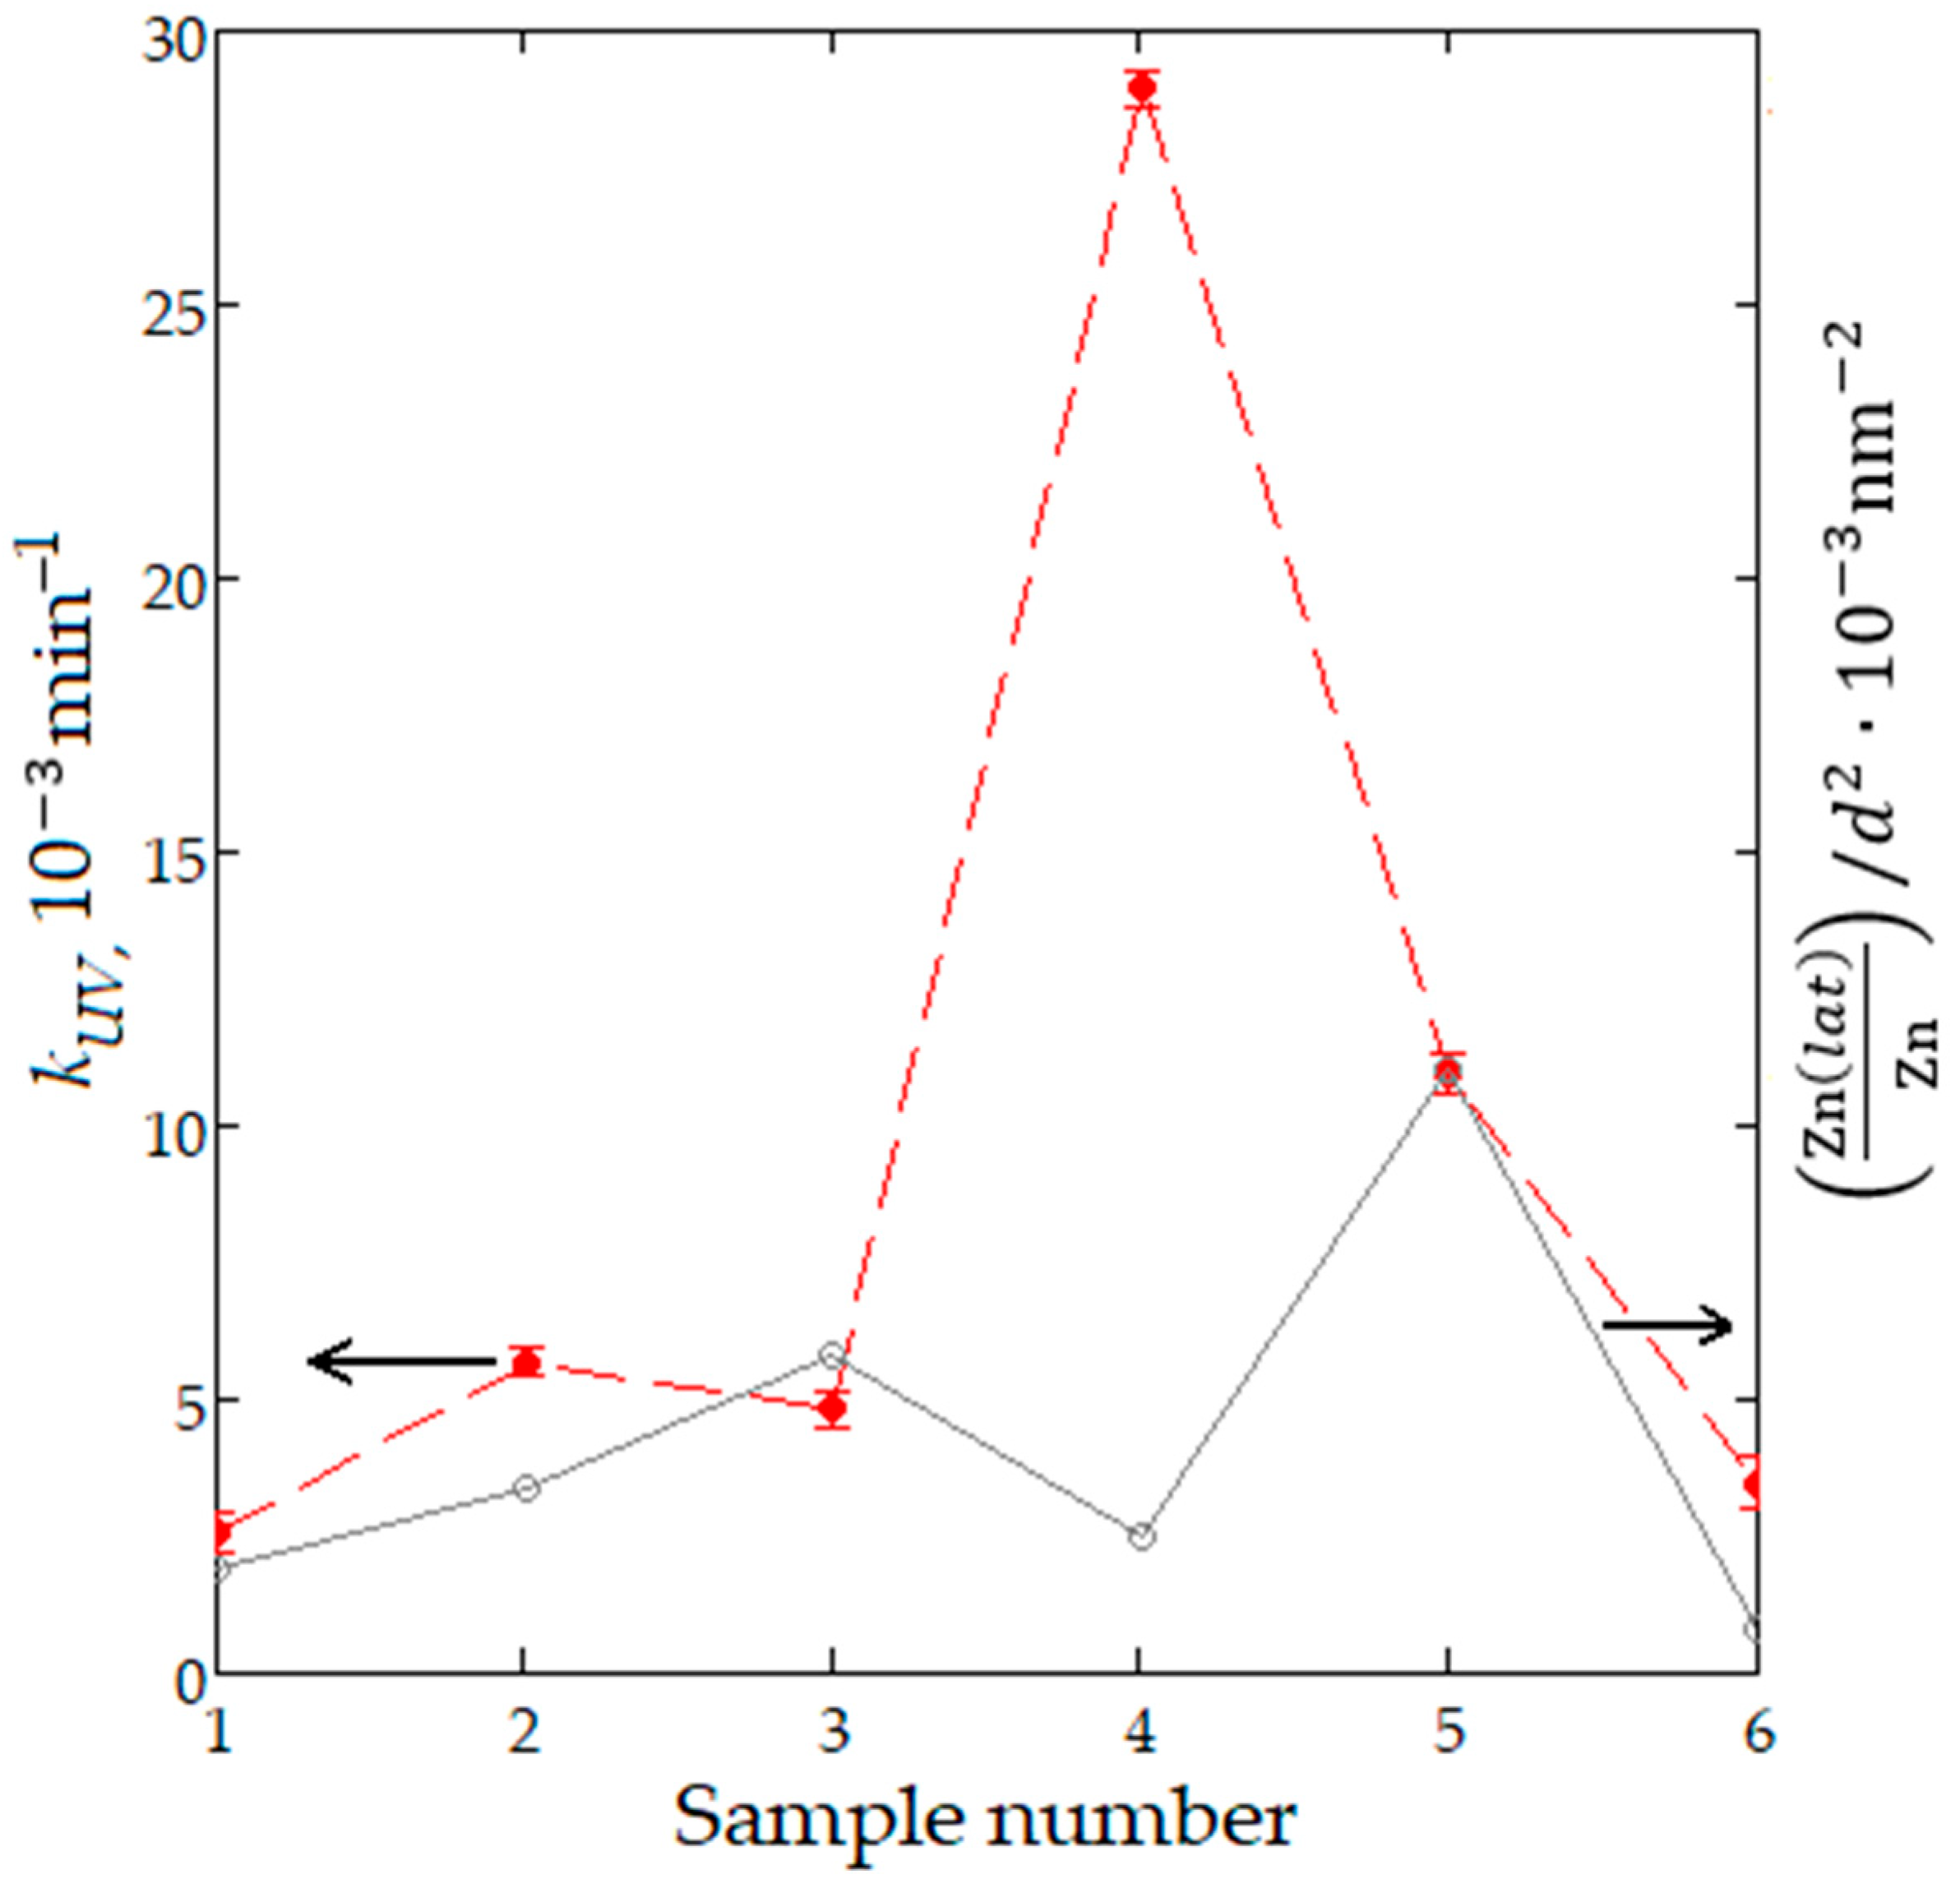
3.6. Photocatalytic Properties of Samples Under the Influence of Ultraviolet and Visible Radiation

The study of photocatalytic degradation of toxic dye (methyl orange) using nanostructured ZnO:Al:Cu films demonstrates high efficiency of a number of samples, both under the action of ultraviolet radiation and under the action of visible light (Figure 9). The highest efficiency is demonstrated by the ZnO:Al(4 at.%):Cu(2 at.%) sample, which provides 98.6% (Figure 10a) and 92.3% (Figure 10b) degradation of the toxic dye in 120 min, respectively.
The kinetic curves (Figure 10c,d) corresponding to the decomposition of methyl orange under the influence of ultraviolet and visible radiation are well described by the following equation:
C = C0·exp(−kt),
where k is the rate constant of photocatalytic decomposition and C0 is the initial concentration of methyl orange.
Thus, in all cases, kinetics corresponding to a pseudo-first-order reaction is observed [42]. In this regard, the value of the photocatalytic decomposition rate constant k was determined as an indicator of the exponential regression curve describing the data array. The second or higher order of reactions does not reliably describe the analyzed kinetic curves. In particular, when plotting them in the coordinates 1/C vs. t, no linear dependence is observed. In the analyzed case, a fractional reaction order with the exponent degree “n” in the range from one to two is possible [43]; however, for the overwhelming majority of samples, “n” is very close to one, based on which it seems appropriate to use pseudo-first order. Some difference in the reaction from “n” equal to one can be explained by the process of water photolysis, which occurs under the influence of ultraviolet light (the MO curve under UV in Figure 10c).
Table 1 presents the values of the constants of all samples for ultraviolet radiation (kUV) and visible light (kvis). The confidence intervals for the photocatalytic degradation coefficients were calculated using the standard error function and the t-distribution (for a significance level of 0.05 for a 95% confidence interval).
All samples except ZnO:Al(1 at.%):Cu(5 at.%) demonstrate kUV values that exceed the efficiency of unmodified ZnO, and for ZnO:Al(5 at.%):Cu(1 at.%) and ZnO:Al(4 at.%):Cu(2 at.%) films, the rate of photocatalytic decomposition process increases by ≈8.3 and 3.2 times, respectively. In turn, the nanostructured zinc oxide film modified with 1 at.% aluminum and 5 at.% copper demonstrates a decrease in kUV by ≈1.3 compared to pure ZnO. This fact, apparently, has two main explanations. First, the Zn(lat)/Zn ratio for this sample is 0.606 (compared to 0.619 for unmodified zinc oxide), indicating a deterioration in crystallinity, since only a small fraction of zinc atoms is in the wurtzite phase. Since the photocatalytic activity of ZnO and the proportion of zinc atoms in the crystalline phase on the surface have a direct relationship [44], its deterioration corresponds to a decrease in the kUV values. Second, ZnO:Al(1 at.%):Cu(5 at.%) films contain significantly more carbon (13.29 at.% vs. 4.40 at.%) which, as has been shown in a number of studies, can also degrade the photocatalytic activity [45]. The mechanism of photocatalytic activity of zinc oxide doped with copper or aluminum was considered in detail in the framework of papers [46,47] and in the case of our paper the mechanism is a generalization of those suggested in [46,47].
In order to explain the improvement of photocatalytic decomposition of methyl orange on nanostructured ZnO:Al:Cu films, the kUV values can be compared with the previously established parameter Z n l a t Z n / d 2 . This parameter shows a very strong positive correlation (rxy = 0.99) with the constant of photocatalytic decomposition of paracetamol on ZnO powders synthesized by different chemical methods [48]. Its physical meaning is that it relates the fraction of zinc atoms in the crystalline phase on the surface (determined on the basis of experimental XPS data) with the square of the average crystallite size (determined on the basis of experimental XRD data). Figure 11 demonstrates the kUV and Z n l a t Z n / d 2 values for the entire series of samples, where Sample 6 corresponds to unmodified zinc oxide. A positive correlation between the parameters under consideration is obvious for all nanostructured films, except for ZnO:Al(2 at.%):Cu(4 at.%) and ZnO:Al(4 at.%):Cu(2 at.%). In the first case, based on the parameter Z n l a t Z n / d 2 , a smaller increase in photocatalytic activity was expected, while in the second case, its significant decrease was expected, which should have been caused by a significant increase in the average size of coherent scattering regions to 13.3 nm (Table 1). Experimental data show significantly higher values of photocatalytic degradation rate constants than expected. This fact correlates well with the assumption about the existence in Samples 2 and 4, in addition to ZnO with a wurtzite-type crystal lattice, of other X-ray amorphous phases, such as Cu2O and possibly aluminum oxide. Also, a certain contribution to the photocatalytic activity of the samples is made by their nanostructure, which for Sample 2 is represented by quasi-spherical fractal aggregates and for Sample 4 by a combination of aggregates and branches of different sizes.
Improvement of photocatalytic decomposition of methyl orange under the action of ultraviolet radiation and visible light on the p-n heterojunction of ZnO/Cu2O was reported in [49]. The positive contribution of Al2O3 to the photocatalytic activity of ZnO in the decomposition of toxic dyes was noted in [50]; in particular, it was shown that kUV can be increased by five times. It is assumed that aluminum oxide allows effective separation of photogenerated charge carriers, which leads to an improvement in the photocatalytic activity of the material.
Nanostructured ZnO:Al:Cu films demonstrate high efficiency of photocatalytic decomposition of methyl orange under the action of visible light (Figure 10d). As in the case of UV radiation, the maximum values of kvis are characteristic of the ZnO:Al(4 at.%):Cu(2 at.%) sample. Pure zinc oxide does not have any noticeable efficiency of the photocatalysis process, the value of kvis → 0. For the sample co-doped with 3 at.% aluminum and 3 at.% copper, kvis is ≈1.2 times less than kUV, which allows us to talk about the creation of highly efficient photocatalysts of the visible range. A slight slowdown in the photocatalytic decomposition of methyl orange under the influence of visible radiation, observed in cases of Samples 1 and 3, may be associated with a difference in the kinetics of the reactions occurring from the pseudo-first order, for example, due to partial evaporation of water (the MO curve under visible light in Figure 10d) under the influence of thermal radiation from the light source. The mechanism of photocatalytic decomposition of methyl orange under the action of visible light is apparently unique for each type of sample, but three main components can be distinguished. First, co-doping of ZnO with copper and aluminum leads to a decrease in its band gap, which is consistent with a number of studies [26]. Second, the emergence of the X-ray amorphous phase of Cu2O leads to the formation of a p-n heterojunction of ZnO/Cu2O, which allows for the efficient separation of photogenerated charge carriers [51]. Third, the formation of the X-ray amorphous phase of Al2O3 also allows for the efficient separation of charge carriers, since aluminum atoms can act as electron capture traps [52].

4. Conclusions

The present work suggests a simple one-stage sol–gel method for synthesizing nanostructured ZnO films co-doped with copper and aluminum. Based on the experimental XRD data, a significant decrease in the average crystallite size (from 27.4 nm to 7.1 nm) with increasing aluminum concentration in the samples is established, which is characteristic of all films except ZnO:Al(4 at.%):Cu(2 at.%). The rearrangement of the film nanostructure at different concentrations of co-dopants is demonstrated. A transition from a hierarchical structure formed by branches of different sizes (characteristic of unmodified ZnO) to a structure including quasi-spherical fractal aggregates (ZnO:Al(2 at.%):Cu(4 at.%) and ZnO:Al(5 at.%):Cu(1 at.%) samples is established. In the case of a sample co-doped with 4 at.% Al and 2 at.% Cu, a combination of the two types of structures is shown, which can be explained by the difference in the atomic radii of copper, aluminum, and zinc. Using experimental XPS data, copper inclusion in the ZnO crystal lattice in the form of Cu+ cations is demonstrated. For samples with a copper concentration of 3–5 at. %, the existence of oxygen with a binding energy of ≈528.7 eV is established, which can be attributed to O2− anions surrounded by Cu+ and Zn2+ cations. Based on the results of studying the samples by FTIR and XPS, and taking into account the absence of other X-ray diffraction peaks, except for those corresponding to the wurtzite phase of ZnO, for the ZnO:Al(2 at.%):Cu(4 at.%) and ZnO:Al(4 at.%):Cu(2 at.%) samples, the existence of X-ray amorphous phases of Cu2O and Al2O3 is suggested.
It is shown that co-doping of zinc oxide in all cases except for the ZnO:Al(1 at.%):Cu(5 at.%) sample leads to a significant increase in the efficiency of photocatalytic decomposition of the toxic dye both under the action of ultraviolet radiation and visible light. Comparison of the photocatalytic decomposition constant with the parameter Z n l a t Z n / d 2 allows us to establish the key role of X-ray amorphous phases of copper and aluminum oxides in the growth of photocatalytic activity of the ZnO:Al(2 at.%):Cu(4 at.%) and ZnO:Al(4 at.%):Cu(2 at.%) samples. The obtained results are of considerable interest from the point of view of nanostructured engineering of zinc oxide for both photocatalytic applications and its other practical applications, including gas sensing. Further directions of research can be focused on two main tasks. First, it seems reasonable to select the ratio of co-dopants concentrations that provide the most effective decomposition of toxic dyes. Second, studies are needed that will allow us to reliably distinguish the contribution of the material’s nanostructure from other parameters, such as the average crystallite size, the proportion of zinc atoms in the crystalline phase on the surface, and the existence of X-ray amorphous phases of co-dopants.

Author Contributions

Conceptualization, I.A.P., A.A.K. and G.K.; formal analysis, I.A.P., G.K. and A.S.K.; investigation, N.D.Y., I.A.G., A.V.K. and A.S.K.; writing—original draft preparation, A.A.K.; writing—review and editing, N.D.Y., A.A.K., I.A.P. and A.S.K.; visualization, A.A.K. and I.A.G. All authors have read and agreed to the published version of the manuscript.

Funding

This study was supported by the Russian Science Foundation (grant no. 23-79-01280, https://rscf.ru/project/23-79-01280/ (accessed on 23 June 2025)).

Institutional Review Board Statement

Not applicable.

Informed Consent Statement

Not applicable.

Data Availability Statement

Data are contained within the article.

Acknowledgments

The XRD and XPS measurements were conducted using the equipment of the Research Park of St. Petersburg State University “Centre for X-ray Diffraction Studies” and “Centre for Physical methods of surface investigation”. G.K. is grateful to the Moldova State University for supporting his research.

Conflicts of Interest

The authors of this work declare that they have no conflicts of interest.

References

  1. Li, X.; Fu, L.; Karimi-Maleh, H.; Chen, F.; Zhao, S. Innovations in WO3 Gas Sensors: Nanostructure Engineering, Functionalization, and Future Perspectives. Heliyon 2024, 10, e27740. [Google Scholar] [CrossRef]
  2. Kandasamy, M.; Sahoo, S.; Nayak, S.K.; Chakraborty, B.; Rout, C.S. Recent Advances in Engineered Metal Oxide Nanostructures for Supercapacitor Applications: Experimental and Theoretical Aspects. J. Mater. Chem. A 2021, 9, 17643–17700. [Google Scholar] [CrossRef]
  3. Yang, F.; Yang, T.; Li, J.; Li, P.; Zhang, Q.; Lin, H.; Wu, L. Boosting the Electroreduction of CO2 to Liquid Products via Nanostructure Engineering of Cu2O Catalysts. J. Catal. 2024, 432, 115458. [Google Scholar] [CrossRef]
  4. Franco, M.A.; Conti, P.P.; Andre, R.S.; Correa, D.S. A Review on Chemiresistive ZnO Gas Sensors. Sens. Actuators Rep. 2022, 4, 100100. [Google Scholar] [CrossRef]
  5. Altaf, C.T.; Coskun, O.; Kumtepe, A.; Rostas, A.M.; Iatsunskyi, I.; Coy, E.; Erdem, E.; Sankir, M.; Sankir, N.D. Photo-Supercapacitors Based on Nanoscaled ZnO. Sci. Rep. 2022, 12, 11487. [Google Scholar] [CrossRef]
  6. Qin, L.; Mawignon, F.J.; Hussain, M.; Ange, N.K.; Lu, S.; Hafezi, M.; Dong, G. Economic Friendly ZnO-Based UV Sensors Using Hydrothermal Growth: A Review. Materials 2021, 14, 4083. [Google Scholar] [CrossRef]
  7. Ahmad, I.; Bousbih, R.; Mahal, A.; Khan, W.Q.; Aljohani, M.; Amin, M.A.; Jafar, N.N.A.; Jabir, M.S.; Majdi, H.; Alshomrany, A.S.; et al. Recent Progress in ZnO-Based Heterostructured Photocatalysts: A Review. Mater. Sci. Semicond. Process. 2024, 180, 108578. [Google Scholar]
  8. Lal, M.; Sharma, P.; Singh, L.; Ram, C. Photocatalytic Degradation of Hazardous Rhodamine B Dye Using Sol-Gel Mediated Ultrasonic Hydrothermal Synthesized of ZnO Nanoparticles. Results Eng. 2023, 17, 100890. [Google Scholar] [CrossRef]
  9. Zheng, A.L.T.; Abdullah, C.A.C.; Chung, E.L.T.; Andou, Y. Recent Progress in Visible Light-Doped ZnO Photocatalyst for Pollution Control. Int. J. Environ. Sci. Technol. 2023, 20, 5753–5772. [Google Scholar] [CrossRef]
  10. Sanakousar, F.M.; Vidyasagar, C.C.; Jiménez-Pérez, V.M.; Prakash, K. Recent Progress on Visible-Light-Driven Metal and Non-Metal Doped ZnO Nanostructures for Photocatalytic Degradation of Organic Pollutants. Mater. Sci. Semicond. Process. 2022, 140, 106390. [Google Scholar] [CrossRef]
  11. Zare, A.; Saadati, A.; Sheibani, S. Modification of a Z-Scheme ZnO-CuO Nanocomposite by Ag Loading as a Highly Efficient Visible Light Photocatalyst. Mater. Res. Bull. 2023, 158, 112048. [Google Scholar] [CrossRef]
  12. Jiang, Z.; Cheng, B.; Zhang, L.; Zhang, Z.; Bie, C. A Review on ZnO-Based S-Scheme Heterojunction Photocatalysts. Chin. J. Catal. 2023, 52, 32–49. [Google Scholar] [CrossRef]
  13. Noman, M.T.; Amor, N.; Petru, M.; Mahmood, A.; Kejzlar, P. Photocatalytic Behaviour of Zinc Oxide Nanostructures on Surface Activation of Polymeric Fibres. Polymers 2021, 13, 1227. [Google Scholar] [CrossRef] [PubMed]
  14. Shalahuddin Al Ja’farawy, M.; Kusumandari; Purwanto, A.; Widiyandari, H. Carbon Quantum Dots Supported Zinc Oxide (ZnO/CQDs) Efficient Photocatalyst for Organic Pollutant Degradation—A Systematic Review. Environ. Nanotechnol. Monit. Manag. 2022, 18, 100681. [Google Scholar] [CrossRef]
  15. Zhu, X.; Wang, J.; Yang, D.; Liu, J.; He, L.; Tang, M.; Feng, W.; Wu, X. Fabrication, Characterization and High Photocatalytic Activity of Ag–ZnO Heterojunctions under UV-Visible Light. RSC Adv. 2021, 11, 27257–27266. [Google Scholar] [CrossRef] [PubMed]
  16. Yao, C.; Lin, J.; Wu, L.; Li, L.; Xu, N.; Sun, J.; Wu, J. High-Visible-Light Photocatalytic Activity of ZnO–Au Nanocomposites Synthesized by a Controlled Hydrothermal Method. Phys. Status Solidi (A) 2021, 218, 2100150. [Google Scholar] [CrossRef]
  17. Singh, A.; Wan, F.; Yadav, K.; Salvi, A.; Thakur, P.; Thakur, A. Synergistic Effect of ZnO Nanoparticles with Cu2+ Doping on Antibacterial and Photocatalytic Activity. Inorg. Chem. Commun. 2023, 157, 111425. [Google Scholar] [CrossRef]
  18. Roguai, S.; Djelloul, A. Structural, Microstructural and Photocatalytic Degradation of Methylene Blue of Zinc Oxide and Fe-Doped ZnO Nanoparticles Prepared by Simple Coprecipitation Method. Solid. State Commun. 2021, 334–335, 114362. [Google Scholar] [CrossRef]
  19. Al Farsi, B.; Souier, T.M.; Al Marzouqi, F.; Al Maashani, M.; Bououdina, M.; Widatallah, H.M.; Al Abri, M. Structural and Optical Properties of Visible Active Photocatalytic Al Doped ZnO Nanostructured Thin Films Prepared by Dip Coating. Opt. Mater. 2021, 113, 110868. [Google Scholar] [CrossRef]
  20. Piras, A.; Olla, C.; Reekmans, G.; Kelchtermans, A.-S.; De Sloovere, D.; Elen, K.; Carbonaro, C.M.; Fusaro, L.; Adriaensens, P.; Hardy, A.; et al. Photocatalytic Performance of Undoped and Al-Doped ZnO Nanoparticles in the Degradation of Rhodamine B under UV-Visible Light:The Role of Defects and Morphology. Int. J. Mol. Sci. 2022, 23, 15459. [Google Scholar] [CrossRef]
  21. Al-Mamun, M.R.; Rokon, M.Z.I.; Rahim, M.A.; Hossain, M.I.; Islam, M.S.; Ali, M.R.; Bacchu, M.S.; Waizumi, H.; Komeda, T.; Khan, M.Z.H. Enhanced Photocatalytic Activity of Cu and Ni-Doped ZnO Nanostructures: A Comparative Study of Methyl Orange Dye Degradation in Aqueous Solution. Heliyon 2023, 9, e16506. [Google Scholar] [CrossRef] [PubMed]
  22. Waghchaure, R.H.; Adole, V.A.; Jagdale, B.S. Photocatalytic Degradation of Methylene Blue, Rhodamine B, Methyl Orange and Eriochrome Black T Dyes by Modified ZnO Nanocatalysts: A Concise Review. Inorg. Chem. Commun. 2022, 143, 109764. [Google Scholar] [CrossRef]
  23. Mohamed, K.M.; Benitto, J.J.; Vijaya, J.J.; Bououdina, M. Recent Advances in ZnO-Based Nanostructures for the Photocatalytic Degradation of Hazardous, Non-Biodegradable Medicines. Crystals 2023, 13, 329. [Google Scholar] [CrossRef]
  24. Dejam, L.; Kulesza, S.; Sabbaghzadeh, J.; Ghaderi, A.; Solaymani, S.; Țălu, Ș.; Bramowicz, M.; Amouamouha, M.; Shayegan, A.; hossein Sari, A. ZnO, Cu-Doped ZnO, Al-Doped ZnO and Cu-Al Doped ZnO Thin Films: Advanced Micro-Morphology, Crystalline Structures and Optical Properties. Results Phys. 2023, 44, 106209. [Google Scholar] [CrossRef]
  25. Ganesh, V. Synthesis of Multifunctional Cu and Al Codoped ZnO Nanoparticles towards Photosensor and Photocatalytic Applications. Opt. Mater. 2022, 132, 112834. [Google Scholar] [CrossRef]
  26. Saxena, G.; Salmani, I.A.; Khan, M.S.; Khan, M.S. Structural Co-Related Optical Properties of Al and Cu Co-Doped ZnO Nanoparticles. Nano-Struct. Nano-Objects 2023, 35, 100986. [Google Scholar] [CrossRef]
  27. Bu, I.Y.-Y. Effect of Cu Concentration on the Structural and Optoelectronic Properties of ZnO:Cu:Al Prepared by the Sol–Gel Deposition Method. Ceram. Int. 2015, 41, 4042–4049. [Google Scholar] [CrossRef]
  28. Filippov Ivan, A.; Yakushova Nadezhda, D.; Karmanov Andrey, A.; Gubich Ivan, A.; Pronin Igor, A. Hierarchical Self-Assembly of SiO2-SnO2 Nanoand Microstructures in Combined Sol-Gel Systems. St. Petersburg Polytech. Univ. J. Phys. Math. 2024, 76, 42–45. [Google Scholar]
  29. Greczynski, G.; Hultman, L. A Step-by-Step Guide to Perform X-Ray Photoelectron Spectroscopy. J. Appl. Phys. 2022, 132, 011101. [Google Scholar] [CrossRef]
  30. Li, Z.; Li, L.; Zhang, G.; Song, L.; Tu, Z.; Han, C. AZO Work Function Enhanced by Oxygen Plasma Immersion Ion Implantation. Vacuum 2023, 212, 112038. [Google Scholar] [CrossRef]
  31. Anaya-Zavaleta, J.C.; Ledezma-Pérez, A.S.; Gallardo-Vega, C.; Rodríguez-Hernández, J.; Alvarado-Canché, C.N.; García-Casillas, P.E.; de León, A.; Herrera-May, A.L. ZnO Nanoparticles by Hydrothermal Method: Synthesis and Characterization. Technologies 2025, 13, 18. [Google Scholar] [CrossRef]
  32. Moshnikov, V.A.; Maksimov, A.I.; Aleksandrova, O.A.; Pronin, I.A.; Karmanov, A.A.; Terukov, E.I.; Yakushova, N.D.; Averin, I.A.; Bobkov, A.A.; Permyakov, N.V. Nanolithographic Self-Assembly of Colloidal Nanoparticles. Tech. Phys. Lett. 2016, 42, 967–969. [Google Scholar] [CrossRef]
  33. Sukhov, I.V.; Filippov, I.A.; Pronin, I.A.; Sysoev, V.V.; Kondratev, V.M.; Komolov, A.S.; Lazneva, E.F.; Karmanov, A.A.; Yakushova, N.D.; Moshnikov, V.A.; et al. Sol–Gel Prepared ZnO: UV Irradiation Effect on Structure and Surface Properties. Mendeleev Commun. 2024, 34, 643–646. [Google Scholar] [CrossRef]
  34. Shahid, M.U.; Deen, K.M.; Ahmad, A.; Akram, M.A.; Aslam, M.; Akhtar, W. Formation of Al-Doped ZnO Thin Films on Glass by Sol–Gel Process and Characterization. Appl. Nanosci. 2016, 6, 235–241. [Google Scholar] [CrossRef]
  35. Patel, M.; Mishra, S.; Verma, R.; Shikha, D. Synthesis of ZnO and CuO Nanoparticles via Sol Gel Method and Its Characterization by Using Various Technique. Discov. Mater. 2022, 2, 1. [Google Scholar] [CrossRef]
  36. Al-Gaashani, R.; Radiman, S.; Daud, A.R.; Tabet, N.; Al-Douri, Y. XPS and Optical Studies of Different Morphologies of ZnO Nanostructures Prepared by Microwave Methods. Ceram. Int. 2013, 39, 2283–2292. [Google Scholar] [CrossRef]
  37. Gora, M.K.; Kumar, A.; Kumar, S.; Maheshwari, P.K.; Patidar, D.; Dolia, S.N.; Singhal, R.K. Electronic, Optical and Magnetic Properties of Cu-Doped ZnO, a Possible System for Eco-Friendly and Energy-Efficient Spintronic Applications. Environ. Sci. Pollut. Res. 2023, 30, 98632–98646. [Google Scholar] [CrossRef]
  38. Li, M.; Zanna, S.; Seyeux, A.; Wiame, F.; Marcus, P.; Światowska, J. Surface Modifications Induced by Pretreatments and Effects on The Chemical Structure of TCP Conversion Coating on Al-Cu-Li Alloy (AA2050). J. Electrochem. Soc. 2021, 168, 041504. [Google Scholar] [CrossRef]
  39. Li, X.; Kong, W.; Qin, X.; Qu, F.; Lu, L. Self-Powered Cathodic Photoelectrochemical Aptasensor Based on in Situ–Synthesized CuO-Cu2O Nanowire Array for Detecting Prostate-Specific Antigen. Microchim. Acta 2020, 187, 325. [Google Scholar] [CrossRef]
  40. Akter, N.; Ahmed, T.; Haque, I.; Hossain, M.K.; Ray, G.; Hossain, M.M.; Islam, M.S.; Shaikh, M.A.A.; Akhtar, U.S. XPS Valence Band Observable Light-Responsive System for Photocatalytic Acid Red114 Dye Decomposition Using a ZnO–Cu2O Heterojunction. Heliyon 2024, 10, e30802. [Google Scholar] [CrossRef]
  41. Pronin, I.A.; Plugin, I.A.; Kolosov, D.A.; Karmanov, A.A.; Yakushova, N.D.; Varezhnikov, A.S.; Komolov, A.S.; Lazneva, E.F.; Koroleva, A.V.; Moshnikov, V.A.; et al. Sol-Gel Derived ZnO Film as a Gas Sensor: Influence of UV Processing versus a Thermal Annealing. Sens. Actuators A Phys. 2024, 377, 115707. [Google Scholar] [CrossRef]
  42. Nguyen, V.N.; Tran, D.T.; Nguyen, M.T.; Le, T.T.T.; Ha, M.N.; Nguyen, M.V.; Pham, T.D. Enhanced Photocatalytic Degradation of Methyl Orange Using ZnO/Graphene Oxide Nanocomposites. Res. Chem. Intermed. 2018, 44, 3081–3095. [Google Scholar] [CrossRef]
  43. Rytwo, G.; Zelkind, A.L. Evaluation of kinetic pseudo-order in the photocatalytic degradation of ofloxacin. Catalysts 2021, 12, 24. [Google Scholar] [CrossRef]
  44. Xie, J.; Li, Y.; Zhao, W.; Bian, L.; Wei, Y. Simple Fabrication and Photocatalytic Activity of ZnO Particles with Different Morphologies. Powder Technol. 2011, 207, 140–144. [Google Scholar] [CrossRef]
  45. Zhang, X.; Qin, J.; Hao, R.; Wang, L.; Shen, X.; Yu, R.; Limpanart, S.; Ma, M.; Liu, R. Carbon-Doped ZnO Nanostructures: Facile Synthesis and Visible Light Photocatalytic Applications. J. Phys. Chem. C 2015, 119, 20544–20554. [Google Scholar] [CrossRef]
  46. Zhang, X.; Chen, Y.; Zhang, S.; Qiu, C. High Photocatalytic Performance of High Concentration Al-Doped ZnO Nanoparticles. Sep. Purif. Technol. 2017, 172, 236–241. [Google Scholar] [CrossRef]
  47. Chandekar, K.V.; Shkir, M.; Al-Shehri, B.M.; AlFaify, S.; Halor, R.G.; Khan, A.; Al-Namshah, K.S.; Hamdy, M.S. Visible Light Sensitive Cu Doped ZnO: Facile Synthesis, Characterization and High Photocatalytic Response. Mater. Charact. 2020, 165, 110387. [Google Scholar] [CrossRef]
  48. Pronin, I.A.; Filippov, I.A.; Komolov, A.S.; Dubov, E.A.; Karmanov, A.A.; Yakushova, N.D.; Korotcenkov, G. Photocatalytic Degradation of Paracetamol on ZnO Powders: Investigating the Effect Grain Size. Vacuum 2025, 238, 114340. [Google Scholar] [CrossRef]
  49. Nouasria, F.Z.; Selloum, D.; Henni, A.; Tingry, S.; Hrbac, J. Improvement of the Photocatalytic Performance of ZnO Thin Films in the UV and Sunlight Range by Cu Doping and Additional Coupling with Cu2O. Ceram. Int. 2022, 48, 13283–13294. [Google Scholar] [CrossRef]
  50. Nasr, M.; Viter, R.; Eid, C.; Habchi, R.; Miele, P.; Bechelany, M. Optical and Structural Properties of Al2O3 Doped ZnO Nanotubes Prepared by ALD and Their Photocatalytic Application. Surf. Coat. Technol. 2018, 343, 24–29. [Google Scholar] [CrossRef]
  51. Zhou, Q.; Yang, N.; Zhang, L.; Zhang, L.; Li, J.; Yang, X.; Peng, F.; Sun, Y. Structural Tailored ZnO@Cu2O Heterostructure-Decorated Mesh with Dual Functionalities for Oil/Water Separation and Photodegradation. J. Alloys Compd. 2022, 896, 162763. [Google Scholar] [CrossRef]
  52. Yadav, S.; Mittal, A.; Sharma, S.; Sharma, A.; Kumari, K.; Kumar, N. Highly Efficient Ag2O Loaded ZnO/Al2O3 Coupled Catalyst and Its Photocatalytic Application. Inorg. Chem. Commun. 2021, 130, 108738. [Google Scholar] [CrossRef]
Figure 1. A generalized scheme for the synthesis of nanostructured ZnO:Al:Cu films.
Technologies 13 00277 g001
Figure 2. X-ray diffraction patterns of nanostructured ZnO:Al:Cu films (Curves 1–5 correspond to the increase in Al concentration in the samples) and unmodified zinc oxide (Curve 6) (a) and an expanded view of the diffractogram showing the shifts of the (002) diffraction peak upon increase in Al concentration (b).
Technologies 13 00277 g002
Figure 3. SEM images of nanostructured ZnO:Al:Cu films (ae) and unmodified zinc oxide (f). Images (ae) are arranged in order of increasing Al concentration from 1 to 5 at.%.
Technologies 13 00277 g003
Figure 4. FTIR spectra of nanostructured ZnO:Al:Cu films (Curves 1–5 correspond to the increase in Al concentration in the samples) and unmodified zinc oxide (Curve 6).
Technologies 13 00277 g004
Figure 5. Survey XPS spectra of nanostructured ZnO:Al:Cu films (Curves 1–5 correspond to an increase in the Al concentration in the samples) and unmodified zinc oxide (Curve 6).
Technologies 13 00277 g005
Figure 6. Zn2p (a), C1s (b), XPS core level spectra of nanostructured ZnO:Al:Cu films (Curves 1–5 correspond to the increase in Al concentration in the samples) and unmodified zinc oxide (Curve 6).
Technologies 13 00277 g006
Figure 7. Cu2p XPS core level spectra of nanostructured ZnO:Al:Cu films (Curves 1–5 correspond to the increase in Al concentration in the samples) and unmodified zinc oxide (Curve 6).
Technologies 13 00277 g007
Figure 8. O1s XPS core level spectra of nanostructured ZnO:Al:Cu films (Curves 1–5 correspond to the increase in Al concentration in the samples) and unmodified zinc oxide (Curve 6) for samples 1 to 3 (a) and 4 to 6 (b).
Technologies 13 00277 g008
Figure 9. EDX spectra of a section of a nanostructured ZnO:Al(4 at.%):Cu(2 at.%) film containing a quasi-spherical fractal aggregate.
Technologies 13 00277 g009
Figure 10. Absorption spectra (a,b) of an aqueous solution of methyl orange and kinetic curves (c,d) of its photocatalytic decomposition under the influence of ultraviolet radiation (a,c) and visible light (b,d).
Technologies 13 00277 g010
Figure 11. Graph of the values [Zn(lat)/Zn]/d2 (gray line) and kUV (red line) for all sample sets.
Technologies 13 00277 g011
Table 1. ZnO:Al:Cu crystal structure and photocatalytic activity parameters of nanostructured ZnO:Al:Cu films.
Materiald, nmZn(lat) = O(lat)Zn(lat)/Zn Z n O l a t   +   O a d s kuv, 10−3 min−1kuv, 10−3 min−1
ZnO:Al(1 at.%):Cu(5 at.%)17.429.960.6061.3252.58 ± 0.361.52 ± 0.08
ZnO:Al(2 at.%):Cu(4 at.%)16.214.770.9120.4215.68 ± 0.271.33 ± 0.09
ZnO:Al(3 at.%):Cu(3 at.%)9.525.010.5411.3374.84 ± 0.344.47 ± 0.08
ZnO:Al(4 at.%):Cu(2 at.%)13.311.230.4630.57628.94 ± 0.3419.32 ± 0.21
ZnO:Al(5 at.%):Cu(1 at.%)7.117.230.5731.12010.99 ± 0.374.24 ± 0.09
ZnO27.433.930.6191.3463.47 ± 0.49-
Table 2. Interpretation of FTIR spectra of nanostructured ZnO:Al:Cu films.
Wavenumber, cm−1Interpretation
514Deformation vibrations of Zn-O in the crystal lattice, deformation vibrations of Al-O.
610Stretching symmetric vibrations of Si-Si
690Deformation vibrations of Cu-O-Zn in the crystal lattice
734Deformation vibrations C-O-H
820Twisting vibrations of Si2O
890C-C stretching vibrations, N-H out-of-plane vibrations
978Stretching symmetric vibrations of Si-OH
1108Asymmetric vibrations of bridging oxygen Si-O-Si, stretching symmetric vibrations C-O
1404–1656H-O-H deformation vibrations, N-H stretching symmetric vibrations
2360Atmospheric CO2
3100–3600Stretching symmetric vibrations of OH
Table 3. Atomic composition and binding energy of the Zn2p core level of nanostructured ZnO:Al:Cu films.
MaterialBEZn2p3/2, eVZn2p, at.%O1s, at.%C1s, at.%O(Z), a.u.O(I), a.u.O(II), a.u.O(III), a. u.
ZnO:Al(1 at.%):Cu(5 at.%)1021.4149.4237.2913.290.02830.77510.1966-
ZnO:Al(2 at.%):Cu(4 at.%)1021.7416.2071.8012.000.11440.09130.33080.4635
ZnO:Al(3 at.%):Cu(3 at.%)1021.3146.2334.5919.180.02260.70030.2771-
ZnO:Al(4 at.%):Cu(2 at.%)1021.9624.2760.3415.39-0.18610.51210.3018
ZnO:Al(5 at.%):Cu(1 at.%)1021.8930.0626.8343.11-0.64210.3579-
ZnO1021.6954.8540.754.40-0.83270.1673-
Disclaimer/Publisher’s Note: The statements, opinions and data contained in all publications are solely those of the individual author(s) and contributor(s) and not of MDPI and/or the editor(s). MDPI and/or the editor(s) disclaim responsibility for any injury to people or property resulting from any ideas, methods, instructions or products referred to in the content.

